[] \creditInvestigation, Formal analysis, Writing - original draft [orcid=0000-0002-2984-9951] \cormark[1] \creditConceptualization, Software, Investigation, Supervision, Writing - review and editing [orcid=0000-0002-8421-6604] \cormark[1] \creditSupervision, Writing - review and editing, Visualization, Resources, Funding Acquisition, Project Administration
1]organization=The School of Physical and Chemical Sciences, University of Canterbury, addressline=PB4800 Christchurch 8140, New Zealand
2]organization=The Dodd-Walls Centre for Photonic and Quantum Technologies, addressline=New Zealand
[1]Corresponding authors
[1]
Spectroscopy and Crystal-Field Analysis of Low -Symmetry Er3+ Centres in K2YF5 Microparticles
Abstract
K2YF5 crystals doped with lanthanide ions have a variety of possible optical applications. Owing to the low symmetry of the system, the crystal structure cannot be unambiguously determined by x-ray diffraction. However, electron-paramagnetic resonance studies have demonstrated that lanthanide ions substitute for yttrium in sites of Cs local symmetry. In this work, we use high-resolution absorption and laser spectroscopy to determine electronic energy levels for Er3+ ions in K2YF5 microparticles. A total of 39 crystal-field energy levels, distributed among 7 multiplets of the Er3+ ion, have been assigned. This optical data is used for crystal-field modelling of the electronic structure of Er3+ in K2YF5. Our model is fitted not only to the electronic energy levels, but also to the ground-state g-tensor. This magnetic-splitting data defines the axis system of the calculation, avoiding ambiguities associated with low-symmetry crystal-field fits.
keywords:
\seprare-earth \sepcrystal-field analysis \sepspectroscopy \sepErbium \sepK2YF51 Introduction
Lanthanide ion doped potassium yttrium pentafluoride crystals (K2YF5) are promising optically active media that have been investigated for a variety of applications, including phosphors, thermoluminescence dosimeters, laser crystals, and passive Q-switching [1, 2, 3, 4, 5]. An understanding of the electronic structure of lanthanide ions in this host requires a knowledge of the crystal structure. X-ray diffraction is unable to distinguish between two possible space groups, and . However, electron paramagnetic resonance (EPR) studies indicate that the structure is monoclinic, with space group [6, 7]. The unit cell dimensions are Å, Å, Å. Each Y3+ ion is surrounded by seven fluoride ions with Cs point group symmetry. The YF7 polyhedra form chains parallel to the c-axis. The distance between the intra-chain Y3+- Y3+ ions is around 3.7 Å, whereas the shortest inter-chain separation is ~5 Å. As with other fluoride hosts, K2YF5 has a relatively low Debye temperature and therefore band phonon cutoff frequency of around 480 cm-1 [8, 9].
EPR has been used to investigate the ground state magnetic splittings for Ce3+, Gd3+ [6], Er3+, and Yb3+ [7]. Optical spectroscopy has been performed, with varying degrees of depth and rigour, on K2YF5 bulk single crystals doped with Pr3+ [10, 11], Nd3+ [12, 13], Sm3+ [3], Eu3+ [14], Tb3+ [15, 9], Er3+ [16, 8, 17, 18] and Tm3+ [19, 20].
Magnetic-splitting data has been shown to be crucial for crystal-field calculations in low-symmetry systems [21, 22, 23, 24]. In those studies, directional information such as EPR-derived ground-state g-tensors and/or rotational Zeeman data were used to give a unique orientation for the axis system used in the calculations. In high symmetries, the crystal-field parameters may be uniquely determined once an axis system is chosen. For example, in O symmetry the four-fold axis may be chosen to be along , , and . In that case, the two (real) crystal-field parameters be unambiguously determined. In low symmetries it is no longer possible to unambiguously determine crystal-field parameters by fitting to electronic energy levels. In the case of C1 (i.e. no) symmetry, parameters fitted to only electronic energies may be rotated arbitrarily in three dimensions, changing both the phases and the magnitudes of the parameters [25]. For Cs symmetry, relevant for K2YF5, the axis may be chosen perpendicular to the mirror plane. However, any rotation about leaves the electronic energies invariant and such a rotation changes the phases of the complex parameters.
Karbowiak et al. [12] reported a comprehensive analysis of electronic energy levels of Nd3+ in K2YF5. Their crystal-field fit used Cs symmetry and the starting parameters were based on the superposition model. Unfortunately, there is no magnetic-splitting data available for that system, so the orientation of calculated magnetic moments can not be checked against experiment.
EPR data is available for Er3+-doped K2YF5 [7]. In this paper, we present detailed spectroscopic studies of K2YF5 microparticles doped with 2 mol% of Er3+, prepared by the solvothermal method. Powder X-ray diffraction (PXRD) and scanning electron microscopy (SEM) were used to obtain information about the crystallinity and morphology of these microcrystals. The 2 mol% doping was chosen to give a good signal in both absorption and emission. A very high concentration can quench luminescence due to cross-relaxation. A detailed energy-level scheme has been deduced from high-resolution absorption and laser excited fluorescence for samples nominally cooled to 10 K. This experimental data, supplemented by EPR data, is used to fit a crystal-field model using techniques that build upon our earlier work on C1 sites in Y2SiO5 [22, 23, 24].
2 Materials and Methods
2.1 Materials
Yttrium nitrate (Y(NO3)3, 99.90%) and erbium nitrate pentahydrate (Er(NO3)3 5H2O, 99.90%) obtained from Sigma-Aldrich (St. Louis, USA) were used as a rare earth ion source. Anhydrous potassium fluoride (KF, BDH laboratory, 98.00%) and potassium hydroxide (KOH, Sigma-Aldrich, 99.00%) were used as the fluoride source. All the chemicals were used as received. Milli-Q water, ethanol (analytical grade, 99.50%), and Oleic acid (analytical grade, 99.50%), were employed to wash and prepare the samples.
2.2 Synthesis of K2YF5:Er3+ microparticles
K2YF5 microparticles doped with two mol% Er3+ were synthesized via the solvothermal method [26, 27]. The appropriate amounts of KOH (35 mmol) were dissolved in 7.5 ml deionized water in a beaker. After that, 25 ml ethanol and 25 ml oleic acid were added. Then a 10 mL aqueous solution containing 80 mmol of KF was added to the above solution and stirred to make a uniform solution. Lastly, 10 ml of Y(NO3)3 (1.98 mmol) and Er(NO3)35H2O (0.02 mmol) aqueous solution was added to the above-mixed solution. After stirring for 30 minutes, the as-obtained milky solution was transferred into a 100 mL of Teflon-lined stainless-steel autoclave and then heated at 220∘C for 24 h. After that, the autoclave cooled naturally to room temperature, and the precipitate was collected through centrifugation (7000 rpm, 10 minutes), thoroughly washed with ethanol, and then dried at 80∘C for 12 h.
2.3 Characterisation and Spectroscopy
Powder X-ray diffraction patterns were collected on a RIGAKU 3 kW SmartLab X-ray diffractometer employing a CuK1 radiation source, =1.5406 Å. Scanning electron microscope (SEM) images were obtained with a JEOL 7000F scanning electron microscope operating at 15 kV.
The absorption measurements were carried out using an N2 purged Bruker Vertex 80 FTIR with a resolution of 0.075 cm-1. The powder was pressed into thin pellets using a pellet maker and then placed into a copper sample holder, which itself was in thermal contact with the cold finger of a closed cycle cryostat, for absorption measurements. In order to perform fluorescence spectroscopy, a pulsed N2 laser pumped PTI GL-302 dye laser was employed as the excitation source, providing wavelength tunability through the visible region. The detection system consisted of a Horiba iHR550 monochromator equipped with either a Hamatmatsu R2257P thermoelectrically cooled visible photomultiplier tube (PMT) or a thermoelectrically cooled Hamamatsu H10330C near-infrared PMT. For both absorption and fluorescence measurements a Janis CCS-150 closed-cycle cryostat cooled the sample to 10 K.
2.4 Crystal-Field Calculations
In our calculations, the 4f11 configuration of Er3+ is modelled by a parametrized Hamiltonian [28, 29, 30]:
| (1) |
is the free ion contribution, is the crystal-field contribution, and is the Zeeman interaction. The crystal-field contribution is expanded in terms of spherical tensors as:
| (2) |
The are crystal-field parameters and the are Racah spherical tensor operators acting within the 4fN configuration. In this Hamiltonian, is restricted to 2, 4, and 6. In Cs symmetry parameters with odd are zero, but the parameters with are complex. The Zeeman interaction may be written as:
| (3) |
where is the (externally applied) magnetic field, and are orbital and spin angular momentum operators and the g-value of the electron.
Fitting crystal-field parameters for low-symmetry systems is challenging. Our previous work on sites in Y2SiO5 [22, 23, 24] has shown that the addition of magnetic-splitting data is essential to fix the orientation of the axis system. For this work, we chose the , and axes to be along the , , and crystallographic axes. The mirror plane is, therefore, perpendicular to the axis.
3 Results and Discussion
3.1 Phase, Morphology, and Composition
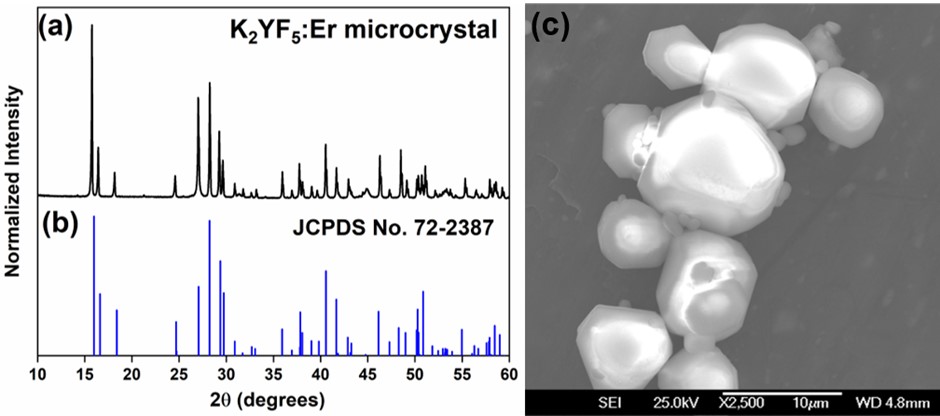
Phase identification of the K2YF5: 2mol%Er3+ microparticles was performed using the PXRD technique. As shown in Figures 1 (a) and (b), the PXRD patterns of the as synthesised K2YF5:Er microparticles are plotted against the orthorhombic K2YF5 crystal data (JCPDS No. 72-2387) for comparison [26, 27]. The diffraction peaks of the samples are in good agreement with the reference data for orthorhombic K2YF5 (space group Pna21). To further investigate the morphology of the K2YF5:Er microparticles, scanning electron microscopy (SEM) was used. Figure 1 (c) shows that the K2YF5:Er sample is a mixture of hexagonal and octagonal microcrystals with a particle size distribution ranging from 4 µm to 14 µm.
3.2 Optical Absorption and Fluorescence Spectra
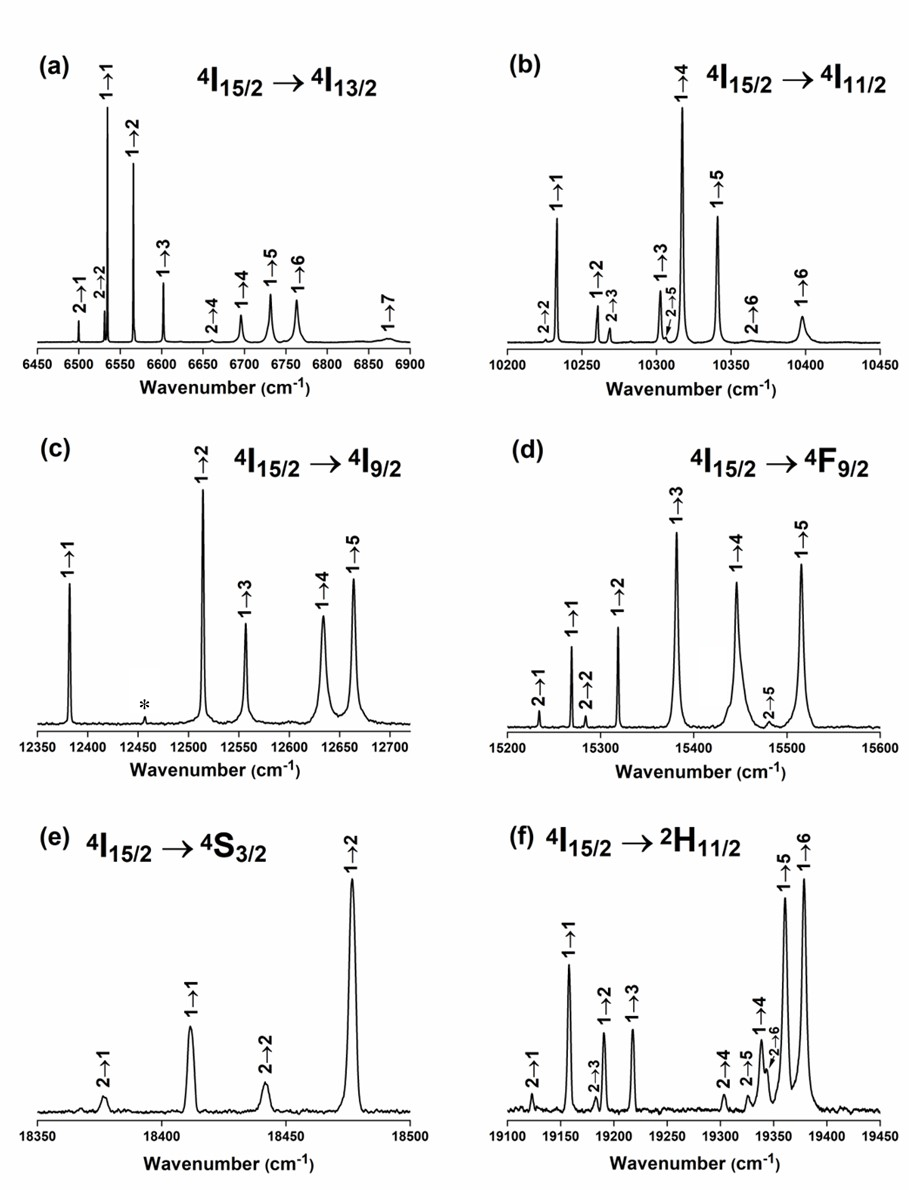
Figure 2 shows absorption spectra of the pelletized K2YF5:2%Er3+ microparticle ensembles for transitions between the 4I15/2 ground multiplet and the 4I13/2, 4I11/2, 4I9/2, 4F9/2, 4S3/2 and 2H11/2 multiplets with samples cooled to a nominal temperature of 10 K. Numerical labels are used to indicate assignments to the intial and final states within the ground and excited multiplets. Due to the approximately 10 micron diameter of these particles, the particle size distribution does not play a substantial role in determining the measured inhomogeneous linewidths which are not significantly greater than those observed in bulk crystals [18]. One of the notable features of the spectra is the observation of transitions from thermally populated excited states within the ground multiplet. This occurs due to the difficulty in getting good thermal contact across the entire pellet with the copper sample mount. Due to the fact that even within a pelletized sample, there are limited contact points from particle to particle, the only way to fully overcome this would be to immerse the entire pellet in liquid helium. However the observation of additional transitions is, in fact, an advantage here since the purpose is to assign energy levels. All of the experimentally assigned energy levels are given in Table 1.
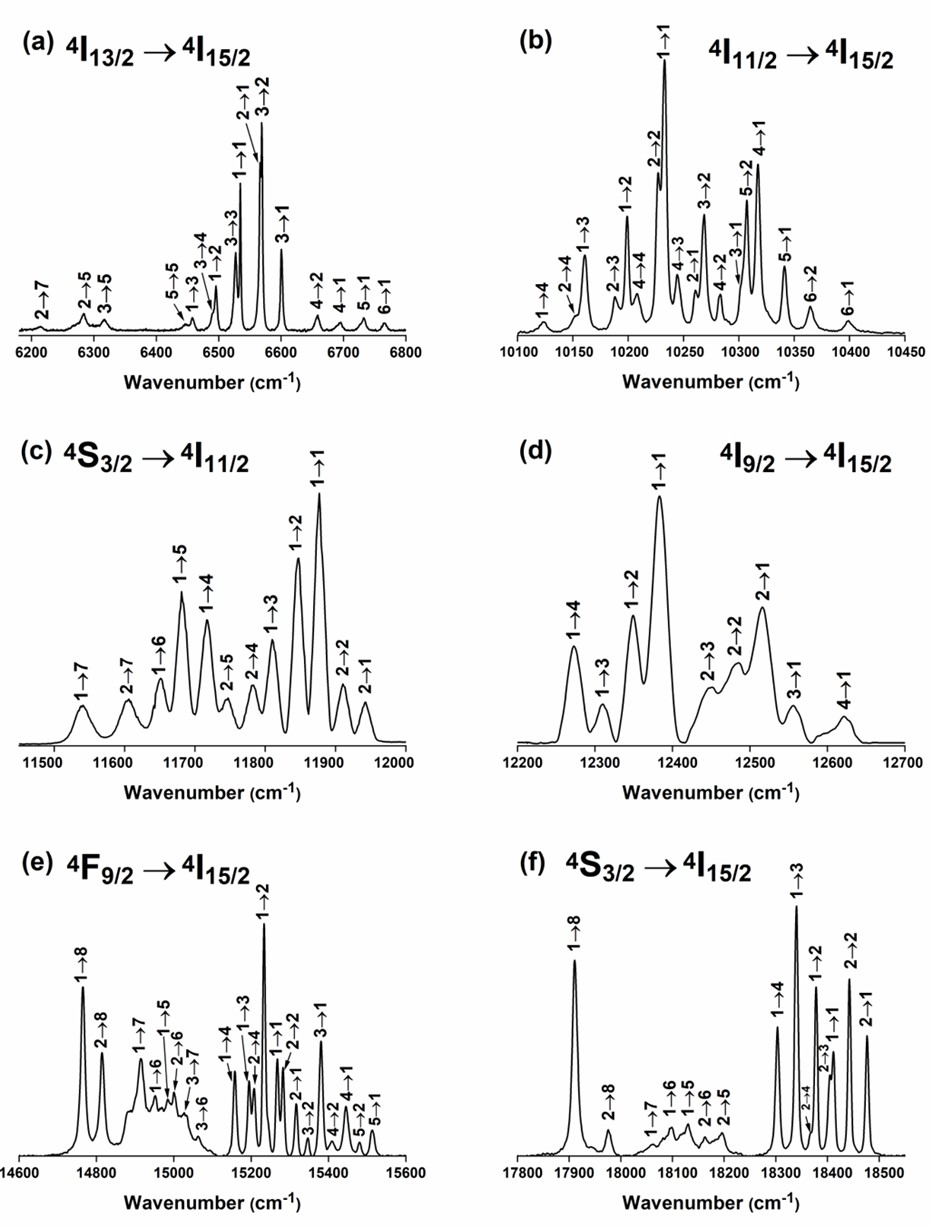
Fluorescence spectra were recorded throughout the visible and near infrared regions with the microparticle sample excited at 19157 cm-1, corresponding to the 4I15/2Z1 2H11/2F1 transition. The nominal base temperature for the sample was recorded as 10 K. Figure 3 shows the down-shifted fluorescence of the 4I13/2, 4I11/2, 4I9/2, 4F9/2, and 4S3/2 multiplets to the ground 4I15/2 multiplet. As is expected for Er3+, transitions emanating from the 4I13/2 multiplet are amongst the strongest (and magnetic dipole allowed) whilst those from the 4I9/2 muiltiplet are weak due to the small energy gap to the 4I11/2 multiplet which allows for significant non-radiative depopulation. As with the absorption spectra, numerous transitions from thermally populated excited state levels can be observed for transitions from any given multiplet. The complete list of assigned crystal-field levels is presented in Table 1.
3.3 Crystal-Field Analysis
The parmeters in our crystal-field model are fitted to both the electronic energy levels (Table 1) and the ground-state g-tensor (Table 2). In our calculation, the , , and axes correspond to the crystallographic , and axes. As discussed above, the Y3+ sites that the Er3+ ions substitute into have Cs symmetry, with the mirror plane being the – plane [6]. The sites have several distinct orientations, related by rotations or reflections, but there are only two sets of magnetically-inequivalent sites [6, 7], with different g-tensors, as indicated in Table 2. The crystal-field Hamiltonian for the two sets of sites are related by a complex conjugtion of the crystal-field parameters.
The fitting approach followed Ref. [22]. Calculations of zero-field electronic energy levels were carried out in parallel to calculations for 12 orientations of the magnetic field. The weighted used in the minimization process consisted of squares of differences between the calculated and experimental electronic energies energies and squares of differences between the ground-state magnetic splittings and splittings calculated from the g-tensor. The magnetic splittings were weighted more heavily than the electronic energies. A basin-hopping algorithm was used to search the parameter space. We allowed the Coulomb, , spin-orbit, , and crystal-field, , parameters to vary freely. Other parameters were fixed at the fitted values reported by Carnall et al. for Er3+ in LaF3 [28]. An intemediate-coupled basis set was used, trucated at 30,000 cm-1 (15 multiplets), to speed up the calculation.
Table 3 gives fitted parameters for Nd3+ in K2YF5 [12] and for two different fits for Er3+ in K2YF5. Fit A was obtained by using the Nd3+ parameters as a starting point. This gave a good fit but we also searched for a global minimum by trying other starting points. The best fit we obtained is presented as Fit B. Uncertainties for this fit were estimated using the Monte-Carlo approach described in Ref. [22] and the predicted energy levels for these parameters are given in Table 1. For both fits the calculated g-tensor agrees with the experimental data (Table 2) to the accuracy of the measurements. For Fit A, the signs of , , and are the same as for Nd3+. Note that since the Nd3+ fit did not include any magnetic splitting data, the overall phase of the complex parameters is undetermined. Fit B is quite different, with opposite signs from the Nd3+ fit for and .
Karbowiak et al. [12] used the superposition model to investigate the relationship between the Nd3+ crystal-field parameters and the geometry of the site. In the superposition-model calculations, they assumed the space group and therefore C1 site symmetry, whereas the EPR results of Refs. [6, 7] are consistent with the space group and Cs site symmetry. However, the geometry they determined had approximate Cs symmetry and that symmetry was used in their crystal-field calculation. Their calculation (Table 5 of [12]) predicts a positive , a positive , and a negative . Their Nd3+ fit gives a negative , a positive , and a negative . However, as they point out, the parameters are expected to be more sensitive to long-range electrostatic contributions than the and parameters. Our best fit (Fit B) has opposite signs to the superposition-model prediction for all three of , , and , whereas our Fit A, like the Nd3+ fit, is in agreement for , and . Our energy-level data set is relatively small, so it is possible that the inclusion of more energy-level or magnetic-splitting data would result in a global minimum in better agreement with the superposition model.
| Multiplet | State | Measured | Fit |
| 4I15/2 | Z1 | 0 | |
| Z2 | 35 | 41 | |
| Z3 | 74 | 77 | |
| Z4 | 111 | 111 | |
| Z5 | 283 | 279 | |
| Z6 | 314 | 314 | |
| Z7 | 349 | 357 | |
| Z8 | 502 | 489 | |
| 4I13/2 | Y1 | 6534 | 6539 |
| Y2 | 6566 | 6568 | |
| Y3 | 6601 | 6602 | |
| Y4 | 6695 | 6697 | |
| Y5 | 6731 | 6739 | |
| Y6 | 6763 | 6761 | |
| Y7 | 6873 | 6873 | |
| 4I11/2 | A1 | 10233 | 10222 |
| A2 | 10260 | 10250 | |
| A3 | 10302 | 10297 | |
| A4 | 10317 | 10316 | |
| A5 | 10340 | 10341 | |
| A6 | 10397 | 10407 | |
| 4I9/2 | B1 | 12382 | 12380 |
| B2 | 12514 | 12506 | |
| B3 | 12556 | 12559 | |
| B4 | 12633 | 12626 | |
| B5 | 12664 | 12677 | |
| 4I9/2 | D1 | 15268 | 15272 |
| D2 | 15318 | 15313 | |
| D3 | 15381 | 15377 | |
| D4 | 15445 | 15446 | |
| D5 | 15515 | 15522 | |
| 4S3/2 | E1 | 18411 | 18403 |
| E2 | 18476 | 18476 | |
| 2H11/2 | F1 | 19157 | 19166 |
| F2 | 19190 | 19199 | |
| F3 | 19217 | 19213 | |
| F4 | 19338 | 19333 | |
| F5 | 19360 | 19363 | |
| F6 | 19378 | 19375 |
| Parameter | Nd3+ [12] | Er3+ Fit A | Er3+ Fit B | Uncertainty |
4 Conclusions
We have presented detailed optical spectroscopy of Er3+ in K2YF5 microcrystals and deduced energy levels up to 20,000 cm-1. The optical data has been combined with EPR data for the magnetic splitting of the ground state to obtain a crystal-field fit with a known axis orientation. Crystal-field modelling provides a powerful tool to understand the electronic structure of lanthanide ions in crystal hosts and hence to optimise applications. We have shown that in low-symmetry hosts the addition of magnetic measurements provides crucial information for such modelling.
References
- [1] HW Kui, D Lo, YC Tsang, NM Khaidukov, and VN Makhov. Thermoluminescence properties of double potassium yttrium fluorides singly doped with Ce3+, Tb3+, Dy3+ and Tm3+ in response to and irradiation. Journal of Luminescence, 117(1):29–38, 2006.
- [2] Luiz Oliveira de Faria, D Lo, HW Kui, NM Khaidukov, and Maria do Socorro Nogueira. Thermoluminescence response of K2YF5: Tb3+ crystals to photon radiation fields. Radiation Protection Dosimetry, 112(3):435–438, 2004.
- [3] NM Khaidukov, Vu Xuan Quang, Ung Thi Dieu Thuy, Luong Duy Thanh, Vu Phi Tuyen, Nguyen Xuan Ca, and Phan Van Do. Study on optical properties and upconversion luminescence of K2YF5: Sm3+ single crystals. Journal of Luminescence, 237:118201, 2021.
- [4] X Wang, G De, and Y Liu. Synthesis of orthorhombic K2YF5:Yb3+, Er3+/Tm3+ nanocrystals and highly efficient multicolor up-conversion luminescence. Materials Research Bulletin, 110:181–189, 2019.
- [5] P.A. Loiko, E.V. Vilejshikova, N.M. Khaidukov, M.N. Brekhovskikh, X. Mateos, M. Aguiló, and K.V. Yumashev. Judd–Ofelt modeling, stimulated-emission cross-sections and non-radiative relaxation in Er3+:K2YF5 crystals. Journal of Luminescence, 180:103–110, December 2016.
- [6] F Lonck, D Zverev, H Vrielinck, NM Khaidukov, and F Callens. K2YF5 crystal structure determined by using rare-earth ions as paramagnetic probes. Physical Review B, 75(14):144427, 2007.
- [7] DG Zverev, H Vrielinck, E Goovaerts, and F Callens. Electron paramagnetic resonance study of rare-earth related centres in K2YF5: Tb3+ thermoluminescence phosphors. Optical Materials, 33(6):865–871, 2011.
- [8] D Wang, M Yin, S Xia, VN Makhov, NM Khaidukov, and JC Krupa. Upconversion fluorescence of Er3+ trace impurity ions and Raman study in K2YF5: 0.1 mol% Tm3+ single crystal. Journal of Alloys and Compounds, 368(1-2):337–341, 2004.
- [9] VP Tuyen, VX Quang, NM Khaidukov, LD Thanh, NX Ca, N Van Hao, N Van Nghia, and P Van Do. K2YF5:Tb3+ single crystal: An in-depth study of spectroscopic properties, energy transfer and quantum cutting. Optical Materials, 106:109939, 2020.
- [10] M Yin, JC Krupa, E Antic-Fidancev, VN Makhov, and NM Khaidukov. Excitation spectroscopy of K2YF5: Pr3+ crystals. Journal of Luminescence, 101(1-2):79–85, 2003.
- [11] N Martin, R Mahiou, P Boutinaud, and JC Cousseins. A spectroscopic study of K2YF5:Pr3+. Journal of Alloys and Compounds, 323:303–307, 2001.
- [12] M Karbowiak, P Gnutek, and C Rudowicz. Energy levels and crystal field parameters for Nd3+ ions in BaY2F8, LiKYF5, and K2YF5 single crystals. Spectrochimica Acta Part A: Molecular and Biomolecular Spectroscopy, 87:46–60, 2012.
- [13] M Yin, Y Li, N Dong, VN Makhov, NM Khaidukov, and JC Krupa. Spectroscopic studies and crystal field calculation for Nd3+ in single crystal K2YF5. Journal of Alloys and Compounds, 353(1-2):95–101, 2003.
- [14] KH Jang, ES Kim, L Shi, NM Khaidukov, and HJ Seo. Luminescence properties of Eu3+ ions in K2YF5 crystals. Optical Materials, 31(12):1819–1821, 2009.
- [15] P Boutinaud, R Mahiou, and JC Cousseins. Effect of one-dimensional structure on Tb3+ 5D3-5D4 cross-relaxation in K2YF5. Journal of Luminescence, 72:318–320, 1997.
- [16] PA Loiko, NM Khaidukov, J Méndez-Ramos, EV Vilejshikova, NA Skoptsov, and KV Yumashev. Up-and down-conversion emissions from Er3+ doped K2YF5 and K2YbF5 crystals. Journal of Luminescence, 170:1–7, 2016.
- [17] RE Peale, H Weidner, FG Anderson, and NM Khaidukov. Spectroscopy of Er3+ in K2YF5. Advanced Solid State Lasers, 10:462, 1997.
- [18] T Dean. Upconversion processes in Er3+ doped K2YF5. M.Sc. Thesis, University of Canterbury, 1998.
- [19] D Wang, Y Guo, Q Wang, Z Chang, J Liu, and J Luo. Judd–Ofelt analysis of spectroscopic properties of Tm3+ ions in K2YF5 crystal. Journal of Alloys and Compounds, 474(1-2):23–25, 2009.
- [20] Y Li, M Yin, N Dong, VN Makhov, NM Khaidukov, and JC Krupa. Spectra analysis of Tm3+ in K2YF5. Journal of Physics and Chemistry of Solids, 65(6):1059–1063, 2004.
- [21] SP Horvath, JPR Wells, MF Reid, M Honda, and M Yamaga. Electron paramgnetic resonance enhanced crystal-field analysis for low point group symmetry systems: C2v sites in Sm3+:CaF2/SrF2. Journal of Physics: Condensed Matter Physics, 31:015501, 2019.
- [22] SP Horvath, JV Rakonjac, YH Chen, JJ Longdell, P Goldner, JPR Wells, and MF Reid. Extending phenomenological crystal-field methods to C1 point group symmetry: characterization of the optically excited hyperfine structure of 165Er3+:Y2SiO5. Physical Review Letters, 123:057401, 2019.
- [23] NL Jobbitt, SJ Patchett, Y Alizadeh, MF Reid, JPR Wells, SP Horvath, JJ Longdell, A Ferrier, and P Goldner. Transferability of crystal-field parameters for rare-earth ions in Y2SiO5 test by Zeeman spectroscopy. Physics of the Solid State, 61:780, 2019.
- [24] NL Jobbitt, JPR Wells, MF Reid, SP Horvath, P Goldner, and A Ferrier. Prediction of the optical polarization and high field hyperfine structure via a parametrized crystal-field model for the low symmetry centers in Er3+ doped Y2SiO5. Physical Review B, 104:155121, 2021.
- [25] G. W. Burdick and M. F. Reid. Crystal field parametrizations for low symmetry systems. Mol. Phys., 102:1141–1147, 2004.
- [26] X Bian, Q Shi, L Wang, Y Tian, B Xu, ZK Mamytbekov, P Huang, et al. Near-infrared luminescence and energy transfer mechanism in K2YF5:Nd3+,Yb3+. Materials Research Bulletin, 110:102–106, 2019.
- [27] M Ding, D Chen, Z Wan, Y Zhou, J Zhong, J Xi, and Z Ji. Hydrothermal synthesis of novel K2YbF5: Er3+/Y3+ microcrystals with tunable red–green upconversion luminescence. Journal of Materials Science, 50:6779–6785, 2015.
- [28] W T Carnall, G L Goodman, K Rajnak, and RS Rana. A systematic analysis of the spectra of the lanthanides doped into single crystal LaF3. The Journal of Chemical Physics, 90(7):3443–3457, 1989.
- [29] Guokui Liu. Electronic Energy Level Structure. In G Liu and B Jacquier, editors, Spectroscopic Properties of Rare Earths in Optical Materials. Springer Science & Business Media, 2006.
- [30] MF Reid. Theory of rare-earth electronic structure and spectroscopy. In Handbook on the Physics and Chemistry of Rare Earths, volume 50, pages 47–64. Elsevier, 2016.
- [31] GH Dieke. Spectra and Energy Levels of Rare-Earth Ions in Crystals. Interscience Publishers, 1968.