Cluster dynamical mean field study of intra-unit-cell charge nematicity in hole-doped cuprates
Abstract
Recent scanning-tunneling microscopy on hole-doped Bi2Sr2CaCu2O8, one of the materials of the cuprate family, finds a long-range ordered spontaneous splitting of the energy levels of oxygen orbitals inside the CuO2 unit cells [S. Wang et al., Nat. Mat. 23, 492-498 (2024)]. This spontaneous intra-unit-cell orbital ordering, also known as electronic nematicity, breaks symmetry and is thought to arise from the Coulomb interaction (denoted by ) between oxygen and electrons. In this work, we study the spontaneous emergence of electronic nematicity within the three-band Hubbard (aka the Emery-VSA model), using cluster dynamical mean field theory. This method incorporates short-range electronic correlations and gives us access to the density of states, a quantity that is directly probed in experiments. We argue that there is a delicate competition between and (the latter being the Coulomb interaction between copper and oxygen electrons) that must be taken into account in order to find a Zhang-Rice singlet band well-resolved from the upper Hubbard band, and a splitting of the charge-transfer band (one of the signatures of charge nematicity) by roughly 50 meV, as observed recently.
I Introduction
One of the most enigmatic phases of hole-doped cuprates is charge nematicity Fradkin et al. (2015). This long-ranged charge order has been investigated quite frequently in the past two decades Nakata et al. (2021); Auvray et al. (2019); Mangin-Thro et al. (2017); Achkar et al. (2016); Cyr-Choinière et al. (2015); Xie et al. (2022); Wu et al. (2018, 2020); Murayama et al. (2019); Daou et al. (2010); Mook et al. (2008); Fauqué et al. (2006); Li et al. (2011, 2008); Fujita et al. (2014a); Zhao et al. (2017); Sato et al. (2017). It manifests itself as the spontaneous breaking, by the electronic structure, of the four-fold rotational symmetry of the CuO2 unit cell Daou et al. (2010) common to all cuprates.
Even after numerous experimental studies in the past 15 years, a microscopic mechanism has been experimentally established only recently Wang et al. (2024): using sublattice-resolved spectroscopic imaging scanning tunneling microscopy (STM) on Bi2Sr2CaCu2O8+δ Wang et al. (2024), a splitting in the charge-transfer energy (CTE) MJ et al. (2010); Mesaros et al. (2011); Fujita et al. (2014b) of and oxygen orbitals within the CuO2 unit-cell has been measured, which is a direct evidence of intra-unit-cell (IUC) charge nematicity in hole-doped cuprates. Several theoretical works Kivelson et al. (2004); Fischer and Kim (2011); Bulut et al. (2013); Maier and Scalapino (2014); Fischer et al. (2014); Tsuchiizu et al. (2018); Chiciak et al. (2018); Yamase (2021); Zegrodnik et al. (2020) studied the problem using the three-band Emery-VSA (Varma-Schmitt-Rink-Abrahams) model Emery (1987); Varma et al. (1987). Strong coupling approaches Kivelson et al. (2004) and self-consistent mean-field theory (within the Hartree approximation only) Fischer and Kim (2011) have shown how such a long-range orbital ordering can arise from the Coulomb repulsion between electrons located on the two different oxygen orbitals ( and ) of that model. The Emery model with interaction has also been studied with weak-coupling perturbation theory Bulut et al. (2013); Maier and Scalapino (2014) and with a strong-coupling perturbation expansion to look for charge nematic fluctuations Fischer et al. (2014). It has also been claimed that nematicity can arise even when Tsuchiizu et al. (2018); Chiciak et al. (2018); Yamase (2021); Zegrodnik et al. (2020).
So far, however, the interplay of with other Coulomb interaction terms, such as , the nearest-neighbor interaction between Cu and O electrons, and , the O on-site interaction, has not been investigated. Our contribution is twofold. First, we show that the competition between and must be considered in order to establish small IUC nematicity close to half-filling, as observed in recent STM experiment Wang et al. (2024). Second, we show that the calculation of partial density of states (DOS) for the Cu and O orbitals in the interacting model is necessary, not only to make contact with the experiment Wang et al. (2024), but also to reject some values of the interaction parameter set {, , , } that give incorrect DOS, despite finding the same charge nematicity.
Since cuprates are in an intermediate coupling regime where neither band structure nor interactions dominate, we need a method that is valid in this difficult case where the DOS must exhibit a charge-transfer band, a Zhang-Rice singlet band and an upper Hubbard band. Cluster dynamical mean field theory (CDMFT) Kotliar et al. (2001); Maier et al. (2005); Kotliar et al. (2006); Tremblay et al. (2006); Sénéchal (2012); Dionne et al. (2023) satisfies these requirements. We analyze the same three-band Emery-VSA model as in previous works Kivelson et al. (2004); Fischer and Kim (2011); Bulut et al. (2013); Fischer et al. (2014); Maier and Scalapino (2014); Tsuchiizu et al. (2018); Chiciak et al. (2018); Yamase (2021).
We find that the system develops IUC charge nematic order near half-filling when is large enough. However, we also find that pushes the onset of the nematic transition at large doping for large-enough . For small , on the other hand, the Zhang-Rice singlet band (ZRSB) Mai et al. (2021); Unger and Fulde (1993); Chen et al. (2013), one of the characteristic features of hole-doped cuprates (with mixed Cu-O character), hybridizes with the upper Hubbard band (UHB) of Cu, contrary to observations. We thus argue that the calculation of the DOS is crucial to determine the optimal value of and also of other parameters, such as the on-site oxygen repulsion . We end with a comparison of our CDMFT results with those obtained from static mean-field theory (MFT) within both the Hartree and Hartree-Fock approximations. This will clearly illustrate that similar charge nematicity with these two methods give drastically different DOS, allowing us to illustrate the importance of using CDMFT.
II Model and order parameter
II.1 Model Hamiltonian
The noninteracting part of the Emery model which describes hopping of electrons in the CuO2 plane Fischer and Kim (2011) is expressed as follows in real space:
| (1) |
where is Cu-O hopping integral and, and are O-O nearest-neighbor and next-nearest-neighbor hopping integrals in the CuO2 unit cell, respectively. Here, creates an electron with spin in the copper orbital at site and creates an electron with spin on the oxygen orbital at the site for , with pointing to neighboring oxygen sites. The Cu atoms at sites form a square lattice with unit vectors and , lattice spacing unity, and total number of lattice sites . The chemical potential and the bare charge-transfer energy control the total and relative electron densities of Cu and O, whose number operators are defined as and , respectively.
The interaction part of the Emery model includes on-site interactions with strengths and on Cu and O orbitals respectively, as well as extended interactions, (between nearest neighbors Cu and O) and (between neighboring oxygens) Fischer and Kim (2011):
| (2) |
A pictorial representation of the CuO2 unit cell indicating various hopping and interactions, as given by Eqs. 1 and 2, is provided in Fig. 1A.
The Emery model describes a charge-transfer insulator at large values of and at a filling of one hole per unit cell (we refer to this as the undoped state, or as half-filling). Such an insulating state is realized by tuning : as increases, the Cu band splits into lower and upper Hubbard bands (LHB and UHB) and the UHB is eventually pushed beyond the oxygen-dominant band (near ), leading to an insulating gap between the latter two, referred to as the charge-transfer gap (CTG) Zaanen et al. (1985). The central, oxygen-dominated band is called the charge-transfer band (CTB). On doping the charge-transfer insulator, the holes primarily go into the oxygen orbitals and another band appears at the Fermi level, referred to as the Zhang-Rice singlet band (ZRSB) Mai et al. (2021); Unger and Fulde (1993); Chen et al. (2013).
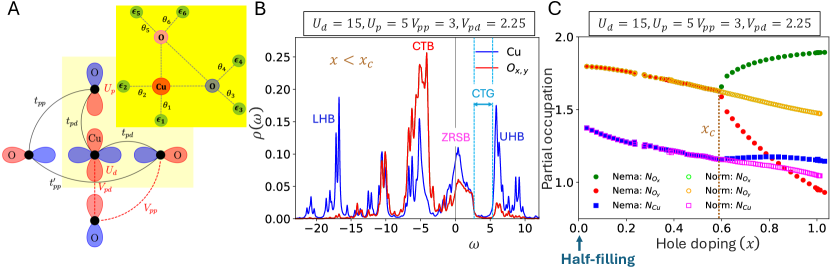
The density of states (DOS) of the interacting model exhibiting all the above features is shown in Fig. 1B at some doping , for band parameters given by
| (3) |
Here, all energies are given in units of eV Weber et al. (2012); Kowalski et al. (2021) and was used as the energy reference. In Fig. 1B, the system is in the normal phase for , where is some critical hole doping above which the systems undergoes a transition to the nematic phase. In the normal phase, the oxygen and orbitals are degenerate, as shown by the red band in Fig. 1B. The degeneracy is lifted for when the system enters the nematic phase.
II.2 Charge nematic order
The IUC charge nematic order () is defined as a spontaneous imbalance between the densities of the and oxygen orbitals of the Emery model:
| (4) |
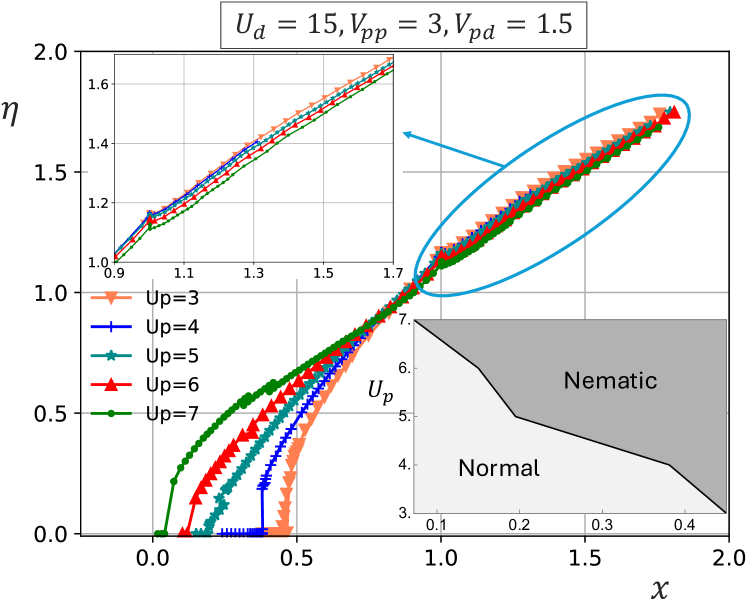
We do not allow any magnetization of the O sites (), hence the last equality above. As an illustration, the density imbalance of and electrons is shown in Fig. 1C, where the green () and red () curves bifurcate at , indicating the onset of the nematic transition. Of course, the critical doping depends on the choice of interaction parameters.
In the normal phase, the occupation of Cu (squares) is small compared to that of O (circles), which is expected since the UHB of Cu lies above the Fermi level (see Fig. 1B).
In the nematic phase () the holes primarily go to the O-band upon doping: while the slope of blue curve (Cu) is almost zero, that of green and red curves (Ox and Oy) varies significantly when . This is in agreement with experiments Tranquada et al. (1987); Emery and Reiter (1988); Chen et al. (1991); Gauquelin et al. (2014) and recent CDMFT studies Fratino et al. (2016); Kowalski et al. (2021) in the context of superconductivity.
We performed CDMFT computations at zero temperature, using an exact diagonalization (ED) impurity solver, for the 3-site impurity model shown in Fig. 1A(inset) to obtain Figs. 1B and 1C. Clearly, the results shown in Fig. 1C, though obtained from actual computation, do not depict the most favorable scenario for experiments, as the onset of nematic transition occurs at high doping (). So, our goal is to find a realistic set of interaction parameters for which small nematicity is found at low doping. For more details on the CDMFT procedure and the cluster model, see Appendix A.
III Results
In order to elucidate the origin of IUC charge nematicity in hole-doped cuprates, we computed the nematic order parameter for various interaction parameters as a function of hole doping (), with band parameters given by Eq. 3. Even after setting the band parameters, the model still has a large parameter space, {, , , } to play with; therefore mapping out a single phase diagram is impossible. Hence we compute the nematic order by varying one interaction parameter at a time, while keeping the others fixed at some realistic value. This we sequentially do for , and , assuming fixed , such that . We also compute the density of states (DOS), which is one of the direct ways to verify the signature of a quantum nematic phase transition.
III.1 Charge nematicity induced by first-neighbor interactions
Early works Kivelson et al. (2004); Fischer and Kim (2011) have focused on the role of on charge nematicity. However, the Cu-O interaction has generally been neglected, which is a priori unjustified. In this section, we argue that the interplay of these two interactions is crucial for charge nematicity.
III.1.1 Effect of the O-O repulsion
We consider realistic values of , and Hybertsen et al. (1989); McMahan et al. (1988); Stechel and Jennison (1988) and perform CDMFT computation for different ’s to understand its effect on charge nematicity. For a particular , we scan the chemical potential (which controls the electronic density) and find the onset of the nematic transition. The results are shown in Fig. 2A, and the corresponding phase diagram in Fig. 2C(top).
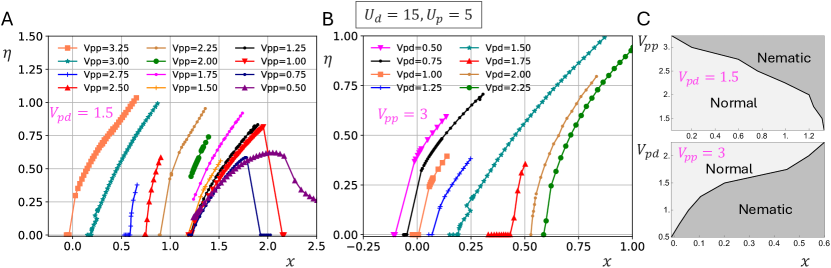
Fig. 2A depicts the general behavior of the nematic order parameter as a function of hole doping . We observe that, at a given , as doping is increased, the system undergoes a first-order transition to the nematic phase. A large favors nematicity, since the onset of the nematic transition shifts to low doping as increases. As per this trend, nematicity disappears at all doping at small enough : in Fig. 2A, for given , and , nematicity disappears completely for . Finally, for small ’s, for e.g., , we observe a nematic region confined in a small window of hole doping. A finite nematic region is expected at large ’s also, but this will be achieved in a larger window of hole doping. Indeed, the order parameter eventually must go back down at large doping since it cannot be nonzero at zero filling. We already see it at small ’s. So it is obvious that the doping range of nematicity will increase with . Since this is not a region of our interest (after all, the band parameters of the model depend on doping if they are derived from DFT and they would be massively different at very high doping), we do not dwell on this.
The vs phase diagram is shown in Fig. 2C(top), which shows a threshold in above which the nematicity appears. Note that we restricted the computations to small and intermediate values of doping for reasons of economy. No new physics is expected in the high doping region.
III.1.2 Effect of the Cu-O repulsion
We then investigate the effect of , the Cu-O Coulomb repulsion term. We fix , and and compute the order parameter as a function of doping for a few values of . The CDMFT results are shown in Fig. 2B, and the corresponding phase diagram in Fig. 2C(bottom).
In Fig. 2B, the behavior of vs is similar to that of Fig. 2A, except for the crucial difference that whereas favors nematicity, hinders it. Indeed, the nematic transition is pushed towards large doping as increases, contrary to in Fig. 2A. This indicates an intrinsic competition between and . The -doping phase diagram is shown in Fig. 2C(bottom). It suggests an upper bound on above which nematicity is impossible. We note that in Fig. 2B, the order parameter data for the lowest () extends in the electron-doped region (above half-filling, which is ), which is plausible. This is likely the case also for larger in Fig. 2A.
III.2 Density of states and the optimization of the Cu-O repulsion
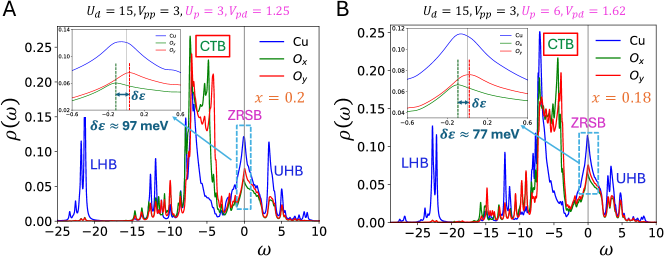
In Fig. 1B we showed the normal-state density of states (DOS), where the CTB is doubly-degenerate. By contrast, in the nematic phase, the CTB splits into two: there is a splitting of the energy levels () of the two O orbitals of the model. This is illustrated in Fig. 3 (here, is in units of eV Weber et al. (2012); Kowalski et al. (2021)), where the green and red curves represent the DOS of the and orbitals, respectively. Measuring the energy splitting between these two curves is one of the direct signatures of the quantum nematic phase transition in cuprates, as done recently using sublattice-resolved spectroscopic imaging scanning tunneling microscopy Wang et al. (2024).
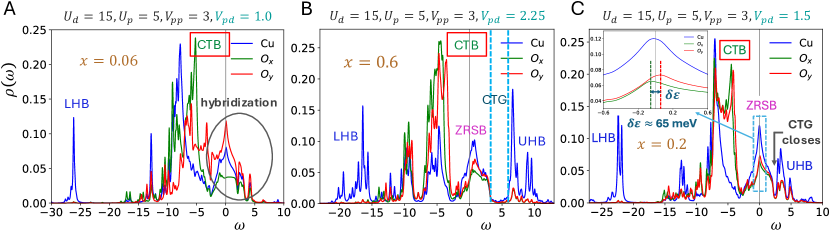
We use the solutions obtained from CDMFT as shown in Fig. 2 to calculate the DOS. Since, as discussed above, a small is favorable for nematicity (the onset of the transition is at low doping), it is tempting to consider it either very small or to ignore it altogether. However, we argue that a small value of is not favorable either, not for nematicity, but because of its effect on the DOS: it leads to a strong hybridization of the upper Hubbard band (UHB) with the Zhang-Rice singlet band (ZRSB), which is not observed. So, our goal of studying the DOS is two-fold: (i) from Fig. 2B, to determine the optimal value of , and (ii) at that value, from the nematic-state DOS close to the transition, extract the splitting near the Fermi level, in order to connect with the experiment.
III.2.1 Optimization of the Cu-O repulsion
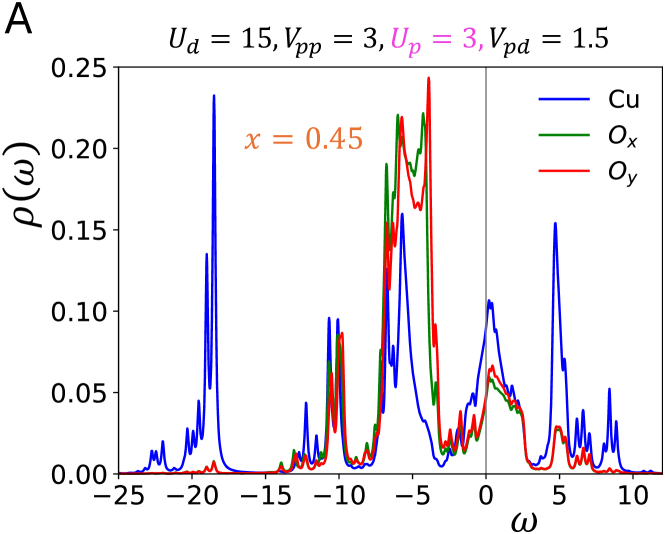
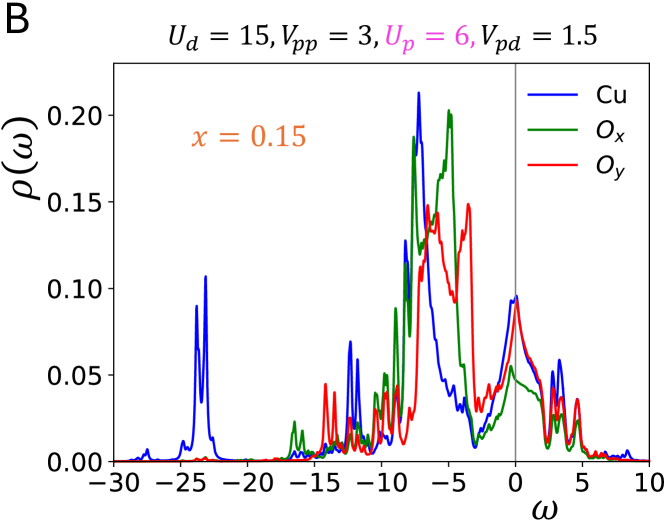
Panels A, B and C of Fig. 3 show the DOS at small, large and optimal , respectively. Since a small favors nematicity, we choose from Fig. 2B (the onset of the nematic transition is at very low doping), and calculate the DOS in the nematic state at as shown in Fig. 3A. We observe that, even though the splitting between CTBs is small, the UHB and the ZRSB hyrbidize strongly, contrary to observations and to the general behavior expected in cuprates. On the other hand, at large , although the DOS exhibits a clear charge-transfer gap (Fig. 3B), the onset of the nematic transition is pushed at large , contrary to observations; Fig. 3B is obtained at large doping . We conclude that an intermediate value of is best to have the onset of the transition at low-enough doping, accompanied by the UHB and ZRSB being well resolved, albeit with a rather small charge transfer gap (CTG). Recent experimental observations Ruan et al. (2016) and CDMFT computations Kowalski et al. (2021) also find that a small CTG is favorable to superconductivity, the superconduting reaching its maximum for small CTG Ruan et al. (2016). Recently, in Bi2Sr2CaCu2O8+x Wang et al. (2024), the electronic nematicity was found in the region of the phase diagram ( vs , where is temperature and is hole doping) where superconductivity also exists. A small CTG being also favorable for nematicitiy further strengthens our finding.
III.2.2 Effective difference in charge-transfer energies between oxygen orbitals
From Fig. 3C, the splitting () between the (green) and (red) bands near the Fermi level is very small. In the inset it is blown for clarity and we find meV. We take this spliting of the oxygen DOS in the ZRSB as a measure of the experimental shift of the CTG since the edge of the upper Hubbard band is not affected by nematicity while the shift in the upper edge of the CTB in Fig. 3C is comparable to the shift measured in the ZRSB. This is close to the experimental value, reported to be meV at hole doping Wang et al. (2024). We emphasize that the result is not unique to the interaction parameter set as chosen in Fig. 3C. In Figs. 7 and 8 of Appendix. D, we provide CDMFT data for the order parameter and the DOS, respectively, for other optimal interaction parameter sets, and the values of found there roughly agree with the experiment.
III.3 Effect of the oxygen on-site repulsion
Given the extended character of the oxygen orbitals, the value of oxygen on-site repulsion should be small. We take , which is smaller than the on-site copper repulsion . In Appendix. C (see Fig. 5), we show that a larger on-site oxygen repulsion leads to enhanced charge nematicity caused by the hybridization between the ZRSB and the UHB, as evident in Fig. 6, in contradiction with observations. We noted a similar hybridization-enhanced nematicity with earlier. We must reject such enhancements in both cases since the resulting DOS contradicts the experiment.
III.4 Comparison between CDMFT and static Hartree-Fock MFT
We now compare our CDMFT results with those obtained from self-consistent static MFT. Fischer et al. have applied self-consistent MFT to the Emery model in order to probe the emergence of charge nematicity. Fischer and Kim (2011); their analysis was limited to the Hartree approximation. In order to compare with our CDMFT results, we also performed self-consistent MFT computations, this time including Fock and Hartree terms (HF-MFT). Let us point out that our CDMFT computations also include a Hartree-Fock component for the interaction terms that span neighboring clusters: correlations are only treated exactly within the cluster (here, the unit cell).
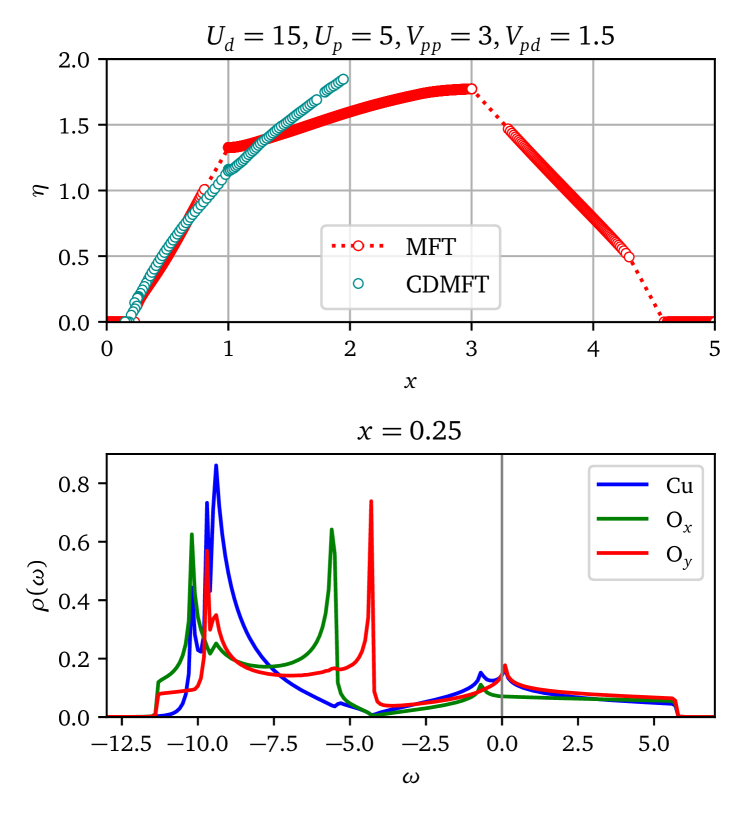
Leaving technical details of the static HF-MFT calculation to Appendix. B, let us only discuss the main results. They are presented in Fig. 4 for one of the optimal interaction parameter sets of Fig. 3C and discussed in Sec. III.2.1. The HF-MFT results for the nematic order parameter (red curves in Fig. 4, for MFT) show similar behavior and magnitude as in CDMFT (open cyan symbols) from low to intermediate doping . At very large doping, however, the CDMFT computation runs into convergence issues, most likely due to sector changes Dionne et al. (2023), frequent to ED-CDMFT. The static HF-MFT data, on the other hand, extends until the unit-cell becomes empty of electrons. As expected, the order parameter () in the MFT goes back down at large doping, as discussed in Sec. III.1.1.
This case illustrates perfectly our point about the importance of computing not only charge nematicity, which is essentially the same in both methods here, but also the DOS. The lower part of Fig. 4 shows the Hartree-Fock mean-field DOS. It does not have an UHB nor, equivalently, a CTG. Of course, the crucial difference between CDMFT and MFT lies in the dynamics. The density of states computed in CDMFT shows a splitting of correlated bands due to the local interaction, in particular the existence of a UHB (see Fig. 3). Given the dynamical nature of the probe used to detect nematicity Wang et al. (2024) a dynamical method like CDMFT is indicated to study the problem theoretically.
IV Summary and Conclusion
In this paper, we analyzed the three-band Hubbard (or Emery) model to investigate the interaction-induced intra-unit-cell (IUC) charge nematicity in hole-doped cuprates.
Cluster dynamical mean-field theory (CDMFT) allowed us to solve the model in a regime where neither electronic structure nor interactions dominate. In addition, with this method, densities of states exhibit an upper Hubbard band in agreement with experimental observation when the values of and satisfy the minimum requirement . We also argued that the charge nematicity by itself is not enough to claim agreement with experiments since different methods can give the same charge nematicity but unphysical densities of states.
We first looked for model parameters that could lead to small nematicity at low doping and found that it was important to study the interplay of two different nearest-neighbor interactions: (between and electrons of planar oxygens) and (between electrons of planar oxygens and electron of copper). As expected, increasing shifts the onset of the nematic transition to low doping, where it is observed experimentally. (see Fig. 2A and top panel of Fig. 2C). However, competes with and pushes the onset of the transition to high doping for large (see Fig. 2B and bottom panel of Fig. 2C).
cannot be neglected: The requirements of (i) small nematicity at low doping and (ii) well-resolved ZRSB and UHB (see Fig. 3A), force us to conclude that intermediate values of are optimal to obtain both a DOS compatible with observations and small nematicity at low doping.
Contact with experiment is achieved by computing the splitting of energy levels of the and orbitals of oxygen atoms for the optimal interaction parameter set, as shown in Fig. 3C. The UHB is not much affected by nematicity and the CTB energy spliting () between the and partial DOS shadows the splitting observed in the ZRSB. The calculated semi-quantitatively agrees with the recently measured value in Bi2Sr2CaCu2O8+x using sublattice-resolved spectroscopic imaging scanning tunneling microscope Wang et al. (2024), see Sec. III.2.2 for details. Note that the ZRSB is not well resolved in these experiments.
Given the available experimental observations there is still, however, some uncertainty in the precise value of nearest-neighbor interactions and . Since many of the properties of cuprates can be explained without taking into account these interactions, we argue that their effect is generally small and that more accurate values may not be needed until warranted by additional observations. For most purposes, the dominant interaction remains the on-site repulsion on copper orbitals.
Acknowledgements.
We thank B. B-Labreuil and N. Martin for useful discussions. A.K. acknowledges support from Canada First Research Excellence Fund and by the Natural Sciences and Engineering Research Council of Canada (NSERC) under Grant No. RGPIN-2019-05312. Computing resources were provided by Calcul Québec and by the Digital Research Alliance of Canada.Appendix A Methods
Cluster dynamical mean-field theory (CDMFT) Kotliar et al. (2001); Maier et al. (2005); Kotliar et al. (2006); Tremblay et al. (2006); Sénéchal (2012); Dionne et al. (2023); Sénéchal (2010) is a cluster extension of DMFT Georges et al. (1996). In this approach, instead of a single-site impurity, we consider a cluster of multiple sites as an impurity with open boundary conditions, taking into account short-ranged spatial correlations exactly. The effect of the cluster’s environment is accounted for by a set of additional, uncorrelated “bath” orbitals hybridized with the cluster. The bath orbitals have their own energy levels , which may or may not be spin dependent, and are hybridized with the cluster sites (labeled ) with amplitudes . The lattice is tiled with these clusters and the parameters of the bath orbitals are set by requiring some consistency between the local (to the cluster) electron Green function and the impurity model Green function.
We used a three-site cluster (Cu, Ox and Oy), with each site connected with two bath orbitals, as shown in Fig. 1A(inset). Here the cluster coincides with the unit cell of the model. The six bath orbitals represent the effect of the rest of the lattice. For simplicity, each bath orbital is hybridized to one physical orbital only. Hence the parameters of the impurity model include six bath energy levels () and six hybridization parameters (), all to be determined self-consistently.
In the cluster-bath model, Fig. 1A(inset), nematicity is naturally allowed since all bath energies () and hybridization parameters () are independent. The normal-state solution can be imposed by setting and (one-to-one correspondence). This constraint was imposed in order to obtain the normal-state solutions (open symbols) in Fig. 1C.
At every CDMFT iteration Sénéchal (2012, 2010), the impurity electron Green function is obtained by solving the impurity problem with an exact diagonalization solver at zero temperature. The electron self-energy is then extracted from via Dyson’s equation and the lattice electron Green function is assembled from this self-energy and the exact electron dispersion . The local Green function is computed from by Fourier transforming back to the cluster, and the difference is minimized over the set of bath parameters. This new set of bath parameters is then used for the next iterations. The on-site interactions ( and ) and the extended interactions ( and ) within the cluster are treated exactly, whereas the extended interactions between clusters are treated with Hartree-Fock mean-field theory. Converging the mean-field procedure is done simultaneously as converging the DMFT procedure, over the same iterations. This procedure was also used recently in Ref. Kundu and Sénéchal (2023). In this work it takes on average 40 iterations to achieve self-consistency. Once the procedure has converged, the lattice and cluster averages of one-body operator, , can be calculated with the help of the converged Green function:
| (5) |
| (6) |
We used Eq. 5 to calculate partial orbital densities and the nematic order parameter.
Finally, a few remarks on our choice of cluster model for the CDMFT computation. We used a 3-site cluster [Fig. 1A(inset)], which is of same size as the CuO2 unit-cell [Fig. 1A(main panel)]. This choice of cluster allows us to take into account the effect of and beyond mean field, although a substantial fraction of these interactions (between neighboring clusters) must be treated at the Hartree-Fock level. A different cluster system was adopted in Ref. Kowalski et al. (2021) to study superconductivity in cuprates: a Cu-cluster consisting of 4 Cu atoms, and an O-cluster consisting of 8 O atoms. But in that work only was considered; if the effect of other interaction terms (, , ) is to be included beyond mean-field theory, then that cluster system is no longer adequate.
Appendix B Hartree-Fock approximation
In this appendix, we provide technical details on the Hartree-Fock mean-field theory (HF-MFT) and derive the three-band MF Hamiltonian to calculate the order parameter discussed in Sec. III.4 and shown in Fig. 4. We also provide more CDMFT data in order to compare them with the HF-MFT results. We have argued in the MT (see Sec. III.4) that the DOS from HF-MFT is in strong disagreement with experiment. The value of the order parameter is insufficient to judge the accuracy of the theory.
We derive the mean field Hamiltonian (within Hartree and Fock approximations), which, in the momentum space can be written as
| (7) |
where
| (8) |
with the multiplet containing the creation operators for electrons on oxygen and orbitals and copper and with defined by
| (9) |
and
| (10) |
In (9), is the density of electrons, is the density of electrons,
| (11) |
and
| (12) |
with the spin index. Here, and , due to hermiticity of the mean-field Hamiltonian (7). The cross-densities in (9), and , originate from the Fock approximation, which also renormalizes hopping elements (off-diagonal terms) in (8):
| (13) |
Finally, the diagonal elements of (8) can be written as
| (14) |
with , and given in (10), which has interaction-dependent terms arising due to the Hartree approximation only. This is expected because Hartree terms are local hence they renormalize on-site terms of the Hamiltonian, not the hopping terms; the latter are renormalized by Fock terms (13).
For given values of , and , the chemical potential () is implicitly given by solving
| (15) |
where , with as the band index, is the dispersion of three bands with mixed orbital character, obtained upon diagonalizing the mean-field Hamiltonian (7). w The values of orbital densities , and , and cross-densities, , and , are obtained self-consistently. The nematic order parameter is obtained from the density imbalance of and electrons, as defined in (4) and discussed in detail in Sec. II.2. We quote results of the Hartree-Fock approximation since they are quite different from those of the Hartree approximation and they should be better.
The HF-MFT results for band parameters as given by (3) of the MT are shown by red curves in the top panel of Fig. 4 of the MT for a given set of interaction parameters as mentioned in the figure itself. In the same figure, the cyan curves are results obtained from CDMFT, whose DOS at hole doping , which is close to the transition point approaching from the ordered phase, is shown in Fig. 3C of the MT. As explained in the MT, despite the similarity between MFT and CDMFT for the value of the order parameter, the DOS from HF-MFT is unsatisfactory compared with the experiment (see Fig. 4(Bottom panel), which does not show upper Hubbard band), so we must reject it.
Appendix C Role of on charge nematicity
In this appendix we discuss the influence of on the physics. We show that both HF-MFT and CDMFT predict similar behavior of vs hole doping () as a function of . DOS plots show that at fixed , even though higher Up favors nematicity by shifting the onset of the transition closer to half-filling, the DOS contradicts experiments.
The origin of the increase in nematicity from low to intermediate doping upon increasing was discussed in the MT. The CDMFT data supporting that argument is provided in Fig. 5. The raw CDMFT data is provided in the main panel, while the nematic transition in the parameter space is summarized in the phase diagram (lower inset). The phase diagram suggests that the onset of the transition shifts to lower doping as increases, giving rise to the increase in the order parameter (). The upper inset is the blown up part of at large doping. Although seems to decrease in this doping region as increases, the decrease is too small to conclude anything. Anyway, since it is possible that at this large doping the band parameters of the model would be massively different if they are derived from DFT, we do not dwell on it further.
In the DOS plots, as illustrated in Fig. 6, increasing leads to an increased hybridization where the UHB is absorbed by the ZRSB in the low doping region of interest, as seen for example in Fig. 6B. At the same , for too small , however, although the ZRSB and the UHB are well resolved as shown in Fig. 6A (obtained at rather large doping, , in the nematic phase. At the doping same as in Fig. 6B, the system is in the normal phase), the onset of the nematic transition is pushed at larger doping, see orange curves in Fig. 5. To obtain the optimal situation for , we then need to decrease , which we will discuss in the next section. Considering same as in Fig. 8B, it is, therefore, crucial to restrict ourselves to small enough, or intermediate, values of to get the results in agreement with the experiment.
Appendix D Other optimal sets of parameters
In this appendix we argue that if we do not restrict ourselves to small , it is possible to change , as discussed in Sec. III.2.1, to find reasonable CDMFT results for other sets of parameters than those we argued for in the main text.
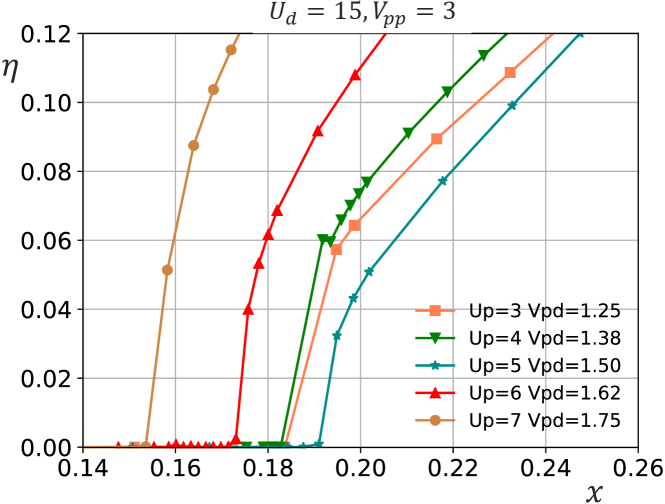
When we leave ourselves with complete freedom in the choice of parameters, it is possible to obtain comparable results for the order parameter as a function of hole doping. In Fig. 7, we provide CDMFT data of vs for some of the other possible optimal parameter sets, which yields small nematicity at low doping and the UHB and ZRSB in the DOS are well resolved. The DOS plots for few choices of optimal interaction parameters sets are shown in Fig. 8. At any rate, limiting ourselves to small-enough helps to restrict the range of acceptable interaction parameters. So, we chose in the MT to discuss all our findings.
References
- Fradkin et al. (2015) Eduardo Fradkin, Steven A. Kivelson, and John M. Tranquada, “Colloquium: Theory of intertwined orders in high temperature superconductors,” Rev. Mod. Phys. 87, 457–482 (2015).
- Nakata et al. (2021) S. Nakata, M. Horio, K. Koshiishi, K. Hagiwara, C. Lin, M. Suzuki, S. Ideta, K. Tanaka, D. Song, Y. Yoshida, H. Eisaki, and A. Fujimori, “Nematicity in a cuprate superconductor revealed by angle-resolved photoemission spectroscopy under uniaxial strain,” npj Quantum Materials 6, 86 (2021).
- Auvray et al. (2019) N. Auvray, B. Loret, S. Benhabib, M. Cazayous, R. D. Zhong, J. Schneeloch, G. D. Gu, A. Forget, D. Colson, I. Paul, A. Sacuto, and Y. Gallais, “Nematic fluctuations in the cuprate superconductor bi2sr2cacu2o8+δ,” Nature Communications 10, 5209 (2019).
- Mangin-Thro et al. (2017) Lucile Mangin-Thro, Yuan Li, Yvan Sidis, and Philippe Bourges, “ anisotropy of the intra-unit-cell magnetic order in ,” Phys. Rev. Lett. 118, 097003 (2017).
- Achkar et al. (2016) A. J. Achkar, M. Zwiebler, Christopher McMahon, F. He, R. Sutarto, Isaiah Djianto, Zhihao Hao, Michel J. P. Gingras, M. Hücker, G. D. Gu, A. Revcolevschi, H. Zhang, Y.-J. Kim, J. Geck, and D. G. Hawthorn, “Nematicity in stripe-ordered cuprates probed via resonant x-ray scattering,” Science 351, 576–578 (2016).
- Cyr-Choinière et al. (2015) O. Cyr-Choinière, G. Grissonnanche, S. Badoux, J. Day, D. A. Bonn, W. N. Hardy, R. Liang, N. Doiron-Leyraud, and Louis Taillefer, “Two types of nematicity in the phase diagram of the cuprate superconductor ,” Phys. Rev. B 92, 224502 (2015).
- Xie et al. (2022) Tao Xie, Zhaoyu Liu, Yanhong Gu, Dongliang Gong, Huican Mao, Jing Liu, Cheng Hu, Xiaoyan Ma, Yuan Yao, Lin Zhao, Xingjiang Zhou, John Schneeloch, Genda Gu, Sergey Danilkin, Yi feng Yang, Huiqian Luo, and Shiliang Li, “Tracking the nematicity in cuprate superconductors: a resistivity study under uniaxial pressure,” Journal of Physics: Condensed Matter 34, 334001 (2022).
- Wu et al. (2018) J. Wu, A.T. Bollinger, X. He, and I. Božović, “Pervasive electronic nematicity in a cuprate superconductor,” Physica C: Superconductivity and its Applications 549, 95–98 (2018).
- Wu et al. (2020) J. Wu, A. T. Bollinger, X. He, G. D. Gu, H. Miao, M. P. M. Dean, I. K. Robinson, and I. Božović, “Angle-resolved transport measurements reveal electronic nematicity in cuprate superconductors,” Journal of Superconductivity and Novel Magnetism 33, 87–92 (2020).
- Murayama et al. (2019) H. Murayama, Y. Sato, R. Kurihara, S. Kasahara, Y. Mizukami, Y. Kasahara, H. Uchiyama, A. Yamamoto, E.-G. Moon, J. Cai, J. Freyermuth, M. Greven, T. Shibauchi, and Y. Matsuda, “Diagonal nematicity in the pseudogap phase of hgba2cuo4+δ,” Nature Communications 10, 3282 (2019).
- Daou et al. (2010) R. Daou, J. Chang, David LeBoeuf, Olivier Cyr-Choinière, Francis Laliberté, Nicolas Doiron-Leyraud, B. J. Ramshaw, Ruixing Liang, D. A. Bonn, W. N. Hardy, and Louis Taillefer, “Broken rotational symmetry in the pseudogap phase of a high-tc superconductor,” Nature 463, 519–522 (2010).
- Mook et al. (2008) H. A. Mook, Y. Sidis, B. Fauqué, V. Balédent, and P. Bourges, “Observation of magnetic order in a superconducting single crystal using polarized neutron scattering,” Phys. Rev. B 78, 020506 (2008).
- Fauqué et al. (2006) B. Fauqué, Y. Sidis, V. Hinkov, S. Pailhès, C. T. Lin, X. Chaud, and P. Bourges, “Magnetic order in the pseudogap phase of high- superconductors,” Phys. Rev. Lett. 96, 197001 (2006).
- Li et al. (2011) Yuan Li, V. Balédent, N. Barišić, Y. C. Cho, Y. Sidis, G. Yu, X. Zhao, P. Bourges, and M. Greven, “Magnetic order in the pseudogap phase of hgba2cuo4+δ studied by spin-polarized neutron diffraction,” Phys. Rev. B 84, 224508 (2011).
- Li et al. (2008) Y. Li, V. Balédent, N. Barišić, Y. Cho, B. Fauqué, Y. Sidis, G. Yu, X. Zhao, P. Bourges, and M. Greven, “Unusual magnetic order in the pseudogap region of the superconductor hgba2cuo4+δ,” Nature 455, 372–375 (2008).
- Fujita et al. (2014a) K. Fujita, Chung Koo Kim, Inhee Lee, Jinho Lee, M. H. Hamidian, I. A. Firmo, S. Mukhopadhyay, H. Eisaki, S. Uchida, M. J. Lawler, E.-A. Kim, and J. C. Davis, “Simultaneous transitions in cuprate momentum-space topology and electronic symmetry breaking,” Science 344, 612–616 (2014a).
- Zhao et al. (2017) L. Zhao, C. A. Belvin, R. Liang, D. A. Bonn, W. N. Hardy, N. P. Armitage, and D. Hsieh, “A global inversion-symmetry-broken phase inside the pseudogap region of yba2cu3oy,” Nature Physics 13, 250–254 (2017).
- Sato et al. (2017) Y. Sato, S. Kasahara, H. Murayama, Y. Kasahara, E. G. Moon, T. Nishizaki, T. Loew, J. Porras, B. Keimer, T. Shibauchi, and Y. Matsuda, “Thermodynamic evidence for a nematic phase transition at the onset of the pseudogap in yba 2 cu 3 o y,” Nature Physics 13, 1074–1078 (2017).
- Wang et al. (2024) Shuqiu Wang, Niall Kennedy, Kazuhiro Fujita, Shin-ichi Uchida, Hiroshi Eisaki, Peter D. Johnson, J. C. Séamus Davis, and Shane M. O’Mahony, “Discovery of orbital ordering in bi2sr2cacu2o8+x,” Nature Materials 23, 492–498 (2024).
- MJ et al. (2010) Lawler MJ, Fujita K, Lee J, Schmidt AR, Kohsaka Y, Kim CK, Eisaki H, Uchida S, Davis JC, Sethna JP, and Kim EA., “Intra-unit-cell electronic nematicity of the high-tc copper-oxide pseudogap states,” Nature 466, 347–351 (2010).
- Mesaros et al. (2011) A. Mesaros, K. Fujita, H. Eisaki, S. Uchida, J. C. Davis, S. Sachdev, J. Zaanen, M. J. Lawler, and Eun-Ah Kim, “Topological defects coupling smectic modulations to intra–unit-cell nematicity in cuprates,” Science 333, 426–430 (2011).
- Fujita et al. (2014b) Kazuhiro Fujita, Mohammad H. Hamidian, Stephen D. Edkins, Chung Koo Kim, Yuhki Kohsaka, Masaki Azuma, Mikio Takano, Hidenori Takagi, Hiroshi Eisaki, Shin ichi Uchida, Andrea Allais, Michael J. Lawler, Eun-Ah Kim, Subir Sachdev, and J. C. Séamus Davis, “Direct phase-sensitive identification of a <i>d</i>-form factor density wave in underdoped cuprates,” Proceedings of the National Academy of Sciences 111, E3026–E3032 (2014b).
- Kivelson et al. (2004) Steven A. Kivelson, Eduardo Fradkin, and Theodore H. Geballe, “Quasi-one-dimensional dynamics and nematic phases in the two-dimensional emery model,” Phys. Rev. B 69, 144505 (2004).
- Fischer and Kim (2011) Mark H. Fischer and Eun-Ah Kim, “Mean-field analysis of intra-unit-cell order in the emery model of the cuo2 plane,” Phys. Rev. B 84, 144502 (2011).
- Bulut et al. (2013) S. Bulut, W. A. Atkinson, and A. P. Kampf, “Spatially modulated electronic nematicity in the three-band model of cuprate superconductors,” Phys. Rev. B 88, 155132 (2013).
- Maier and Scalapino (2014) T. A. Maier and D. J. Scalapino, “Pairing interaction near a nematic quantum critical point of a three-band model,” Phys. Rev. B 90, 174510 (2014).
- Fischer et al. (2014) Mark H Fischer, Si Wu, Michael Lawler, Arun Paramekanti, and Eun-Ah Kim, “Nematic and spin-charge orders driven by hole-doping a charge-transfer insulator,” New Journal of Physics 16, 093057 (2014).
- Tsuchiizu et al. (2018) Masahisa Tsuchiizu, Kouki Kawaguchi, Youichi Yamakawa, and Hiroshi Kontani, “Multistage electronic nematic transitions in cuprate superconductors: A functional-renormalization-group analysis,” Phys. Rev. B 97, 165131 (2018).
- Chiciak et al. (2018) Adam Chiciak, Ettore Vitali, Hao Shi, and Shiwei Zhang, “Magnetic orders in the hole-doped three-band hubbard model: Spin spirals, nematicity, and ferromagnetic domain walls,” Phys. Rev. B 97, 235127 (2018).
- Yamase (2021) Hiroyuki Yamase, “Theoretical insights into electronic nematic order, bond-charge orders, and plasmons in cuprate superconductors,” Journal of the Physical Society of Japan 90, 111011 (2021).
- Zegrodnik et al. (2020) Michal Zegrodnik, Andrzej Biborski, and Jozef Spałek, “Superconductivity and intra-unit-cell electronic nematic phase in the three-band model of cuprates,” The European Physical Journal B 93, 183 (2020).
- Emery (1987) V. J. Emery, “Theory of high- superconductivity in oxides,” Phys. Rev. Lett. 58, 2794–2797 (1987).
- Varma et al. (1987) C.M. Varma, S. Schmitt-Rink, and Elihu Abrahams, “Charge transfer excitations and superconductivity in “ionic” metals,” Solid State Communications 62, 681–685 (1987).
- Kotliar et al. (2001) Gabriel Kotliar, Sergej Y. Savrasov, Gunnar Pálsson, and Giulio Biroli, “Cellular dynamical mean field approach to strongly correlated systems,” Phys. Rev. Lett. 87, 186401 (2001).
- Maier et al. (2005) Thomas Maier, Mark Jarrell, Thomas Pruschke, and Matthias H. Hettler, “Quantum cluster theories,” Rev. Mod. Phys. 77, 1027–1080 (2005).
- Kotliar et al. (2006) G. Kotliar, S. Y. Savrasov, K. Haule, V. S. Oudovenko, O. Parcollet, and C. A. Marianetti, “Electronic structure calculations with dynamical mean-field theory,” Reviews of Modern Physics 78, 865 (2006).
- Tremblay et al. (2006) A. M. S. Tremblay, B. Kyung, and D. Sénéchal, “Pseudogap and high-temperature superconductivity from weak to strong coupling. towards a quantitative theory,” Low Temp. Phys. 32, 424–451 (2006).
- Sénéchal (2012) David Sénéchal, “Cluster dynamical mean field theory,” in Strongly Correlated Systems: Theoretical Methods, edited by Adolfo Avella and Ferdinando Mancini (Springer Berlin Heidelberg, Berlin, Heidelberg, 2012) pp. 341–371.
- Dionne et al. (2023) Théo N. Dionne, Alexandre Foley, Moïse Rousseau, and David Sénéchal, “Pyqcm: An open-source python library for quantum cluster methods,” SciPost Physics Codebases (2023), 10.21468/scipostphyscodeb.23.
- Mai et al. (2021) Peizhi Mai, Giovanni Balduzzi, Steven Johnston, and Thomas A. Maier, “Orbital structure of the effective pairing interaction in the high-temperature superconducting cuprates,” npj Quantum Materials 6, 26 (2021).
- Unger and Fulde (1993) P. Unger and P. Fulde, “Spectral function of holes in the emery model,” Phys. Rev. B 48, 16607–16622 (1993).
- Chen et al. (2013) C.-C. Chen, M. Sentef, Y. F. Kung, C. J. Jia, R. Thomale, B. Moritz, A. P. Kampf, and T. P. Devereaux, “Doping evolution of the oxygen -edge x-ray absorption spectra of cuprate superconductors using a three-orbital hubbard model,” Phys. Rev. B 87, 165144 (2013).
- Zaanen et al. (1985) J. Zaanen, G. A. Sawatzky, and J. W. Allen, “Band gaps and electronic structure of transition-metal compounds,” Phys. Rev. Lett. 55, 418–421 (1985).
- Weber et al. (2012) C. Weber, C. Yee, K. Haule, and G. Kotliar, “Scaling of the transition temperature of hole-doped cuprate superconductors with the charge-transfer energy,” Europhysics Letters 100, 37001 (2012).
- Kowalski et al. (2021) Nicolas Kowalski, Sidhartha Shankar Dash, Patrick Sémon, David Sénéchal, and André-Marie Tremblay, “Oxygen hole content, charge-transfer gap, covalency, and cuprate superconductivity,” Proceedings of the National Academy of Sciences 118, e2106476118 (2021).
- Tranquada et al. (1987) J. M. Tranquada, S. M. Heald, and A. R. Moodenbaugh, “X-ray-absorption near-edge-structure study of superconductors,” Phys. Rev. B 36, 5263–5274 (1987).
- Emery and Reiter (1988) V. J. Emery and G. Reiter, “Mechanism for high-temperature superconductivity,” Phys. Rev. B 38, 4547–4556 (1988).
- Chen et al. (1991) C. T. Chen, F. Sette, Y. Ma, M. S. Hybertsen, E. B. Stechel, W. M. C. Foulkes, M. Schulter, S-W. Cheong, A. S. Cooper, L. W. Rupp, B. Batlogg, Y. L. Soo, Z. H. Ming, A. Krol, and Y. H. Kao, “Electronic states in probed by soft-x-ray absorption,” Phys. Rev. Lett. 66, 104–107 (1991).
- Gauquelin et al. (2014) N. Gauquelin, D. G. Hawthorn, G. A. Sawatzky, R. X. Liang, D. A. Bonn, W. N. Hardy, and G. A. Botton, “Atomic scale real-space mapping of holes in yba2cu3o6+δ,” Nature Communications 5, 4275 (2014).
- Fratino et al. (2016) L. Fratino, P. Sémon, G. Sordi, and A.-M. S. Tremblay, “Pseudogap and superconductivity in two-dimensional doped charge-transfer insulators,” Physical Review B 93, 245147 (2016).
- Hybertsen et al. (1989) Mark S. Hybertsen, Michael Schlüter, and Niels E. Christensen, “Calculation of coulomb-interaction parameters for using a constrained-density-functional approach,” Phys. Rev. B 39, 9028–9041 (1989).
- McMahan et al. (1988) A. K. McMahan, Richard M. Martin, and S. Satpathy, “Calculated effective hamiltonian for cu and solution in the impurity anderson approximation,” Phys. Rev. B 38, 6650–6666 (1988).
- Stechel and Jennison (1988) E. B. Stechel and D. R. Jennison, “Electronic structure of sheets and spin-driven high- superconductivity,” Phys. Rev. B 38, 4632–4659 (1988).
- Ruan et al. (2016) Wei Ruan, Cheng Hu, Jianfa Zhao, Peng Cai, Yingying Peng, Cun Ye, Runze Yu, Xintong Li, Zhenqi Hao, Changqing Jin, Xingjiang Zhou, Zheng-Yu Weng, and Yayu Wang, “Relationship between the parent charge transfer gap and maximum transition temperature in cuprates,” Science Bulletin 61, 1826–1832 (2016).
- Sénéchal (2010) David Sénéchal, “An introduction to quantum cluster methods,” (2010), arXiv:0806.2690 [cond-mat.str-el] .
- Georges et al. (1996) Antoine Georges, Gabriel Kotliar, Werner Krauth, and Marcelo J. Rozenberg, “Dynamical mean-field theory of strongly correlated fermion systems and the limit of infinite dimensions,” Rev. Mod. Phys. 68, 13–125 (1996).
- Kundu and Sénéchal (2023) Sarbajaya Kundu and David Sénéchal, “Cdmft+hfd : an extension of dynamical mean field theory for nonlocal interactions applied to the single band extended hubbard model,” (2023), arXiv:2310.16075 [cond-mat.str-el] .