Probing the fission of 220Ra⋆ at E⋆ 31.8–45.4 MeV
Abstract
In this work, fission of moderately excited compound nucleus 220Ra⋆ produced in 12C+208Pb reaction at Elab = 81.9, 75.8, and 67.5 MeV has been studied. 28 fission fragments, within the mass range 60A141, have been identified based on their characteristic decay -lines and half-lives. The yields of different fission fragments have been analyzed to generate isotopic and isobaric yield distributions. The value of the mass dispersion parameter, , is found to be 2.93 and 2.65 for Antimony (Sb) isotope at excitation energy E⋆ = 45.4 and 39.6 MeV, and 1.24 for Indium (In) isotope at E⋆ = 45.4 MeV. The charge dispersion parameter for Sb is estimated to be 0.769 and 0.714 at E⋆ = 45.4 and 39.6 MeV, respectively. For In isotopes, the value of is estimated to be 0.430 at E⋆ = 45.4 MeV. The value of mass and charge dispersion parameters for Sb and In isotopes display good agreement with the values reported in the literature for similar systems. It has been found that 99mTc and 111In, medically important isotopes, populate in this system. The present investigations suggest that fission is a dominating mode of deexcitation of the compound nucleus, even at entrance channel energies slightly above the Coulomb barrier.
1 Introduction
Nuclear fission dynamics has been the subject of rigorous investigations over the past few decades because of the interdisciplinary outcome potential of the process [1]. The cross-section data generated for fission fragments in reactions with various projectile and target combinations are inputs for research in super-heavy element synthesis [2, 3], nuclear astrophysics, medical applications, and security purposes. The cross-section data is vital for developing next-generation nuclear reactors for producing nuclear energy, producing new radioactive isotopes, and transmuting commercial nuclear waste [4], to name a few. The mechanism of fission manifests only when the fissioning nucleus surmounts the fission barrier [5], which emerges from the interplay between Coulomb and surface energy factors in the semi-empirical formula. No fission barrier exists for Z 104; therefore, a symmetric, single-humped distribution of masses of fission fragments is most probable. However, the observation of asymmetrical mass distribution in fission involving actinide targets [6] and synthesis of elements beyond Z=104 [7] hinted at the discrepancy in the liquid drop model. The asymmetry in the mass distribution was later explained based on nuclear shell effects by incorporating the shell correction term in the liquid drop model energy [8, 9, 10].
Additionally, the increased excitation energy decreases the mass distribution asymmetry of the fission fragments, leading to symmetric fission. This feature may be explained as a result of a gradual decrease of shell effects with an increase in excitation energies of the compound nucleus as reported in [11, 12]. Although a combination of the shell and liquid drop models offers insight into the fundamental aspects of nuclear fission, certain aspects still need to be understood. As a result, nuclear fission continues to be an important area of investigation in nuclear physics. The effect of excitation energy and angular momentum on various fission observables has provided more profound insights into the mechanism of fission. In Refs. [13, 14], the mass-asymmetry, shape-deformation, and coulomb factor (ZPZT) have been found to affect the dynamics of fusion-fission. The entrance-channel spectroscopic properties of 12C+208Pb system, along with the similar systems studied elsewhere, are presented in Table 1 for ready reference.
Hinde . [15] studied the angular distributions of fission fragments for 16O+238U system. Ghosh . [16] measured the mass distribution of fission fragments for deformed and spherical targets with light projectiles, considering the microscopic effects arising from the orientation of the deformed targets to obtain insights into the different paths followed by the excited composite system towards fission. It has been found that, for a deformed target, the width of the mass distribution of fission fragments from fusion-fission reactions sharply increases with increased excitation energy around the Coulomb barrier. In contrast, there is a smooth variation in the width of the mass distribution for a spherical target at the same energies.
Experimental studies have consistently shown that actinides with masses up to A 256 mainly undergo asymmetric fission [17], whereas nuclei around 208Pb offer symmetric fission [18]. In a study performed by Itkis . [19], for the fission of Ra isotopes produced in 12C+204,206,208Pb reactions, the effect of compound nucleus excitation energy on the ratio of symmetric to asymmetric component yield has been observed. In Ref. [20], three fission modes of compound nuclei 220Ra formed in 12C+208Pb reaction were experimentally observed. Schmidt . [21] studied 70 systems from 205At to 234U via Coulomb-excitation induced fission. It has been found that the transition takes place from the symmetric to asymmetric fission mode around mass A226 in this region of nuclei. In Ref. [22] the entrance channel effect in the fission of 216Ra has been studied from the mass and energy distributions of fission fragments from two reactions 12C + 204Pb and 48Ca + 168Er, the contribution of asymmetric fission was only around 1.5% but for the latter was around 30%. The observation of unexpected asymmetric fission of 180Hg (after decay) [23], sparked a profound curiosity in theoretical modeling [24, 25, 26, 27]. Recent experimental work [28, 29] shows that in the sublead region, asymmetric mode is present at moderately high excitation energies. Karapetyan . [30] studied the interaction of 11B with 209Bi and 181Ta targets. In this study, the presence of the asymmetric component for 209Bi at 146 MeV was observed, whereas it is absent for 181Ta at 125.7 and 245.4 MeV. Miernik [31] reported the fission of 215Fr, the presence of an asymmetric component in the charge distribution at an excitation energy of 61.0 MeV. Collectively, there is no unambiguous explanation for the dependence of fission on excitation energy, whether the microscopic structure is preserved, and to what excitation energies.
| Reaction | Barrier | deformation | Mass asymmetry | CN | xLD | Ref. | |
|---|---|---|---|---|---|---|---|
| height | Projectile | Target | |||||
| (MeV) | |||||||
| 12C + 208Pb | 58.58 | 0.582 | 0.055 | 0.891 | 220Ra | 0.745 | * |
| 12C + 206Pb | 58.71 | 0.582 | 0.032 | 0.889 | 218Ra | 0.748 | [19] |
| 16O + 208Pb | 76.93 | 0.364 | 0.055 | 0.857 | 224Th | 0.763 | [34] |
| 20Ne + 208Pb | 94.93 | 0.727 | 0.055 | 0.824 | 228U | 0.781 | [35] |
To supplement the ongoing efforts toward a comprehensive understanding of fission dynamics, an experiment has been carried out to measure the production cross-sections of fission fragments produced in the 12C+208Pb reaction at Elab = 81.9, 75.8, and 67.5 MeV. The experimental methodology is outlined in Section 2, while Section 3 presents the details of data analysis. Section 4 delves into the results and discussion. Lastly, Section 5 summarizes the results and conclusions.
2 Experimental Mehodology
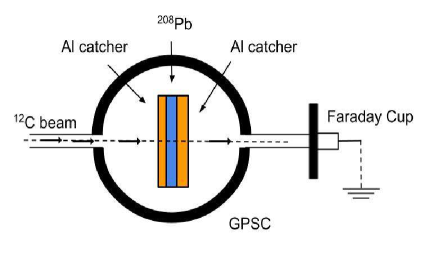
The experiment was carried out at the Inter-University Accelerator Centre (IUAC), New Delhi, India, in the General Purpose Scattering Chamber (GPSC), equipped with an in-vacuum transfer facility (ITF) for swift transfer of irradiated samples from the chamber to the detection setup. Enriched 208Pb (99.74%) was utilized to prepare the target foils of thickness 0.169-0.237 mg/cm2. 208Pb were deposited on Al foils (thickness range of 1.0–1.5 mg/cm2) using high vacuum evaporation technique [36]. The Al foils were prepared using the cold rolling machine, and their thickness was measured using the transmission method. Fig. 1 depicts a stack containing 208Pb target and Al-catcher foils (3.0–4.5 mg/cm2), mounted on an aluminum target ladder with a concentric hole of 1.2 cm diameter in GPSC for irradiations. Al-catcher foils were positioned in front and behind the target foil to trap fission fragments recoiled out of the target in forward and backward cones.
The irradiations were performed using 12C beams obtained from 15-UD pelletron accelerator at energies Elab (corrected) = 81.9, 75.8, and 67.5 MeV with the beam current ranging between 9–10 nA for 6–9 hours depending upon the half-lives of residues. The beam current was monitored using an ORTEC current integrator installed downstream of the beamline behind the target-catcher assembly. The energy-loss corrected beam energy, i.e., the effective incident beam energy at the half-thickness of the target in each target-catcher foil assembly, was estimated using the code SRIM [37].
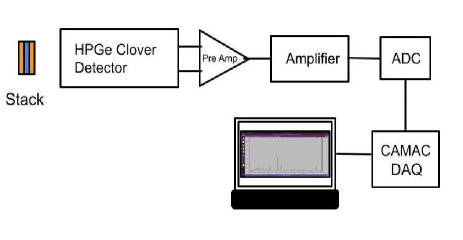
After the irradiation, the target-catcher assembly was taken out of the scattering chamber using an ITF and moved to the offline counting setup. The -ray activities induced in the target-catcher assembly were counted with a pre-calibrated HPGe clover detector coupled to a CAMAC-based DAQ (Data Acquisition) system running on locally developed CANDLE software [38]. The schematic representation of this setup is shown in Fig. 2. For calibration purposes and to estimate the geometry-dependent efficiency of the detectors, standard sources, i.e., 152Eu, 60Co, and 133Ba, with known strengths were used. The measurements with the standard sources were taken before, in between, and after counting the irradiated target-catcher assembly at different source-detector distances to monitor the change in the efficiency of the system during its operating period by Clover detector, if any. The resolution of the clover detectors was estimated to be 2.3 keV at the 1332 keV -ray of the 60Co source. The target-catcher assemblies were counted in the same geometry as the standard -ray sources to avoid the solid angle effect during the counting. During the counting, the dead time of the detector was kept 10%.
| S. No. | Eγ (keV) | Iγ() | t1/2 | Nuclide |
|---|---|---|---|---|
| 1 | 1332.5 | 88 | 23.7 min | 60Cu |
| 2 | 596.56 | 26 | 9.19 h | 62Zn |
| 3 | 381.85 | 28.3 | 2.26 h | 66Ge |
| 108.85 | 10.6 | 2.26 h | 66Ge | |
| 4 | 167.01 | 84 | 18.9 min | 67Ge |
| 5 | 668.21 | 22.1 | 52.6 min | 70As |
| 6 | 834.13 | 95.45 | 14.10 h | 72Ga |
| 7 | 406.5 | 12.1 | 14.8 h | 76Kr |
| 8 | 589 | 39 | 106.3 min | 80Sr |
| 9 | 402.58 | 50 | 76.3 min | 87Kr |
| 10 | 140.51 | 89 | 6.01 h | 99mTc |
| 11 | 306.83 | 89 | 14.2 min | 101Tc |
| 12 | 469.34 | 18.31 | 4.44 h | 105Ru |
| 724.21 | 47.8 | 4.44 h | 105Ru | |
| 13 | 302.77 | 66 | 21.7 min | 107Rh |
| 14 | 203.3 | 74.2 | 4.16 h | 109In |
| 15 | 657.75 | 98 | 4.92 h | 110In |
| 16 | 245.35 | 94.1 | 2.80 d | 111In |
| 17 | 497.31 | 97.9 | 32.1 min | 115Sb |
| 18 | 93.7 | 33.1 | 2.49 h | 116Te |
| 19 | 1293.55 | 100 | 60.3 min | 116mSb |
| 20 | 158.56 | 85.9 | 2.80 h | 117Sb |
| 21 | 273.34 | 28 | 2.49 h | 117Cd |
| 22 | 719.7 | 64.7 | 62 min | 117Te |
| 23 | 1229.65 | 100 | 5.00 h | 118mSb |
| 24 | 536.06 | 99 | 12.36 h | 130I |
| 25 | 529.87 | 87 | 20.83 h | 133I |
| 26 | 847.02 | 96 | 52.5 min | 134I |
| 27 | 249.79 | 90 | 9.14 h | 135Xe |
| 28 | 190.32 | 44.8 | 18.27 min | 141Ba |
3 Data Analysis
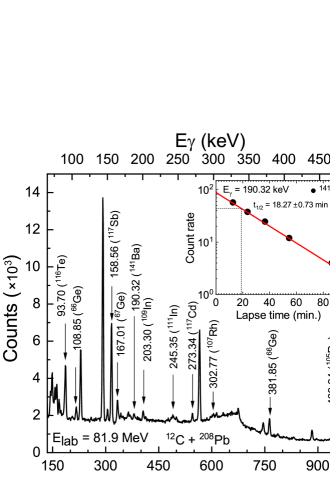
The fission residues were identified using the characteristic -rays and their half-lives obtained from the decay curve analysis. The residues of longer half-lives were counted for a week or more. The -ray spectrum of 12C+208Pb system obtained at Elab = 81.9 MeV is presented in Fig. 3 in which the -lines associated with different fission fragments are marked. The inset shows the decay curve of 141Ba residue obtained following the 190.32 keV -line. As shown in this figure, the activity reduces to half of its value in 18.27 min of lapse time, which shows good agreement with the known characteristic half-live of 141Ba and confirms its identification. The same procedure has been followed for all the fission fragments identified in this work at different energies. In Table 2, the fission fragments with their spectroscopic properties, e.g., the half-lives, -ray energies, and intensities are taken from the Decay Radiation database within the NUDAT (Nuclear Structure and Decay Data) application [39] and ref.[40], are given. Moreover, it should be mentioned that the activation technique used in the present work imposes some restrictions on identifying reaction residues due to its limitations. For example, it is not possible to measure stable, very short-lived, or very long-lived isotopes in such experiments.
| Cross-sections of fission fragments, (mb) | ||||
|---|---|---|---|---|
| Nuclide | 45.4 MeV | 39.6 MeV | 31.8 MeV | |
| 60Cu | 44.734.71 | 30.494.12 | ||
| 62Zn | 88.717.98 | 41.384.33 | 33.823.46 | |
| 66Ge | 63.455.47 | 37.413.78 | 28.472.86 | |
| 67Ge | 60.385.59 | 34.703.79 | ||
| 70As | 69.306.96 | 41.735.46 | 33.72 | |
| 72Ga | 73.866.16 | 39.613.81 | ||
| 76Kr | 63.036.21 | |||
| 80Sr | 48.064.43 | 23.242.56 | ||
| 87Kr | 14.211.43 | 8.291.19 | ||
| 99mTc | 12.541.19 | 7.910.77 | 5.600.48 | |
| 101Tc | 48.344.79 | |||
| 105Ru | 49.564.45 | 32.713.25 | 24.162.40 | |
| 107Rh | 46.204.50 | |||
| 109In | 31.792.75 | |||
| 110In | 102.4910.47 | 51.484.69 | 36.343.27 | |
| 111In | 50.824.48 | |||
| 115Sb | 36.953.52 | 20.16 | ||
| 116Te | 68.265.86 | 33.863.16 | 16.441.62 | |
| 116mSb | 72.496.66 | 43.285.17 | ||
| 117Sb | 39.723.50 | 22.091.97 | 12.221.13 | |
| 117Cd | 63.465.62 | 17.481.93 | ||
| 117Te | 77.096.96 | |||
| 118mSb | 5.220.62 | 4.240.52 | ||
| 130I | 17.761.64 | |||
| 133I | 20.962.00 | |||
| 134I | 42.544.01 | 29.293.18 | 19.232.06 | |
| 135Xe | 39.004.18 | |||
| 141Ba | 31.483.29 | 20.972.82 | ||
After identification of all fission fragments, their production cross-sections () were calculated using the standard activation equation given elsewhere [41]. It may be pointed out that the value of measured in the present work for respective residues is cumulative because these cross-sections include the contribution from the decay of the neighboring unstable isobars. The error in the production cross-sections may arise due to the uncertainty in target thickness, beam flux, and the geometry-dependent efficiency of the detector. The overall error in the measured cross-sections, including the statistical errors, is estimated to be . In the present work, 28, 19, and 9 fission fragments have been identified at E⋆ = 45.4 MeV (Elab = 81.9 MeV), E⋆ = 39.6 MeV (Elab = 75.8 MeV) and E⋆ = 31.8 MeV (Elab = 67.5 MeV), respectively. The production cross-sections of fission fragments, along with the errors, are given in Table 3.
4 Results and Discussion
4.1 Mass distribution of fission fragments
The mass distribution of fission fragments is a crucial post-fission observable directly linked to the collective dynamics of the fission as it describes how nuclear shell and pairing effects evolve with change in excitation energy. To generate mass distributions, the experimental cross-sections of fission fragments produced in the 12C+208Pb system are plotted as a function of mass number (A) in Figs. 4(a)- 4(c) at different energies. As can be seen from this figure, the fission fragments exhibit a broad mass distribution, ranging from A = 60 to 141, with production probabilities ranging from 4 - 102 mb, indicating the production of the fission fragments from the decay of excited compound nucleus in a fusion-fission reaction. The mass distribution of fission fragments in 220Ra contains two groups of residues, one light mass fragment group clustered around A 70 and another heavy mass fragment group around A 116, which is a mixture of symmetric and asymmetric fission. The presence of asymmetric fission suggests the role of nuclear shell effects at the studied energies. In ref.[30], it has been reported that the mass-yield distribution of 220Ra consists of one symmetric and two asymmetric components at excitation energy E* = 118.83 MeV. In a comprehensive study by Schmidt . [21], the phenomenon of fission has been investigated by measuring the fission fragment nuclear charge distributions, e.g., 209-219Ra. In this study, it has been concluded that the transition from symmetric to asymmetric fission occurs around 214Ra, 215-219Ra isotopes display measurable asymmetric components. It may not be out of order to mention that the mass distribution presented in this work shows the similarity with neighboring Ra isotopes. However, the mass distribution of fission fragments is not exhaustive due to the limitation of the experimental technique used in the present work.

In nuclear reactions where the compound nucleus is formed with excitation energy (E*) well above the fission barrier, the input angular momentum () strongly influences the mass distribution of the fission fragments. As the angular momentum increases, the saddle point becomes compact, lowering the fission barrier. This reduction in fission barrier height increases the fission probability at a particular excitation energy. The fission dynamics are significantly impacted by the predominant direction of mass flow within the dinuclear system. As reported in the literature [42, 43, 44], if the mass asymmetry () is greater than the Businaro-Gallone critical mass asymmetry (BG) [45], mass flows from the projectile to the target, leading to the formation of the compound nucleus which may eventually decay via the process of fission. If the value of , the mass flow occurs from the target to the projectile, and a dinuclear system is formed, decaying before equilibrating in all degrees of freedom. For 12C + 208Pb system, the critical mass asymmetry () is 0.86. In contrast, the mass asymmetry () is 0.89, i.e., , resulting in the occurrence of fission via compound nucleus formation path.
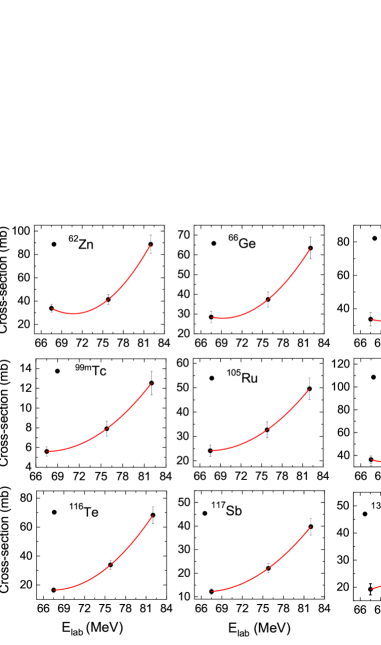
Further, to understand how the probabilities of the individual fission fragments change with the incident projectile energies, the cross-sections of fission fragments common at Elab = 81.9, 75.8, and 67.5 MeV energies have been plotted as a function of incident energies. Fig. 5 shows the excitation function of 9 fission fragments, i.e., 62Zn, 66Ge, 70As, 99mTc, 105Ru 110In, 116Te, 117Sb and 134I produced in 12C+208Pb system. As seen from this figure, the cross-sections of all fission fragments increase with energy, indicating the higher production probabilities of these residues at higher excitation energies, as expected.
4.2 Isotopic yield distribution
In heavy composite systems, the emission of neutrons competes with the process of fission, particularly at moderate excitation energies. However, the emission of charged particles faces a significant challenge due to the presence of the Coulomb barrier. As a result, neutron emission becomes a competitive process against fission. The emission of nucleons from the primary fission fragments and/or the fission of precursors of the fission-decay chains can lead to isotopic and isobaric yield distributions of the fission residues. The fact that neutron emission is more probable than proton emission results in the observation of different isotopes in most cases. An isotopic chain can arise from the sequential evaporation of neutron(s) from fission fragments, yielding a fission product with a fixed atomic number and mass number .
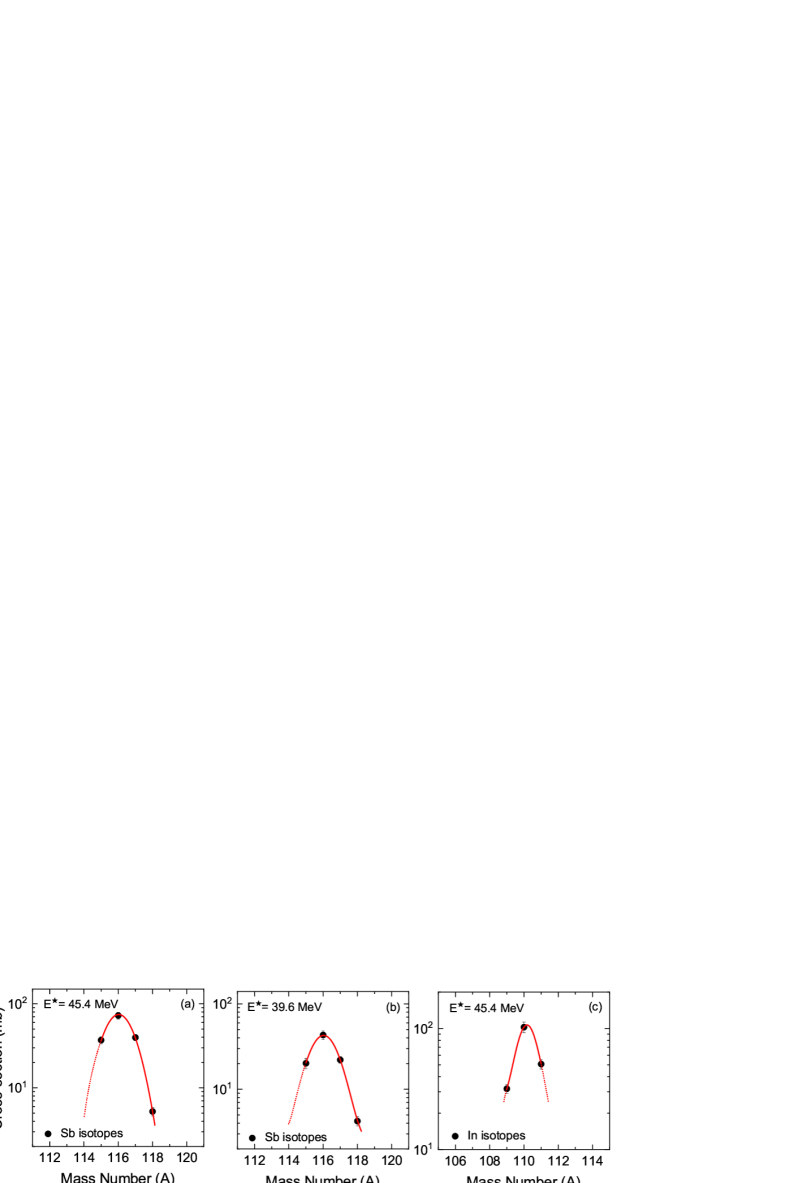
Four isotopes of antimony (115,116m,117,118mSb) and three isotopes of indium (109,110,111In) have been identified at E⋆ = 45.4 and 39.6 MeV, and at E⋆ = 45.4 MeV, respectively. The experimentally measured yields of Sb and In isotopes have been analyzed as per the prescription presented in Ref. [46] to achieve isotopic yield distribution and to obtain the charge distribution parameters. In the case of Sb, the two isomers are high spin relative to the ground spin; the cross-section of the high spin isomer has been measured, or the high spin isomer completely decayed to the low spin isomer through IT (Isomeric Transition). The measured yields of the Sb isotopes have been approximated as the total cross-section of the respective isotopes. The parameters of isotopic yield distribution, e.g., most probable mass p and the width parameter , for antimony and indium isotopes at E⋆ = 45.4 and 39.6 MeV were obtained by fitting a Gaussian function to their respective yields, and are shown in Figs. 6(a)- 6(c), respectively. The values of most probable mass p for antimony isotopes at excitation energy E⋆ = 45.4 and 39.6 MeV estimated to be 116.027 0.014 and 116.029 0.008 MeV, and the width parameters for isotopic yield distribution are estimated to be 1.711 0.012 and 1.628 0.005, respectively. For indium isotopes, the values of p and at E⋆ = 45.4 MeV is found to be 110.178 0.005 and 1.113 0.008. The uncertainties in these estimated parameters are the fitting errors. The values of p and 2 of Sb and In isotopes at E⋆ = 45.4 and 39.6 MeV are reported in Table 4.
| E⋆ | Isotope | Most Probable mass | Isotopic width |
|---|---|---|---|
| (MeV) | p | 2 | |
| 45.4 | Sb | 116.027 0.014 | 3.422 |
| 39.6 | Sb | 116.029 0.008 | 3.256 |
| 45.4 | In | 110.178 0.005 | 2.226 |
| System | E⋆ (MeV) | Isotope | Ref. | |
| 12C + 208Pb | 45.4 | Sb | 2.93 | a |
| 12C + 208Pb | 39.6 | Sb | 2.65 | a |
| 12C + 208Pb | 45.4 | In | 1.24 | a |
| 20Ne + 208Pb | 46.4 | Sb | 3.43 | [35] |
| 20Ne + 208Pb | 46.4 | I | 3.95 | [35] |
| 7Li + 232Th | 41.7 | Sb | 4.08 | [47] |
| 7Li + 232Th | 41.7 | I | 3.96 | [47] |
| 11B + 232Th | 55.7 | Sb | 4.0 | [48] |
| 11B + 232Th | 55.7 | I | 5.43 | [48] |
| 11B + 238U | 67.4 | Rb | 3.84 | [49] |
| 11B + 238U | 67.4 | Cs | 3.95 | [49] |
| 22Ne + 238U | 64.5 | Rb | 4.23 | [49] |
| 22Ne + 238U | 64.5 | Cs | 4.26 | [49] |
| 16O + 169Tm | 61.0 | Tc | 4.62 | [50] |
| 16O + 169Tm | 61.0 | In | 4.24 | [50] |
| 12C + 169Tm | 68.6 | Kr | 3.900.20 | [46] |
| 12C + 169Tm | 68.6 | Tc | 3.270.18 | [46] |
| 19F + 169Tm | 69.4 | Nd | 4.920.80 | [51] |
| 19F + 169Tm | 69.4 | In | 4.491.10 | [51] |
| aPresent work |
| Target | Projectile | Isotope | ||
|---|---|---|---|---|
| 208Pb | 20Ne | Sb | 0.82 | 3.43 |
| 208Pb | 12C | Sb | 0.89 | 2.92 |
| 238U | 22Ne | Rb | 0.83 | 4.23 |
| 238U | 11B | Rb | 0.91 | 3.84 |
| 238U | 22Ne | Cs | 0.83 | 4.26 |
| 238U | 11B | Cs | 0.91 | 3.95 |
| 232Th | 11B | I | 0.91 | 5.43 |
| 232Th | 7Li | I | 0.94 | 3.96 |
| 169Tm | 16O | Tc | 0.83 | 4.62 |
| 169Tm | 12C | Tc | 0.87 | 3.27 |
| 169Tm | 19F | In | 0.80 | 4.49 |
| 169Tm | 16O | In | 0.83 | 4.24 |
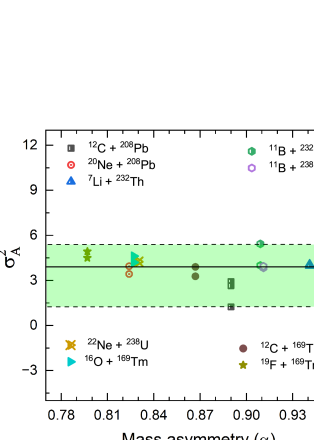
The variance parameter () for Sb isotopes at excitation energy E⋆ = 45.4 and 39.6 MeV is found to be 2.93 and 2.65, and for In isotopes is found to be 1.24 at E⋆ = 45.4 MeV, respectively. The value of for several other systems at comparable excitation energies is shown in Table 5 along with the present system. As can be noticed from this table, the value of for the present system agrees reasonably well with those reported in the literature. For better insights into the spread of isotopes in different systems (given in Table 5), the value of variance parameter () of different isotopes and the mass-asymmetry parameter () for various projectile-target combinations are plotted in Fig. 7. As shown in this figure, the value of variance for these isotopes falls within a range of width 4.13. The average value of the variance parameter is found to be 3.86, suggesting the involvement of fusion-fission dynamics in the population of Sb and In isotopes. It is in line with the observations reported in the literature. The data presented in Table 6 suggests the higher value of variance parameter () for less mass-asymmetric systems for the same target.
4.3 Isobaric yield distribution
Charge distribution describes how the nuclear charge is distributed between the two complimentary fission fragments for a given projectile-target combination undergoing fission. To obtain such distribution, it is essential to determine the most probable atomic number (p) for the fission product with the highest yield among all the products of a given mass chain and the fractional yield (FY). The value of FY for an isotope is calculated by dividing the yield of the isotope by the total yield of the mass chain to which it belongs. The most probable charge p for a given isotopic distribution can be calculated using a formula based on the Unchanged Charge Distribution (UCD) hypothesis [52] as,
| (1) |
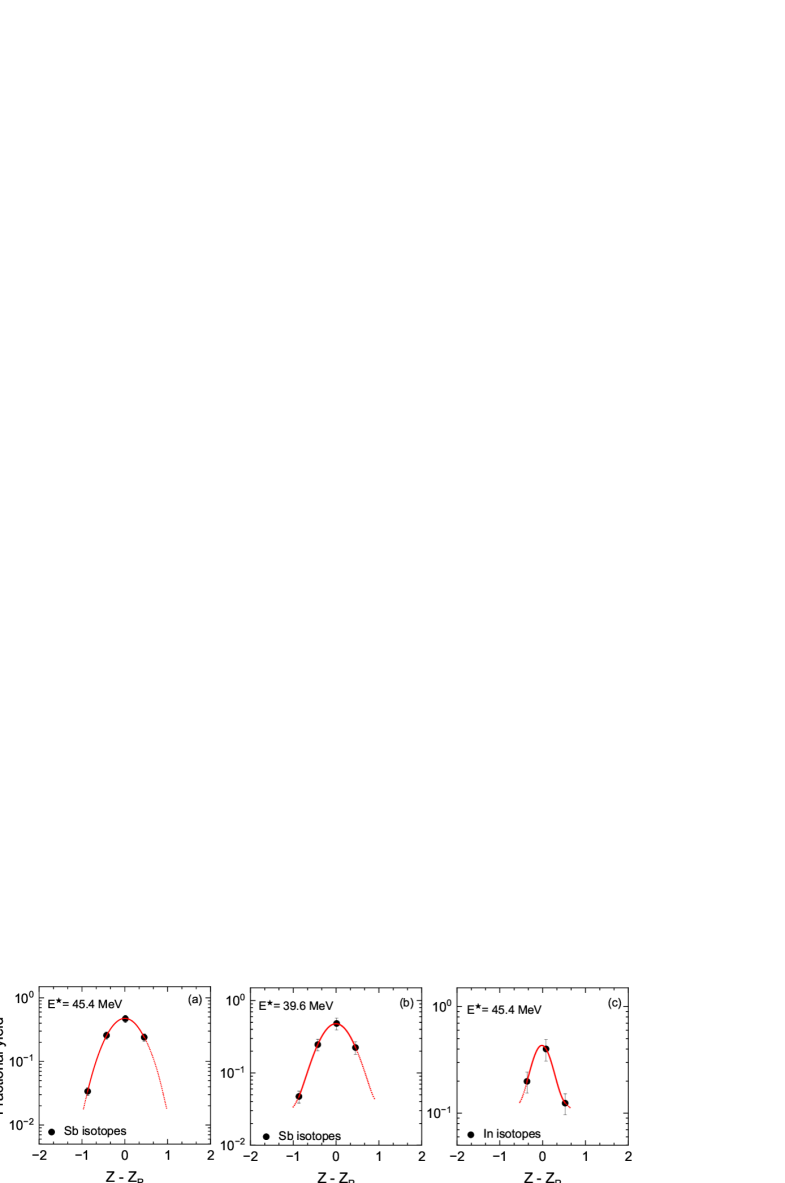
where and represent the charge and mass of the fission fragment, respectively, while p signifies the most probable mass. The value of FY, obtained by normalizing experimentally determined yields, of Sb at E⋆ = 45.4 and 39.6 MeV, and In at E⋆ = 45.4 MeV, are plotted as a function of charge corrected isotopic fragments ( - p) in Figs. 8(a)- 8(c), respectively. The charge dispersion parameter obtained from the Gaussian fit to the data for Sb is estimated to be 0.769 and 0.714 at E⋆ = 45.4 and 39.6 MeV, respectively. For In isotopes, the value of is estimated to be 0.430 at E⋆ = 45.4 MeV.
Additionally, the charge dispersion parameter () has been calculated by converting the variance parameter () of isotopic yield distribution into () using the formulation given below,
| (2) |
The values of obtained for different isotopes as a function of energy are reported in Table 7. As can be seen from this table, the values of obtained from the analysis of charge distribution data presented in Figs. 8(a)- 8(c) and the one calculated from the above formulations, are found to be in good agreement, indicating the self-consistency of the approaches used in the present analysis.
| E⋆ | Isotope | z | z |
|---|---|---|---|
| (MeV) | From Figs. 8(a)- 8(c) | From Eq.(2) | |
| 45.4 | Sb | 0.769 | 0.752 |
| 39.6 | Sb | 0.714 | 0.715 |
| 45.4 | In | 0.430 | 0.495 |
Additionally, the charge dispersion parameter () has been calculated by converting the variance parameter () of isotopic yield distribution into () using the formulation given below,
| (3) |
The values of obtained for different isotopes as a function of energy are reported in Table 7. As can be seen from this table, the values of obtained from the analysis of charge distribution data presented in Figs. 8(a)- 8(c) and the one calculated from the above formulations, are found to be in good agreement, indicating the self-consistency of the approaches used in the present analysis.
5 Summary and conclusions
The production cross-sections of various fission fragments populated in the 12C+208Pb system have been measured at E⋆ = 45.4, 39.6, and 31.8 MeV. The mass distribution of fission fragments has been studied at different excitation energies to investigate the dispersion of fission fragments. The presence of asymmetric fission suggests the role of nuclear shell effects in the studied excitation energies. The mass distribution data have been analyzed to obtain the isotopic and isobaric yield distributions of antimony (Sb) and indium (In) isotopes. It has been found that a single Gaussian function effectively explains the isotopic yield distributions for Sb and In isotopes. The derived mass and charge dispersion parameters agree reasonably well with the experimental values reported in the literature for other fissioning systems. The values of variance for many such distributions in literature and obtained in the present study for Sb and In fall within a narrow range of width 4.13. The data analysis further indicates that the entrance-channel mass asymmetry significantly affects the variance of isotopic yield distribution. The isobaric distribution has been obtained for Sb and In isotopes from the analysis of their experimental yields to get the charge dispersion parameter . The value of for Sb was found to be 0.769 and 0.714 at E⋆ = 45.4 and 39.6 MeV, respectively. For In isotopes, was found to be 0.430 at E⋆ = 45.4 MeV. These values of show a good agreement with the values of calculated by substituting the obtained isotopic distribution parameter in theoretical expression. The agreement between these values shows the self-consistency of the present analysis and the experimental data. In the present study, medically important 99mTc and 111In isotopes with decent production probability have been observed. As such, the fission of excited 220Ra nuclei may provide an alternative path to producing 99mTc and 111In isotopes for application in radio medicine. For better insights into the fission dynamics of 220Ra, an online experiment to measure the neutron multiplicity is in order.
Acknowledgements
The authors acknowledge the Inter-University Accelerator Centre, New Delhi, for the necessary facilities to perform these measurements, the Pelletron crew for hassle-free delivery of 12C beams throughout the run, and the Indian Institute of Technology Ropar for a grant to procure the enriched target material for this experiment. One of the authors, RK, thanks the University Grant Commission (UGC) in New Delhi, India, for a doctoral fellowship. Another author, MKS, thanks the DST, Delhi, India, for the financial support under the SERB-SURE grant.
References
References
- [1] Wagemans C 1991 The nuclear fission process
- [2] Manjunatha H and Sridhar K 2017 Nuclear Physics A 962 7–23
- [3] Kozulin E M, Knyazheva G N, Itkis I M, Itkis M G et al. 2014 Phys. Rev. C 90 054608
- [4] Bowman C D 1998 Annual Review of Nuclear and Particle Science 48 505–556
- [5] Bohr N and Wheeler J A 1939 Phys. Rev. 56 426
- [6] Manohar S B, Goswami A and Tomar B S 1996 J. Radioanal. Nucl. Chem. 203 331–351
- [7] Oganessian Y T, Yeremin A V et al. 1999 Nature (London) 400 242–245
- [8] Strutinsky V M 1967 Nucl. Phys. A 95 420–442
- [9] Möller P and Nilsson S G 1970 Phys. Lett. B 31 283–286
- [10] Wilkins B D, Steinberg E P and Chasman R R 1976 Phys. Rev. C 14 1832
- [11] Andreyev A N, Nishio K and Schmidt K H 2017 Reports on Progress in Physics 81 016301
- [12] Chaudhuri A, Ghosh T, Banerjee K, Bhattacharya S, Sadhukhan J, Bhattacharya C, Kundu S, Meena J, Mukherjee G, Pandey R et al. 2015 Physical Review C 91 044620
- [13] Swiatecki W J 1981 Phys. Scr. 24 113
- [14] Gregoire C, Ngô C and Remaud B 1981 Phys. Lett. B 99 17–22
- [15] Hinde D J, Dasgupta M, Leigh J R, Lestone J P, Mein J C, Morton C R, Newton J O and Timmers H 1995 Phys. Rev. Lett. 74 1295
- [16] Ghosh T K, Pal S, Golda K S and Bhattacharya P 2005 Phys. Lett. B 627 26–31
- [17] Vandenbosch R and Huizenga J 1973 New York and London
- [18] Fairhall A W 1956 Physical Review 102 1335
- [19] Itkis M G, Itkis I M, Kozulin E M, Kondratiev N A, Oganessian Y T, Pokrovski I V, Prokhorova E V, Sagaidak R N, Voskressenski V M, Yeremin A V et al. 2002 Dynamical Aspects Of Nuclear Fission (World Scientific) pp 177–184
- [20] Pokrovsky I V, Calabretta L, Itkis M G, Kondratiev N A, Kozulin E M, Maiolino C, Prokhorova E V, Rusanov A Y and Tretyakova S P 1999 Phys. Rev. C 60 041304
- [21] Schmidt K H, Steinhäuser S, Böckstiegel C, Grewe A, Heinz A, Junghans A, Benlliure J, Clerc H G, De Jong M, Müller J et al. 2000 Nuclear Physics A 665 221–267
- [22] Chizhov A Y, Itkis M G, Itkis I M, Kniajeva G N, Kozulin E M, Kondratiev N A, Pokrovsky I V, Sagaidak R N, Voskressensky et al. 2003 Phys. Rev. C 67 011603
- [23] Andreyev A N, Elseviers J, Huyse M, Van Duppen P, Antalic S, Barzakh A et al. 2010 Phys. Rev. Lett. 105 252502
- [24] Andreev A V, Adamian G G, Antonenko N V and Andreyev A N 2013 Phys. Rev. C 88 047604
- [25] McDonnell J D, Nazarewicz W, Sheikh J A, Staszczak A and Warda M 2014 Phys. Rev. C 90 021302
- [26] Schmidt K H, Jurado B, Amouroux C and Schmitt C 2016 Nuclear Data Sheets 131 107–221
- [27] Scamps G and Simenel C 2019 Phys. Rev. C 100 041602
- [28] Nishio K, Ikezoe H, Nagame Y, Asai M, Tsukada K, Mitsuoka S, Tsuruta K, Satou K, Lin C J and Ohsawa T 2004 Phys. Rev. Lett. 93 162701
- [29] Prasad E, Hinde D J, Dasgupta M, Jeung D Y, Berriman A C, Swinton-Bland B M A, Simenel C, Simpson E C, Bernard R, Williams E et al. 2020 Physics Letters B 811 135941
- [30] Karapetyan G S, Deppman A, Guimaraes V, Balabekyan A and Demekhina N A 2016 Phys. Rev. C 94 024618
- [31] Miernik K, Korgul A, Poklepa W, Wilson J, Charles G, Czajkowski S, Czyż P, Fijałkowska A, Fraile L, Garczyński P et al. 2023 Phys. Rev. C 108 054608
- [32] Raman S, Nestor Jr C and Tikkanen P 2001 Atomic Data and Nuclear Data Tables 78 1–128
- [33] Cohen S, Plasil F and Swiatecki W 1974 Ann. Phys. (N. Y.) 82 557–596
- [34] Itkis M G et al. 1995 European Physical Society XV Nuclear Physics Divisional Conference on Low Energy Nuclear Dynamics (World Scientific, Singapore) p 177
- [35] Tripathi R, Sudarshan K, Goswami A, Pujari P K, Tomar B S and Manohar S B 2004 Phys. Rev. C 69 024613
- [36] Amanjot, Kaur R, Kumar S and Singh P P 2024 Vacuum 226 113287
- [37] SRIM06 http://www.srim.org/
- [38] Ajith Kumar B P, Subramaniam E and Bhowmik R K 2001 DAE SNP, Kolkata (Private communication)
- [39] 2023 National nuclear data centre https://www.nndc.bnl.gov/nudat3/
- [40] Chu S Y F, Ekstrom L and Firestone R 1999 Lawrence Berkeley National Laboratory http://nucleardata.nuclear.lu.se/toi/
- [41] Gupta U, Singh P P, Singh D P, Sharma M K, Yadav A, Kumar R, Singh B P and Prasad R 2008 Nucl. Phys. A 811 77–92
- [42] Ramamurthy V S, Kapoor S S, Choudhury R K, Saxena A, Nadkarni D M, Mohanty A K, Nayak B K, Sastry S V, Kailas S, Chatterjee A et al. 1990 Phys. Rev. Lett. 65 25
- [43] Kailas S, Mahata K, Thomas R and Kapoor S 2007 Nucl. Phys. A 787 259–266
- [44] Prasad E, Varier K M, Thomas R G, Sugathan P, Jhingan A, Madhavan N, Babu B R S, Sandal R, Kalkal S, Appannababu S et al. 2010 Phys. Rev. C 81 054608
- [45] Abe M 1986 KEK TH-28
- [46] Sood A, Singh P P, Sahoo R N, Kumar P, Yadav A, Sharma V R, Shuaib M, Sharma M K, Singh D P, Gupta U et al. 2017 Phys. Rev. C 96 014620
- [47] Tripathi R, Sudarshan K, Sodaye S, Tomar B S, Gubbi G K, Goswami A, Reddy A V R and Manohar S B 2002 Radiochimica Acta 90 185–191
- [48] Gubbi G K, Goswami A, Tomar B S, Ramaswami A, Reddy A V R, Burte P P, Manohar S B and John B 1999 Phys. Rev. C 59 3224
- [49] de Saint-Simon M, Lessard L, Reisdorf W, Remsberg L et al. 1976 Phys. Rev. C 14 2185
- [50] Singh P P, Singh B P, Sharma B, Unnati, Sharma M K, Prasad R, Kumar R and Bhardwaj H 2008 Int. J. Mod. Phys. E 17 549–566
- [51] Shuaib M, Sharma V R, Yadav A, Thakur S, Sharma M K et al. 2019 Phys. Rev. C 99 024617
- [52] Reisdorf W, de Saint-Simon M, Remsberg L, Lessard L, Thibault C, Roeckl E and Klapisch R 1976 Phys. Rev. C 14 2189