Loki††thanks: In the Norse mythology, Loki is considered a trickster and mischievous god/goddess, known for being neither fully good nor evil since his/her main aim was always to create chaos.: an ancient system hidden in the Galactic plane?
We analyse high-resolution ESPaDOnS/CFHT spectra of 20 very metal-poor stars ([Fe/H] ) in the solar neighbourhood (within kpc) selected to be on planar orbits (with a maximum height of kpc). Targets include 11 prograde and 9 retrograde stars, spanning a wide range of eccentricities (). Their chemical abundances are consistent with those observed in the Galactic halo but show a smaller spread, with no notable difference between progrades and retrogrades. This suggests a common chemical evolution and likely a shared formation site (except for one star). In this case, chemical evolution models indicate that the formation site would have had a baryonic mass of , similar to classical dwarf galaxies. High-energy supernovae and hypernovae are needed to reproduce the [X/Fe] up to the Fe-peak, while fast-rotating massive stars and neutron star merger events explain the [X/Fe] of the neutron-capture elements. The absence of Type Ia supernova signatures suggests a star formation duration of Gyr. Cosmological zoom-in simulations support the scenario that an in-plane infall of a single system could disperse stars over a wide range of angular momenta during the early Galactic assembly. We propose that these stars originated in a proto-Galactic building block, which we name Loki. Less likely, if progrades and retrogrades formed in two different systems, their chemical evolution must have been very similar, with a combined baryonic mass twice that of a single system. The low number of targets and their limited metallicity range prevent us to exclude if these stars share a common progenitor with other detected structures, like Gaia-Sausage-Enceladus. A comparison (primarily [/Fe]) with other VMPs moving in planar orbits suggests multiple systems contributed to the Galactic planar population, presenting some differences in their kinematical parameters.
Key Words.:
Galaxy: formation - Galaxy: evolution - stars: abundances - stars: kinematics and dynamics - stars: Population III - stars: Population II1 Introduction
A way to understand the Galactic chemical and assembly history is to study the relics from those early epochs, these are assumed to be the most metal-poor stars (Freeman & Bland-Hawthorn, 2002; Tolstoy et al., 2009; Tumlinson, 2010; Wise et al., 2012). Cosmological simulations suggest that the most metal-poor stars formed within Gyr from the Big Bang in low-mass systems, often called the building blocks of Milky Way-like galaxies (e.g., Starkenburg et al., 2017b; El-Badry et al., 2018; Sestito et al., 2021). These building blocks merged together at early epochs, dispersing their stellar, gaseous, and dark matter content into the forming proto-Galaxy. Therefore, the most metal-poor stars coming from the early Galactic assembly are supposed to populate the inner regions of the Milky Way, while those accreted later might be dispersed in the outer halo (Bullock & Johnston, 2005; Tissera et al., 2012; Starkenburg et al., 2017b).
These expectations are consistent with observations from various all-sky surveys, e.g., SDSS (York et al., 2000) and LAMOST (Cui et al., 2012), and from dedicated metal-poor surveys, e.g., Pristine (Starkenburg et al., 2017a; Martin et al., 2023) and SkyMapper (Da Costa et al., 2019). Some of the most metal-poor stars have been serendipitously discovered in all-sky surveys (e.g., Caffau et al., 2011; Li et al., 2015), although they are extremely rare objects (Youakim et al., 2017) hidden in a haystack of metal-rich and younger stars. To weed out the contamination, dedicated metal-poor star-finding surveys use a metallicity-sensitive filter that includes the Ca HK spectral lines which, in combination with other broad-band filters, can be used to estimate a photometric [Fe/H]111[Fe/H], in which is the number density of element X.. SkyMapper uses a v-filter, while Pristine has a narrow-band filter centred on the Ca HK lines. In both cases the two surveys reach a very high-efficiency in discovering the most metal-poor stars (Da Costa et al., 2019; Aguado et al., 2019). More recently and with strategies similarly based on narrow filters, J-Plus (Cenarro et al., 2019) and S-Plus (Almeida-Fernandes et al., 2022) are discovering and investigating new low-metallicity stars in the Milky Way (e.g., Galarza et al., 2022; Placco et al., 2022; Perottoni et al., 2024).
A long-debated question in Galactic studies is whether the MW disc extends to the very metal-poor regimes (VMP, , Bonifacio et al., 1999; Beers et al., 2002; Kordopatis et al., 2013). The synergy of ground-based high-resolution spectroscopy, astrometry from Gaia, and cosmological zoom-in simulations can help to shed light into this question. Cosmological simulations suggest that VMP stars should be dispersed in a pressure-supported spheroidal distribution (a.k.a. the halo, El-Badry et al., 2018), although the halo might naturally overlap with the disc in terms of space and kinematics, thus providing a similar contribution of prograde and retrograde stars.
VMPs with precise astrometric information were scarce before Gaia DR2 (Gaia Collaboration et al., 2016, 2018). It is now possible to complement the chemical information with precise astrometry, needed to derive distances and kinematical properties of the stars. The orbital properties are a useful tool to unveil the multitude of the accreted systems that concurred to form the Milky Way (MW) as we know it nowadays (e.g., Helmi, 2020; Horta et al., 2023). Sestito et al. (2019) discovered that percent of the known ultra metal-poor stars (UMP, ) have kinematics confined to the MW plane (with a maximum height of ), with 10 stars in prograde and only one in retrograde orbits. Among the ones in prograde motion, two are on nearly circular orbits (see also Schlaufman et al., 2018; Mardini et al., 2022a; Dovgal et al., 2024), and the most metal-poor star known (SDSS J102915+172927, Caffau et al., 2011) is one of these two. To answer if this kinematical signature is also present at metallicities , Sestito et al. (2020) gathered the VMPs in the solar neighbourhood from the LAMOST survey and from Pristine targets with measured radial velocity (Aguado et al., 2019), for a total of stars. They found that the majority of the stars are distributed in the halo; however, one third of VMPs are confined to the plane. Of these stars, prograde motion is favoured (Sestito et al., 2020). Similar results have also been reported by the SkyMapper survey (Cordoni et al., 2021), also showing that the [/Fe] ratios are compatible with the halo. Using the stars observed in the ESO Large Program ”First stars program” (Cayrel et al., 2004; Bonifacio et al., 2009), Di Matteo et al. (2020) confirm that stars in planar orbits exist at all metallicities, suggesting that the dissipative collapse that led to the formation of the old and metal-poor Galactic disc must have been extremely fast.
Both Sestito et al. (2019) and Sestito et al. (2020) propose that the prograde and retrograde planar stars might have originated in the building blocks of the proto-MW or in a system accreted later during the MW history, while the prograde ones might also be the tracers of the MW disc’s very metal-poor tail. The origin of the prograde planar population have been investigated also with the latest Gaia DR3 (Gaia Collaboration et al., 2023), since it is also releasing metallicities and radial velocities for million of stars. Within the Pristine survey, Viswanathan et al. (2024b) found that the prograde region with low vertical angular momentum is overdense with a significance of more than its retrograde counterpart. Zhang et al. (2024) found that the disc, as a major component, does not extend to the VMP regime, but, rather, that the VMP prograde planar population is part of the rotating halo. On a different conclusion, Bellazzini et al. (2024) and González Rivera de La Vernhe et al. (2024) propose that the angular momentum distribution of the prograde planar stars is similar to the more metal-rich disc and it might be of in-situ origin. González Rivera de La Vernhe et al. (2024) discuss that this prograde planar population bears some of the properties that are classically associated with a thick disc, i.e., its spatial distribution compatible with a short-scaled thick disc and its presence even in case of assuming a rotating prograde halo. Moreover, Fernández-Alvar et al. (2021) found a population of VMP towards the Galactic anticentre that would be compatible with the MW thin disc, and Fernández-Alvar et al. (2024) corroborate it in all directions. Recently, Nepal et al. (2024) derived stellar ages and distances for stars showing that the metal-poor ones with orbits compatible with the thin disc are in fact old, i.e., Gyr.
With high-resolution cosmological zoom-in simulations, NIHAO-UHD (Buck et al., 2020) and FIRE (Hopkins et al., 2018), Sestito et al. (2021) and Santistevan et al. (2021), respectively, investigated the potential formation sites of this VMP planar population. Both suites of simulated galaxies provide similar results. During the early Galactic assembly, the merging of the first building blocks scattered the stars in all kinematical configurations, given the shallow gravitational potential of the forming proto-galaxies. Once the proto-Galaxy grew and the Galactic disc started to form, later accreted systems deposited their stars mainly in the halo or, in some cases, into the plane in a prograde fashion by dynamical friction (Abadi et al., 2003; Sestito et al., 2021; Santistevan et al., 2021). In this picture, the retrograde planar stars can only originate from the early MW assembly phase. In these simulations, the disc is detectable after the formation of these stars, hence these VMP planar stars are not part of the VMP tail of the simulated disc. Recently, Sotillo-Ramos et al. (2023) used the TNG50 cosmological simulations (Pillepich et al., 2019; Nelson et al., 2019) with a similar intent as the previous works. They found that the origin of the prograde planar population can also be attributed to in-situ formation. However, a complete census of detailed chemical abundances is still lacking in the literature. Having a better understand of the chemical properties of these stars would be beneficial to understand the merging history of the Galaxy, as well as the chemical evolution of the oldest part of the disc, as well as the chemical properties of the first generations of stars.
In this work, we investigate the chemical properties of VMP planar stars selected from Sestito et al. (2020) and observed with the ESPaDOnS high-resolution spectrograph at the Canada-France-Hawaii Telescope (CFHT). This sample is composed of 11 prograde and 9 retrograde stars. We want to highlight that the sample spans a wide range of eccentricities, therefore, is not strictly focusing on stars with quasi-circular orbits. The paper is organised as follows, Section 2 describes the observations and their reduction; the calculation of the astrometric distances and orbital parameters are in Section 3; the model atmosphere analysis is described in Section 4; the comparison of the [X/Fe] between these targets and the MW halo and the discussion that these targets formed in the same formation site are discussed in Section 5; Section 6 discusses the chemical evolution of the formation site of these targets, which we dubbed Loki, using observational diagnostics and chemical evolution models; Section 7 shows that Loki is most likely of accreted nature and it might not be connected to systems discovered so far, although we cannot rule out the possibility that Loki is the VMP and low-energy tail of Gaia-Sausage-Enceladus. Additionally, we show that several systems are needed to account for the large spread of [/Fe] in the population of planar stars analysed so far in the literature. A summary of our findings is reported in Section 8.
2 Target selection and spectral reduction
Targets used in this work were selected from Sestito et al. (2020), which combines very metal-poor stars (VMP, ) from the Pristine (Starkenburg et al., 2017a; Aguado et al., 2019) and LAMOST (Zhao et al., 2012) surveys. The initial sample of stars has been selected using the action space of Figure 1 in Sestito et al. (2020) (vertical vs rotational motion), and include stars that do not venture farther out from the Milky Way plane (Z) in prograde and retrograde orbits. The second selection is based on the brightness, mag, to reach a high signal-to-noise ratio (SNR) in the blue region within a reasonable exposure time at ESPaDOnS/CFHT. Given this restriction on magnitudes, only stars from the LAMOST catalogue have been observed, given stars from Pristine reported in Sestito et al. (2020) are mostly fainter than G mag (Aguado et al., 2019). Although the prograde planar stars are more numerous than the retrograde counterpart (Sestito et al., 2020), the final selection is composed of an equal number of stars from the two populations.
The selected objects have been observed in semesters 2021B, 2022A, and 2022B (21BC23, 22AC37, and 22BC14, PI: F. Sestito) with the ESPaDOnS high-resolution spectrograph at the Canada-France-Hawaii Telescope (CFHT), which cover the Å spectral region. Objects have been observed with the starsky mode with a resolution of . 2021B observations were carried out in Snapshot mode, leading to only 2 observed stars. Observations for the 2022A and 2022B semesters were carried out in regular mode, and the spectra of 9 stars were acquired during each semester. Therefore, the observed sample is composed of 20 unique stars. Spectra observed in Snapshot mode have a slightly lower SNR than the other data, given the lower quality of the sky conditions, which results in fewer species/lines measured in the bluest part of the spectrum. A SNR per CCD pixel bin of in the Ba ii 455 nm region was requested to ensure precision measurements of the equivalent width of elements such as Sr (e.g., nm), Ba (e.g., nm), Mn (e.g., nm), and Eu (e.g., nm). This SNR permits a precision of dex in the [X/Fe] ratios.
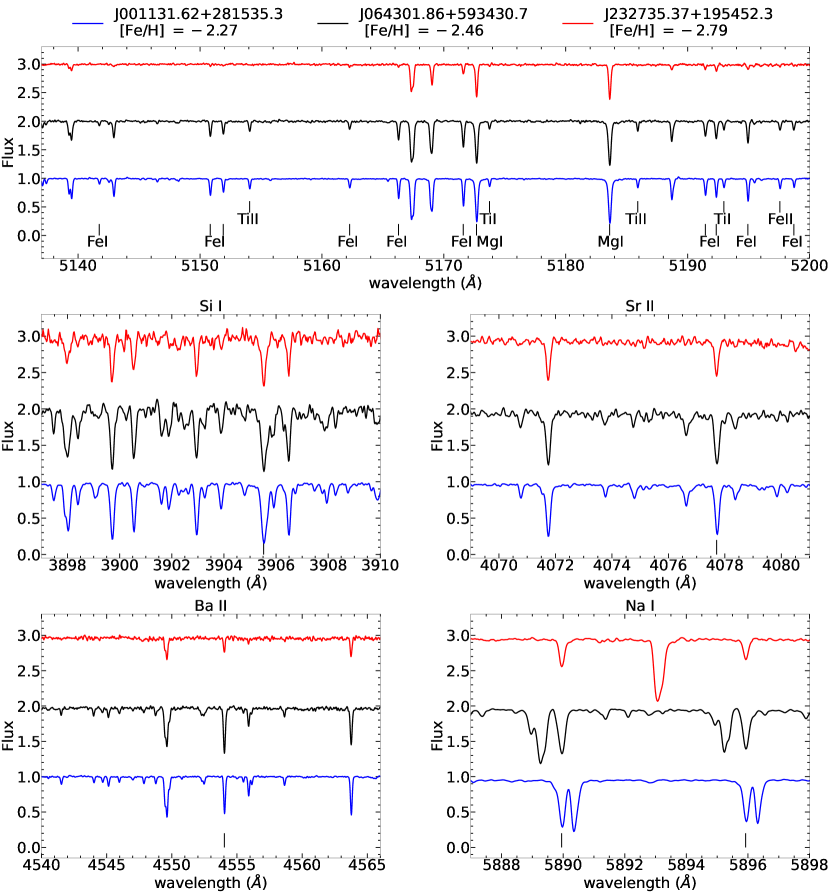
ESPaDOnS spectra are reduced using the LIBRE-ESPIRIT222https://www.cfht.hawaii.edu/Instruments/Spectroscopy/Espadons/Espadons_esprit.html pipeline, which includes bias subtraction, flat fielding, wavelength calibration, spectral extraction, and barycentric corrections. A second reduction and optimisation of the spectra was carried out using a dedicated pipeline (Lucchesi et al., 2022). The pipeline isolates and extracts the échelle orders, then it selects the regions with the highest SNR between the overlapping regions of the orders. The orders are then re-combined and re-normalised. Radial velocities, RV, have been measured with fxcor in IRAF (Tody, 1986, 1993) and the spectra are corrected accordingly. Multiple exposures of the same target have been combined together and the combined spectrum has been downgraded to resolution (see Lucchesi et al., 2022, for further details). A table containing the coordinates, the Gaia info, the RV, and the measured SNR is reported as online material. Panels in Figure 1 show the high-quality spectra of three stars in various regions, namely the Mg Triplet (Å, top panel), the Si i Å (central left), the Sr ii Å (central right), the Ba ii Å (bottom left), and the Na i Doublet Å (bottom right).
3 Distances and orbital parameters
Distances are calculated using the exquisite Gaia DR3 parallaxes in a Bayesian fashion. The posterior, or the probability distribution function, is obtained by multiplying the Gaussian likelihood on the parallax times a Galactic stellar density distribution prior (see Sestito et al., 2019, for further details). The zero point offset has been applied to the Gaia DR3 parallaxes (Lindegren et al., 2021) using the python gaiadr3_zeropoint333https://gitlab.com/icc-ub/public/gaiadr3_zeropoint package.
The kinematical information has been updated from Gaia DR2 to Gaia DR3 values, including new astrometric distance and new radial velocities measured from ESPaDonS spectra. Orbital parameters are inferred using galpy (Bovy, 2015) and adopting the same Galactic gravitational potential as in Sestito et al. (2019). The potential is a modified version of MWPotential2014 with an increased dark matter halo mass of (Bland-Hawthorn & Gerhard, 2016). Monte Carlo simulations have been used to generate uncertainties on the orbital parameters from the input parameters (distance, RV, proper motion, coordinates), drawing them from Gaussian distributions for 1000 times. The median and the standard deviation are used as the measurement of an orbital quantity and its uncertainty.
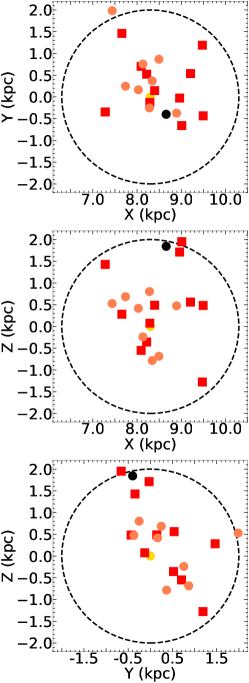
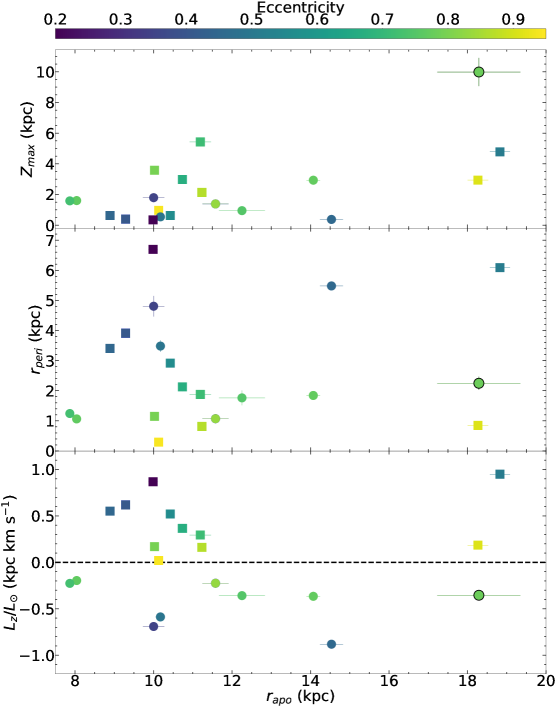
The current Galactocentric positions of these stars are displayed on the left panels of Figure 2. The maximum height from the plane , the angular momentum (normalised by the Sun’s value) and the Galactic pericentric distance are displayed in the right panels of Figure 2 as a function of the Galactic apocentric distance . While the current position of these stars is within kpc from the Sun, 11 of them reach the inner Galactic region ( kpc from the Galactic centre) at their pericentric passage, while the apocentric distance spans a range from to kpc. The eccentricities of these stars span a range from to . The majority of the stars reaches a maximum height from the plane kpc, with one kinematical outlier in at kpc, J110847.18253047.2 (black circle in Figure 2). This object is also the only star with a large uncertainty on the radial velocity (vs ). The stars with prograde and retrograde motion are 11 and 9, respectively. While these stars were selected to have , the updated astrometry from Gaia DR3 and the new RV from high-resolution spectra lead to higher for some stars. However, we will discuss in Section 5 that J110847.18253047.2 is the only chemical outlier. The kinematical properties and heliocentric distances are reported as online table only.
4 Model Atmosphere analysis
4.1 Stellar parameters
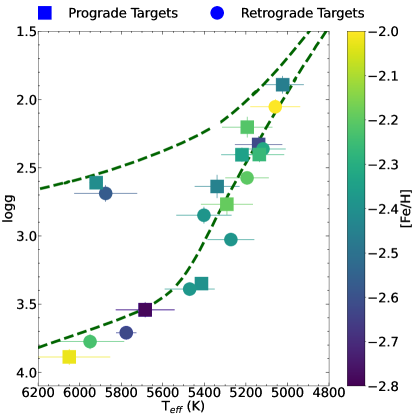
The effective temperature, , is derived from a colour-temperature relation similar to the Infrared Flux Method (González Hernández & Bonifacio, 2009) and adapted to the Gaia DR3 photometry (Mucciarelli et al., 2021). The surface density, , is determined by applying the Stefan-Boltzmann equation (e.g., Kraft & Ivans, 2003; Venn et al., 2017). An iteration between and is used, following the method fully described in Sestito et al. (2023a). Uncertainties on the stellar parameters are derived with a Monte Carlo simulation on the input parameters (photometry, distance, and extinction from Schlafly & Finkbeiner, 2011). The Kiel diagram is displayed in Figure 3 with a very metal-poor Padova isochrone (Bressan et al., 2012) for comparison. The plot shows that the sample is composed of 4 sub-giants, 14 red giants, and 2 horizontal branch (HB) stars. The microturbulence velocity (vmicro) is derived spectroscopically, imposing a flat relation between abundances of Fe i and the reduced equivalent width. The stellar parameters and their uncertainties are reported as online material only.
4.2 Spectral line list, atomic data, and model atmosphere
The line list and the atomic data are sourced from linemake (Placco et al., 2021), which includes hyper-fine structure (HFS) and r-process isotopic (for Ba and Eu) corrections. Molecular CH bands are from Masseron et al. (2014). Solar abundances are adopted from Asplund et al. (2009). The high SNR of these spectra and the wavelength coverage of ESPaDOnS allow us to detect atomic lines of - (Mg, Si, Ca, and Ti), odd-Z (Na, Al, K, Sc, and V), Fe-peak (Cr, Mn, Co, Ni, and Zn), and neutron-capture (Sr, Y, Zr, Ba, La, Nd, and Eu) elements and molecular bands of CH.
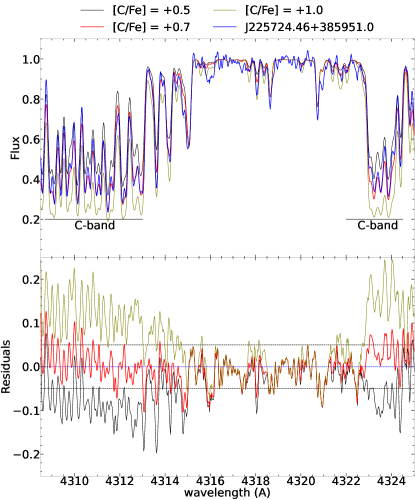
The equivalent width (EW) of the spectral lines is measured using DAOSPEC (Stetson & Pancino, 2008), which automatically fits the lines with a Gaussian profile. However, the EWs of very strong lines have been revised using a Voigt profile. Given the signal-to-noise ratio of our spectrum, lines weaker than 15 mÅ are rejected. Chemical abundances are derived with the MOOG444https://www.as.utexas.edu/~chris/moog.html code (Sneden, 1973; Sobeck et al., 2011) adopting the MARCS555https://marcs.astro.uu.se model atmosphere (Gustafsson et al., 2008; Plez, 2012). Carbon abundance is measured using the synth mode in MOOG, from the CH Å band (Masseron et al., 2014), assuming an isotopic ratio of (Spite et al., 2006). Evolutionary corrections to [C/Fe] have been applied following Placco et al. (2014)666https://vplacco.pythonanywhere.com. As an example for C-synthesis, the top panel of Figure 4 shows the spectrum of J225724.46385951.0 and three synthetic spectra ([C/Fe] ), while the residuals are displayed in the bottom panel. The star is further discussed in Section 5.2 as it is enhanced in C ([C/Fe] ) and Ba ([Ba/Fe] ). The list of spectral lines used for the chemical abundance analysis, their atomic data, their EWs and abundances are reported as supplementary online material.
The atmosphere of VMP stars are affected by non-local thermodynamic equilibrium (NLTE) effects, which can be large for some species. However, NLTE-corrected abundances are adopted only as input for the chemical evolution models, for the supernova yield progenitor fitting (see Section 6.1) and when they are compared to NLTE analyses (see Section 7). NLTE corrections have been applied to Fe i and Fe ii (Bergemann et al., 2012b), Mg i (Bergemann et al., 2017), Si i (Bergemann et al., 2013), Ca i (Mashonkina et al., 2017a), Ti i and Ti ii (Bergemann, 2011), Cr i (Bergemann & Cescutti, 2010), Mn i (Bergemann et al., 2019), and Co i (Bergemann et al., 2010) using the MPIA data base777https://nlte.mpia.de. For Na i (Lind et al., 2012) and Sr ii (Bergemann et al., 2012a), the INSPECT888http://www.inspect-stars.com webtool has been used. Ba ii NLTE corrections are adopted from Mashonkina & Belyaev (2019) taken from their online database999http://www.inasan.ru/~lima/pristine/ba2/. NLTE corrections for Al and K are obtained from Nordlander & Lind (2017) and Ivanova & Shimanskiĭ (2000), respectively. A table containing NLTE-corrected chemical abundances is provided as supplementary online material.
4.3 Uncertainties on the chemical abundances
MOOG provides estimates of the chemical abundances A(X) along with their dispersion, . The final abundance uncertainty, , is calculated by combining with the uncertainties resulting from variations in the stellar parameters (, ) in quadrature. The final uncertainty for element X is given by . When only one spectral line is present, the dispersion is set to be similar to the dispersion of the Fe i lines in the same spectral region.
5 A system hidden in the Milky Way plane
5.1 Chemical abundances with respect to the Milky Way halo
The quality of the observed ESPaDOnS spectra allow us to measure the chemical abundances of many light and heavy elements. The chemical abundances of our sample are compared to a compilation of stars in the Milky Way. This compilation is composed of high-resolution observations extracted from the Stellar Abundances for Galactic Archaeology database101010http://sagadatabase.jp (SAGA, Suda et al., 2008) and from the VMP sample analysed in Li et al. (2022). The latter sample is homogeneously observed with SUBARU/HDS and has a similar spectral resolution () as our observations. Literature stars with similar stellar parameters as our targets (, K) are selected to minimise discrepancies in the NLTE corrections between giants and dwarfs. The comparison of the LTE chemical abundances is reported in Figure 5, where the panels are sorted in order of increasing proton number.
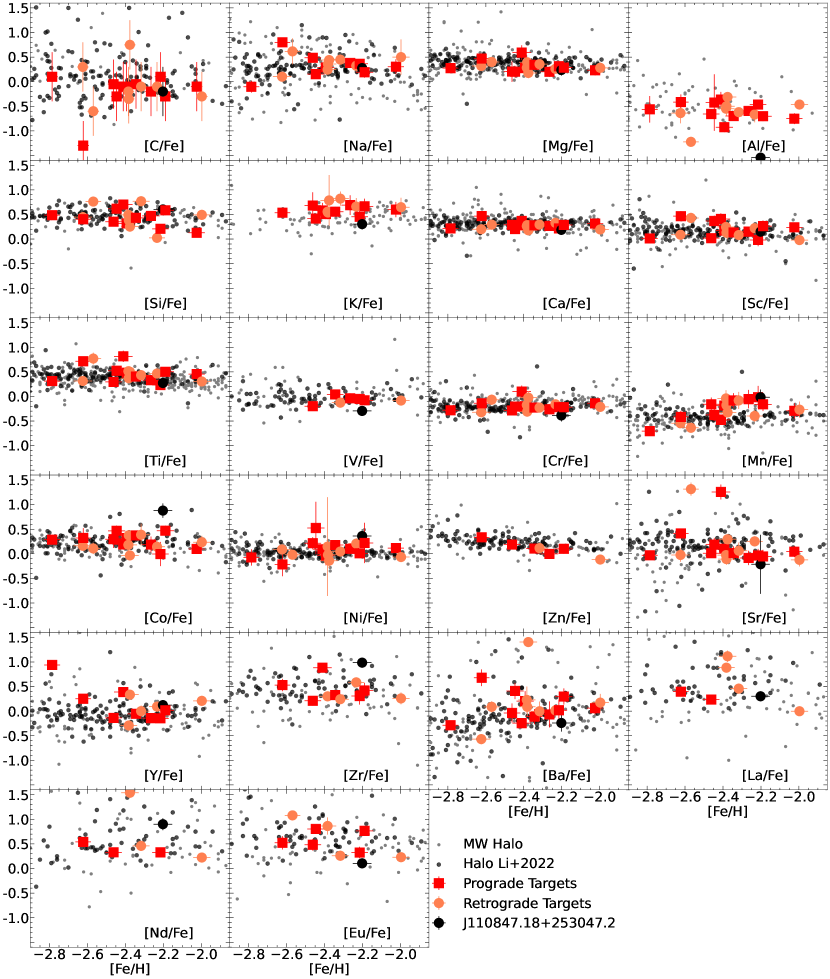
The general distribution of the [X/Fe] ratios in our sample is in good agreement with the MW halo, embedded in the global distribution, although a simple visual inspection already reveals that our sample has a narrower chemical spread than the rest of the halo distribution, and that there are chemical outliers that might not be representative of the general population. The C-panel of Figure 5 shows that our sample is located at the low end of the MW halo stars’ distribution, with the exception of J225724.46385951.0. This object is the only C-enhanced star in the observed sample. The percentage of C-enhanced metal-poor stars (CEMP) in the VMP MW halo is still an open question and it is strongly biased by the different selection effects of spectroscopic surveys (Arentsen et al., 2022). However, the cumulative percentage is around percent for stars with (Placco et al., 2014; Arentsen et al., 2022), which is higher than the one in our sample ( percent). Given the low number of stars in our sample and our restrictive selection criteria, this result has to be taken with the grain of salt. While [C/Fe] is not a parameter of our target selection, it is unknown if the LAMOST survey is biased against CEMP stars. CEMP can be used as an excellent tracers for binarity (CEMP-s) and for supernovae signatures (CEMP-no) (e.g., Beers & Christlieb, 2005; Aoki et al., 2007). Recently, Lucchesi et al. (2024) discussed that the percentage of CEMP-no stars in classical dwarf galaxies (DGs) is lower than the MW halo’s and the ultra-faint dwarfs’ (UFDs) fraction. Similarly, Sestito et al. (2024a) found that Sagittarius, and in various DGs, has a lower average [C/Fe] compared to that of the MW. Sestito et al. (2024a) interpreted these results as the chemical imprint of a different population of supernovae between DGs and the MW halo. Classical DGs might have been able to retain the yields from the most energetic events, which produced more Fe than C, while the smaller building blocks of the MW halo and ultra-faint dwarfs would have been able to recycle material from faint events only (e.g., Ji et al., 2016a; Roederer et al., 2016a; Hansen et al., 2017; Kobayashi et al., 2020; Applebaum et al., 2021; Koutsouridou et al., 2023; Vanni et al., 2023; Waller et al., 2023; Sestito et al., 2024b; Skúladóttir et al., 2024b). Similarly, the formation site(s) of these targets might contain the imprint of high energy supernovae events, similarly to a DG.
Figure 5 shows that the -elements are in good agreement with the MW halo distribution, and they do not display the sign of contribution from Type Ia supernovae, given the lack of an -knee (i.e., a change in the slope of [-element/Fe] as a function of [Fe/H]). Regarding the odd-Z elements, they are in good agreement with the MW halo, however, [K/Fe] is higher in our sample. We note that J110847.18253047.2 (large black circle) is strongly Al-poor and also lower in K and V than the other targets. This star will be further discussed in the next subsection. [Mn/Fe] increases with metallicity and this ratio is slightly enhanced compared to the bulk of the MW values for stars with . The same negative slope is seen for [V, Cr, Zn/Fe] vs [Fe/H] in both our sample and the MW halo. The panels of Figure 5 relative to the neutron-capture processes (from Sr to Eu), reveal that the [X/Fe] of our targets are similar to those in the MW halo, with the exception of two Sr-rich stars and one Ba-rich star discussed in the next subsection.
5.2 Stellar phylogenies and chemo-dynamical outliers
Since chemical evolution is driven by the cycle of stellar births and deaths, the evolution can be traced through the chemical abundance patterns of stars that are formed from the same evolving interstellar medium (ISM). This means that we can, in principle, adapt methods used in evolutionary biology, namely phylogenetic trees, to learn about the evolutionary processes affecting the chemical distribution of our stars (Jofré et al., 2017; Jackson et al., 2021). Additionally, this methods offer another way to identify outliers, to quantify the level of chemical evolution signature in the data, and to reconstruct shared histories if these exist in the dataset.
Following Walsen et al. (2024, and references therein), we analysed trees built using the distance-based method, which consists of applying the agglomerative clustering algorithm named Neighbour-Joining (Saitou & Nei, 1987, NJ) on a pairwise Manhattan distance matrix 111111The Manhattan distance is the sum of absolute differences between the components of two vectors (see Jofré et al., 2017). as a measure. NJ trees are similar to dendrograms, but the branch lengths are related to the distance matrix. In other words, a long branch implies a large difference between two individuals. NJ trees thus allow us to visualise the hierarchical distribution of a dataset.
To account for the influence of uncertainties on branching analysis, the nodal support, or confidence in each branching point, can be generated through perturbing the abundances with their uncertainties and repeating the NJ analysis. From the sampled trees it is possible to find the Maximum-Clade-Credibility (MCC) tree. This represents the tree that has the highest overall nodal support out of the perturbed abundances and is the most reliable representation of relationships given the data (see Walsen et al., 2024, for more discussions).
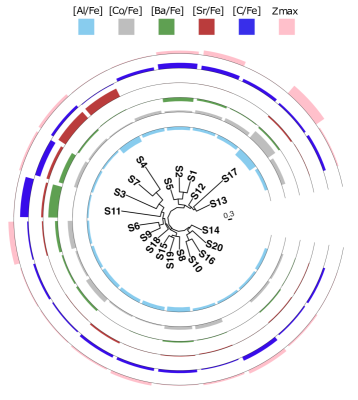
Figure 6 shows a circular MCC NJ tree built from a Manhattan chemical distance matrix of 14 chemical ratios [X/Fe] and their uncertainties for all the stars in the dataset. Coloured bars indicate [Al, Co, Ba, Sr, C/Fe] and . Four stars significantly stand out, namely J080626.72194212.2 (S4), J103037.10224124.4 (S7), J225724.46385951.0 (S11), and J110847.18253047.2 (S17). We want to highlight that kinematical properties are not included in the derivation of the branch lengths.
Two potential outliers, J080626.72194212.2 (S4) and J103037.10224124.4 (S7), are enhanced in Sr ([Sr/Fe] ), while having [Ba/Fe] and , respectively. As thoroughly discussed in Mashonkina et al. (2017b), if Ba and Sr were produced by the same nucleosynthetic sources, this would result in [Sr/Ba] . However, the extra production of Sr in these two stars might be explained by their stellar evolutionary phase, since they are horizontal branch stars (see Figure 3). These stars are not outliers in the kinematical properties nor in other [X/Fe] ratios.
The third, J225724.46385951.0 (S11), is a CEMP, as shown in Figures 4 and 5. Additionally, it is also Ba-rich ([Ba/Fe] ). A sub-class of this group, CEMP-s, possesses enrichment in s-process elements due to the presence, at the current time or in the past, of an asymptotic giant branch (AGB) companion star that contributed, as a donor, to the additional nucleosynthesis (Aoki et al., 2007). The accreted material would lead to [C/Fe] , [Ba/Fe] , and [Ba/Eu] (Beers & Christlieb, 2005; Aoki et al., 2007). Therefore, this star should not be classified as chemical outlier, given the extra-production of Ba and C in a companion.
The fourth star, J110847.18253047.2 (S17), appears to have the largest distance from the other stars based on its large branch. From Figure 2 and from Figure 6, this star also has distinct kinematics, i.e., and is not compatible with having a planar orbit. We note that only chemical abundances were considered in the distance matrix. We therefore argue that this star was formed from a differently evolving ISM than the rest. In particular, this star stands out for its low content in Al, K, V, Ba, and Eu and for its high content in Co and Zr when compared to the other stars (black circle in Figure 5). Therefore, J110847.18253047.2 is to be considered a true chemo-dynamical outlier in the sample. Assuming that J110847.18253047.2 must have had an ancestral history that differs from the rest, we can use it to root the tree and to analyse the history of the other stars.

NJ trees do not consider an evolutionary model suitable for astronomical data, and thus should not be used to conclude on a specific history (see discussions in Jackson et al., 2021; Walsen et al., 2024, Eldridge et al. in prep.). However, we can use them to gather additional information, like testing whether several types of supernovae contributed to the final [X/Fe] ratios. We use then NJ trees to test the hypothesis that a tree built only using -capture elements should be different than one from only Fe-peak elements. This might be arising from the fact that supernovae with different energy contributed differently to the final [X/Fe] for - or Fe-peak elements.
To do so, we follow the strategy to compare trees introduced in de Brito Silva et al. (2024), who considered the Robinson-Foulds (RF) distances. This is a normalised value between 0 (identical) and 1 (totally different) and compares the frequency of nodes that appears in both trees. Following de Brito Silva et al. (2024), the distance matrix has been perturbed 1000 times to take uncertainties in [X/Fe] into account. The resulting 1000 -capture and Fe-peak NJ trees are then compared to obtain the distribution of the RF distances.
The mean of the RF distance distribution is , indicating that the -capture and Fe-peak NJ trees are significantly different from each other. Figure 7 displays the MCC trees built using only [Mg, Si, Ca, Ti/Fe] as input (-capture, left side) and the one built from only [Ni, Cr, Mn, Co/Fe] (Fe-peak, right side). Same leaves/stars are connected through the dashed lines. It is possible to note how these leaves are located at different parts in each tree.
By calculating RF distances of -capture vs -capture and of Fe-peak vs Fe-peak trees, we obtain a mean RF distance of and of , respectively. This means that, given the uncertainties of our data, the trees can be as similar as and, therefore, a difference of is unlikely to be explained only by uncertainties in the data. This implies that the nucleosynthetic channels imprinted in the chemical distribution of -capture elements is different from those driving the diversity of the Fe-peak elements. The variety and energies of the supernovae contributing to these species are further explored in Section 6.3.
5.3 A shared history: Loki
The comparison of the chemical abundances in Figure 5 reveals that our targets do not stand in a different location of the chemical space than MW halo stars. However, MW stars are characterised by a broader chemical dispersion, qualitatively wider than our VMP planar stars. We remind that to minimise the spread due to the different behaviour of NLTE and other systematics in giants and dwarfs, the halo compilation of Figure 5 has been restricted to stars with similar stellar parameters as our sample ( and ), and measurements from optical spectra. The relatively small intrinsic spread in our targets [X/Fe] ratios is also visible in the phylogenetic trees discussed in Section 5.2, with the exception for J110847.18253047.2. Here, we test another method to show that our stars have a spread in [X/Fe] smaller than the MW halo in the same metallicity regime, which we interpret as a sign that our targets likely formed in a particular formation site, which we name Loki, distinct than the other MW halo stars.
The median absolute deviation (MAD) of the [X/Fe] distributions have been computed to quantify how different the dispersion of the chemical ratios of our targets is relative to the MW halo, to the MW bulge, to stars from the Ursa Minor (UMi) dwarf galaxy, and to an ensemble composed of stars from UMi and Draco (Dra) dwarf galaxies. UMi and Dra have been chosen because they are among the systems with the highest number of measured species in the same metallicity range as our sample. The outlier, J110847.18253047.2, is removed from this exercise, as well as the peculiar stars (not outliers) described in Section 5.2. The peculiar stars have been removed as some of their [X/Fe] might be larger due to binarity (1 CEMP) or evolutionary phases (2 HBs), and not strictly linked to the chemical evolution of their formation site. Similarly, HB and CEMP stars have been removed from the comparison compilations. Comparison stars have been selected to reproduce the ranges of [Fe/H] and stellar parameters as our restricted sample.
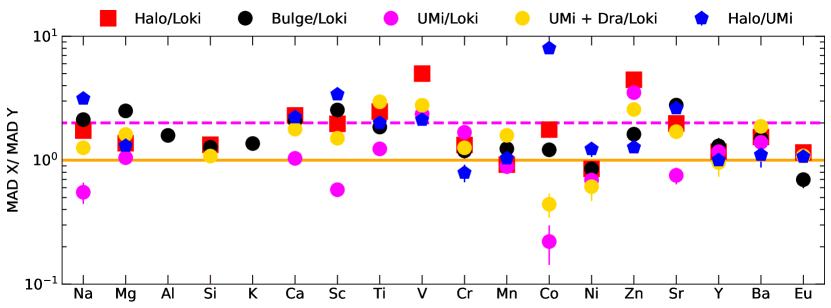
The ratios of the MAD between the MW halo, the MW bulge, UMi, UMi Dra over our targets (Loki) are shown in Figure 8, as well as the MAD ratio between the MW halo and UMi. In this space, a ratio greater than 1 implies a smaller spread in the [X/Fe] distribution for stars in the denominator. Figure 8 shows that the ratios of the MADs is always larger than 1 when comparing the MW halo from Li et al. (2022, red squares) to our targets, except for Ni (). The Li et al. (2022) sample is preferred over the SAGA, since the former is homogeneously observed and analysed, and the instrument has similar resolution as ESPaDOnS. Therefore, the spread observed in the Li et al. (2022) sample should be more similar to the intrinsic dispersion of the MW than what we would obtain from the SAGA dataset.
Recently, Lucey et al. (2022), Sestito et al. (2023a) and Sestito et al. (2024b) discussed that the [X/Fe] of the inner Galactic VMP stars are similar to those of the MW halo. Their findings also confirm that multiple formation sites are responsible for the scatter in the [X/Fe], a scenario similarly valid for the MW halo. The MAD ratios in Figure 8 between the bulge and our targets (black circles) are always , except for Ni () and Eu (). This result indicates a smaller spread for most of the [X/Fe] in Loki than in the MW bulge.
In a closed system with a well mixed interstellar medium, some species might display a small spread and constant trend with [Fe/H], in case Type Ia supernovae are absent, e.g., -element. Other species might show a well defined trend with metallicity, e.g., some Fe-peak elements (e.g., Woosley & Weaver, 1995; Nomoto et al., 2013; Kobayashi et al., 2020). Therefore, a closed system is expected to have a much narrower abundance distribution than MW halo’s stars in case of the -elements and, likely, also in case of the other elements, since the [X/Fe] distributions in the MW halo should reflect a miscellaneous of chemical histories. In fact, the ratio of the MAD for the MW halo over UMi (blue pentagons) is always , except for Cr. The MAD ratios of UMi over our targets (magenta circles) oscillate around the value 1. The exception is Co, which has a very narrow distribution in UMi. As an additional test, a compilation of stars from UMi and Dra is used to check whether Loki stars might be formed in two systems with different chemical history. The MAD ratios in this case (gold circles) are , except for Co and Ni. In some case is also close or greater than 2 (Ca, Ti, V, Ba). This would suggest that the mixing of two formation sites with different chemical history would lead to a larger spread in the [X/Fe]. We interpret these results as an evidence that our targets have similar [X/Fe] dispersions as stars formed in a common formation site and share their chemical history. Or alternatively, if the prograde and retrograde stars originated in two systems as their kinematics could suggest, these two systems should have experienced a very similar, if not identical, [X/Fe] enrichment and chemical evolution.
The previous tests are repeated also dividing our sample into prograde and retrograde, comparing their MADs between them and with the other stellar systems (not shown in Figure 8). This is to test whether these two subgroups have different origin. In all the cases, the same result is achieved, i.e., our targets show a narrower distribution in the [X/Fe] to those of the MW halo, of the inner Galaxy, and a similar one to those of a closed system. Are these results biased by observational limits or low number statistics? To overcome these additional effects, two Monte Carlo simulations are run. In the first test, a sub-sample of halo stars, composed of the same number of stars and within the same range of metallicities and stellar parameters as our sample, is randomly drawn for each atomic species for iterations and the exercise of Figure 8 is repeated. For the cases in which the MAD ratios of Figure 8 are larger than 1, the probability to find randomly a similar population in the halo is generally percent. The second test quantifies the probability to draw a sub-sample of halo stars to have the same MAD, within 15 percent, as our sample for all the chemical species. We find that this probability is percent, i.e., only 44 draws out of iterations. It is clear that the probability of these stars being part of the general halo distribution and having being picked up by chance is very low.
These results point to a common formation site between our targets. This VMP planar sample is a group of stars with not only different dynamics than the other halo stars, but also with a narrower chemical distribution. Since the MW halo is a melting pot of several building blocks accreted at early times (e.g., Starkenburg et al., 2017b; El-Badry et al., 2018; Sestito et al., 2021), of later accreted systems (Helmi, 2020; Horta et al., 2023, and reference therein) and of in-situ formation in large clusters (Belokurov & Kravtsov, 2022), we suggest that the formation site of this VMP planar group, which we dubbed Loki, is one of these systems comprising the halo. What is its chemical evolution history? Is Loki an accreted galaxy/building block of the MW or is it an in-situ cluster? Or was it a pair of systems that had a common chemical origin and accreted together in a way that some stars were deposited in a prograde motion and other in retrograde orbits?
6 The chemical evolution of Loki
6.1 Chemical evolution models
A chemical evolution model (CEM) similar to the one used in Fernández-Alvar et al. (2018) is used to derive the upper mass () of the initial mass function (IMF), the integrated yields (Y) from massive stars, the efficiency () of the star formation rate (SFR), the duration () of the star formation history (SFH), and the baryonic mass () of the formation site of these targets. The assumptions to derive these quantities are:
-
1.
These stars formed in the same formation site that initially was made only of pristine gas.
-
2.
The primordial gas evolves chemically in a closed-box model, i.e., no inflows or outflows of gas or stars.
-
3.
The SFR is proportional to the gaseous mass with constant efficiency , therefore, the SFR decreases with time, as an exponential function.
-
4.
Semi-instantaneous recycling approximation, i.e., massive stars (MS, ) explode as SNe II immediately after they formed, but the bulk of neutron star mergers (NSM) enrich the ISM as kilonovae with a delay of about Gyr (e.g., Wanajo et al., 2021).
- 5.
-
6.
n-capture elements, like Sr, Y, Zr and Ba, are produced by slow process (s-process, in massive stars) and by rapid process (r-process, in NSM). Their r-process yields are scaled from the Eu yield, considering r-factor by Simmerer et al. (2004) who took into account the solar system r-process contribution.
-
7.
Eu is produced only through rapid process channel and each NSM ejects (Wanajo et al., 2014).
-
8.
Most Type Ia supernovae (SNe Ia) explode with a delay of about 1Gyr after the formation of their progenitors (see Wanajo et al., 2021). However, there is no trace of an -knee in the observed data, therefore the SNe Ia contribution is null in the chemical evolution of this system.
- 9.
-
10.
Stars form with the IMF of Kroupa (2002) with for initial stellar mass .
-
11.
Our stellar sample between might correspond to an early portion of a longer star formation history.
As the massive metal-poor stars evolve and die, a fraction of their ejected gas is recycled to form new stars. Therefore, the observed [X/Fe] ratios would be strictly linked to the population of SNe II and NSM in a given system. Since Loki stars have a high value of [Eu/Fe], the total time needed by the system to form the observed stars should be longer than 0.1Gyr, the time-delay of NSMs, which form the bulk of the Eu. Moreover, these stars formed before SNe Ia kicked in, so should be shorter than Gyr. Therefore, we consider that must be restricted to Gyr.
The theoretical yields ejected from SNe II are integrated following the adopted IMF, from a mass of to the upper mass . The upper limit of is varied until the observed and theoretical [X/Fe] produced by massive stars (i.e., no n-capture elements) are matched. We use [Mg/Fe] to constrain the , since Mg and Fe are well determined chemical elements from the observational point of view. Additionally, theoretical yields are well constrained for these elements and they have a simple nucleosynthetic channel, from SNe II only, for evolutionary times lower than Gyr. Our derived upper mass limit for the SNe II is .
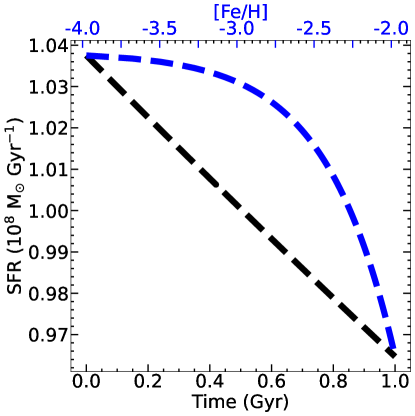
The upper mass is strictly linked to the gas mass available to form stars in each burst (Carigi & Hernandez, 2008), hence to the SFR. Using the integrated galactic stellar IMF as a function of the SFR by Weidner et al. (2013) and considering and in their Figure 3, the SFR is yr-1, or Gyr-1. This value is in the range as predicted for VMP by Jeřábková et al. (2018). The evolution of the SFR as a function of time and of metallicity is displayed in Figure 9.
Since the most metal-rich star formed at from a gas with , the efficiency of the SFR over time is Gyr-1 (see equation 7 in Fernández-Alvar et al., 2018). Based on the three first assumptions, the SFR is proportional to and to the initial gas mass, which would lead to an initial baryonic mass (gas and stars) of for Loki. This value is similar to those of classical dwarf galaxies (DGs) in the Local Group, e.g., the Small and the Large Magellanic Clouds have a baryonic mass of and , respectively (e.g., McConnachie, 2012).
The prograde and retrograde stars possess a similar [Fe/H] range and have the same mean [X/Fe]. This implies that if they originated in two systems, the chemical models would then provide the same chemical evolution history and the same baryonic mass for each system, which will also be the same as those from the single-system scenario. Therefore, the total baryonic mass would be doubled.
6.2 Loki is chemically similar to a classical dwarf galaxy
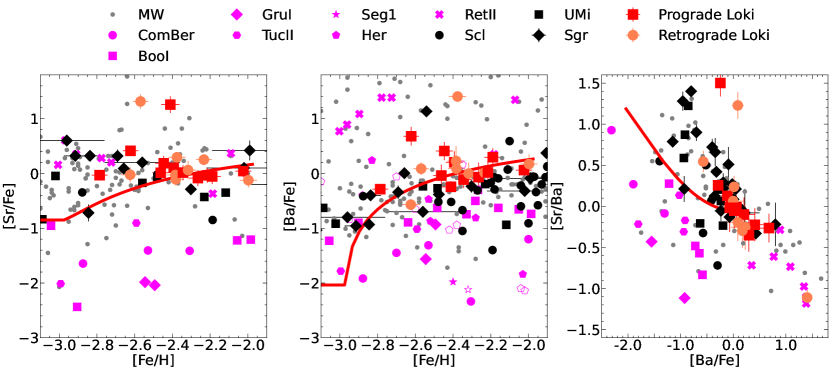
The CEM suggests that Loki had baryonic mass similar to a DG. Is this also confirmed by other chemical diagnostics? Neutron-capture elements and their ratios have been used to separate massive and chemically evolved DGs from more pristine ultra-faint dwarfs (UFDs) (e.g., Mashonkina et al., 2017b; Ji et al., 2019). The content of Sr and Ba is on average lower in UFDs than in classical DGs. The distributions of [Sr, Ba/Fe] vs [Fe/H] are displayed in the two leftmost panels of Figure 10 for Loki (blue markers) and a compilation of stars from DGs (black markers), UFDs (magenta markers), and MW halo stars (grey circles). The Ba and Sr contents of Loki clearly appear to be similar to the average content of DGs, rather than of UFDs.
The right panel of Figure 10 shows [Sr/Ba] vs [Ba/Fe]. In this space, MW halo stars display a downward trend (Mashonkina et al., 2017b), although distributed mostly around [Sr/Ba] (Ji et al., 2019). Stars of a given UFD or DG exhibit a relatively wide distribution in [Sr/Ba], up to dex. This can be explained by stochasticity in the ISM of UFDs and multiple nucleosynthetic channels in both UFD and DGs. Given the lower amount of Ba and Sr, UFDs populate a distinct region of this space for the majority of MW halo stars and of DGs.
A ratio [Sr/Ba] implies that these species were produced by the same nucleosynthetic sources (Mashonkina et al., 2017b), which seems to be the case for most of the stars in Loki. The three exceptions are the CEMP-s target J225724.46385951.0, where Ba is likely enhanced by an AGB donor ([Ba/Fe] ); and the two HB stars, J080626.72194212.2 and J103037.10224124.4, which their advanced stellar evolution phase can justify their high Sr-rich nature ([Sr/Ba] ). In the [Sr/Ba] vs [Ba/Fe] space, Loki is clearly detached from UFDs, resembling more the DGs and halo stars. This is also in agreement with the stellar mass of Loki inferred by the chemical evolution model (Section 6.1). Figure 10 also reports the expectation from the CEM, while it well reproduces the Ba-content of the sample, it underestimates the [Sr/Fe] at the lower metallicity regime (). This is caused by the concomitance of two things: theoretical yields of Sr from massive stars are not fully metallicity-dependent, hence producing an almost flat abundance of Sr, while theoretical yields of NSMs provide a lower amount of Sr than what is observed.
6.3 Rapid and slow process sources
Eu and Mg are mostly synthesised by NSM and SNe II, respectively, which are the main sources for rapid-capture process elements. Ba can also be made in slow process sources, namely fast-rotating and AGB stars. Therefore, [Ba/Mg] vs [Mg/H] and [Ba/Eu] vs [Fe/H] chemical spaces are useful diagnostics to investigate contribution of both rapid and slow process sources. These chemical spaces are shown in Figure 11, in the top and bottom panel, respectively.
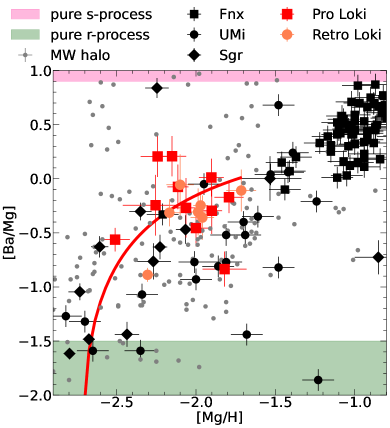
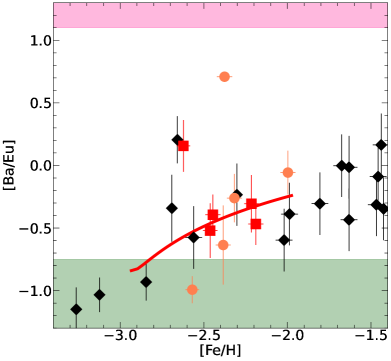
The [Ba/Mg] vs [Mg/H] is reported for Loki (coral circles and red squares), MW halo stars (grey markers), and classical DGs (black markers), namely Fornax (Fnx), Ursa Minor (UMi) and Sagittarius (Sgr). The [Ba/Eu] vs [Fe/H] is displayed for Loki and Sgr members. Additionally, in both the panels, theoretical results from the adopted CEM (red line), literature theoretical yields from pure rapid (green shaded area) and from slow processes (pink shaded area) are reported. Both [Ba/Mg] and [Ba/Eu] rise as a function of [Mg/H] and [Fe/H], implying the need of an extra (s-process) source for Ba. While CEM do not take into account AGBs, observational diagnostics cannot rule out their involvement in the chemical evolution of Loki.
In addition to the CEM, StarFit121212https://starfit.org is employed to fit the chemical pattern of our stars. StarFit takes as input the [X/Fe] with their uncertainties and provides the best combination of SNe II through a fit. Theoretical supernovae and massive stars yields are selected to account for a variety of sources, from faint to pair instability SNe, to fast-rotating massive stars. We want to highlight that StarFit includes yields from other research groups (e.g., Heger & Woosley, 2010; Just et al., 2015) to those used in Section 6.1.
StarFit confirms that fast-rotating massive stars and compact binary merger events are needed to reproduce the observed neutron-capture elements in Loki. Additionally, high-energy and hypernovae are required to account for the lighter elements up to the Fe-peak group. In particular, hypernovae affect most of the elements up to the Fe-peak, while high-energy supernovae provide yields only for the lighter ones. This can be an explanation on the diversity between the phylogenetic trees (- vs Fe-peak) that has been discussed in Section 5.2 and Figure 7. The results from StarFit are compatible with the output from our adopted CEM, which used different theoretical yields, therefore providing a robust interpretation of the sources that contributed to the chemical evolution of Loki. The imprint of the most energetic events vs the lack of faint- and core-collapse SNe has been recently proposed as typical of classical DGs (e.g., Skúladóttir et al., 2024a; Sestito et al., 2024a). These systems should be able to retain the most energetic events and homogeneously recycle their yields, while the gas of UFDs would be able to retain the ejecta of only fainter events (e.g., Ji et al., 2016a; Roederer et al., 2016a; Hansen et al., 2017; Kobayashi et al., 2020; Applebaum et al., 2021; Waller et al., 2023; Skúladóttir et al., 2024a; Sestito et al., 2024b, a).
7 Is Loki of accreted origin?
Recently, Belokurov & Kravtsov (2022) proposed an early in-situ component, dubbed Aurora, of stars with metallicities which would be the proto-MW, i.e., formed before the bulk of the thick and thin discs. During the Aurora phase, the ISM would be lumpy and chaotic, forming stars in massive clusters. Therefore, the next question to be addressed is whether Loki is of accreted nature or part of the in-situ Aurora. We want to emphasise that our definition of ”accreted” includes stars formed 1) outside the main host halo during the early Galactic assembly, i.e., in the building blocks and 2) in systems accreted into the MW at any time.
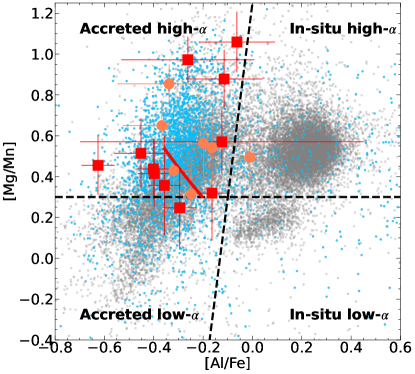
The [Mg/Mn] vs [Al/Fe] space has been widely used as a chemical diagnostic to separate the MW in-situ population from the accreted one (Hawkins et al., 2015; Das et al., 2020). This space is shown in Figure 12, where our sample is plotted with a selection of MW halo stars from APOGEE DR17 (Abdurro’uf et al., 2022) in grey. In-situ MW stars would occupy the Al-enhanced side of this space, while accreted stars are statistically on average Al-poor. The vertical axis provides a division between evolved and less evolved systems/regions, i.e., low- and high-, respectively. These four regions in Figure 12 are divided by the two black dashed lines. In Figure 12, it is possible to identify the thick disc, i.e., the blob in the in-situ high- region, the thin disc, i.e., the low- blob, and the accreted systems (low- and high-) as discussed in Hawkins et al. (2015) and Das et al. (2020). Stars from Loki occupy the accreted high- region, with some stars close to the low- border.
We want to stress out that, although this space has been applied to stars and systems with (the metallicity limits of APOGEE, a datasets that does not contain many stars below ), its power to disentangle in-situ from accreted origin has been proved to be useful at metallicities . We note that percent of the APOGEE stars with (light blue dots), and reliable measurements of [Mg, Al, Mn/Fe], stands on the ”accreted” region of Figure 12. If many VMP stars formed also in the lumpy proto-MW, the lack of their presence in the in-situ region of this chemical space would suggest that this diagnostic is inefficient to distinguish between the in-situ and the accreted VMP populations. Hence, we cannot conclude firmly on the accreted origin of our sample solely based on this chemical space. Future spectroscopic surveys, e.g., WEAVE (Dalton et al., 2012; Jin et al., 2024) and 4MOST (Bensby et al., 2019), will provide a statistically large sample of VMP stars that it could be used to explore new chemical diagnostics spaces to disentangle the in-situ and the accreted populations.
7.1 The in-plane infall of a simulated Loki at early epochs
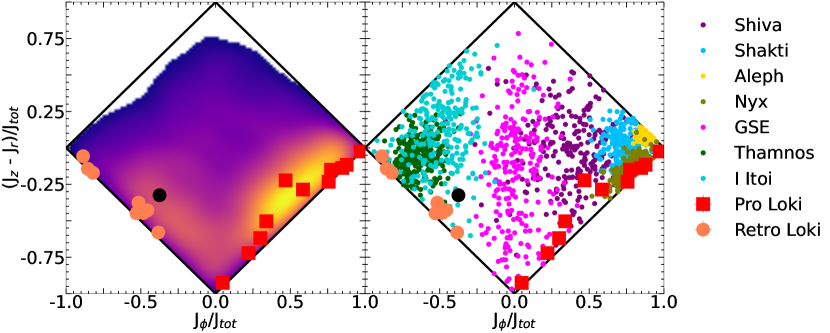
The action space in the left panel of Figure 13 shows Loki stars and stellar particles from the NIHAO-UHD MW-like simulations (Buck et al., 2020), which were used to investigate the origin of the planar VMP stars by Sestito et al. (2021). Specifically, the selected stellar particles belong to a simulated system that was accreted into the galaxy g7.55e11 at a cosmic time of approximately Gyr, during its early assembly phase. This simulated accreted system has a stellar mass of , a gas mass of , and a dark matter halo mass of , corresponding to approximately 7 (1), 24 (9), and 19 (7) percent of the respective components of the MW-like galaxy at the time of accretion (present time). In terms of the baryonic component, the mass of the accreted system is 21 (7) percent of the simulated MW-like galaxy at the time of accretion (present time).
The simulations indicate that the accreted system merged with the forming proto-MW-like galaxy with an in-plane trajectory. Due to the shallow gravitational potential of the proto-MW-like galaxy and to the lack of net rotation in the proto-disc, the accreted system was able to disperse its stellar content primarily within the forming proto-disc in a prograde motion, with some dispersal occurring in the retrograde planar and halo configurations (Sestito et al., 2021), hence with a wide range of angular momenta and eccentricities as our sample. It is reassuring that several simulated building blocks of various MW-like galaxies are capable of dispersing their stars in both prograde and retrograde fashions during early assembly phases, as discussed in Sestito et al. (2021) and Santistevan et al. (2021). These results from simulations would help in keeping valid the scenario in which Loki might have been composed of a single system, rather than a pair of very similar systems (in their mass and in their chemical evolution). In any case, the accretion of Loki should have been occurred during the early assembly of the proto-MW, since systems accreted later in the dynamical evolution of a Milky Way-like galaxy cannot disperse their stars both in a prograde and in a retrograde planar fashion (Santistevan et al., 2021; Sestito et al., 2021).
While it is beyond the scope of this paper to infer the mass of the Milky Way as a function of cosmic time, we can provide an estimate for the baryonic mass ratio between Loki and the Galaxy at the present day. According to Bland-Hawthorn & Gerhard (2016), the estimated baryonic mass of the Milky Way, including stars, cold and hot gas, is . This suggests a baryonic mass ratio of approximately 2 percent between Loki and the present MW (for the single-system scenario). The slightly smaller baryonic mass ratio for Loki compared to the value for the simulated one is not concerning, as the NIHAO-UHD simulations analysed in Sestito et al. (2021) may differ from the actual dynamical evolution of the MW and its stellar, gaseous, and dark matter content. Additionally, since the [Fe/H] range analysed is imposed by our selection criteria, we cannot exclude that Loki belongs to a system with signatures of SNe Ia at higher metallicities. In that case, this would imply a longer star formation history and a larger reservoir of gas (see Section 6.1), i.e., a larger baryonic mass and a higher mass ratio with the MW.
7.2 An unknown building block or the low-energy tail of Gaia-Sausage -Enceladus?
Many kinematical structures have been identified since the advent of the Gaia satellite (Horta et al., 2023, and references therein). Prograde structures that are close to the MW plane are Nyx (Necib et al., 2020), Aleph (Naidu et al., 2020), the Atari disc Mardini et al. (2022a), Icarus (Re Fiorentin et al., 2021), and the recent discovered Shiva and Shakti (Malhan & Rix, 2024). Similarly close to the plane, but in retrograde motion, there are Sequoia (Barbá et al., 2019; Matsuno et al., 2019; Myeong et al., 2019), Thamnos (Koppelman et al., 2019), Arjuna and I’Itoi (Naidu et al., 2020). Heracles (Horta et al., 2021) and Gaia-Sausage-Enceladus (GSE, Belokurov et al., 2018; Helmi et al., 2018) have an almost null angular momentum and they are linked to the inner Galaxy and the MW halo, respectively, mostly by construction. GSE is identified as a halo structure since this is the relatively easier place to look for accreted structures (e.g., Carrillo et al., 2024), therefore its lower energy part is not well characterised. In the case of Heracles, its stars were selected imposing a low value for their energy and towards the inner Galaxy. All of these known structures have been chemically characterised using APOGEE, implying NLTE infrared analyses restricted to stars mostly with . Therefore, a thorough comparison or test for possible association between Loki and known structures would be hard to check and beyond the scope of this work. The action quantities for Loki and for some of the known accreted structures are displayed in the right panel of Figure 13.
Recently, Horta et al. (2023) discussed that the chemical properties of many retrograde structures (e.g., Sequoia, Arjuna and I’Itoi) are indistinguishable from those of GSE. Their results bring into question the independence of these substructures, given the fact that these also partially overlap in the kinematical spaces with GSE (see also results of Kordopatis et al., 2023, separating prograde and retrograde stars and finding results along the same lines). Therefore, these retrograde structures might be satellites or part of the GSE outskirts. Similarly, Viswanathan et al. (2024a) proposed that Shakti and Shiva might be the prograde and the lower energy tail of GSE.
While GSE is relatively well studied for and it is easier to identify its members in the MW halo, a harder investigation would be to explore its VMP tail at lower energies, i.e., closer to the MW plane. Given the assumption that all the systems should possess VMP stars, we cannot fully exclude that Loki belongs to the lower energy and lower metallicity tail of GSE nor that they were orbiting together at the time of the accretion. In fact, the simulated accreted system reported in Figure 13 also disperses its stars with kinematics compatible with most studied part of GSE. Future surveys, e.g., WEAVE (Dalton et al., 2012; Jin et al., 2024) and 4MOST (Bensby et al., 2019), should obtain a larger and homogeneous dataset of [X/Fe] for VMP stars close to the disc and of GSE to prove or disprove any possible association.
7.3 Loki and its variants
Detailed chemical abundance analyses of VMP stars in planar orbits are scarce, and they mostly focus on the prograde population, aiming to investigate the primordial tail of the MW disc. Recently, Dovgal et al. (2024) re-analysed an EMP star with quasi-circular prograde planar orbit discovered by Venn et al. (2020) using the Pristine survey (Starkenburg et al., 2017a), P1836849. Dovgal et al. (2024) discuss the kinematics and the chemical information of P1836849 compared to other 6 quasi-circular prograde VMP planar stars from the literature (Caffau et al., 2011; Schlaufman et al., 2018; Sestito et al., 2019; Cordoni et al., 2021; Mardini et al., 2022b). Chemical information on these stars are very limited, however Dovgal et al. (2024) proposed that a common formation origin is unlikely to be the case, given the diverse chemical patterns across these stars (their Figures 6 and 7), implying a different chemical evolution. In fact, their sample span a range of up to dex in various [X/Fe], a difference well beyond the statistical or systematic error due to a different analysis.
We gather a compilation of planars, including stars with prograde and retrograde motion and spanning a wide range of eccentricities, to compare their [/Fe]131313[/Fe] is defined as the unweighted mean of [Mg, Ca, Ti/Fe] against Loki. This chemical ratio as a function of [Fe/H] is shown in Figure 14. The compilation of planar stars includes 8 UMPs (, Sestito et al., 2019, and references therein), 21 VMPs from Cordoni et al. (2021), two Pristine stars analysed in Dovgal et al. (2024) and Sestito et al. (2024b), respectively, 127 LAMOST stars () analysed in Li et al. (2022) and Zhang et al. (2024), and 24 stars with identified in Fernández-Alvar et al. (2024). Additionally, contour lines of MW thin and thick disc stars from APOGEE DR17 are added to Figure 14.
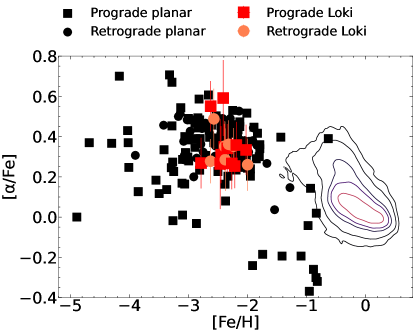
The overall [/Fe] distribution does not indicate a clear trend as a function of metallicity, rather a wide spread, i.e., dex in dex of metallicity. Interestingly, the planar stars in this compilation also display a large range of values in the other [X/Fe] ratios and we report some examples. The star analysed in Sestito et al. (2024b) has a chemical pattern typical of UFD stars, showing large differences compared to Loki at the same metallicity, e.g., of , , and dex in [Na/Fe], [Ba/Fe], and [Sr/Fe], respectively. P1836849 (Dovgal et al., 2024) has a very low [Na, Mg/Fe] compared to our sample, displaying differences of and , respectively. The very -poor population, found by Fernández-Alvar et al. (2024), has been associated to an accreted origin based on its location in the [Mg/Mn] vs [Al/Fe] space, although it is kinematically similar (by construction) to the MW thin disc (Fernández-Alvar et al., 2021, 2024).
The wide ranges in the [X/Fe] among the planar stars cannot be fully reconciled by systematics in the chemical analysis among various works. Consequently, we propose that multiple systems with a variety of chemical enrichment histories, from ones more similar to present day UFDs to others similar to classical DGs, contributed to the overall planar group. We want to highlight that this compilation includes stars with different kinematical selection criteria, except for a common cut on the maximum height from the plane, which is kpc. For this reason, we also test whether the spread in the -elements is still visible selecting stars with very similar kinematical parameters as our sample, using the stars analysed in Zhang et al. (2024). Using this stricter cut, the bulk of the stars are then distributed in [/Fe] between 0.3 to 0.5, hence showing a narrower range than the whole sample and close to the range we obtain for Loki. This might be an indication that stars with different kinematics might belong to different formation sites.
Cosmological zoom-in simulations (e.g., Tissera & Scannapieco, 2014; Santistevan et al., 2021; Sestito et al., 2021) suggest that the VMP planar population is composed of various building blocks spanning a wide range of sizes and masses, and likely different chemical evolution. Conversely and if restricting to [/Fe] only, chemo-dynamical simulations from Khoperskov et al. (2021) indicate that a wide spread in the [/Fe] distribution among VMP stars can also be a result of the multiphase, complex, and inhomogeneous mixing in the ISM of the forming galaxy. Stars in such planar motion can also be moved from their initial configuration, i.e., radial migration, by various mechanisms, such as the interaction with the rotating bar (e.g., Minchev & Famaey, 2010). However, recent modelling of the bar’s influence disfavours the possibility that a rotating bar is the main contributor to the planar, and in particular prograde quasi-circular, population (Yuan et al., 2023; Li et al., 2023).
Metallicities and RVs from Gaia DR3 Gaia Collaboration et al. (2023) have been used to test whether the VMP prograde quasi-circular population is related to the MW thin and thick discs. For example, Zhang et al. (2024) proposed that the VMP prograde population is originated by the superposition of two halo components, one that is stationary and one that is rotating at about , which would exclude a common origin with the MW disc. Bellazzini et al. (2024) and González Rivera de La Vernhe et al. (2024) draw different interpretation using different datasets with kinematics from Gaia DR3 data, suggesting that this prograde population is instead associated with the thick disc. Both studies discuss that the prograde planar population, even at the VMP regime, is more skewed towards higher angular momenta and it is larger in number than the retrograde counterpart, as also shown in previous findings (e.g., Sestito et al., 2020; Cordoni et al., 2021; Carter et al., 2021). González Rivera de La Vernhe et al. (2024) conclude that this population would be present even if correcting their kinematics for a rotating prograde halo (by ), in agreement to what was found in zoom-in cosmological simulations (Sestito et al., 2021). However, these studies lack of chemical abundance analyses and, therefore, it would be difficult to prove any association of these stars with Loki or with the MW thick disc.
8 Summary
This work provides, for the very first time, a dedicated detailed chemical abundance analysis of a sample of VMP stars with orbits close to the MW plane. We find that:
- I
-
II
These stars are relatively close to the Sun and the sample is composed of 11 stars with prograde motion and 9 with retrograde orbits (Figure 2). One star stands out for its high , J110847.18253047.2.
-
III
The [X/Fe] ratios of the targets overlap those of the MW halo. However, these targets, with the exception of one star (J110847.18253047.2), show a narrower dispersion in the [X/Fe] than that of the halo and of the bulge at the same [Fe/H]. The [X/Fe] dispersions of our targets are similar to that of a dwarf galaxy (Figures 6 – 8). The sum of two formation sites with different chemical history would produce a larger spread in the [X/Fe] (Figure 8). No difference in the dispersion is found for prograde or retrograde stars. These results suggest that these stars shared a common origin and formation site, which we name Loki.
- IV
-
V
In this scenario, the baryonic mass calculated with chemical evolution models would be , a value similar to those of dwarf galaxies.
-
VI
To reproduce the observed [X/Fe], chemical evolution models and supernovae yield fitters indicate the presence of neutron star merger events (to account for the n-capture elements), fast-rotating massive stars (for the slow process channels), high-energy supernovae and hypernovae (for the lighter elements) and a lack of SNe Ia. Observational diagnostics cannot rule out the presence of AGBs as extra source of s-process elements.
-
VII
These chemical patterns put constraints on the time range of the star formation, between 0.1 and 1 Gyr (Figure 9), i.e., the minimum time to form neutron star merger events and the maximum time to not have Type Ia supernovae.
-
VIII
The [Mn/Mg] vs [Al/Fe] space (Figure 12) cannot be used at the VMP regime, since it is inefficient in disentangling the in-situ and the accreted population. Therefore, while Loki occupies the accreted region, we cannot exclude its in-situ origin.
-
IX
The scenario in which Loki might be composed of a single system is allowed by cosmological simulations. The NIHAO-UHD suite of simulations suggests that an in-plane infall of a single system into the forming proto-MW could disperse its stars into a wide range of angular momenta, similar to what observed for our targets (Figure 13). In order to also have stars on retrograde orbits, the accretion events should have happened during the early MW’s assembly phase, before the settling of the disc (see Sestito et al., 2021, for further details).
-
X
Alternatively, if Loki is composed by a pair of systems, the simplest case would be one for the prograde and one for the retrograde stars, they should share the same chemical history and evolution. The total baryonic mass would be twice the case of the single-system scenario. Therefore, we retain this scenario to be less likely.
-
XI
The orbital distribution of Loki is different from any other accreted structure detected so far in the Milky Way. None of the discovered systems can fully reproduce the orbital parameters of Loki (Figure 13). However, this might be due to selection effects, especially for those investigations regarding GSE. This system is mostly studied at higher energies (i.e., in the halo) and at higher metallicities (e.g., because of APOGEE [Fe/H] limit). As an alternative scenario, we cannot exclude that Loki is the VMP and low-energy tail of GSE.
-
XII
The [/Fe] vs [Fe/H] space (Figure 14) of a compilation of planar stars (prograde and retrograde) suggests that multiple systems are needed to account for the wide spread in such chemical ratio, which is also confirmed by the limited availability of other [X/Fe] in the literature. While Loki might not be related to the very metal-poor disc (if it really exists), we do not rule out that some prograde stars with quasi-circular motion could belong to the ancient and most metal-poor tail of the disc.
In conclusion, this analysis provides novel results for studies on the Milky Way formation and evolution. These VMPs in planar orbit are the remnant of an ancient system or, less likely, a pair of systems, sharing a common chemical evolution, that deposited its/their stars during the early Galactic assembly. However, given the lack of a larger and homogeneous dataset, that includes VMPs in planar motion and GSE members, we cannot prove or disprove that Loki is related to the VMP and low-energy tail of GSE and/or other detected structures. Certainly, coming large spectroscopic surveys, such as WEAVE (Dalton et al., 2012; Jin et al., 2024) and 4MOST (Bensby et al., 2019), would provide a large dataset that will help to shed light onto the nature and properties of these systems, as well as providing a census of the various systems accreted into the Milky Way.
Acknowledgements.
We acknowledge and respect the l\textschwa\textvbaraccentkw\textschwaŋ\textschwan peoples on whose traditional territory the University of Victoria stands and the Songhees, Esquimalt and WSÁNEĆ peoples whose historical relationships with the land continue to this day. The authors wish to recognise and acknowledge the very significant cultural role and reverence that the summit of Maunakea has always had within the Native Hawaiian community. We are very fortunate to have had the opportunity to conduct observations from this mountain.Based on observations obtained with ESPaDOnS at the Canada-France-Hawaii Telescope (CFHT) which is operated by the National Research Council (NRC) of Canada, the Institut National des Sciences de l’Univers of the Centre National de la Recherche Scientifique of France, and the University of Hawaii.
FS thanks Paola Di Matteo and Misha Haywood for their feedback received during his visit in Paris. FS thanks Cristina Chiappini for the interesting chat at the IAC canteen.
FS thanks the Instituto de Astrofísica de Canarias (IAC) for the support provided through its Early Career Visitor program, which enabled a productive research stay and fostered collaborations that were essential for the completion of this project. FS and KAV thanks the National Sciences and Engineering Research Council of Canada for funding through the Discovery Grants and CREATE programs. EFA acknowledges support from HORIZON TMA MSCA Postdoctoral Fellowships Project TEMPOS, number 101066193, call HORIZON-MSCA-2021-PF-01, by the European Research Executive Agency. EFA also acknowledges support from the Agencia Estatal de Investigación del Ministerio de Ciencia e Innovación (AEI-MCINN) under grant “At the forefront of Galactic Archaeology: evolution of the luminous and dark matter components of the Milky Way and Local Group dwarf galaxies in the Gaia era” with reference PID2020-118778GB-I00/10.13039/501100011033. LC acknowledges support from the grant IG-100622 (DGAPA-PAPIIT, UNAM). PJ, DdBS, CJLE, and SV acknowledge the Millennium Nucleus ERIS (ERIS NCN2021017) and FONDECYT (Regular number 1231057) for the funding. AAA acknowledges support from the Herchel Smith Fellowship at the University of Cambridge and a Fitzwilliam College research fellowship supported by the Isaac Newton Trust. NFM gratefully acknowledges support from the French National Research Agency (ANR) funded project ”Pristine” (ANR-18-CE31-0017) along with funding from the European Research Council (ERC) under the European Unions Horizon 2020 research and innovation programme (grant agreement No. 834148). ES acknowledges funding through VIDI grant ”Pushing Galactic Archaeology to its limits” (with project number VI.Vidi.193.093) which is funded by the Dutch Research Council (NWO). This research has been partially funded from a Spinoza award by NWO (SPI 78-411). PBT acknowledges partial funding by Fondecyt-ANID 1240465/2024 and Núcleo Milenio ERIS. TB’s contribution to this project was made possible by funding from the Carl-Zeiss-Stiftung. This research was supported by the International Space Science Institute (ISSI) in Bern, through ISSI International Team project 540 (The Early Milky Way).
This work has made use of data from the European Space Agency (ESA) mission Gaia (https://www.cosmos.esa.int/gaia), processed by the Gaia Data Processing and Analysis Consortium (DPAC, https://www.cosmos.esa.int/web/gaia/dpac/consortium). Funding for the DPAC has been provided by national institutions, in particular the institutions participating in the Gaia Multilateral Agreement. This work has made use of data from the LAMOST survey. Guoshoujing Telescope (the Large Sky Area Multi-Object Fiber Spectroscopic Telescope LAMOST) is a National Major Scientific Project built by the Chinese Academy of Sciences. Funding for the project has been provided by the National Development and Reform Commission. LAMOST is operated and managed by the National Astronomical Observatories, Chinese Academy of Sciences. This research has made use of the SIMBAD database, operated at CDS, Strasbourg, France (Wenger et al., 2000). This work made extensive use of TOPCAT (Taylor, 2005).
References
- Abadi et al. (2003) Abadi, M. G., Navarro, J. F., Steinmetz, M., & Eke, V. R. 2003, ApJ, 597, 21
- Abdurro’uf et al. (2022) Abdurro’uf, Accetta, K., Aerts, C., et al. 2022, ApJS, 259, 35
- Aguado et al. (2019) Aguado, D. S., Youakim, K., González Hernández, J. I., et al. 2019, MNRAS, 490, 2241
- Almeida-Fernandes et al. (2022) Almeida-Fernandes, F., SamPedro, L., Herpich, F. R., et al. 2022, MNRAS, 511, 4590
- Aoki et al. (2007) Aoki, W., Beers, T. C., Christlieb, N., et al. 2007, ApJ, 655, 492
- Applebaum et al. (2021) Applebaum, E., Brooks, A. M., Christensen, C. R., et al. 2021, ApJ, 906, 96
- Arentsen et al. (2022) Arentsen, A., Placco, V. M., Lee, Y. S., et al. 2022, MNRAS, 515, 4082
- Arlandini et al. (1999) Arlandini, C., Käppeler, F., Wisshak, K., et al. 1999, ApJ, 525, 886
- Asplund et al. (2009) Asplund, M., Grevesse, N., Sauval, A. J., & Scott, P. 2009, ARA&A, 47, 481
- Barbá et al. (2019) Barbá, R. H., Minniti, D., Geisler, D., et al. 2019, ApJ, 870, L24
- Beers & Christlieb (2005) Beers, T. C. & Christlieb, N. 2005, ARA&A, 43, 531
- Beers et al. (2002) Beers, T. C., Drilling, J. S., Rossi, S., et al. 2002, AJ, 124, 931
- Bellazzini et al. (2024) Bellazzini, M., Massari, D., Ceccarelli, E., et al. 2024, A&A, 683, A136
- Belokurov et al. (2018) Belokurov, V., Erkal, D., Evans, N. W., Koposov, S. E., & Deason, A. J. 2018, MNRAS, 478, 611
- Belokurov & Kravtsov (2022) Belokurov, V. & Kravtsov, A. 2022, MNRAS, 514, 689
- Bensby et al. (2019) Bensby, T., Bergemann, M., Rybizki, J., et al. 2019, The Messenger, 175, 35
- Bergemann (2011) Bergemann, M. 2011, MNRAS, 413, 2184
- Bergemann & Cescutti (2010) Bergemann, M. & Cescutti, G. 2010, A&A, 522, A9
- Bergemann et al. (2017) Bergemann, M., Collet, R., Amarsi, A. M., et al. 2017, ApJ, 847, 15
- Bergemann et al. (2019) Bergemann, M., Gallagher, A. J., Eitner, P., et al. 2019, A&A, 631, A80
- Bergemann et al. (2012a) Bergemann, M., Hansen, C. J., Bautista, M., & Ruchti, G. 2012a, A&A, 546, A90
- Bergemann et al. (2013) Bergemann, M., Kudritzki, R.-P., Würl, M., et al. 2013, ApJ, 764, 115
- Bergemann et al. (2012b) Bergemann, M., Lind, K., Collet, R., Magic, Z., & Asplund, M. 2012b, MNRAS, 427, 27
- Bergemann et al. (2010) Bergemann, M., Pickering, J. C., & Gehren, T. 2010, MNRAS, 401, 1334
- Bisterzo et al. (2014) Bisterzo, S., Travaglio, C., Gallino, R., Wiescher, M., & Käppeler, F. 2014, ApJ, 787, 10
- Bland-Hawthorn & Gerhard (2016) Bland-Hawthorn, J. & Gerhard, O. 2016, ARA&A, 54, 529
- Bonifacio et al. (1999) Bonifacio, P., Centurion, M., & Molaro, P. 1999, MNRAS, 309, 533
- Bonifacio et al. (2009) Bonifacio, P., Spite, M., Cayrel, R., et al. 2009, A&A, 501, 519
- Bovy (2015) Bovy, J. 2015, ApJS, 216, 29
- Bressan et al. (2012) Bressan, A., Marigo, P., Girardi, L., et al. 2012, MNRAS, 427, 127
- Buck et al. (2020) Buck, T., Obreja, A., Macciò, A. V., et al. 2020, MNRAS, 491, 3461
- Bullock & Johnston (2005) Bullock, J. S. & Johnston, K. V. 2005, ApJ, 635, 931
- Caffau et al. (2011) Caffau, E., Bonifacio, P., François, P., et al. 2011, Nature, 477, 67
- Carigi & Hernandez (2008) Carigi, L. & Hernandez, X. 2008, MNRAS, 390, 582
- Carrillo et al. (2024) Carrillo, A., Deason, A. J., Fattahi, A., Callingham, T. M., & Grand, R. J. J. 2024, MNRAS, 527, 2165
- Carter et al. (2021) Carter, C., Conroy, C., Zaritsky, D., et al. 2021, ApJ, 908, 208
- Cayrel et al. (2004) Cayrel, R., Depagne, E., Spite, M., et al. 2004, A&A, 416, 1117
- Cenarro et al. (2019) Cenarro, A. J., Moles, M., Cristóbal-Hornillos, D., et al. 2019, A&A, 622, A176
- Chiti et al. (2018) Chiti, A., Frebel, A., Ji, A. P., et al. 2018, ApJ, 857, 74
- Cohen & Huang (2010) Cohen, J. G. & Huang, W. 2010, ApJ, 719, 931
- Cordoni et al. (2021) Cordoni, G., Da Costa, G. S., Yong, D., et al. 2021, MNRAS, 503, 2539
- Cristallo et al. (2009) Cristallo, S., Straniero, O., Gallino, R., et al. 2009, ApJ, 696, 797
- Cristallo et al. (2007) Cristallo, S., Straniero, O., Lederer, M. T., & Aringer, B. 2007, ApJ, 667, 489
- Cui et al. (2012) Cui, X.-Q., Zhao, Y.-H., Chu, Y.-Q., et al. 2012, Research in Astronomy and Astrophysics, 12, 1197
- Da Costa et al. (2019) Da Costa, G. S., Bessell, M. S., Mackey, A. D., et al. 2019, MNRAS, 489, 5900
- Dalton et al. (2012) Dalton, G., Trager, S. C., Abrams, D. C., et al. 2012, Society of Photo-Optical Instrumentation Engineers (SPIE) Conference Series, Vol. 8446, WEAVE: the next generation wide-field spectroscopy facility for the William Herschel Telescope, 84460P
- Das et al. (2020) Das, P., Hawkins, K., & Jofré, P. 2020, MNRAS, 493, 5195
- de Brito Silva et al. (2024) de Brito Silva, D., Jofré, P., Tissera, P. B., et al. 2024, ApJ, 962, 154
- Di Matteo et al. (2020) Di Matteo, P., Spite, M., Haywood, M., et al. 2020, A&A, 636, A115
- Doherty et al. (2014) Doherty, C. L., Gil-Pons, P., Lau, H. H. B., Lattanzio, J. C., & Siess, L. 2014, MNRAS, 437, 195
- Dovgal et al. (2024) Dovgal, A., Venn, K. A., Sestito, F., et al. 2024, MNRAS, 527, 7810
- Ebinger et al. (2020) Ebinger, K., Curtis, S., Ghosh, S., et al. 2020, ApJ, 888, 91
- El-Badry et al. (2018) El-Badry, K., Bland-Hawthorn, J., Wetzel, A., et al. 2018, MNRAS, 480, 652
- Feltzing et al. (2009) Feltzing, S., Eriksson, K., Kleyna, J., & Wilkinson, M. I. 2009, A&A, 508, L1
- Fernández-Alvar et al. (2018) Fernández-Alvar, E., Carigi, L., Schuster, W. J., et al. 2018, ApJ, 852, 50
- Fernández-Alvar et al. (2024) Fernández-Alvar, E., Kordopatis, G., Hill, V., et al. 2024, A&A, 685, A151
- Fernández-Alvar et al. (2021) Fernández-Alvar, E., Kordopatis, G., Hill, V., et al. 2021, MNRAS, 508, 1509
- François et al. (2016) François, P., Monaco, L., Bonifacio, P., et al. 2016, A&A, 588, A7
- Frebel et al. (2016) Frebel, A., Norris, J. E., Gilmore, G., & Wyse, R. F. G. 2016, ApJ, 826, 110
- Frebel et al. (2010) Frebel, A., Simon, J. D., Geha, M., & Willman, B. 2010, ApJ, 708, 560
- Frebel et al. (2014) Frebel, A., Simon, J. D., & Kirby, E. N. 2014, ApJ, 786, 74
- Freeman & Bland-Hawthorn (2002) Freeman, K. & Bland-Hawthorn, J. 2002, ARA&A, 40, 487
- Gaia Collaboration et al. (2018) Gaia Collaboration, Brown, A. G. A., Vallenari, A., et al. 2018, A&A, 616, A1
- Gaia Collaboration et al. (2016) Gaia Collaboration, Prusti, T., de Bruijne, J. H. J., et al. 2016, A&A, 595, A1
- Gaia Collaboration et al. (2023) Gaia Collaboration, Vallenari, A., Brown, A. G. A., et al. 2023, A&A, 674, A1
- Galarza et al. (2022) Galarza, C. A., Daflon, S., Placco, V. M., et al. 2022, A&A, 657, A35
- Gilmore et al. (2013) Gilmore, G., Norris, J. E., Monaco, L., et al. 2013, ApJ, 763, 61
- González Hernández & Bonifacio (2009) González Hernández, J. I. & Bonifacio, P. 2009, A&A, 497, 497
- González Rivera de La Vernhe et al. (2024) González Rivera de La Vernhe, I., Hill, V., Kordopatis, G., et al. 2024, arXiv e-prints, arXiv:2406.05728
- Gustafsson et al. (2008) Gustafsson, B., Edvardsson, B., Eriksson, K., et al. 2008, A&A, 486, 951
- Hansen et al. (2018) Hansen, C. J., El-Souri, M., Monaco, L., et al. 2018, ApJ, 855, 83
- Hansen et al. (2017) Hansen, T. T., Simon, J. D., Marshall, J. L., et al. 2017, ApJ, 838, 44
- Hawkins et al. (2015) Hawkins, K., Jofré, P., Masseron, T., & Gilmore, G. 2015, MNRAS, 453, 758
- Heger & Woosley (2010) Heger, A. & Woosley, S. E. 2010, ApJ, 724, 341
- Helmi (2020) Helmi, A. 2020, ARA&A, 58, 205
- Helmi et al. (2018) Helmi, A., Babusiaux, C., Koppelman, H. H., et al. 2018, Nature, 563, 85
- Hill et al. (2019) Hill, V., Skúladóttir, Á., Tolstoy, E., et al. 2019, A&A, 626, A15
- Hopkins et al. (2018) Hopkins, P. F., Wetzel, A., Kereš, D., et al. 2018, MNRAS, 480, 800
- Horta et al. (2021) Horta, D., Schiavon, R. P., Mackereth, J. T., et al. 2021, MNRAS, 500, 1385
- Horta et al. (2023) Horta, D., Schiavon, R. P., Mackereth, J. T., et al. 2023, MNRAS, 520, 5671
- Howes et al. (2014) Howes, L. M., Asplund, M., Casey, A. R., et al. 2014, MNRAS, 445, 4241
- Howes et al. (2016) Howes, L. M., Asplund, M., Keller, S. C., et al. 2016, MNRAS, 460, 884
- Howes et al. (2015) Howes, L. M., Casey, A. R., Asplund, M., et al. 2015, Nature, 527, 484
- Ishigaki et al. (2014) Ishigaki, M. N., Aoki, W., Arimoto, N., & Okamoto, S. 2014, A&A, 562, A146
- Ivanova & Shimanskiĭ (2000) Ivanova, D. V. & Shimanskiĭ, V. V. 2000, Astronomy Reports, 44, 376
- Jackson et al. (2021) Jackson, H., Jofré, P., Yaxley, K., et al. 2021, MNRAS, 502, 32
- Jeřábková et al. (2018) Jeřábková, T., Hasani Zonoozi, A., Kroupa, P., et al. 2018, A&A, 620, A39
- Ji et al. (2016a) Ji, A. P., Frebel, A., Chiti, A., & Simon, J. D. 2016a, Nature, 531, 610
- Ji et al. (2016b) Ji, A. P., Frebel, A., Ezzeddine, R., & Casey, A. R. 2016b, ApJ, 832, L3
- Ji et al. (2016c) Ji, A. P., Frebel, A., Simon, J. D., & Chiti, A. 2016c, ApJ, 830, 93
- Ji et al. (2019) Ji, A. P., Simon, J. D., Frebel, A., Venn, K. A., & Hansen, T. T. 2019, ApJ, 870, 83
- Jin et al. (2024) Jin, S., Trager, S. C., Dalton, G. B., et al. 2024, MNRAS, 530, 2688
- Jofré et al. (2017) Jofré, P., Das, P., Bertranpetit, J., & Foley, R. 2017, MNRAS, 467, 1140
- Jönsson et al. (2020) Jönsson, H., Holtzman, J. A., Allende Prieto, C., et al. 2020, AJ, 160, 120
- Just et al. (2015) Just, O., Bauswein, A., Ardevol Pulpillo, R., Goriely, S., & Janka, H. T. 2015, MNRAS, 448, 541
- Karakas & Lugaro (2016) Karakas, A. I. & Lugaro, M. 2016, ApJ, 825, 26
- Khoperskov et al. (2021) Khoperskov, S., Haywood, M., Snaith, O., et al. 2021, MNRAS, 501, 5176
- Kirby & Cohen (2012) Kirby, E. N. & Cohen, J. G. 2012, AJ, 144, 168
- Kobayashi et al. (2020) Kobayashi, C., Karakas, A. I., & Lugaro, M. 2020, ApJ, 900, 179
- Koch et al. (2013) Koch, A., Feltzing, S., Adén, D., & Matteucci, F. 2013, A&A, 554, A5
- Koch et al. (2008) Koch, A., McWilliam, A., Grebel, E. K., Zucker, D. B., & Belokurov, V. 2008, ApJ, 688, L13
- Koch et al. (2016) Koch, A., McWilliam, A., Preston, G. W., & Thompson, I. B. 2016, A&A, 587, A124
- Koppelman et al. (2019) Koppelman, H. H., Helmi, A., Massari, D., Price-Whelan, A. M., & Starkenburg, T. K. 2019, A&A, 631, L9
- Kordopatis et al. (2013) Kordopatis, G., Gilmore, G., Wyse, R. F. G., et al. 2013, MNRAS, 436, 3231
- Kordopatis et al. (2023) Kordopatis, G., Schultheis, M., McMillan, P. J., et al. 2023, A&A, 669, A104
- Koutsouridou et al. (2023) Koutsouridou, I., Salvadori, S., Skúladóttir, Á., et al. 2023, MNRAS, 525, 190
- Kraft & Ivans (2003) Kraft, R. P. & Ivans, I. I. 2003, PASP, 115, 143
- Kroupa (2002) Kroupa, P. 2002, Science, 295, 82
- Letarte et al. (2010) Letarte, B., Hill, V., Tolstoy, E., et al. 2010, A&A, 523, A17
- Li et al. (2023) Li, C., Yuan, Z., Monari, G., et al. 2023, arXiv e-prints, arXiv:2311.15270
- Li et al. (2022) Li, H., Aoki, W., Matsuno, T., et al. 2022, ApJ, 931, 147
- Li et al. (2015) Li, H., Aoki, W., Zhao, G., et al. 2015, PASJ, 67, 84
- Limongi & Chieffi (2018) Limongi, M. & Chieffi, A. 2018, ApJS, 237, 13
- Lind et al. (2012) Lind, K., Bergemann, M., & Asplund, M. 2012, MNRAS, 427, 50
- Lindegren et al. (2021) Lindegren, L., Klioner, S. A., Hernández, J., et al. 2021, A&A, 649, A2
- Lucchesi et al. (2024) Lucchesi, R., Jablonka, P., Skúladóttir, Á., et al. 2024, A&A, 686, A266
- Lucchesi et al. (2022) Lucchesi, R., Lardo, C., Jablonka, P., et al. 2022, MNRAS, 511, 1004
- Lucey et al. (2022) Lucey, M., Hawkins, K., Ness, M., et al. 2022, MNRAS, 509, 122
- Malhan & Rix (2024) Malhan, K. & Rix, H.-W. 2024, ApJ, 964, 104
- Mardini et al. (2022a) Mardini, M. K., Frebel, A., Chiti, A., et al. 2022a, ApJ, 936, 78
- Mardini et al. (2022b) Mardini, M. K., Frebel, A., Ezzeddine, R., et al. 2022b, MNRAS, 517, 3993
- Martin et al. (2023) Martin, N. F., Starkenburg, E., Yuan, Z., et al. 2023, arXiv e-prints, arXiv:2308.01344
- Mashonkina et al. (2017a) Mashonkina, L., Jablonka, P., Pakhomov, Y., Sitnova, T., & North, P. 2017a, A&A, 604, A129
- Mashonkina et al. (2017b) Mashonkina, L., Jablonka, P., Sitnova, T., Pakhomov, Y., & North, P. 2017b, A&A, 608, A89
- Mashonkina & Belyaev (2019) Mashonkina, L. I. & Belyaev, A. K. 2019, Astronomy Letters, 45, 341
- Masseron et al. (2014) Masseron, T., Plez, B., Van Eck, S., et al. 2014, A&A, 571, A47
- Matsuno et al. (2019) Matsuno, T., Aoki, W., & Suda, T. 2019, ApJ, 874, L35
- McConnachie (2012) McConnachie, A. W. 2012, AJ, 144, 4
- Minchev & Famaey (2010) Minchev, I. & Famaey, B. 2010, ApJ, 722, 112
- Mucciarelli et al. (2021) Mucciarelli, A., Bellazzini, M., & Massari, D. 2021, A&A, 653, A90
- Myeong et al. (2019) Myeong, G. C., Vasiliev, E., Iorio, G., Evans, N. W., & Belokurov, V. 2019, MNRAS, 488, 1235
- Naidu et al. (2020) Naidu, R. P., Conroy, C., Bonaca, A., et al. 2020, ApJ, 901, 48
- Necib et al. (2020) Necib, L., Ostdiek, B., Lisanti, M., et al. 2020, Nature Astronomy, 4, 1078
- Nelson et al. (2019) Nelson, D., Springel, V., Pillepich, A., et al. 2019, Computational Astrophysics and Cosmology, 6, 2
- Nepal et al. (2024) Nepal, S., Chiappini, C., Queiroz, A. B. A., et al. 2024, arXiv e-prints, arXiv:2402.00561
- Nomoto et al. (2013) Nomoto, K., Kobayashi, C., & Tominaga, N. 2013, ARA&A, 51, 457
- Nordlander & Lind (2017) Nordlander, T. & Lind, K. 2017, A&A, 607, A75
- Norris et al. (2010) Norris, J. E., Wyse, R. F. G., Gilmore, G., et al. 2010, ApJ, 723, 1632
- Perottoni et al. (2024) Perottoni, H. D., Placco, V. M., Almeida-Fernandes, F., et al. 2024, arXiv e-prints, arXiv:2407.05004
- Pillepich et al. (2019) Pillepich, A., Nelson, D., Springel, V., et al. 2019, MNRAS, 490, 3196
- Placco et al. (2022) Placco, V. M., Almeida-Fernandes, F., Arentsen, A., et al. 2022, ApJS, 262, 8
- Placco et al. (2014) Placco, V. M., Frebel, A., Beers, T. C., & Stancliffe, R. J. 2014, ApJ, 797, 21
- Placco et al. (2021) Placco, V. M., Sneden, C., Roederer, I. U., et al. 2021, Research Notes of the American Astronomical Society, 5, 92
- Plez (2012) Plez, B. 2012, Turbospectrum: Code for spectral synthesis
- Re Fiorentin et al. (2021) Re Fiorentin, P., Spagna, A., Lattanzi, M. G., & Cignoni, M. 2021, ApJ, 907, L16
- Reggiani et al. (2020) Reggiani, H., Schlaufman, K. C., Casey, A. R., & Ji, A. P. 2020, AJ, 160, 173
- Rizzuti et al. (2019) Rizzuti, F., Cescutti, G., Matteucci, F., et al. 2019, MNRAS, 489, 5244
- Roederer et al. (2016a) Roederer, I. U., Karakas, A. I., Pignatari, M., & Herwig, F. 2016a, ApJ, 821, 37
- Roederer et al. (2016b) Roederer, I. U., Mateo, M., Bailey, John I., I., et al. 2016b, AJ, 151, 82
- Sadakane et al. (2004) Sadakane, K., Arimoto, N., Ikuta, C., et al. 2004, PASJ, 56, 1041
- Saitou & Nei (1987) Saitou, N. & Nei, M. 1987, Molecular Biology and Evolution, 4, 406
- Santistevan et al. (2021) Santistevan, I. B., Wetzel, A., Sanderson, R. E., et al. 2021, MNRAS, 505, 921
- Schlafly & Finkbeiner (2011) Schlafly, E. F. & Finkbeiner, D. P. 2011, ApJ, 737, 103
- Schlaufman et al. (2018) Schlaufman, K. C., Thompson, I. B., & Casey, A. R. 2018, ApJ, 867, 98
- Sestito et al. (2024a) Sestito, F., Ardern-Arentsen, A., Vitali, S., et al. 2024a, arXiv e-prints, arXiv:2406.18636
- Sestito et al. (2021) Sestito, F., Buck, T., Starkenburg, E., et al. 2021, MNRAS, 500, 3750
- Sestito et al. (2024b) Sestito, F., Hayes, C. R., Venn, K. A., et al. 2024b, MNRAS, 528, 4838
- Sestito et al. (2019) Sestito, F., Longeard, N., Martin, N. F., et al. 2019, MNRAS, 484, 2166
- Sestito et al. (2020) Sestito, F., Martin, N. F., Starkenburg, E., et al. 2020, MNRAS, 497, L7
- Sestito et al. (2023a) Sestito, F., Venn, K. A., Arentsen, A., et al. 2023a, MNRAS, 518, 4557
- Sestito et al. (2024c) Sestito, F., Vitali, S., Jofre, P., et al. 2024c, arXiv e-prints, arXiv:2405.00096
- Sestito et al. (2023b) Sestito, F., Zaremba, D., Venn, K. A., et al. 2023b, MNRAS, 525, 2875
- Shetrone et al. (2001) Shetrone, M. D., Côté, P., & Sargent, W. L. W. 2001, ApJ, 548, 592
- Simmerer et al. (2004) Simmerer, J., Sneden, C., Cowan, J. J., et al. 2004, ApJ, 617, 1091
- Skúladóttir et al. (2024a) Skúladóttir, Á., Koutsouridou, I., Vanni, I., et al. 2024a, ApJ, 968, L23
- Skúladóttir et al. (2024b) Skúladóttir, Á., Vanni, I., Salvadori, S., & Lucchesi, R. 2024b, A&A, 681, A44
- Sneden (1973) Sneden, C. A. 1973, PhD thesis, THE UNIVERSITY OF TEXAS AT AUSTIN.
- Sobeck et al. (2011) Sobeck, J. S., Kraft, R. P., Sneden, C., et al. 2011, AJ, 141, 175
- Sotillo-Ramos et al. (2023) Sotillo-Ramos, D., Bergemann, M., Friske, J. K. S., & Pillepich, A. 2023, MNRAS, 525, L105
- Spite et al. (2006) Spite, M., Cayrel, R., Hill, V., et al. 2006, A&A, 455, 291
- Starkenburg et al. (2017a) Starkenburg, E., Martin, N., Youakim, K., et al. 2017a, MNRAS, 471, 2587
- Starkenburg et al. (2017b) Starkenburg, E., Oman, K. A., Navarro, J. F., et al. 2017b, MNRAS, 465, 2212
- Stetson & Pancino (2008) Stetson, P. B. & Pancino, E. 2008, PASP, 120, 1332
- Straniero et al. (2006) Straniero, O., Gallino, R., & Cristallo, S. 2006, Nucl. Phys. A, 777, 311
- Suda et al. (2008) Suda, T., Katsuta, Y., Yamada, S., et al. 2008, PASJ, 60, 1159
- Taylor (2005) Taylor, M. B. 2005, in Astronomical Society of the Pacific Conference Series, Vol. 347, Astronomical Data Analysis Software and Systems XIV, ed. P. Shopbell, M. Britton, & R. Ebert, 29
- Tissera & Scannapieco (2014) Tissera, P. B. & Scannapieco, C. 2014, MNRAS, 445, L21
- Tissera et al. (2012) Tissera, P. B., White, S. D. M., & Scannapieco, C. 2012, MNRAS, 420, 255
- Tody (1986) Tody, D. 1986, in Society of Photo-Optical Instrumentation Engineers (SPIE) Conference Series, Vol. 627, Society of Photo-Optical Instrumentation Engineers (SPIE), ed. D. L. Crawford, 733
- Tody (1993) Tody, D. 1993, in Astronomical Society of the Pacific Conference Series, Vol. 52, Astronomical Data Analysis Software and Systems II, ed. R. J. Hanisch, R. J. V. Brissenden, & J. Barnes, 173
- Tolstoy et al. (2009) Tolstoy, E., Hill, V., & Tosi, M. 2009, ARA&A, 47, 371
- Tumlinson (2010) Tumlinson, J. 2010, The Astrophysical Journal, 708, 1398
- Ural et al. (2015) Ural, U., Cescutti, G., Koch, A., et al. 2015, MNRAS, 449, 761
- Vanni et al. (2023) Vanni, I., Salvadori, S., Skúladóttir, Á., Rossi, M., & Koutsouridou, I. 2023, MNRAS, 526, 2620
- Venn et al. (2020) Venn, K. A., Kielty, C. L., Sestito, F., et al. 2020, MNRAS, 492, 3241
- Venn et al. (2017) Venn, K. A., Starkenburg, E., Malo, L., Martin, N., & Laevens, B. P. M. 2017, MNRAS, 466, 3741
- Viswanathan et al. (2024a) Viswanathan, A., Byström, A., Starkenburg, E., et al. 2024a, arXiv e-prints, arXiv:2408.17250
- Viswanathan et al. (2024b) Viswanathan, A., Yuan, Z., Ardern-Arentsen, A., et al. 2024b, arXiv e-prints, arXiv:2405.13124
- Waller et al. (2023) Waller, F., Venn, K. A., Sestito, F., et al. 2023, MNRAS, 519, 1349
- Walsen et al. (2024) Walsen, K., Jofré, P., Buder, S., et al. 2024, MNRAS, 529, 2946
- Wanajo et al. (2021) Wanajo, S., Hirai, Y., & Prantzos, N. 2021, MNRAS, 505, 5862
- Wanajo et al. (2014) Wanajo, S., Sekiguchi, Y., Nishimura, N., et al. 2014, ApJ, 789, L39
- Weidner et al. (2013) Weidner, C., Kroupa, P., & Pflamm-Altenburg, J. 2013, MNRAS, 434, 84
- Wenger et al. (2000) Wenger, M., Ochsenbein, F., Egret, D., et al. 2000, A&AS, 143, 9
- Wise et al. (2012) Wise, J. H., Turk, M. J., Norman, M. L., & Abel, T. 2012, ApJ, 745, 50
- Woosley & Weaver (1995) Woosley, S. E. & Weaver, T. A. 1995, ApJS, 101, 181
- York et al. (2000) York, D. G., Adelman, J., Anderson, John E., J., et al. 2000, AJ, 120, 1579
- Youakim et al. (2017) Youakim, K., Starkenburg, E., Aguado, D. S., et al. 2017, MNRAS, 472, 2963
- Yuan et al. (2023) Yuan, Z., Li, C., Martin, N. F., et al. 2023, arXiv e-prints, arXiv:2311.08464
- Zhang et al. (2024) Zhang, R., Matsuno, T., Li, H., et al. 2024, ApJ, 966, 174
- Zhao et al. (2012) Zhao, G., Zhao, Y.-H., Chu, Y.-Q., Jing, Y.-P., & Deng, L.-C. 2012, Research in Astronomy and Astrophysics, 12, 723