:
\theoremsep
\jmlrvolume252
\jmlryear2024
\jmlrworkshopMachine Learning for Healthcare
Benchmarking Reliability of Deep Learning Models for Pathological Gait Classification
Abstract
Early detection of neurodegenerative disorders is an important open problem, since early diagnosis and treatment may yield a better prognosis. Researchers have recently sought to leverage advances in machine learning algorithms to detect symptoms of altered gait, possibly corresponding to the emergence of neurodegenerative etiologies. However, while several claims of positive and accurate detection have been made in the recent literature, using a variety of sensors and algorithms, solutions are far from being realized in practice. This paper analyzes existing approaches to identify gaps inhibiting translation. Using a set of experiments across three Kinect-simulated and one real Parkinson’s patient datasets, we highlight possible sources of errors and generalization failures in these approaches. Based on these observations, we propose our strong baseline called Asynchronous Multi-Stream Graph Convolutional Network (AMS-GCN) that can reliably differentiate multiple categories of pathological gaits across datasets.
1 Introduction
Gait impairments, particularly those resulting from Parkinson’s Disease(PD), Alzheimer’s disease (AD), and other neurodegenerative disorders, cause muscle stiffness, dis-coordination, tremors, and posture instability and severely reduce peoples’ quality of life. Freezing of gait (FOG), visible in more severe conditions, significantly increases the risk of falls and fractures (Coste et al., 2014). Gait symptoms such as slowness also correlate with the onset of dementia (Mielke et al., 2013). Aging increases the risk of gait disorders, rising from 10 % to more than 60 % in people from 60 to 80 years of age (Mahlknecht et al., 2013). Despite this criticality, gait asymmetries and deficits largely remain underdiagnosed and receive subpar medical attention. (Rubenstein et al., 2004).
Early diagnosis of gait-related disorders reduces the overall health care cost and initiates effective therapy routine (Pistacchi et al., 2017). As a possible method for reducing costs of such diagnosis at scale, automatic pathological gait classification has received significant interest in recent times, with most prominent approaches using customized sensor arrays for gait tracking (Xu et al., 2021; Schlachetzki et al., 2017; Um et al., 2017; Kubota et al., 2016). While highly accurate, sensor-based methods are inconvenient and obtrusive, thus limiting their usability for the general populace. Sensor arrays require accurate placement, rendering them implausible for self- or weakly-supervised diagnosis of gait problems.
Non-invasive computer vision methods employing machine learning techniques turn out to be a promising replacement for such sensor-based gait analysis. For instance, features from gait video sequences can be extracted to classify gait as healthy or abnormal (Nieto-Hidalgo et al., 2016; Ajay et al., 2018; Nguyen et al., 2016). Similarly, Silhouette-based feature extraction used in biometric technology, has possible extensions to pathological gait classification (Albuquerque et al., 2021; Ortells et al., 2018; Loureiro and Correia, 2020). However, being appearance-based, such models collapse with scale and clothing variations (Wang et al., 2010).
Common gait anomalies like lurching, freezing, and stiff-legged gait can be imitated under supervision. As health data is costly, such simulations are invaluable. They can be recorded through the use of knee and sole pads, combined with restricted joint movements. Recent studies show that an affordable Kinect can efficiently capture skeleton information (Meng et al., 2016; Li et al., 2018; Jun et al., 2020a; Pachón-Suescún et al., 2020). Furthermore, the recorded data is considered precise enough to be suitable for training and classification (Stone and Skubic, 2011; Clark et al., 2019). The Multi-Modal Gait Symmetry dataset (MMGS) (Khokhlova et al., 2019), Walking Gait dataset (Nguyen et al., 2018), and Pathological Gait dataset (Jun et al., 2020b) are three such Kinect-based datasets with simulated gait pathologies.
Graph Networks are well suited to model structured information, with applications in pose estimation (Xu and Takano, 2021), motion modeling (Huang et al., 2019; Mohamed et al., 2020; Jaiswal et al., 2023) and physics prediction (Battaglia et al., 2016; Sanchez-Gonzalez et al., 2020), among others. Of them, the Spatio-Temporal Graph Convolutional Networks (STGCN), specially designed for processing skeleton information, have been prolifically used for skeleton-based action recognition (Yan et al., 2018; Cheng et al., 2020) and are currently state-of-the-art in the task of pathological gait classification.
But as we discuss in detail below, several methods proposed for gait classification premise on individual models fitting to only a single dataset. However, we view this approach as a critical limitation. Robustness and fairness are paramount to healthcare applications, where inaccurate predictions could significantly affect the well-being of individuals and the effectiveness of treatment protocols. Therefore, addressing these limitations and exploring approaches that ensure reliable and accountable gait classification is crucial. This paper aims to tackle these challenges.
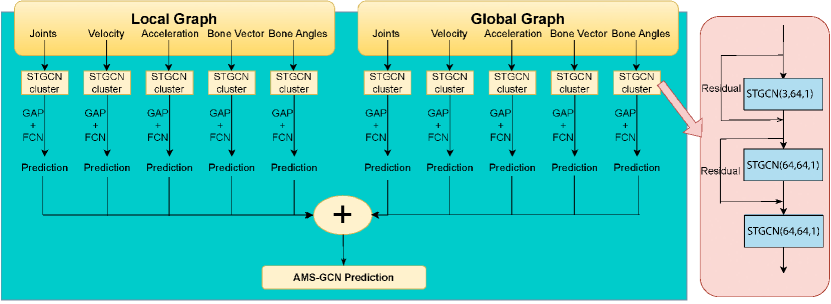
Specifically, we aim to provide quantitative benchmarks for the ability of state-of-the-art pathological gait classification models. To this end, we conduct various experiments across three simulated pathological gait datasets and one dataset incorporating real gait pathologies (Section 3). Consequently, identifying large distribution shifts in the most acclaimed gait classification models, we also propose and evaluate a new baseline for pathological gait classification, Asynchronous Multi-Stream Graph Convolution Network (AMS-GCN) (Figure 1), demonstrating robust classification performance across datasets (Section 4 and 5). AMS-GCN ensembles gait features over local and global graphs (Figure 2), validating stand-alone feature efficiency and furnishing critical clinical insights. Moreover, it demonstrates nearly identical performance across both validation and test sets, distinguishing itself from the outcomes of previous methods.
Additionally, we evaluate the AMS-GCN with various feature combinations and ensembling techniques, drawing out strategies effective for practical applications in healthcare (Section 6).
Generalizable Insights about Machine Learning in the Context of Healthcare
-
•
We explore the generalizability of existing gait classification algorithms on multiple datasets, highlighting potential causes inhibiting test time translation. Consequently, we show that it is easy to overfit healthcare data tested in isolation, which is antithesis to robustness critical to healthcare.
-
•
We propose an Asymmetric Multi-Stream Graph Convolutional Network, holistically processing motion information to assist pathological gait identification in home settings. Here we emphasize that, in many instances, surprisingly simple combinations can outperform overly complicated, poorly tested models.
-
•
Finally, using various ablation studies, we draw insights into the relative importance of different gait features used for classification. This opens up avenues for complimenting existing geriatric evaluations with additional gait parameters, thereby supporting clinical studies.
2 Gait Classification
Markerless vision systems like camera systems, even though unobtrusive, are prone to errors and produce noisy joint coordinates. To validate the Kinect approach and provide a foundation for future research, Stone and Skubic (2011) assessed the reliability of Kinect-based gait parameters, including walking speed, stride time, and stride length, against marker-based Vicon Motion Capture systems. Their findings identified these parameters as suitable for detecting early-onset of gait abnormalities and assessing fall risk.
Employing feature engineering to model spatiotemporal relationships, Chaaraoui et al. (2015) utilized Joint Motion History to diagnose gait abnormalities, focusing on a small set of 56 data sequences. For binary classification across nine gait classes, Nguyen et al. (2016) trained an HMM model on body limb angles to diagnose anomalies using a log-likelihood threshold.
In a non-Kinect-based setting, Ajay et al. (2018) classified Parkinsonian gait directly from YouTube videos recorded from pervasive devices like smartphones and webcams. Meanwhile, Li et al. (2018) encoded 3D joint motion trajectories, computing joint correlations for classification on a private dataset. These approaches avoid using joints’ spatiotemporal information directly to reduce noise but are only functional in straightforward scenarios.
Others have explored the use of sequential and convolutional end-to-end architectures to broaden the scope of results. For instance, Khokhlova et al. (2019) employed 3D knee and hip flexion angles, along with rotation data extracted from Kinect gait cycles, to train an LSTM ensemble, effectively reducing result variance.
Given that gait impairments correspond to a decline in specific limb functionalities, Jun et al. (2020b) developed a GRU-based classifier using 3D skeletal data, and they observed classification scores with different joint groups. In another approach, Sadeghzadehyazdi et al. (2021) utilized a CNN-LSTM model with KL divergence loss on normalized joints data, applying transfer learning on a different simulated dataset. Taking an encoding-based approach, Jun et al. (2020a) extracted gait features from a Recurrent Neural Network Autoencoder (RNN-AE) and compared these features with multiple discriminative models. However, these studies primarily present results on one or two datasets, necessitating further examination.
Recent research has increasingly turned towards Graph Networks for modeling human pose, with a specific emphasis on leveraging Spatio-Temporal Graph Convolutional Networks (STGCN) (Yan et al., 2018) as the foundational element for gait classification. For example, He et al. (2022) utilized a dual-branched STGCN model to independently process global and local features, capturing subtle manifestations of Parkinson’s disease. They recorded and validated their model using a dataset from Parkinson’s patients (PD-Walk). In another study, Tian et al. (2022) implemented a three-way data partitioning scheme on seven lower limb joints, incorporating joint, bone, and sagittal symmetry features along with an attention mechanism. Similarly, Kim et al. (2022) constructed a multi-branched bottleneck architecture with five STGCN blocks and attention modules, presenting results on publicly available activity recognition and gait datasets.
However, these methods require further investigation before they can be put into practice, as multi-STGCN systems could be susceptible to overparameterization. As such, we undertake a more in-depth analysis of these results in subsequent sections. Additionally, we offer insights into the features and model specifications that prove effective and highlight errors made by previous works. This analysis forms the first part of our contributions.
In the latter part of the paper, leveraging our insights, we construct an expert committee model for diagnosing pathological gait, while also exploring various modalities of prediction amalgamation. Surprisingly, a simpler and more straightforward model emerges as the clear winner, establishing itself as a robust baseline for any work on pathological gait classification.
3 Benchmarking Study
3.1 Dataset Statistics
Video-based pathological gait detection can assist geriatricians and patients with quantitative gait measurements and support for early diagnosis, cutting down frequent hospital commutes, particularly for patients with mobility impairments.
In the absence of real patient data, researchers have recognized simulated walks as a fitting differentiator between standard gait patterns and multifarious abnormalities. Here, we present a succinct overview of three prominent simulated datasets repeatedly used for model evaluations for pathological gait classification.
Multi-Modal Gait Symmetry (MMGS) (Khokhlova et al., 2019). This dataset contains three gait categories - normal, limping gait, and knee rigidity gait, with 27 subjects walking each category five to seven times. Limping is simulated by affixing a 7cm padding sole to the right shoe of the subject. The third gait is simulated by constraining knee flexion while walking.
Pathological Gait (Jun et al., 2020b). This dataset contains five pathological gaits - antalgic, stiff-legged, lurching, steppage, and Trendelenburg gaits and one normal category, recorded via six Kinect devices calibrated to be mutually consistent. Each subject walked 20 times for each gait type, and thus this dataset contains 10 subjects x 6 gait types x 120 walks(6 Kinect x 20 times) = 7200 total data clips from 6 Kinects.
Walking Gait (Nguyen et al., 2018). The Walking Gait dataset is recorded via a treadmill and contains nine gait types where the eight abnormal gaits are simulated by padding a sole of 5, 10, and 15 cm under the left and right feet and by attaching a weight of 4-kilogram to the left and right ankles. Nine subjects walk for each of these nine gait types, with each walk containing 1200 frames.
Apart from these, we compare models on PD-Walk dataset (He et al., 2022) which contains data from actual Parkinson’s Disease(PD) patients. This dataset has skeleton joints data from walking videos for 96 PD patients and 95 healthy subjects.
For more details on these datasets, the readers are requested to refer to the specific dataset papers.
While prior results in the gait classification literature appear optimistic, robust assessments of these proposals are not always available. For instance, evaluations often lack validation sets and fail to specify essential hyperparameter details. To enhance accountability and ensure accurate reporting, results should be demonstrated on multiple train, validation, and test splits, and yet many papers are lax in reporting the data splits used.
Even though we have attempted to optimize all relevant hyperparameters in our benchmarking study, it is plausible that specific hyperparameters we could not discover might shift the classification scores closer to claimed values. Nevertheless, our study proceeds from the premise that models should be reproducible based on the details reported in publications, and we meticulously outline all essential implementation assumptions to uphold transparency.
3.2 Contemporary Models
For this study, we examine the best-performing gait classification models based on established machine learning architectures. To thoroughly cover the space of prior works, we focus on FCN (Fully Convolutional Networks), 2s-AGCN (Two-Stream Adaptive Graph Convolutional Networks), MIB-STGCN (Multiple-Input Branch STGCN), and ADGCN (Asymmetric Dual-Stream Graph Convolution Network), the last three being variants of the celebrated STGCNs coming from the skeleton action recognition setting. Below, we briefly describe the key distinctions among these models.
Sadeghzadehyazdi et al. (2021) evaluated multiple models on the Walking Gait dataset (Nguyen et al., 2018), employing eighteen normalized joints and KL divergence loss. We specifically focus on their Fully Convolutional Network (FCN) model, featuring 650 input-output channels in the convolutional layers, followed by a fully connected layer. We adopt their data preprocessing approach, normalizing data between -1 and 1, and apply our data augmentation technique for consistent evaluation (refer Appendix Section A).
While they implemented early stopping, the use of a validation set is not mentioned in their study. Additionally, hyperparameters such as the learning-rate decay rate, momentum value, and L1 regularization constant are unspecified, which we fine-tune ourselves.
Two-Stream Adaptive Graph Convolutional Networks (2s-AGCN) Shi et al. (2019) improves upon the STGCN by integrating dual stream predictions of bone vectors and joint coordinates. This model, leveraging a learnable graph structure and attention module, has demonstrated promising results in action recognition tasks. In our gait classification implementation, each stream of 2s-AGCN comprises three graph convolutional blocks with 64 input and output channels, followed by Global Average Pooling (GAP). Thereafter, the dual stream predictions are summed up to obtain the final model output.
| Class | Train Loss | Best Val Loss | Test Loss |
| 2 | 0.0003 | 0.17 | 0.73 |
| 5 | 0.05 | 0.84 | 1.1 |
| 9 | 0.10 | 1.8 | 1.6 |
Multiple-Input Branch STGCN Kim et al. (2022) uses multiple input branches, in contrast to multiple networks of 2s-AGCN. This model fuses joints, velocity, and bone inputs with three STGCN blocks and processes the concatenated outputs with two STGCN blocks. The two tested variants - with and without attention - show equivalent performance. Consequently, we choose the simpler attentionless configuration for our experiments. Due to the lack of data split specifications, we adopt the same splitting mechanisms used in our other experiments (See Appendix Table 9). For missing hyperparameters, we draw insights from other STGCN-based modalities like Song et al. (2020) and conduct multiple tests with different hyperparameter combinations to report the best results.
Asymmetric Dual-Stream Graph Convolution Network (ADGCN) He et al. (2022) is a dual-stream GCN that utilizes joint coordinates, velocity, and acceleration, feeding these features in pairs to three STGCN blocks. The network employs two joint graphs: local connections consisting of natural joint connections and global connections where each joint connects to a central joint, a scheme also adopted in our proposed model (Figure 2). However, our model differs in two key aspects. First, while ADGCN combines inputs in pairs (trajectory + velocity and velocity + acceleration), we train models independently for each input. Second, we incorporate bone features in our model.
In the original paper, the ADGCN model is trained for 32 epochs with the Adam optimizer, a learning rate of 3e-4 with cosine annealing, and a weight decay of 5e-6. The results are reported using Focal loss and Cross Entropy loss, but Focal loss hyperparameters are not specified. We implement both losses and find the performance similar(see Figure 3). Therefore, all our ensuing comparisons use Cross-Entropy loss to ensure a fair assessment against other models.
3.3 Benchmarking Results
As anticipated, our replication study of the aforementioned models reveals distribution shifts across different datasets when evaluated over different splits, which we quantitatively characterize to provide a holistic perspective on their overall performance (Figure 3).
| Dataset | FCN | 2sAGCN | MIB-STGCN | ADGCN | ||||
| Val | Test | Val | Test | Val | Test | Val | Test | |
| MMGS | 75.2 | 70.1 | 93.3 | 83.2 | 83.0 | 76.7 | 81.1 | 71.8 |
| Walking Gait | 58.1 | 64.1 | 65.3 | 55.3 | 60.4 | 50.0 | *NC | *NC |
| Pathological Gait | 88.2 | 85.5 | 98.0 | 95.6 | 93.4 | 88.1 | 96.4 | 93.9 |
| PD-Walk | 77.1 | 77.2 | 84.1 | 83.1 | 80.1 | 80.1 | 75.1 | 79.1 |
Fully Convolutional Networks (FCN) Sadeghzadehyazdi et al. (2021). Table 1 presents loss values with our reimplementation on the Walking Gait dataset. As the number of classes increase, train-test performance gap escalates. These results offer insights into the kind of misrepresentation that can occur without proper data splits. Table 2 compares performance across all datasets.
Two-Stream Adaptive Graph Convolutional Networks (2s-AGCN) Shi et al. (2019) was designed for action recognition tasks, incorporating nine Adaptive Graph Convolutional Network (AGCN) blocks. Our replicability study employs three AGCN blocks with 64 output channels to prevent overfitting on gait data. Its results across all datasets (Table 2) offer acceptable threshold values for comparing with our proposed model.
Multiple-Input Branch STGCN (MIB-STGCN) Kim et al. (2022). This model uses five STGCN blocks. Testing on multiple datasets (Table 2) reveals significant variations between validation and test accuracies for this model.
Asymmetric Dual-Stream Graph Convolution Network (ADGCN) He et al. (2022). The original ADGCN network, as tested with early stopping in our experiments, converged within the initial ten epochs, and further training only lead to overfitting. Table 2 presents its results across all datasets. Notably, the model failed to converge on the Walking Gait dataset, resulting in Validation and Test F1 scores below 40%.
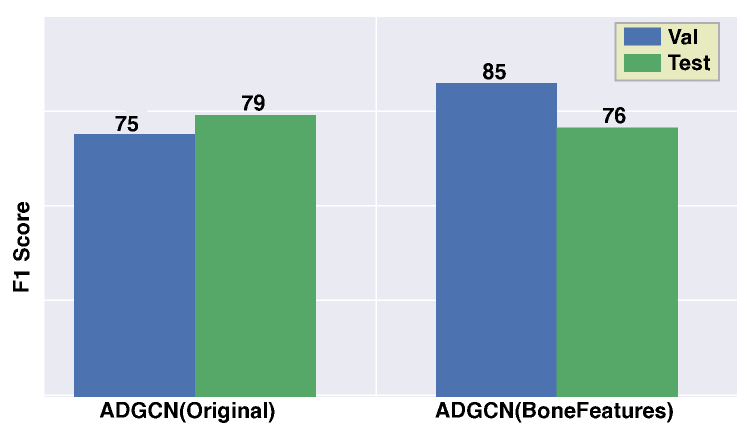
We also tested an ADGCN modification that utilizes the same input features as our proposed model. Figure 1 compares our adaptation—integrating bone features (local graph with bone length and bone angles) as the third input branch and the original ADGCN architecture. While including bone features improved performance on the validation set, this enhancement did not consistently extend to the test set. This suggests that utilizing paired features does not consistently guarantee superior performance. In contrast, our proposed model, involving independent experts, demonstrates consistent improvements, as depicted in Table 3.
In conclusion, our findings suggest that despite the prolific use of STGCN variants in gait classification, their implementation procedure is often unreliable. Our study indicates that these models tend to overfit to the details of a specific training subset, resulting in poor generalization on the test set. While 2s-AGCN demonstrated acceptable performance, some modifications exhibited a test-time performance deterioration. These observations emphasize the need for careful validation when employing STGCN variants for gait classification tasks.
4 Asynchronous Multi-Stream Graph Convolutional Network (AMS-GCN)
In high-dimensional settings, deep learning models often converge poorly, showing promising results only on specific datasets or on certain subspaces of the dataset. The stochastic nature of these optimizations can lead to overfitting on training data, sabotaging performance on the test data. An ensemble can mitigate such problems by averaging over different local optima, preventing any single model from dominating the predictive performance (Sagi and Rokach, 2018).
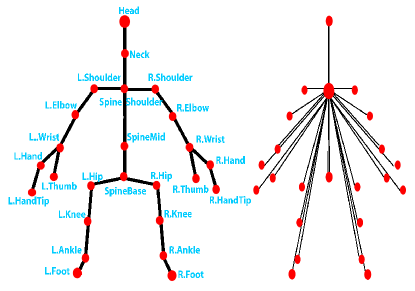
Ensemble learning, characterized by expert committees, involves training these experts on specific input feature spaces and amalgamating their expertise to enhance generalization. Drawing inspiration from Shi et al. (2019), we introduce a Multi-Stream network that incorporates global and local branches, exposing distinct pathologically relevant features for different disorders. Our model uses five features - joint coordinate, velocity, acceleration, bone vector, and bone angle (Appendix Table 11). For each feature, we have two networks - one local network that exploits the natural human-body joint relations, and one global network where all joints are connected to the ”SpineBase” joint, one of the twenty-five joints provided by the Kinect (Figure 2). Thus, we have a total of ten networks in the ensemble.
The ten networks can be trained independently and parallelly for a classification task. Each of these consists of three STGCN blocks with each block having 64 output channels followed by a global average pooling layer. Finally, we apply a fully connected layer with 64 inputs. We use Cross Entropy loss with train-test-validation splits and early stopping for training each network.
To get the final ensemble prediction, we first add the raw output from a feature’s local and global network and convert this sum into probability scores using the softmax function. These values form the prediction score from a single feature. Finally, we average the probability scores from the five features to get the desired AMSGCN prediction. Please see Appendix Section B for preprocessing details.
5 AMS-GCN Classification Analysis
To investigate our model’s performance, we train AMS-GCN over multiple train, validation, and test splits on all the datasets used in this paper. AMS-GCN performs well on all the datasets except for Walking Gait (Table 3). As we describe below, Walking Gait is hard to classify because of subtle inter-class variations. For AMS-GCN, validation and test scores are consistent across all other datasets, exhibiting the model’s robust generalization capabilities. See Appendix Section D for threshold agnostic comparisons.
5.1 Multi-Modal Gait Symmetry (MMGS) Dataset
Khokhlova et al. (2019) used proper train-validation-test splits for assessing this dataset, which we reuse to maintain consistent performance validation. Their findings reveal significant variance between validation and test scores across different splits. This can be due to inherent noise present during data capturing. Different data splits could also be capturing different demographic categories as this dataset contains features from 19 men and 8 women aged 23 to 55 (standard deviation of seven years). Notably, AMS-GCN outperforms all competitors, and demonstrates consistent performance between the validation and test sets (Table 3).
5.2 Walking Gait Dataset
In their study, Nguyen et al. (2016) used five out of nine subjects for training and the remaining four for testing. In our approach, we use five subjects for training, allocate two for validation, and reserve two for testing. Notably, diagnosing treadmill walking proves to be more challenging than regular walking. As indicated in Table 3, all models exhibit suboptimal performance. A more granular analysis shows that classes 4 and 8 (15cm padding sole under left and right feet) are difficult to separate for all the experts of AMS-GCN (Table 4). We also notice that different input features capture class-specific properties, endorsing our hypothesis of an ensemble approach. These findings also suggest that a weighted average ensemble model may be more suitable for this dataset.
| Model | MMGS | Walking Gait | Pathological Gait | PD-Walk | ||||
| Val | Test | Val | Test | Val | Test | Val | Test | |
| FCN | 75.28.1 | 70.16.7 | 58.12.8 | 64.11.4 | 88.27.0 | 85.52.1 | 77.15.7 | 77.23.2 |
| MIB-STGCN | 83.05.5 | 76.76.8 | 60.48.8 | 50.07.2 | 93.43.1 | 88.13.4 | 80.14.1 | 80.14.0 |
| 2s-AGCN | 93.34.6 | 83.22.9 | 65.34.9 | 55.36.5 | 98.01.3 | 95.63.0 | 84.14.2 | 83.14.8 |
| ADGCN | 81.18.8 | 71.810.7 | NC* | NC* | 96.42.7 | 93.93.4 | 75.15.0 | 79.16.0 |
| AMS-GCN | 91.23.9 | 88.33.7 | 73.43.4 | 65.94.5 | 98.61.3 | 96.12.1 | 84.81.5 | 85.42.1 |
5.3 Pathological Gait Dataset
The dataset paper (Jun et al., 2020b) utilizes leave one subject out cross-validation for reporting results. It has data from 10 subjects, so we fixed six subjects for training and two each for validation and testing. Table 3 clearly shows that AMS-GCN outperforms all other models. Other models also perform comparatively well on this dataset. One reason for this could be the use of multiple Kinects, which facilitates robust data collection. Deep learning algorithms are vulnerable to outliers. Hence, a less noisy dataset would generally procure higher accuracy.
5.4 PD-Walk - real Parkinson’s Patient Dataset
The dataset paper offers details on multiple train-test splits but does not include a validation set. To address this, we split their original test set into 40% validation and 60% test data. All models are steady between validation and test results (Table 3). Our proposed model beats the State of the Art algorithm (ADGCN from PD-Walk paper). The success of machine learning with a real Parkinsonian gait dataset demonstrates its potential to aid geriatricians in identifying early signs of neurodegenerative disorders.
| joint input | 1 | 2 | 3 | 4 | 5 | 6 | 7 | 8 | 9 |
| coordinates | 0.59 | 0.64 | 0.46 | 0.52 | 0.66 | 0.78 | 0.52 | 0.41 | 0.80 |
| velocity | 0.60 | 0.44 | 0.38 | 0.37 | 0.79 | 0.38 | 0.14 | 0.49 | 0.52 |
| acceleration | 0.42 | 0.30 | 0.34 | 0.48 | 0.26 | 0.41 | 0.01 | 0.50 | 0.73 |
| bone vectors | 0.31 | 0.31 | 0.25 | 0.00 | 0.65 | 0.50 | 0.57 | 0.52 | 0.83 |
| bone angles | 0.40 | 0.79 | 0.57 | 0.46 | 0.80 | 0.46 | 0.42 | 0.39 | 0.54 |
6 AMS-GCN: Performance Insights
6.1 Ensembling Techniques
To analyze how the ten expert committees of AMS-GCN supplement each other, we test various ensembling techniques such as Hard Weighted Majority Voting, Soft Weighted Majority Voting, and Stacking. For this analysis, we utilize the MMGS dataset (Khokhlova et al., 2019) and report the aggregate results of ten runs over two data splits.
Weighted Majority Voting Algorithm - In this voting scheme, for every wrong ensemble prediction we update the weights of all the incorrect models according to the following scheme:
All the models start with an initial weight of one. In the hard voting case, the weights of the models having the same prediction are summed to form the ensemble prediction, whereas, in the soft voting case, individual model weights and predictions are multiplied and added to generate the ensemble prediction. The weights are updated using the validation set.
In Stacking, the validation set experts’ predictions are used to train another classifier, which predicts the final class for a sample. During test time, this classifier takes the committees’ outputs and predicts the test sample label. For our comparisons, we used the XGBoost classifier. We also tested a Joint Training model by adding another feedforward layer on top of the last STGCN block (having sixty-four-bit output) of each expert. This ensemble trains all models together and gives one consolidated prediction for the ten experts. However, the results of this setup were not so encouraging.
Moreover, the other tested ensembles also could not come close to the performance of our AMS-GCN (Table 5). We hypothesize that even for the same gait abnormality, different feature combinations dominate classification on different data splits, just as the same abnormality can be simulated using different techniques. Hence, relying heavily on certain features grounded on an isolated data segment deteriorates the performance on other segments. This is probably why many of the benchmarked methods do not work when tested across different data splits. They learn specialized feature combinations not universally relevant for all data splits, which is taken care of by an equi-weighted ensemble model.
| Method | Test F1 |
| Hard Weighted Majority | 79.26.6 |
| Soft Weighted Majority | 80.43.0 |
| Stacking | 82.73.4 |
| Joint Training | 76.6 |
| AMS-GCN | 88.33.0 |
| Method | Worst F1 | best F1 |
| MMGS | ||
| 1 | Acc(56.0) | boneA(86.0) |
| 2 | Vel+Acc(55.0) | boneL+boneA(87.0) |
| 3 | Joint+Vel+Acc(77.0) | Acc+boneL+boneA(87.0) |
| 4 | Joint+vel+Acc+boneL(82.0) | Joint+Acc+boneL+boneA(86.0) |
| PD-Walk | ||
| 1 | Acc(17.0) | boneL(87.0) |
| 2 | Vel+Acc(17.0) | boneL+boneA(86.0) |
| 3 | Vel+Acc+boneA(83.0) | Acc+boneL+boneA(86.0) |
| 4 | Joint+Vel+Acc+boneA(85.0) | Vel+Acc+boneL+boneA(86.0) |
| Walking Gait | ||
| 1 | Joint(41.0) | Acc(62.0) |
| 2 | Vel+Acc(54.0) | Joint+Acc(66.0) |
| 3 | Joint+boneL+boneA(55.0) | Vel+Acc+boneA(71.0) |
| 4 | Joint+Vel+Acc+boneL(63.0) | Joint+Acc+boneL+boneA(64.0) |
6.2 Feature Utility.
To gauge the effect of different gait features on classification score, we run AMS-GCN with different combinations of features, using single, pair, triplets, and four features at a time. Table 6 reports the best and worst-performing combinations for each set over ten runs on two data splits of each dataset.
The results show that different datasets have different (combinations of) dominating features. For example, as a single feature, Acceleration does worst on MMGS (Khokhlova et al., 2019), whereas it does best on Walking Gait (Nguyen et al., 2016). We also find that bone features are always part of the best-performing model and thus play a crucial role in differentiating various pathological conditions. However, as we move towards using four or five features, all the models show almost equivalent performance between best and worst feature combinations.
Therefore, from single and pair comparisons we gain insights into the significance of certain features over others. Notably, among comparably performing combinations, removing bone angles almost always degrades results. Similarly, joint coordinates also show up in many of the best-performing combinations. Velocity and acceleration in isolation show bad performance but could be subtly affecting the overall ensemble score. Furthermore, as we increase the number of features in a direct combination, the performance fluctuations settle down. We anticipate that this hierarchical exploration of gait features will help catalyze future advancements in gait assessment methods.
6.3 Performance with Benchmarked Model Inputs
For a more direct comparison against other models, we narrow down the AMS-GCN input space to match that of respective models, as detailed in Table 7, and compare them over multiple runs on multiple splits. The results indicate that even when using a limited number of features, a direct local-global feature ensemble is most robust against subtle variations in gait anomalies. After conducting various tests on the Walking Gait dataset, we found FCN showing high loss values albeit better test accuracy. We hypothesize that FCN might be memorizing patterns in the training set, resulting in a significant loss on specific examples from validation and test sets. Notably, AMS-GCN on Walking Gait with reduced ADGCN features set performed better than using all five features, advocating for a weighted ensemble for this dataset.
Please check github for the code.
| Dataset | FCN Features | MIB-STGCN Features | 2s-AGCN Features | ADGCN Features | ||||
| FCN | Ours | MIB-STGCN | Ours | 2s-AGCN | Ours | ADGCN | Ours | |
| MMGS | 70.1 | 81.4 | 76.7 | 85.6 | 83.2 | 84.8 | 71.8 | 79.1 |
| Walking Gait | 64.1 | 61.8 | 50.0 | 62.1 | 55.3 | 55.5 | *NC | 67.2 |
| Pathological Gait | 85.5 | 93.3 | 88.1 | 96.0 | 95.6 | 95.9 | 93.9 | 94.5 |
| PD-Walk | 77.2 | 80.3 | 80.1 | 84.2 | 83.1 | 83.9 | 79.1 | 81.6 |
7 Discussion
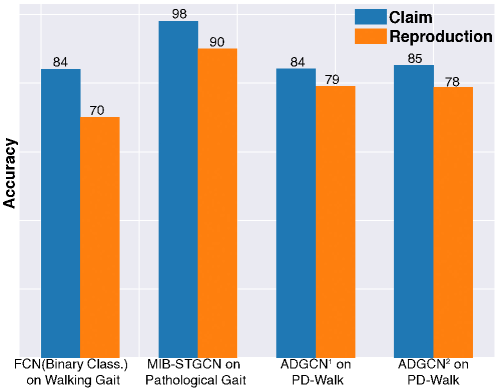
Previous studies (Sadeghzadehyazdi et al., 2021; Kim et al., 2022; Tian et al., 2022) have incorporated features such as joint coordinates, motion signals at different scales, and joint adjacency to guide the classification process. However, none have articulated results that combine all such features, especially with local and global graph structures. Although He et al. (2022), use local and global graphs, as described earlier in Section 3.3, a direct combination like ours performs better than their paired inputs. In addition, after experimenting with various ensembling methods, our tests reveal that, in such high-dimensional settings, a straightforward combination works best. This finding motivates the final ensembling technique chosen by us. Thus, our AMS-GCN model, even though superficially a simple ensemble, distinguishes itself from previous works. After conducting comparisons across four datasets with multiple runs and splits, our results suggest that the proposed AMS-GCN model establishes itself as a robust baseline for future endeavors and a viable alternative to previous research efforts. In summary, the contributions of this paper are threefold. First, we benchmark the performance of algorithms developed for gait classification on four different datasets, testing their generalized ability to identify various pathological gait conditions. A critical reporting mistake seen in this literature is not using separate validation and test sets, thus leaving open the possibility of over-fitting to the test set during training (Dwork et al., 2015). Another fallacy is the common practice of tuning model hyperparameters directly on the test set (Recht et al., 2019). We report results using a test-validation split, and find distribution shifts of between 10-15% (Figure 3) across datasets for most models, in line with recent generalization results in related settings (Recht et al., 2019).
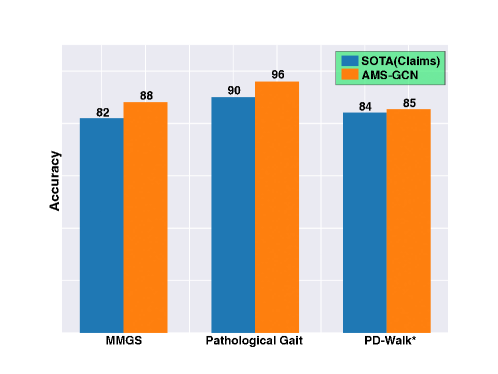
Second, we present a robust model tested on multiple datasets that demonstrates good generalizable performance to support clinicians for early diagnosis in home settings, outperforming state-of-the-art models by between 5-10% across datasets in most cases (Figure 5).
Finally, through various tests employing different feature combinations, we capture insights into the efficacy of different feature combinations for gait assessment. This foundation paves the way for future research, particularly in developing clinical studies aimed at further investigating these crucial gait features, thereby bolstering efforts in automatic gait classification.
Our replication study revealed a significant amount of distribution shift for existing studies. We also showed that in complex optimization scenarios, models are susceptible to showing promising results on one part of the dataset while doing poorly on other parts, supporting the reporting of disaggregated error analyses in this area of machine learning (Burnell et al., 2023). Previously, Zhang et al. (2021) have shown that large neural networks have enough capacity to perfectly shatter the training set, fitting a random labeling of the training data and also true images with noise. Along the same lines, we found that STGCN-based models are prone to overfitting on typically sized datasets in this area. To actually realize the potential of a proposed algorithm, experiments must be conducted over multiple data splits, requiring algorithms to consistently perform well across all splits.
We also strongly recommend using early stopping in training as a safeguard against fitting noise in the data, especially when working with pose estimation methods where limbs can be easily deformed across video frames. Ensuring reliability is crucial for the practical application of healthcare technologies. Therefore, given the intricate nature of gait data, adopting a streamlined AMS-GCN ensemble approach that treats all models uniformly proves to be advantageous.
Limitations
While we report heterogeneities in model performance across data splits in several of our experiments, we ourselves report only aggregate measures of performance for ease of comparison with the existing literature. Future work should focus on reporting disaggregated evaluations on ’hard’ data (Burnell et al., 2023).
Many other variants of STGCN models in the action recognition field could work even better for pathological gait classification, which needs further exploration. Our proposed method achieves good performance because a mixture of experts shades individual models’ inadequacies, making up for occasional poor convergence.
In this study, we did not evaluate the efficacy of using different sets of joints for classification, which needs further exploration and can be examined in an extension of the current work.
References
- Ajay et al. (2018) Jerry Ajay, Chen Song, Aosen Wang, Jeanne Langan, Zhinan Li, and Wenyao Xu. A pervasive and sensor-free deep learning system for parkinsonian gait analysis. In 2018 IEEE EMBS International Conference on Biomedical & Health Informatics (BHI), pages 108–111. IEEE, 2018.
- Albuquerque et al. (2021) Pedro Albuquerque, João Pedro Machado, Tanmay Tulsidas Verlekar, Paulo Lobato Correia, and Luís Ducla Soares. Remote gait type classification system using markerless 2d video. Diagnostics, 11(10):1824, 2021.
- Battaglia et al. (2016) Peter Battaglia, Razvan Pascanu, Matthew Lai, Danilo Jimenez Rezende, et al. Interaction networks for learning about objects, relations and physics. Advances in neural information processing systems, 29, 2016.
- Burnell et al. (2023) Ryan Burnell, Wout Schellaert, John Burden, Tomer D Ullman, Fernando Martinez-Plumed, Joshua B Tenenbaum, Danaja Rutar, Lucy G Cheke, Jascha Sohl-Dickstein, Melanie Mitchell, et al. Rethink reporting of evaluation results in ai. Science, 380(6641):136–138, 2023.
- Chaaraoui et al. (2015) Alexandros Andre Chaaraoui, José Ramón Padilla-López, and Francisco Flórez-Revuelta. Abnormal gait detection with rgb-d devices using joint motion history features. In 2015 11th IEEE international conference and workshops on automatic face and gesture recognition (FG), volume 7, pages 1–6. IEEE, 2015.
- Cheng et al. (2020) Ke Cheng, Yifan Zhang, Xiangyu He, Weihan Chen, Jian Cheng, and Hanqing Lu. Skeleton-based action recognition with shift graph convolutional network. In Proceedings of the IEEE/CVF conference on computer vision and pattern recognition, pages 183–192, 2020.
- Clark et al. (2019) Ross A Clark, Benjamin F Mentiplay, Emma Hough, and Yong Hao Pua. Three-dimensional cameras and skeleton pose tracking for physical function assessment: A review of uses, validity, current developments and kinect alternatives. Gait & posture, 68:193–200, 2019.
- Coste et al. (2014) Christine Azevedo Coste, Benoît Sijobert, Roger Pissard-Gibollet, Maud Pasquier, Bernard Espiau, and Christian Geny. Detection of freezing of gait in parkinson disease: preliminary results. Sensors, 14(4):6819–6827, 2014.
- Dwork et al. (2015) Cynthia Dwork, Vitaly Feldman, Moritz Hardt, Toni Pitassi, Omer Reingold, and Aaron Roth. Generalization in adaptive data analysis and holdout reuse. Advances in Neural Information Processing Systems, 28, 2015.
- He et al. (2022) Yefei He, Tao Yang, Cheng Yang, and Hong Zhou. Integrated equipment for parkinson’s disease early detection using graph convolution network. Electronics, 11(7):1154, 2022.
- Huang et al. (2019) Yingfan Huang, Huikun Bi, Zhaoxin Li, Tianlu Mao, and Zhaoqi Wang. Stgat: Modeling spatial-temporal interactions for human trajectory prediction. In Proceedings of the IEEE/CVF international conference on computer vision, pages 6272–6281, 2019.
- Jaiswal et al. (2023) Abhishek Jaiswal, Gautam Chauhan, and Nisheeth Srivastava. Using learnable physics for real-time exercise form recommendations. In Proceedings of the 17th ACM Conference on Recommender Systems, pages 688–695, 2023.
- Jun et al. (2020a) Kooksung Jun, Deok-Won Lee, Kyoobin Lee, Sanghyub Lee, and Mun Sang Kim. Feature extraction using an rnn autoencoder for skeleton-based abnormal gait recognition. IEEE Access, 8:19196–19207, 2020a.
- Jun et al. (2020b) Kooksung Jun, Yongwoo Lee, Sanghyub Lee, Deok-Won Lee, and Mun Sang Kim. Pathological gait classification using kinect v2 and gated recurrent neural networks. IEEE Access, 8:139881–139891, 2020b.
- Khokhlova et al. (2019) Margarita Khokhlova, Cyrille Migniot, Alexey Morozov, Olga Sushkova, and Albert Dipanda. Normal and pathological gait classification lstm model. Artificial intelligence in medicine, 94:54–66, 2019.
- Kim et al. (2022) Jungi Kim, Haneol Seo, Muhammad Tahir Naseem, and Chan-Su Lee. Pathological-gait recognition using spatiotemporal graph convolutional networks and attention model. Sensors, 22(13):4863, 2022.
- Kubota et al. (2016) Ken J Kubota, Jason A Chen, and Max A Little. Machine learning for large-scale wearable sensor data in parkinson’s disease: Concepts, promises, pitfalls, and futures. Movement disorders, 31(9):1314–1326, 2016.
- Li et al. (2018) Qiannan Li, Yafang Wang, Andrei Sharf, Ya Cao, Changhe Tu, Baoquan Chen, and Shengyuan Yu. Classification of gait anomalies from kinect. The Visual Computer, 34:229–241, 2018.
- Loureiro and Correia (2020) João Loureiro and Paulo Lobato Correia. Using a skeleton gait energy image for pathological gait classification. In 2020 15th IEEE International Conference on Automatic Face and Gesture Recognition (FG 2020), pages 503–507. IEEE, 2020.
- Mahlknecht et al. (2013) Philipp Mahlknecht, Stefan Kiechl, Bastiaan R Bloem, Johann Willeit, Christoph Scherfler, Arno Gasperi, Gregorio Rungger, Werner Poewe, and Klaus Seppi. Prevalence and burden of gait disorders in elderly men and women aged 60–97 years: a population-based study. PloS one, 8(7):e69627, 2013.
- Meng et al. (2016) Meng Meng, Hassen Drira, Mohamed Daoudi, and Jacques Boonaert. Detection of abnormal gait from skeleton data. In VISIGRAPP, 2016.
- Mielke et al. (2013) Michelle M Mielke, Rosebud O Roberts, Rodolfo Savica, Ruth Cha, Dina I Drubach, Teresa Christianson, Vernon S Pankratz, Yonas E Geda, Mary M Machulda, Robert J Ivnik, et al. Assessing the temporal relationship between cognition and gait: slow gait predicts cognitive decline in the mayo clinic study of aging. Journals of Gerontology Series A: Biomedical Sciences and Medical Sciences, 68(8):929–937, 2013.
- Mohamed et al. (2020) Abduallah Mohamed, Kun Qian, Mohamed Elhoseiny, and Christian Claudel. Social-stgcnn: A social spatio-temporal graph convolutional neural network for human trajectory prediction. In Proceedings of the IEEE/CVF conference on computer vision and pattern recognition, pages 14424–14432, 2020.
- Nguyen et al. (2016) Trong-Nguyen Nguyen, Huu-Hung Huynh, and Jean Meunier. Skeleton-based abnormal gait detection. Sensors, 16(11):1792, 2016.
- Nguyen et al. (2018) Trong-Nguyen Nguyen, Huu-Hung Huynh, and Jean Meunier. 3d reconstruction with time-of-flight depth camera and multiple mirrors. IEEE Access, 6:38106–38114, 2018.
- Nieto-Hidalgo et al. (2016) Mario Nieto-Hidalgo, Francisco Javier Ferrández-Pastor, Rafael J Valdivieso-Sarabia, Jerónimo Mora-Pascual, and Juan Manuel García-Chamizo. A vision based proposal for classification of normal and abnormal gait using rgb camera. Journal of biomedical informatics, 63:82–89, 2016.
- Ortells et al. (2018) Javier Ortells, María Trinidad Herrero-Ezquerro, and Ramón A Mollineda. Vision-based gait impairment analysis for aided diagnosis. Medical & biological engineering & computing, 56:1553–1564, 2018.
- Pachón-Suescún et al. (2020) César G Pachón-Suescún, Javier O Pinzón-Arenas, and Robinson Jiménez-Moreno. Abnormal gait detection by means of lstm. International Journal of Electrical & Computer Engineering (2088-8708), 10(2), 2020.
- Pistacchi et al. (2017) Michele Pistacchi, Manuela Gioulis, Flavio Sanson, Ennio De Giovannini, Giuseppe Filippi, Francesca Rossetto, and Sandro Zambito Marsala. Gait analysis and clinical correlations in early parkinson’s disease. Functional neurology, 32(1):28, 2017.
- Recht et al. (2019) Benjamin Recht, Rebecca Roelofs, Ludwig Schmidt, and Vaishaal Shankar. Do imagenet classifiers generalize to imagenet? In International conference on machine learning, pages 5389–5400. PMLR, 2019.
- Rubenstein et al. (2004) Laurence Z Rubenstein, David H Solomon, Carol P Roth, Roy T Young, Paul G Shekelle, John T Chang, Catherine H MacLean, Caren J Kamberg, Debra Saliba, and Neil S Wenger. Detection and management of falls and instability in vulnerable elders by community physicians. Journal of the American Geriatrics Society, 52(9):1527–1531, 2004.
- Sadeghzadehyazdi et al. (2021) Nasrin Sadeghzadehyazdi, Tamal Batabyal, and Scott T Acton. Modeling spatiotemporal patterns of gait anomaly with a cnn-lstm deep neural network. Expert Systems with Applications, 185:115582, 2021.
- Sagi and Rokach (2018) Omer Sagi and Lior Rokach. Ensemble learning: A survey. Wiley Interdisciplinary Reviews: Data Mining and Knowledge Discovery, 8(4):e1249, 2018.
- Sanchez-Gonzalez et al. (2020) Alvaro Sanchez-Gonzalez, Jonathan Godwin, Tobias Pfaff, Rex Ying, Jure Leskovec, and Peter Battaglia. Learning to simulate complex physics with graph networks. In International conference on machine learning, pages 8459–8468. PMLR, 2020.
- Schlachetzki et al. (2017) Johannes CM Schlachetzki, Jens Barth, Franz Marxreiter, Julia Gossler, Zacharias Kohl, Samuel Reinfelder, Heiko Gassner, Kamiar Aminian, Bjoern M Eskofier, Jürgen Winkler, et al. Wearable sensors objectively measure gait parameters in parkinson’s disease. PloS one, 12(10):e0183989, 2017.
- Shi et al. (2019) Lei Shi, Yifan Zhang, Jian Cheng, and Hanqing Lu. Two-stream adaptive graph convolutional networks for skeleton-based action recognition. In Proceedings of the IEEE/CVF conference on computer vision and pattern recognition, pages 12026–12035, 2019.
- Song et al. (2020) Yi-Fan Song, Zhang Zhang, Caifeng Shan, and Liang Wang. Stronger, faster and more explainable: A graph convolutional baseline for skeleton-based action recognition. In proceedings of the 28th ACM international conference on multimedia, pages 1625–1633, 2020.
- Stone and Skubic (2011) Erik Stone and Marjorie Skubic. Evaluation of an inexpensive depth camera for in-home gait assessment. Journal of Ambient Intelligence and Smart Environments, 3(4):349–361, 2011.
- Tian et al. (2022) Haoyu Tian, Xin Ma, Hanbo Wu, and Yibin Li. Skeleton-based abnormal gait recognition with spatio-temporal attention enhanced gait-structural graph convolutional networks. Neurocomputing, 473:116–126, 2022.
- Um et al. (2017) Terry T Um, Franz MJ Pfister, Daniel Pichler, Satoshi Endo, Muriel Lang, Sandra Hirche, Urban Fietzek, and Dana Kulić. Data augmentation of wearable sensor data for parkinson’s disease monitoring using convolutional neural networks. In Proceedings of the 19th ACM international conference on multimodal interaction, pages 216–220, 2017.
- Wang et al. (2010) Jin Wang, Mary She, Saeid Nahavandi, and Abbas Kouzani. A review of vision-based gait recognition methods for human identification. In 2010 international conference on digital image computing: techniques and applications, pages 320–327. IEEE, 2010.
- Xu et al. (2021) Linghui Xu, Jiansong Chen, Fei Wang, Yuting Chen, Wei Yang, and Canjun Yang. Machine-learning-based children’s pathological gait classification with low-cost gait-recognition system. Biomedical engineering online, 20(1):62, 2021.
- Xu and Takano (2021) Tianhan Xu and Wataru Takano. Graph stacked hourglass networks for 3d human pose estimation. In Proceedings of the IEEE/CVF conference on computer vision and pattern recognition, pages 16105–16114, 2021.
- Yan et al. (2018) Sijie Yan, Yuanjun Xiong, and Dahua Lin. Spatial temporal graph convolutional networks for skeleton-based action recognition. In Proceedings of the AAAI conference on artificial intelligence, volume 32, 2018.
- Zhang et al. (2021) Chiyuan Zhang, Samy Bengio, Moritz Hardt, Benjamin Recht, and Oriol Vinyals. Understanding deep learning (still) requires rethinking generalization. Communications of the ACM, 64(3):107–115, 2021.
Appendix A Datasets - Feature Selection and Preprocessing
We follow standard and identical preprocessing pipelines for all Kinect-based datasets. Each Kinect dataset captures the x, y, and z coordinate time series for 25 joints. First, we identify V relevant joints for differentiating pathological gaits and subtract the per-frame ”SpineMid” joint (Figure 2) coordinates from each joint across all frames. While Tian et al. (2022) advocate using selected lower body joints, we maintain a more general setting to facilitate meaningful comparisons.
Then, we split these normal and simulated walks into multiple data clips of length T, augmenting them by overlapping 40 frames between successive clips. The Pathological Gait dataset, being sufficiently large, is exempt from such augmentation.
Finally, for each frame, we range normalize each x, y, and z input by applying the following formula on each coordinate of the selected V joints.
| (1) |
where k V and and are the min and max value of k for each data clip i.e., across T frames. This gives us normalized model input for T frames and V joints. We use T = 48 and V = 19 for all Kinect-based experiments. Consequently, we use 19 of the 25 Kinect body tracking joints removing the fingers, ”SpineMid”, and Head joints.
PD-Walk involves different sets of joints than Kinect. Here, we exclude head information and use the remaining 12 joints (=V) for further analysis (refer to Table 9 for a description of the train, validation, and test splits used in investigating the existing models).
Appendix B AMS-GCN Model Architecture and Preprocessing
We use the following procedure to normalize the 3D Joints coordinates for the V selected joints (V=19 for Kinect-based datasets and 12 for PD-Walk).
| (2) |
| (3) |
| (4) |
| (5) |
where , , and are coordinates, velocity, and acceleration at time t for each joint. is the bone vector defined as the difference in coordinate values of adjacent joints according to the graph connections. is the bone angle corresponding to each bone vector. We also add a residual connection in our STGCN blocks such that the input of each block is added to its output before applying the activation function and transmitting information to the next block.
Appendix C Hyperparameters and Data splits
We train all the models (except FCN) using Adam optimizer and early stopping on validation loss with batch size 32. The base learning rate was 0.1, with a weight decay rate of 0.001. We train the models for 200 epochs and update the learning rate after every 80 epochs as one-tenth of the previous value. FCN (Sadeghzadehyazdi et al., 2021) uses L1 regularization with regularization constant 1e-5 and is trained for 400 epochs with early stopping.
We use the following settings for training all the experts of AMS-GCN : Epochs = 200, Optimizer = Adam, Batch size = 32, weight decay = 1e-3, base learning rate = 0.1, Learning rate decay = 0.1 * learning rate at epochs 80, 160, and 180. Early stopping on validation loss.
Table 8 shows the per-class frequency for all the datasets and Table 9 shows data splits for all the datasets used in our experiments.
.
Dataset
Class 1
Class 2
Class 3
Class 4
Class 5
Class 6
MMGS(3)*
1221
1220
1406
-
-
-
Walking Gait(9)*
1504 for each of the 9 classes
Pathological Gait(6)*
1199
1186
1197
1196
1196
939
PD-Walk(2)*
4482
5390
-
-
-
-
| Splits | Train | Val | Test |
| MMGS(22 subjects) | |||
| Split 1 | [2,3,7,8,9,11,13,14,15,19,21] | [1,6,10,17,18] | [4,5,12,16,20,22] |
| Split 2 | [2,5,8,10,11,13,14,15,16,19,20] | [1,4,17, 18,21] | [3,6,7,9,12,22] |
| Split 3 | [2,3,8,10,12,13,16,17] | [5,6, 9,11,21] | [1,4,7,14,15,18,19,20,22,] |
| Walking Gait | |||
| Split 1 | [1,3,5,6,9] | [4,8] | [2,7] |
| Split 2 | [1,3,5,6,9] | [2,7] | [4,8] |
| Split 3 | [1,3,5,6,9] | [2,4] | [7,8] |
| Pathological Gait | |||
| Split 1 | [1,2,4,7,8,10] | [3,6] | [5,9] |
| Split 2 | [1,2,6,7,9,10] | [3,5] | [4,8] |
| Split 3 | [1,3,5,7,9,10] | [4,8] | [2,6] |
| PD-Walk | |||
| Split 1 | Split 1 of dataset paper | 40% of test data | 60% of test data |
| Split 2 | Split 3 of dataset paper | 40% of test data | 60% of test data |
| FCN | MIB-STGCN | 2sAGCN | ADGCN |
| LR=0.1, Ep=400, LR=0.1*LR every 100 ep, L1 const.=1e-5 | LR=0.1, Ep=200, Wt.Decay=0.001, LR=0.1*LR every 80 epochs | LR=0.1, Ep=200, Wt. Decay=0.001, LR=0.1*LR every 80 epochs. | LR=0.1, Ep=200, Wt. Decay=.001, LR=0.1*LR every 80 epochs. |
| Model | Feature Set |
| FCN | Joint |
| MIB-STGCN | Joint + Velocity + Bone Vector + Bone Angles |
| 2s-AGCN | Joint + Bone Vector |
| ADGCN | Joint + Velocity + Acceleration |
| AMS-GCN | Joint + Velocity + Acceleration + Bone Vector + Bone Angles |
Appendix D Threshold Agnostic Metrics Comparisons
To further test AMSGCN, we also compare AUROC/AUPRC scores for all the models (Table 12 and 13). These results further highlight the performance benefit of using AMSGCN. We also see that AMSGCN has better AUPRC values than other models on the Walking Gait dataset which is the most difficult dataset to classify among all tested.
| Model | MMGS | Walking Gait | Pathological Gait | PD-Walk |
| FCN | 0.92±0.04 | 0.93±0.01 | 0.98±0.02 | 0.79±0.06 |
| MIB-STGCN | 0.90±0.03 | 0.92±0.02 | 0.99±0.01 | 0.91±0.02 |
| 2sAGCN | 0.94±0.02 | 0.94±0.01 | 0.99±0.01 | 0.91±0.06 |
| ADGCN | 0.87±0.06 | 0.82±0.01 | 0.99±0.01 | 0.90±0.03 |
| AMSGCN | 0.96±0.03 | 0.97±0.01 | 0.99±0.01 | 0.94±0.01 |
| Model | MMGS | Walking Gait | Pathological Gait | PD-Walk |
| FCN | 0.86±0.06 | 0.59±0.01 | 0.95±0.04 | 0.84±0.01 |
| MIB-STGCN | 0.82±0.04 | 0.66±0.06 | 0.95±0.02 | 0.95±0.01 |
| 2sAGCN | 0.90±0.03 | 0.70±0.04 | 0.99±0.01 | 0.92±0.6 |
| ADGCN | 0.78±0.09 | 0.46±0.04 | 0.98±0.01 | 0.93±0.03 |
| AMSGCN | 0.93±0.03 | 0.77±0.03 | 0.99±0.01 | 0.96±0.01 |