Evidence of a Forming Nucleus in the Fourcade-Figueroa Galaxy
Abstract
We analyze data from the IRAS, WISE, and Planck satellites, revealing an unresolved dust condensation at the center of the Fourcade-Figueroa galaxy (ESO270-G017), which may correspond to a forming nucleus. We model the condensation’s continuum spectrum in the spectral range from 3 to 1300 using the DUSTY code. The best-fit model, based on the Chi-square test, indicates that the condensation is a shell with an outer temperature of K and an inner boundary temperature of K. The shell’s outer radius is pc, and the inner cavity radius is pc. The condensation produces an extinction mag and its luminosity is W, which would correspond to a burst of massive star formation approximately similar to the central 5 pc of R 136 in the LMC and NGC 3603, the ionizing cluster of a giant Carina arm HII region. The comparison with Normal, Luminous, and Ultra-Luminous Infrared Galaxies leads us to consider this obscured nucleus as the nearest and weakest object of this category.
1 Introduction
The discovery of the Fourcade-Figueroa object (ESO 270-G017, hereinafter FF) was first reported by Fourcade (1971), who provided its coordinates and described it as a long and wide object without signs of a core. Its extragalactic origin was determined by Dottori & Fourcade (1973), who measured a corrected radial velocity of 830 km s-1 and suggested it might be an irregular galaxy, referred to as a “shred” according to Arp (1967).
Graham (1978), using the CTIO 4 m telescope, determined a rotational velocity of 10 km s in the central part of FF, classified it as a late-type spiral galaxy, and estimated its distance to be twice that of the Centaurus Group. He argued that since stars were detected in the 4 m telescope photographs, FF could not be much further away than the Cen A host galaxy (NGC 5128). In contrast, de Vaucouleurs (1979) classified FF as SB(s)m and identified it as a background galaxy.
Thomson (1992) simulated a strong prograde encounter between a Milky Way-like progenitor and NGC 5128 with a mass ratio of 1:10. The collision resulted in FF (the shred), the dwarf elliptical NGC 5237 (the bulge of the primitive spiral galaxy), and the dust lane around NGC 5128, which contains about half of the primitive spiral disk and rotates as observed. The model also explained the relative positions and velocities of NGC 5128, FF, and NGC 5237, and the hot gas emission from NGC 5237. However, a modern distance measurement of FF at 6.95 Mpc by Karachentsev et al. (2015) challenges Thomson’s model. Still, the origin of FF remains unknown, due to the difference of 300 km s-1 between the FF observed radial velocity and the Hubble flow at 6.95 Mpc.
Saponara et al. (2021) conclude from radio observations that FF has a dark matter halo with a compact core and that the HI disk is considerably larger than the optical one, supporting the disruptive character of this super-thin galaxy, as previously suggested by Fourcade (1971).
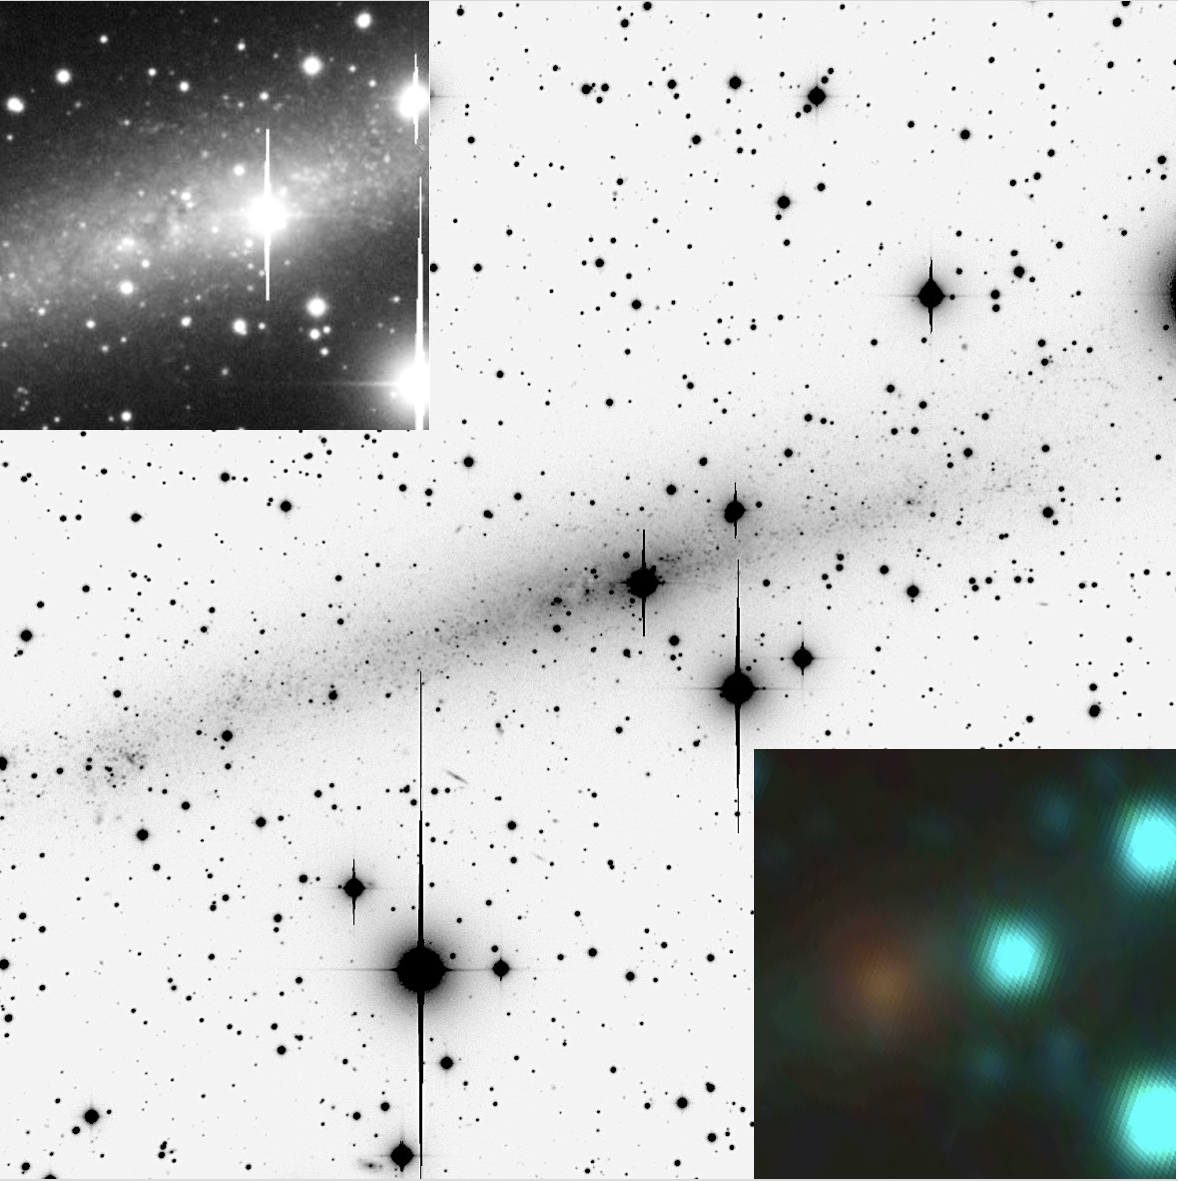
Fourcade (1971) claimed that FF does not show a nucleus, and a central concentration is not evident in the optical (DSS) or near-infrared (2MASS) imaging sky surveys. However, we found that WISE satellite images (Fig. 1) reveal an object strongly emitting in the mid-infrared located near the galaxy’s isophotal center (de Vaucouleurs, 1979). In Section 2, we discuss FF’s mid (MIR) and far (FIR) IR archival data. In Section 3, we discuss the parameter space explored with the DUSTY code and the model that best fits FF’s IR observations, and in Section 5, we discuss FF’s IR core properties in comparison to well-known Dust Obscured Galaxies (DOGs) and young star-formation regions.
2 Data Sources
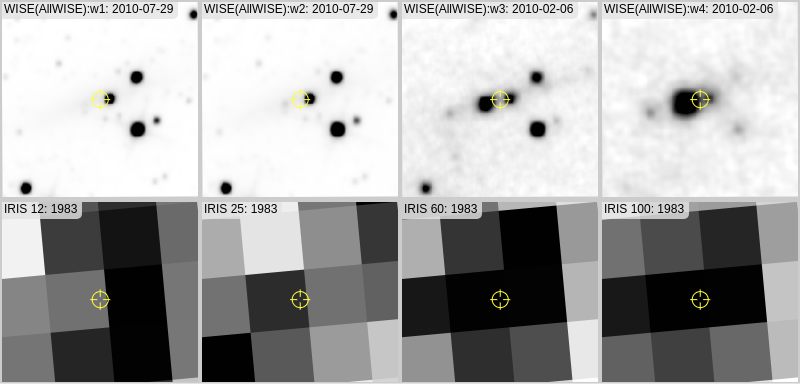
WISE images (Fig. 2) show a non-stellar, point-like IR source, which we call FFIR, located approximately to the E-SE of FF’s isophotal center. The position and brightness of this source are shown in Table 1. The first run of WISE observations began on 14 Jan 2010 (Wright et al., 2010); FF was observed on 29 Jul 2010 with detectors cooled to 10 K. A second run was conducted only at the two shortest wavelengths, and , after the telescope was reactivated on 19 Dec 2013, with the detectors at a temperature of approximately 75 K (Kourkchi et al., 2020). The brightness difference between , and , is most probably due to the high level of noise in the second round of observations. However, we cannot rule out that there has been an alteration in the brightness of the source between the two observation periods, which could have excited the numerous lines and/or spectral bands in this IR spectral region. In fact, variability in these two filters has recently been reported by Arévalo et al. (2024) for the newly born active nucleus ZTF20aaglfpy. In this study, we only take into account the first epoch observations, as they, together with IRAS and Planck observations, better follow the spectral energy distribution (hereafter SED) that should be expected for cold dust radiation.
IRAS archive images (Li et al., 2011) show continuous emission in the four bands (Fig. 2), whose centroid is displaced to the E-SE of the WISE source (Table 1). As the IRAS spatial resolution ranges from at 12 µm to at 100 µm, we can safely assume that both telescopes are detecting the same source. By comparing and with and , respectively (Table 1), we see that the band is likely strongly affected by nearby projected stars from the Milky Way. In contrast, these stars practically do not affect the band. Since stars radiate approximately as black bodies, we assume that and are only measuring FFIR radiation.
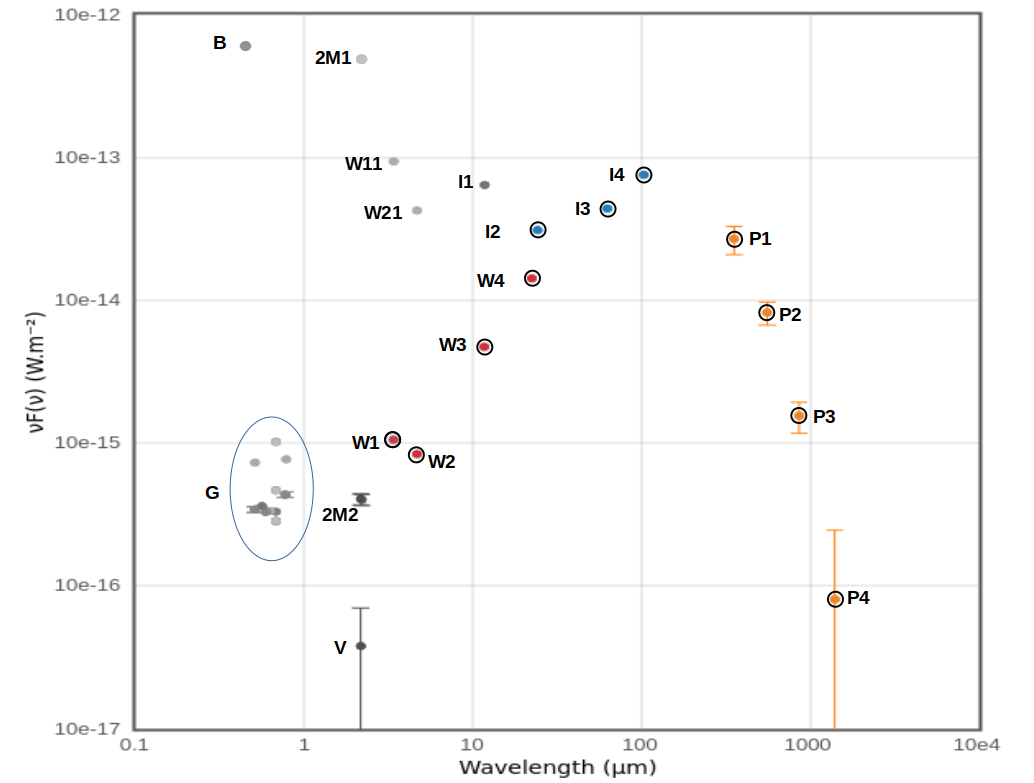
Within a area centered at the WISE coordinates of FFIR, we also find a Planck FIR point-like source (Planck Collaboration et al., 2016) whose position is to the W-NW of the WISE FFIR. Due to the positional uncertainty of Planck and WISE, we also assume that both correspond to the same source. This assumption is justified by the SED shown by the sequence , , , , , , , , , , and (see Fig. 3), which we analyze in Section 3.
Johnson (Neuzil et al., 2020) and 2MASS (Karachentsev et al., 2013) are the total brightness of the FF galaxy at these bands. 2MASS is a star located to the NE of FFIR, as well as VISTAS located to the S-SW, which was also observed by GAIA in the optical region. The sources cataloged by Gaia are the points surrounded by the ellipse in Fig. 3 (Tonry et al., 2018).
| Band | AR | DEC | Wavelength | Flux | Flux | Position |
|---|---|---|---|---|---|---|
| HH:MM:SS | dd:mm:ss | µm | W m-2 | W m-2 | Fig. 2 a | |
| Johnson — B | 13:34:49.472 | -45:32:58.54 | 4.44e-1 | 6.06e-13 | B | |
| 2MASS — Ks | 13:34:49.472 | -45:32:58.54 | 2.16e+0 | 4.90e-13 | 2M1 | |
| 2MASS — Ks | 13:34:49.654 | -45:32:48.14 | 2.16e+0 | 4.05e-16 | 3.60e-17 | 2M2 |
| Vista — Ks | 13:34:49.400 | -45:32:53.65 | 2.13e+0 | 3.84e-17 | 3.25e-17 | V |
| WISE — W1 | 13:34:49.472 | -45:32:58.54 | 3.35e+0 | 1.06e-15 | 2.68e-17 | W1 |
| WISE — W1 | 13:34:49.472 | -45:32:58.54 | 3.35e+0 | 9.49e-14 | W12 | |
| WISE — W2 | 13:34:49.472 | -45:32:58.54 | 4.60e+0 | 8.47e-16 | 1.96e-17 | W2 |
| WISE — W2 | 13:34:49.472 | -45:32:58.54 | 4.60e+0 | 4.31e-14 | W21 | |
| WISE — W3 | 13:34:49.472 | -45:32:58.54 | 1.16e+1 | 4.77e-15 | 7.78e-17 | W3 |
| WISE — W4 | 13:34:49.472 | -45:32:58.54 | 2.21e+1 | 1.44e-14 | 4.07e-16 | W4 |
| IRAS — 12 | 13:34:49.688 | -45:32:5.84 | 1.16e+1 | 6.47e-14 | I1 | |
| IRAS — 25 | 13:34:49.688 | -45:32:59.54 | 2.39e+1 | 3.14e-14 | I2 | |
| IRAS — 60 | 13:34:49.688 | -45:32:59.54 | 6.18e+1 | 4.44e-14 | I3 | |
| IRAS — 100 | 13:34:49.688 | -45:32:59.54 | 1.02e+2 | 7.62e-14 | I4 | |
| Plank — 857GHz | 13:34:49.300 | -45:32:57.69 | 3.50e+2 | 2.72e-14 | 6.08e-15 | P1 |
| Plank — 545GHz | 13:34:49.300 | -45:32:57.69 | 5.50e+2 | 8.28e-15 | 1.53e-15 | P2 |
| Plank — 353GHz | 13:34:49.300 | -45:32:57.69 | 8.49e+2 | 1.57e-15 | 3.85e-16 | P3 |
| Plank — 217GHz | 13:34:49.300 | -45:32:57.69 | 1.38e+3 | 8.16e-17 | 1.67e-16 | P4 |
a The last column indicates the source identifications in Fig. 3. : FF total brightness (Neuzil et al., 2020). : FF total brightness (Karachentsev et al., 2013). : field star. , , , and : observed on 29-07-2010 (Asmus et al., 2020), http://cdsportal.u-strasbg.fr/?target=ESO270-G017. and : observed after the reactivation on 19-12-2014, https://astro.ucla.edu/~wright/WISE/. I1-I4 IRAS: https://irsa.ipac.caltech.edu/Missions/iras.html. P1-P4: (Planck Collaboration et al., 2016).
2.1 Could FFIR be a Background Object?
In order to check if FFIR might be a background source projected into the central region of the FF galaxy and seen through its inclined disk, we examined all WISE sources within a radius cone around FFIR (WISE source J133449.44-453257.5). There are 67,475 sources in that area of the sky. For FFIR to be a background source projected onto the galaxy center, the putative source would need to be both brighter and bluer than FFIR appears, as its light would have to pass through the dust of the FF disk, whose inclination is 86°. We found only seven WISE point-like sources that fulfilled these criteria in the considered area. According to Karachentsev et al. (2013), the isophotal center of FF is determined with an uncertainty of in each coordinate, and the WISE spatial resolution at the W4 band is . These two values led us to adopt a radius of as a reliable elementary cell within which an object projected onto it could be misinterpreted as a nucleus. These considerations suggest a probability of approximately 1/2000 that FFIR is a background object projected into the central region of FF. Therefore, in what follows, we treat FFIR as a subsystem of the Fourcade-Figueroa galaxy.
3 Modeling Dust Emission
3.1 Dusty Code
A quick comparison of FFIR radiated energy with Milky Way dusty clouds excited by individual hot stars (Hirsch et al., 2012; Saldaño et al., 2017) suggests the presence of a star formation region with tens or hundreds of massive stars.
To solve the problem of radiation transport in a dusty environment, we use the DUSTY code (Ivezic & Elitzur, 1997). The code can handle both spherical and planar geometries. Due to the lack of angular resolution in FFIR observations, we chose to model a dusty spherical shell with a point-like source at the center.
We experimented with a Black Body (BB) source of as in Hirsch et al. (2012) and a source composed of BBs following a Salpeter (1955) IMF, with a highest temperature of 53,000 K.
DUSTY solves the transfer equation inside the shell by fixing the following parameters:
-
1.
Shell chemical composition: We use the Draine & Lee (1984) proportion of silicates to carbonates (53% to 47%) and the inverted relationship as well.
-
2.
Dust grain sizes: We use the standard MSN Mathis et al. (1977) grain size distribution with and .
-
3.
Cloud optical depth at 22 µm, : We tested 30 values between .
-
4.
Density distribution: This is treated in terms of the dimensionless profile where is the radius of the shell’s inner boundary. We considered two cases: a. Three nested shells with density fall-off softening from to a constant distribution as the radius increases by a factor of 10. b. A single shell with a radius whose density falls as . scales with the luminosity as , allowing the models to fit the observations once the temperature of the shell’s inner boundary is fixed.
-
5.
Shell inner boundary temperature, : This is the only dimensional parameter required to solve the transfer problem. We tested temperatures , which are substantially cooler than the dust sublimation temperature (approximately 1500 K). DUSTY matches the energy released by the central source with by adjusting . Inside , we have a dust-free cavity.
3.2 Siebenmorgen and Krügel 2007 Library.
Symeonidis et al. (2013, S13) used the Siebenmorgen & Krügel (2007, SK07) library of 7208 radiative transfer models, constrained by five parameters (illustrated by the blue line in their Figure 11 plots), to fit their observations of NIRGs, LIRGs, and ULIRGs. Since SK07 does not provide a dust ball temperature, S13 assigned an ad hoc one by fitting a single temperature grey-body around the photometric peak in (indicated by the green dashed line in their Figure 11 plots). This procedure introduces two additional parameters. S13 notes that, although the SK07 grid offers more flexibility than most standalone SED libraries currently available, it is still too coarse for a complete characterization of the physical properties of high-redshift Herschel samples. Therefore, they chose to use a single parameter to describe the overall shape of the SK07 SED templates: the flux defined as . We cannot model FFIR with SK07 library, as these models do not reach luminosities characteristic of FFIR, and as the authors mention, the SEDs depend on the total luminosity of the source. The faintest objects in the Herschel sample, the NIRGs NGC 253 and M82, are 500 and 1000 times more luminous than FFIR and five times larger (0.359 kpc). Nevertheless, we will compare different scale-free parameters between FFIR and DOGs in the next section.
4 Discussion
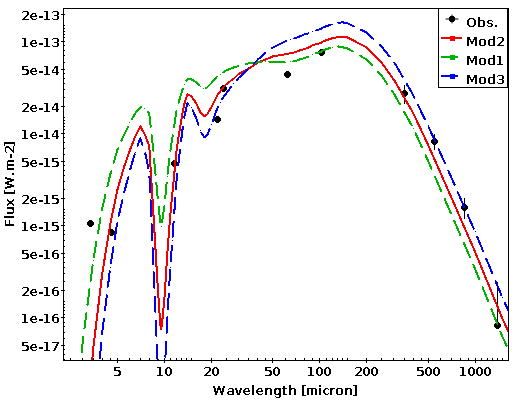
We noted that the source, whether an isolated BB or a sum of BBs, does not influence the solution of the radiative transfer equation inside the dust shell. DUSTY fits the power of the source to the temperature of the dust shell inner boundary (DSIB) by varying the DSIB size and the ratio , where is the size for the central source to be considered point-like. For the two tested sources, the sum of BBs presents and times larger than the BB at . We will discuss this point later.
The best DSIB temperature is . We tested the Draine & Lee (1984) proportion of silicates to carbonates (53% to 47%) and the inverse relationship as well. That change influences only the 9.7 absorption feature, which is deeper for a higher proportion of silicates; however, there are no observations available to differentiate between both metallicities. The models plotted in Fig. 4 use the original Draine & Lee (1984) metallicity.
A density described by a broken power law gives a better result than a shell with a similar size and density falling as mainly because, at the Planck observation wavelengths, power law models are at least one order of magnitude weaker than the observations.
The optical depth at 22 , 2, 3, and 4 furnishes the best models with values of 9.1, 2.0, and 3.5, respectively. The red line in Fig. 4 represents the best model.
Table 2 shows that variations in do not significantly alter the physical parameters of the models. However, the three SEDs in Fig. 4 differ considerably; hence, we conclude that, given a DSBI temperature, the best SEDs are primarily influenced by .
The visual extinction is very large, . It lies between that of the NIRG M82 () and NGC 253 (), as reported by SK07.
The dimensions of the FFIR shell derived from the best parameters are as follows: the DSIB radius is (0.086 pc), and the shell outer boundary radius is . The FFIR luminosity is (, approximately 20 O3 stars), and the shell outer boundary temperature is . We used a distance of 6.95 Mpc (Karachentsev et al., 2015).
| ID | (W m-2) | (m) | |||||
|---|---|---|---|---|---|---|---|
| 1 | 2.00E+00 | 1.92E+02 | 3.99E+13 | 4.28E+04 | 2.98E+01 | 12.5 | 2 |
| 2 | 3.00E+00 | 1.89E+02 | 4.02E+13 | 4.32E+04 | 3.00E+01 | 11.8 | 2 |
| 3 | 4.00E+00 | 1.88E+02 | 4.03E+13 | 4.33E+04 | 3.01E+01 | 11.2 | 1 |
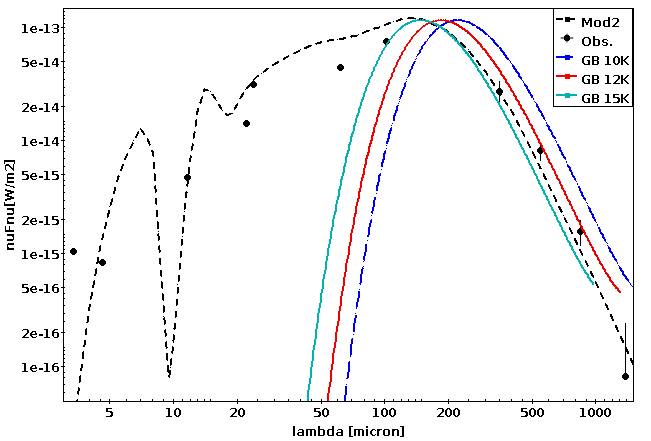
The FFIR flux is not significantly different from that of NIRGs, LIRGs, and ULIRGs, shown in S13, their Figure 12. Following the methodology of S13, we fitted a single-temperature grey-body to the photometric peak in . As shown in Fig. 5, a grey-body (GB) at 15 K best approximates this peak, while the GB at 12 K fits quite well with the Planck bands at 550 µm and 849 µm, which are in the same wavelength interval as the Herschel bands fitted by S13. A comparison of Fig. 5 with S13’s Figure 11 reveals qualitative similarities, with the added benefit that DUSTY also provides the outermost shell surface temperature in a coherent form with other model parameters. We also note that the fit of a GB give a dust ball outermost temperature 20% to 25% higher than that obtained from a specific DUSTY model. The FFIR temperature is lower than all temperatures of DOGs in the Herschel sample, as depicted in S13, Figure 15. The color ratios (L110/L250, L70/L100) = (1.6, 0.7) position FFIR in the colder corner of the corresponding color-color diagram, as illustrated in S13, Figure 14, where only a few Herschel sources are located.
5 Conclusion
MIR and FIR observations with space telescopes show a point-like dust cloud at the center of the FF galaxy (ESO270-G017), which we have dubbed FFIR. We have modeled the IR SED using the DUSTY code. According to our models, the FF galaxy has experienced a burst of massive star formation (FFIR) similar to the central 5 pc of R 136 in the LMC (Brands et al., 2022; Kalari et al., 2022) and to the ionizing cluster of the giant Carina arm HII region NGC 3603, whose luminosities are W and W (Drissen et al., 1995; Brandl et al., 1999; Harayama et al., 2008), respectively. Since the FFIR massive stars are already enshrouded in their original cocoon, they must be much younger than their counterparts in the LMC and the Milky Way, probably not older than a few hundred thousand years. The FFIR might not be a cluster of stars enshrouded in a single cocoon but a sum of individual cocoons; nevertheless, Johnson (2005) pointed out that the Milky Way newborn star clusters’ properties appear similar to those of ultracompact HII regions but scaled up in total mass and luminosity, indicating that the model adopted for FFIR would be a good approximation.
A caveat of our solution is that DUSTY requires the exciting source to be point-like. As Table 2 shows, for that to happen, the source must have a radius approximately forty thousand times smaller than the DSIB, putting the source size on the order of 1.0 AU, which is too small when compared to what is known about star formation in the nearby universe. For example, the Arches cluster near the center of our galaxy (Cotera et al., 1996) presents within 0.4 pc, with a central mass density of , making it the densest known in the Milky Way (Espinoza et al., 2009). Bursts of star formation in the nuclear region of galaxies do not necessarily entail large concentrations of stars, as seen in the prototype star-forming galaxies NGC 7714 (González Delgado et al., 1999) and NGC 604 (Hunter et al., 1996). A possible solution to this dilemma could be microquasars, which are compatible with FFIR from an energetic point of view, as in the cases of S 236 in NGC 7793 (Soria et al., 2010), S 2 in M 83 (Soria et al., 2020), and SS 433 in the Milky Way (Blundell & Bowler, 2004). However, microquasars present a Riley-Fanaroff 2 morphology and mainly deliver mechanical energy, at least in the few known cases and the stage of evolution they are detected today. Another promising solution could be a soft proto-AGN, which we know must exist, as the transformation of a normal nucleus of a galaxy into an active one has been recently reported by Arévalo et al. (2024).
The possible brightness difference between , and , might be an important issue that deserves a more detailed study, as well as the difference of 300 km s-1 between the FF observed velocity and the Hubble flow at 6.95 Mpc.
The comparison with DOGs demonstrates that FFIR’s properties align well within this category, suggesting that FFIR may be characterized as the weakest DOG ever detected.
The issues highlighted suggest that further observations in the MIR, FIR, and radio-interferometry are crucial to illuminate the nature of FFIR, an object in the local universe that seems to be in the early stages of its evolution since formation.
References
- Arévalo et al. (2024) Arévalo, P., López-Navas, E., Martínez-Aldama, M. L., et al. 2024, A&A, 683, L8, doi: 10.1051/0004-6361/202348900
- Arp (1967) Arp, H. 1967, ApJ, 148, 321, doi: 10.1086/149159
- Asmus et al. (2020) Asmus, D., Greenwell, C. L., Gandhi, P., et al. 2020, MNRAS, 494, 1784, doi: 10.1093/mnras/staa766
- Blundell & Bowler (2004) Blundell, K. M., & Bowler, M. G. 2004, ApJ, 616, L159, doi: 10.1086/426542
- Brandl et al. (1999) Brandl, B., Brandner, W., Grebel, E. K., & Zinnecker, H. 1999, The Messenger, 98, 46
- Brands et al. (2022) Brands, S. A., de Koter, A., Bestenlehner, J. M., et al. 2022, A&A, 663, A36, doi: 10.1051/0004-6361/202142742
- Cotera et al. (1996) Cotera, A. S., Erickson, E. F., Colgan, S. W. J., et al. 1996, ApJ, 461, 750, doi: 10.1086/177099
- de Vaucouleurs (1979) de Vaucouleurs, G. 1979, AJ, 84, 1270, doi: 10.1086/112539
- Dottori & Fourcade (1973) Dottori, H. A., & Fourcade, C. R. 1973, A&A, 23, 405
- Draine & Lee (1984) Draine, B. T., & Lee, H. M. 1984, ApJ, 285, 89, doi: 10.1086/162480
- Drissen et al. (1995) Drissen, L., Moffat, A. F. J., Walborn, N. R., & Shara, M. M. 1995, AJ, 110, 2235, doi: 10.1086/117684
- Espinoza et al. (2009) Espinoza, P., Selman, F. J., & Melnick, J. 2009, A&A, 501, 563, doi: 10.1051/0004-6361/20078597
- Fourcade (1971) Fourcade, C. R. 1971, Boletin de la Asociacion Argentina de Astronomia La Plata Argentina, 16, 10
- González Delgado et al. (1999) González Delgado, R. M., García-Vargas, M. L., Goldader, J., Leitherer, C., & Pasquali, A. 1999, ApJ, 513, 707, doi: 10.1086/306893
- Graham (1978) Graham, J. A. 1978, PASP, 90, 237, doi: 10.1086/130317
- Harayama et al. (2008) Harayama, Y., Eisenhauer, F., & Martins, F. 2008, ApJ, 675, 1319, doi: 10.1086/524650
- Hirsch et al. (2012) Hirsch, L., Adams, J. D., Herter, T. L., et al. 2012, ApJ, 757, 113, doi: 10.1088/0004-637X/757/2/113
- Hunter et al. (1996) Hunter, D. A., Baum, W. A., O’Neil, Earl J., J., & Lynds, R. 1996, ApJ, 456, 174, doi: 10.1086/176638
- Ivezic & Elitzur (1997) Ivezic, Z., & Elitzur, M. 1997, MNRAS, 287, 799, doi: 10.1093/mnras/287.4.799
- Johnson (2005) Johnson, K. E. 2005, in Massive Star Birth: A Crossroads of Astrophysics, ed. R. Cesaroni, M. Felli, E. Churchwell, & M. Walmsley, Vol. 227, 413–422, doi: 10.1017/S1743921305004825
- Kalari et al. (2022) Kalari, V. M., Horch, E. P., Salinas, R., et al. 2022, The Astrophysical Journal, 935, 162, doi: 10.3847/1538-4357/ac8424
- Karachentsev et al. (2013) Karachentsev, I. D., Makarov, D. I., & Kaisina, E. I. 2013, AJ, 145, 101, doi: 10.1088/0004-6256/145/4/101
- Karachentsev et al. (2015) Karachentsev, I. D., Tully, R. B., Makarova, L. N., Makarov, D. I., & Rizzi, L. 2015, ApJ, 805, 144, doi: 10.1088/0004-637X/805/2/144
- Kourkchi et al. (2020) Kourkchi, E., Tully, R. B., Anand, G. S., et al. 2020, ApJ, 896, 3, doi: 10.3847/1538-4357/ab901c
- Li et al. (2011) Li, Z.-Y., Ho, L. C., Barth, A. J., & Peng, C. Y. 2011, ApJS, 197, 22, doi: 10.1088/0067-0049/197/2/22
- Mathis et al. (1977) Mathis, J. S., Rumpl, W., & Nordsieck, K. H. 1977, ApJ, 217, 425, doi: 10.1086/155591
- Neuzil et al. (2020) Neuzil, M. K., Mansfield, P., & Kravtsov, A. V. 2020, MNRAS, 494, 2600, doi: 10.1093/mnras/staa898
- Planck Collaboration et al. (2016) Planck Collaboration, Ade, P. A. R., Aghanim, N., et al. 2016, A&A, 594, A26, doi: 10.1051/0004-6361/201526914
- Saldaño et al. (2017) Saldaño, H. P., Vasquez, J., Cappa, C. E., et al. 2017, Rev. Mexicana Astron. Astrofis., 53, 3, doi: 10.48550/arXiv.1609.00982
- Salpeter (1955) Salpeter, E. E. 1955, ApJ, 121, 161, doi: 10.1086/145971
- Saponara et al. (2021) Saponara, J., Kamphuis, P., Koribalski, B. S., & Benaglia, P. 2021, A&A, 652, A108, doi: 10.1051/0004-6361/202140797
- Siebenmorgen & Krügel (2007) Siebenmorgen, R., & Krügel, E. 2007, A&A, 461, 445, doi: 10.1051/0004-6361:20065700
- Soria et al. (2020) Soria, R., Blair, W. P., Long, K. S., Russell, T. D., & Winkler, P. F. 2020, The Astrophysical Journal, 888, 103, doi: 10.3847/1538-4357/ab5b0c
- Soria et al. (2010) Soria, R., Pakull, M., Broderick, J., Corbel, S., & Motch, C. 2010, in American Institute of Physics Conference Series, Vol. 1248, X-ray Astronomy 2009; Present Status, Multi-Wavelength Approach and Future Perspectives, ed. A. Comastri, L. Angelini, & M. Cappi (AIP), 127–130, doi: 10.1063/1.3475162
- Symeonidis et al. (2013) Symeonidis, M., Vaccari, M., Berta, S., et al. 2013, MNRAS, 431, 2317, doi: 10.1093/mnras/stt330
- Taylor (2005) Taylor, M. B. 2005, in Astronomical Society of the Pacific Conference Series, Vol. 347, Astronomical Data Analysis Software and Systems XIV, ed. P. Shopbell, M. Britton, & R. Ebert, 29
- Thomson (1992) Thomson, R. C. 1992, MNRAS, 257, 689, doi: 10.1093/mnras/257.4.689
- Tonry et al. (2018) Tonry, J. L., Denneau, L., Flewelling, H., et al. 2018, ApJ, 867, 105, doi: 10.3847/1538-4357/aae386
- Wright et al. (2010) Wright, E. L., Eisenhardt, P. R. M., Mainzer, A. K., et al. 2010, AJ, 140, 1868, doi: 10.1088/0004-6256/140/6/1868