Trustworthy Hate Speech Detection Through Visual Augmentation
Abstract
The surge of hate speech on social media platforms poses a significant challenge, with hate speech detection (HSD) becoming increasingly critical. Current HSD methods focus on enriching contextual information to enhance detection performance, but they overlook the inherent uncertainty of hate speech. We propose a novel HSD method, named trustworthy hate speech detection method through visual augmentation (TrusV-HSD), which enhances semantic information through integration with diffused visual images and mitigates uncertainty with trustworthy loss. TrusV-HSD learns semantic representations by effectively extracting trustworthy information through multi-modal connections without paired data. Our experiments on public HSD datasets demonstrate the effectiveness of TrusV-HSD, showing remarkable improvements over conventional methods.
Trustworthy Hate Speech Detection Through Visual Augmentation
Ziyuan Yang1,2,3, Ming Yan3,*, Yingyu Chen1,2, Hui Wang1,2, Zexin Lu1,2, Yi Zhang1,* 1College of Computer Science, Sichuan University 2Key Laboratory of Data Protection and Intelligent Management, Ministry of Education, Sichuan University, 3Centre for Frontier AI Research, Agency for Science, Technology and Research 4School of Cyber Science and Engineering, Sichuan University *Corresponding Author: Yan_Ming@cfar.a-star.edu.sg and yzhang@scu.edu.cn
1 Introduction
The widespread use of social media has both facilitated freedom of individual expression and intensified concerns over the rise of hate speech, emphasizing the urgent need for effective automatic hate speech detection (HSD) methods Rawat et al. (2024); Fortuna et al. (2022). Typically, hate speech mostly appears in short text with very limited contextual information, which increases the detection difficulty Li et al. (2021). Previous HSD methods mostly focused on designing advanced feature representations to improve detection performance: kernel-based methods Gambäck and Sikdar (2017); Abro et al. (2020), pre-trained language models Sarkar et al. (2021); Daouadi et al. (2023), graph attention networks Mishra et al. (2019); Miao et al. (2024). All these methods solely extract features from textual speech (see Figure 1(a)), which constrained the capability of detection model under limited textual information.
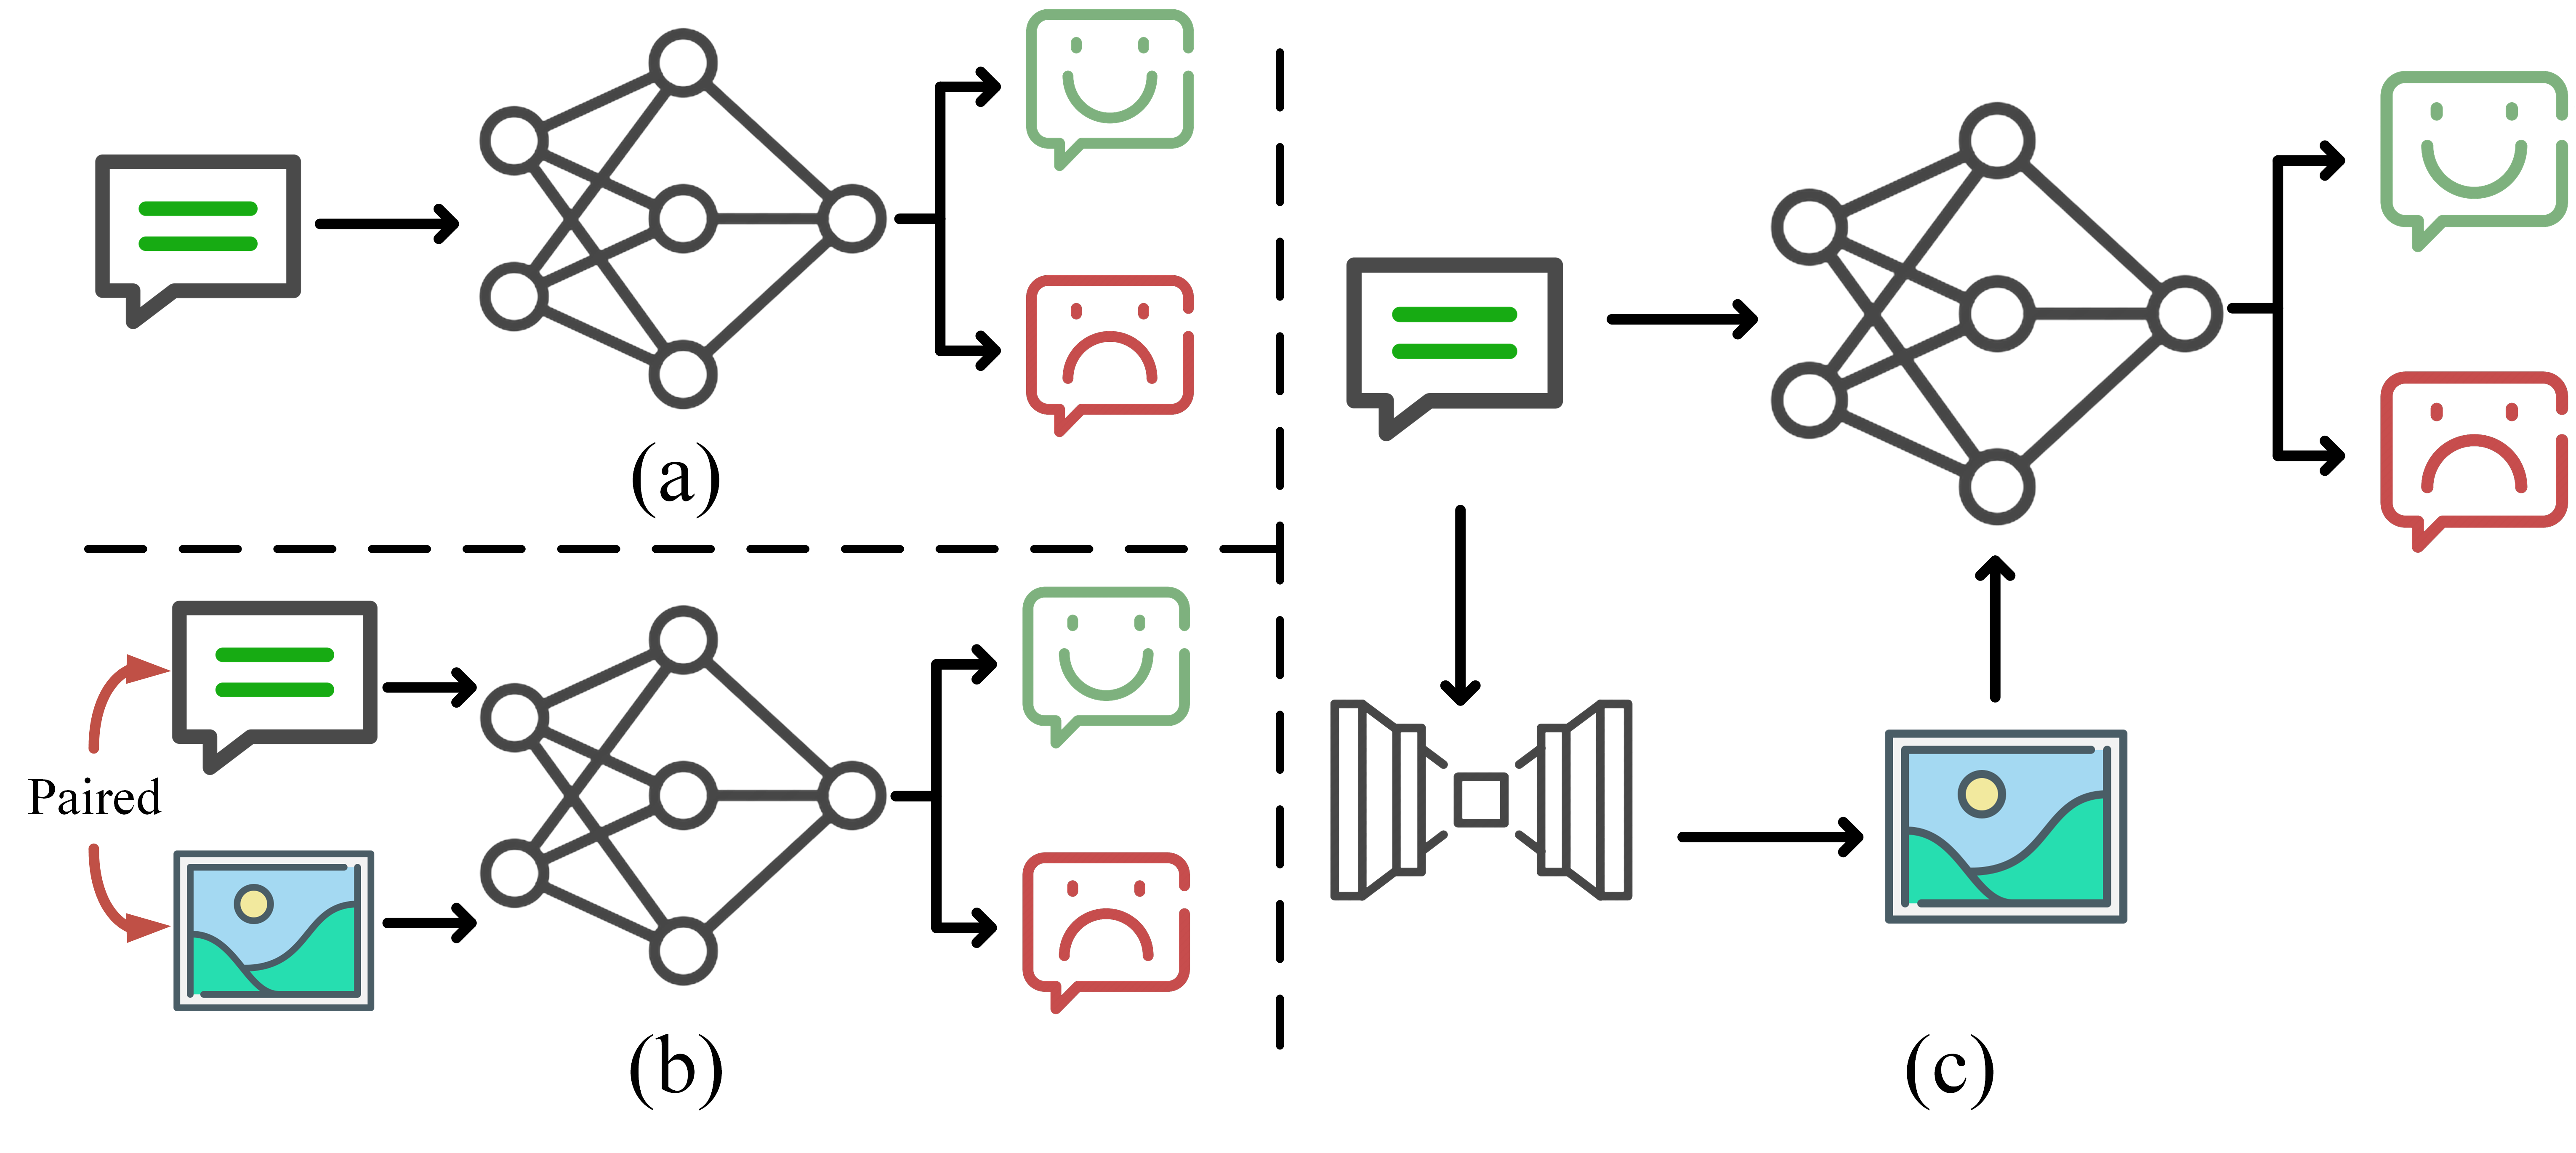
Another stream of HSD methods (see Figure 1(b)) seeks to enrich feature representation from paired textual speech and visual image El-Sayed and Nasr (2024); Maity et al. (2022); Bhandari et al. (2023). The polite work Boishakhi et al. (2021) achieves superior results than sole textual feature-based HSD methods. Similarly, Yang et al. (2022) and Hebert et al. (2024) enrich domain knowledge with pretrained vision-language models, demonstrating the importance of visual imagery in detecting hate speech. This stream methods heavily rely on paired images and text, which significantly hinders their practical implementation. However, both HSD paradigms overlook the intrinsic length characteristic of hate speech, where shorter speeches often contain more explicit hate semantics, and vice versa. Moreover, the subjective or biased factors from speakers further lead to high uncertainty in predictions.
To address abovementioned issues, we propose a novel trustworthy hate speech detection method via visual augmentation, dubbed TrusV-HSD. This method comprises three main modules: visual cues generation module, hate speech detector, and trustworthy loss. Inspired by recent research that visual cues can significantly enhance human abilities to retrieve, remember, and understand information Tan et al. (2024), our visual cues generation module initially generates imagery cues. Consquently, the generated imagery cues enhance TrusV-HSD’s semantic learning through visual augmentation from textual speech, in a multidimensional way without requiring paired data. Then, a novel multi-modal hate speech detector is designed to model long-range interactions within the joint modalities while maintaining linear computational complexity. Lastly, a trustworthy loss is utilized to provide reliable predictions and ensure robust performance, mitigating the impact of the speaker’s subjectivity and bias, as well as ensuring the robust performance of TrusV-HSD across varying speech lengths.
2 Methodology
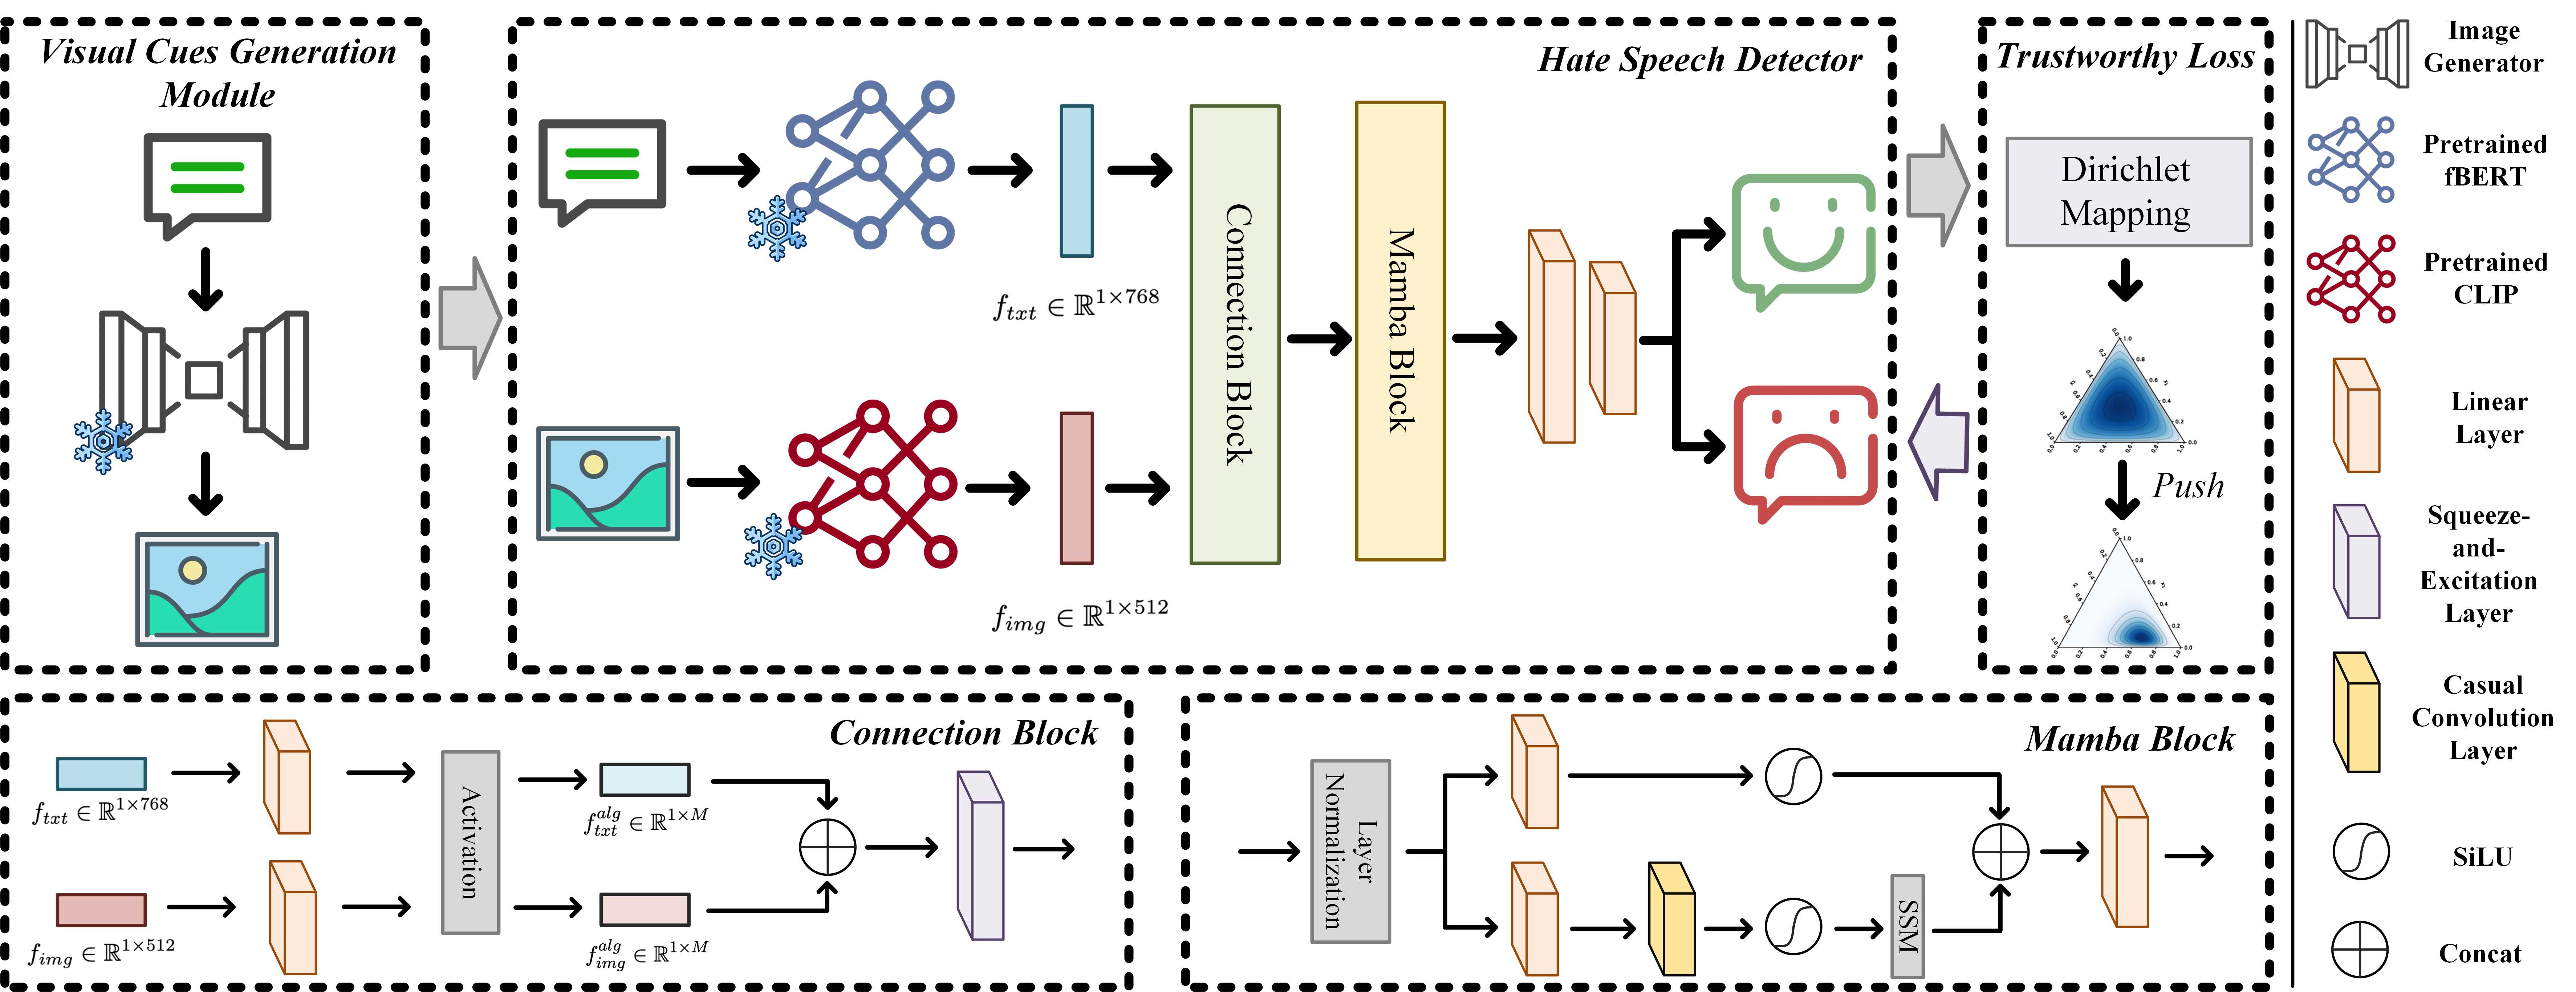
Figure 2 shows the overview of our method, which contains visual cues generation module, hate speech detector and trustworthy loss. TrusV-HSD will be detailed introduced in the following.
Visual Cues Generation Module The traditional HSD paradigm can be formulated as , where is the textual speech and is the prediction. This paradigm only extract features from textual modality, and its effectivenss is limited by the short speech length. To mitigate this issue, we propose a novel HSD paradigm that generates visual cues to complement the textual data. Notably, differ with previous multimodal HSD methods, our method is free from image-text paired data, ensuring higher flexibility and broader applicability. Our paradigm is formulated as , where is the generator that produces imagery from the speech. Concretely, a image generator Rombach et al. (2022) is utilized to achieve the above purpose, which consists of a text encoder, a diffusion model, and an autoencoder. The generated imagery is not merely illustrative but also interprets the speech and presents certain metaphors explicitly. Consequently, TrusV-HSD enriches information through visual augmentation, allowing it to learn concrete image concepts alongside abstract textual knowledge.
Hate Speech Detector To efficiently model textual hate speech and its visual agumentation, our TrusV-HSD incorporates a lightweight hate speech detector. This design alleviates the data-intensive reliance and circumvents the needs for fine-tuning heavyweight vison-language backbones, making it ideal for the low-data multimodal HSD. Additionally, our proposed detector aligns long-range multimodal features while maintaining linear computational complexity.
Specifically, we embed the text and image modalities to get and using the pretrained fBERT Sarkar et al. (2021) and CLIP Radford et al. (2021), respectively. Then, a connection block is designed to connect those two embeddings, represented and , where is the alignment dimension. To efficient align multimodal features, we use a Squeeze-and-Excitation Layer Hu et al. (2018) to encourage attentive learning across multimodal embeddings in TrusV-HSD.
Simillarly, we also introduce the state space sequence model (SSM) Gu and Dao (2024) in this block, which maps the multimodal feature into a sequence through a hidden state , where denotes the timestep and represents the state size. represents the evolution parameter, denote the projection parameters. The whole process of SSM is formulated as follows:
| (1) |
| (2) |
where and are the discrete paramters. Based on the zero-order hold method Zhu et al. (2024), and , and denotes the timescale parameter.
Lastly, our hate speech detector delivers the output through a global convolution operation, expressed as . is a casual convolutional kernel, and denotes the input length.
Trustworthy Loss Due to subjective or biased factors of speakers and domain independence among individual speeches, it is critical need for network reliability against uncertainties to ensure trustworthy detections. Inspired by Sensoy et al., 2018 and Qin et al., 2022, we introduce a trustworthy loss to emphasize highly reliable predictions while weakening the impact of unreliable ones. More discussions can be found in Appendix A.2.
Given an input , and the evidence vector is obtained through the network , formulated as , where . Following the principle of Subjective Logic (SL) Jsang (2018) and the uncertainty quantification can be written as , where is the number of classes, is the belief mass and . is the uncertainty quantification and , where . The belief mass assignment corresponds to a Dirichlet distribution with parameters , where . Then, we reformulatethe cross-entropy loss as:
| (3) |
where is the digamma function. Moreover, Kullback-Leibler (KL) divergence is incorporated to penalize the divergence from negative samples, which can be defined as:
| (4) |
where is the classification probability and . is the uniform Dirichlet distribution, and . encourages the model to give negative samples higher uncertainty. Finally, the overall loss can be formulated as:
| (5) |
where is a annealing coefficient, which is set to . is current epoch number, and is the total training epoch number.
| Models | SE | FNUC | |||||
|---|---|---|---|---|---|---|---|
| F1 | Precision | Recall | F1 | Precision | Recall | ||
| RNNLM Mehdad and Tetreault (2016) | 70.62 4.71 | 71.58 5.21 | 70.79 4.42 | 60.64 7.41 | 66.86 7.73 | 60.29 6.31 | |
| SVM Davidson et al. (2017) | 69.22 5.22 | 69.74 4.89 | 69.42 4.68 | 57.26 4.44 | 58.03 5.20 | 57.06 4.24 | |
| HybridCNN Park and Fung (2017) | 70.11 3.92 | 71.40 4.32 | 70.23 4.85 | 62.11 5.19 | 62.43 5.94 | 62.02 4.99 | |
| \hdashlineBERT Devlin et al. (2019) | 72.11 3.37 | 71.23 4.01 | 73.28 4.09 | 62.86 2.02 | 66.81 3.62 | 62.22 1.91 | |
| HateBERT Caselli et al. (2021) | 72.15 4.86 | 68.26 6.78 | 74.41 4.53 | 62.27 5.16 | 64.29 4.93 | 62.05 4.97 | |
| fBERT Sarkar et al. (2021) | 71.37 5.97 | 75.84 5.74 | 71.68 5.49 | 62.41 2.83 | 64.63 3.99 | 61.75 2.52 | |
| \hdashlineRGCN Schlichtkrull et al. (2018) | 73.33 3.79 | 73.71 3.61 | 73.38 3.67 | 68.92 5.75 | 68.86 5.78 | 70.12 6.08 | |
| GCN Mishra et al. (2019) | 66.13 4.11 | 66.57 4.32 | 69.26 8.63 | 55.50 3.90 | 55.82 4.23 | 57.06 4.62 | |
| RSGNN Song et al. (2022) | 74.04 4.01 | 74.29 3.88 | 74.14 3.85 | 69.54 5.36 | 70.15 5.48 | 69.97 5.59 | |
| GAT Miao et al. (2024) | - | - | - | 64.45 3.54 | 63.66 3.45 | 67.26 3.78 | |
| \hdashlineAAST-NLP El-Sayed and Nasr (2024) | 76.34 4.49 | 76.24 3.87 | 77.74 4.56 | 64.42 4.19 | 64.06 4.05 | 65.40 4.59 | |
| TrusV-HSD | 78.92 4.26 | 78.80 4.05 | 79.44 4.51 | 70.27 3.87 | 69.37 3.79 | 72.77 4.61 | |
3 Experiments
Experimental Environment TrusV-HSD is implemented on PyTorch, optimized by Adam Kingma and Ba (2017) with a learning rate of 0.001. The training epoch is set to 800. The experimental environment includes an AMD Ryzen 7 5800X CPU and four NVIDIA GTX 3080 Ti GPUs.
Datasets and Metrics Two public explicit HSD datasets are used to validate the proposed method, including SemEval2019 task-5 (SE) Basile et al. (2019) and Fox News User Comments (FNUC) Gao and Huang (2017) datasets. We also validate our method in the implicit HSD task using the public Implicit Hate Speech (IHC) ElSherief et al. (2021) dataset. SE, FUNC and IHC contain 12,000, 1,528 and 22,056 samples, respectively. We use 10-fold cross-validation to validate the methods. Due to serious sample imbalance, we use F1, Precision, and Recall as evaluation metrics. The average results and standard deviations are presented for each experiment.
Explicit Hate Speech Detection The results of different methods on SE and FNUC are presented in Table 4. Benifiting from integration of visual cues and trustworthy loss, our TrusV-HSD achieves the best F1 scores in the comparisons with other methods. Our TrusV-HSD also achieves optimal or near-optimal precision and recall, with notable improvements in SE dataset. In FNUC dataset, TrusV-HSD exhibits superior F1 performance, along with a significant increase in recall (+2.80%), although the precision is slightly lower (-0.78%) compared to RSGNN. This variation is likely due to the small number of samples in FNUC. Besides, our method outperforms AADT-NLP, a multi-modal HSD method, demonstrating the effectiveness of our proposed detector and the trustworthy loss.
Implicit Hate Speech Detection The above experiments validate our method’s effectiveness in detecting explicit hate speech. Implicit hate speech, masked by subtle tricks, is more challenging to detect. To assess our method comprehensively, we also evaluate its performance in implicit hate speech detection task, focusing on reasoning ability and robustness (see Table 2). Due to severe data imbalance in IHC dataset, BERT tends to predict samples as positive, resulting in high precision but low recall. Despite this, our significant F1 score improvement demonstrates TrusV-HSD’s superiority in large-scale datasets by effectively learning connections between modalities.
| Models | IHC | ||
|---|---|---|---|
| F1 | Precision | Recall | |
| BERT | 67.83 7.61 | 71.05 6.44 | 68.49 7.73 |
| fBERT | 65.32 5.42 | 65.52 5.34 | 65.30 5.48 |
| GCN | 68.40 3.93 | 68.14 3.77 | 69.09 4.23 |
| RSGNN | 69.22 5.22 | 69.74 4.89 | 69.42 4.68 |
| AAST-NLP | 67.48 3.10 | 67.39 3.16 | 67.79 2.99 |
| TrusV-HSD | 71.19 4.30 | 70.88 4.32 | 71.78 4.23 |
Ablation Study The ablation study is tested in SE dataset, and the results are shown in Table 3, where "Detector" and "Detector" denote our detector without and with the connection block, respectively111Detailed seetings can be found in Appendix A.3. We treat fBERT as the baseline, an significant improvement can be observed when imagery cues are added ("+Imagery"). However, simply replacing the classification head ("+Detector") cannot improve performance, as the relationships between modalities are not well connected. Adding the connection block ("+Detector") improves performance, highlighting the importance of connecting modalities. Morever, introducing the trustworthy loss enhances performance through addressing the domain independence problem. Besides, please check generation experiments in Appendix A.4.
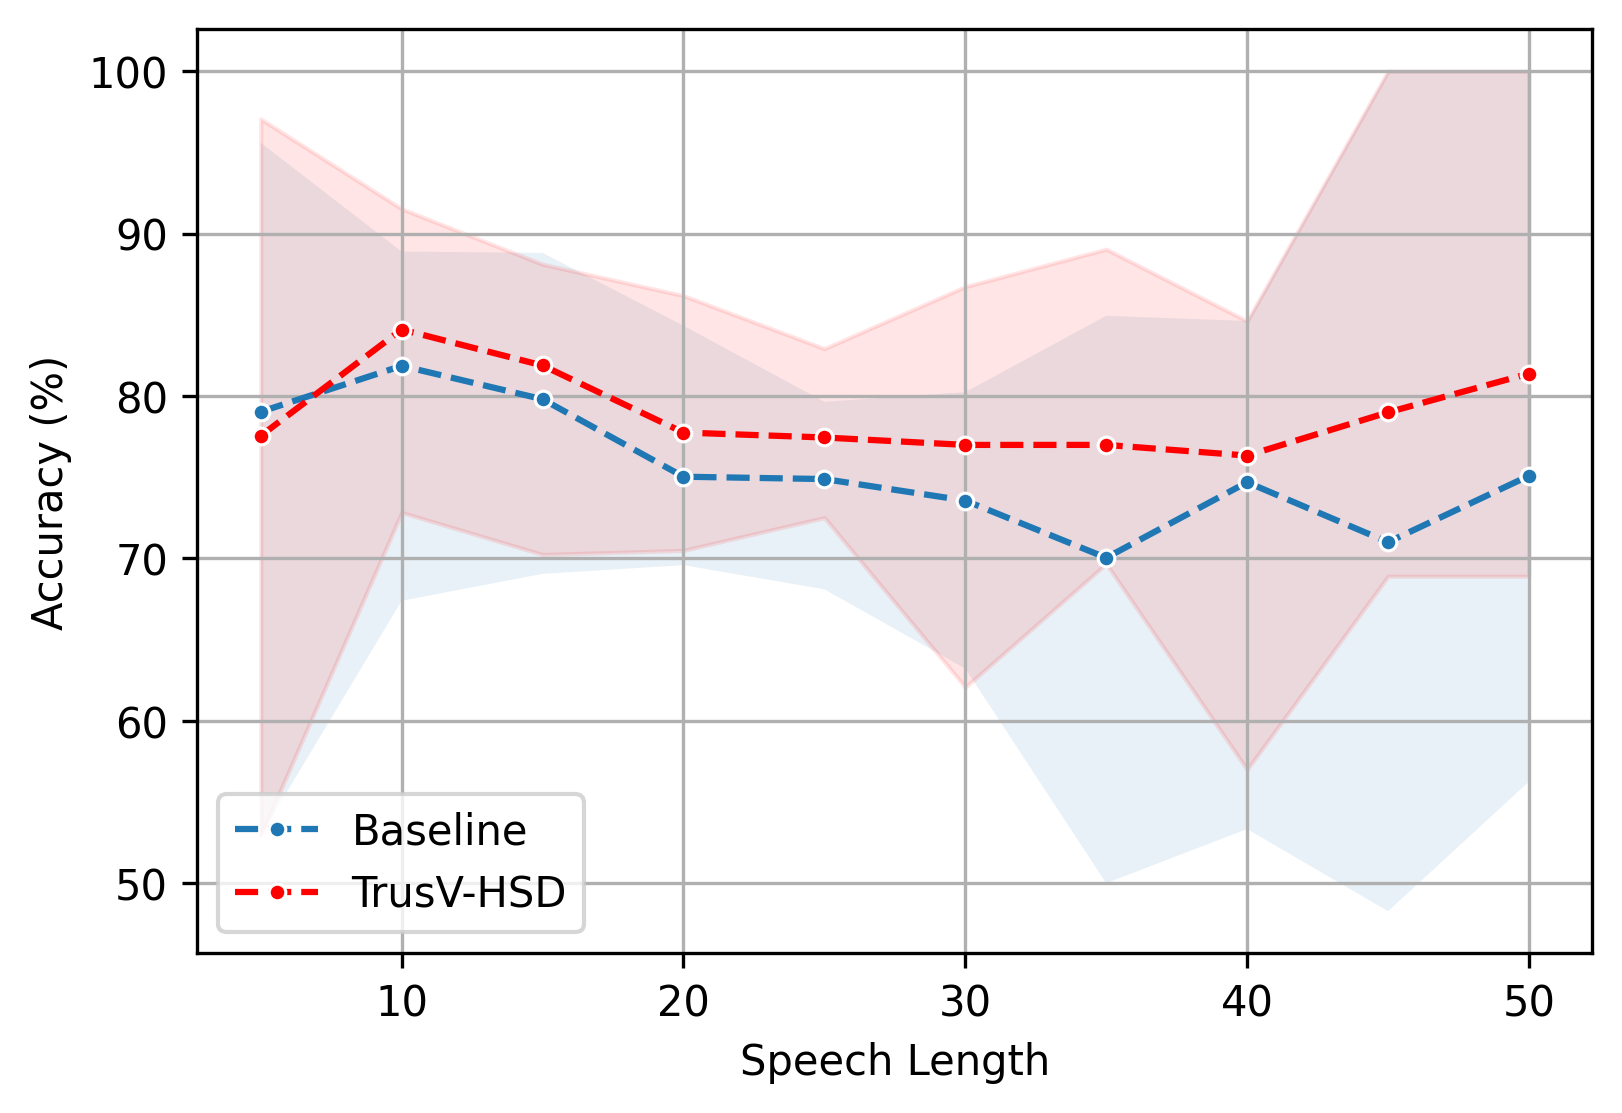
Figure 3 illustrates the average performance and confidence intervals of TrusV-HSD and baseline (TrusV-HSD without trustworthy loss) across various speech lengths in SE. It can be observed that the performance of the baseline declines with increasing speech length. This is because longer texts contain more of the speaker’s subjectivity, leading to significant domain independence problems. TrusV-HSD consistently outperforms the baseline in terms of accuracy across all lengths. This demonstrates that the trustworthy loss helps TrusV-HSD achieve promising robustness and reliability, effectively handling diverse speech lengths and alleviating the domain independence problem.
| Models | SE | ||
|---|---|---|---|
| F1 | Precision | Recall | |
| baseline | 71.37 5.97 | 75.84 5.74 | 71.68 5.49 |
| + Imagery | 76.34 4.49 | 76.24 3.87 | 77.74 4.56 |
| + Detector | 75.28 3.68 | 75.21 3.47 | 75.63 3.84 |
| + Detector | 77.64 4.03 | 77.34 3.87 | 78.62 4.28 |
| + Trustworthy | 78.92 4.26 | 78.80 4.05 | 79.44 4.51 |
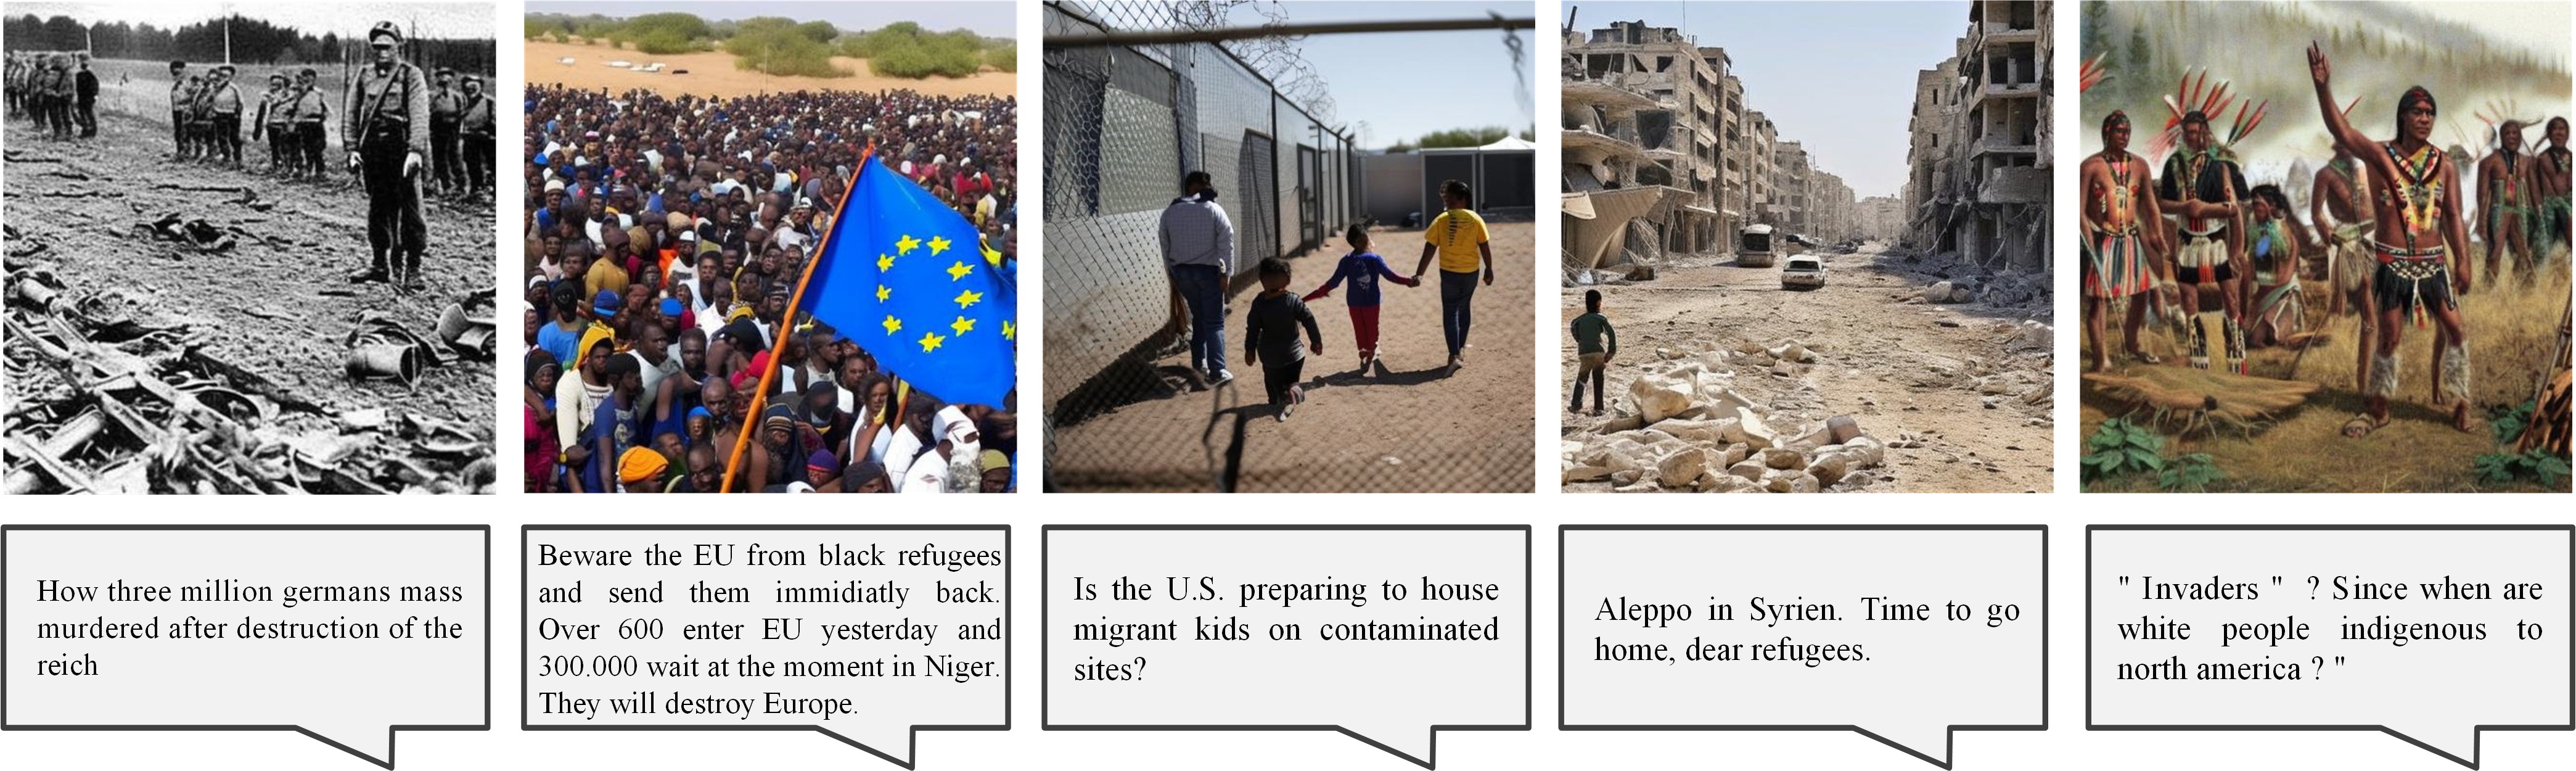
Visualization Examples Several visualized samples are shown in Figure 1, it can be noticed that our generation module enrich semantic information by generating concrete imagery from textual speech. Besides, the generated images could present certain metaphors explicitly, as shown in the final sample of Figure 1. Thereby, the imagery cues help the model learn concrete image concepts alongside abstract textual knowledge.
4 Conclusion
In this paper, we propose a novel trustworthy hate speech detection method via visual augmentation. Concretely, our method can generate imagery cues to enrich information from brief speech, and the designed lightweight detector can effectively alleviate the data-intensive reliance issue. Finally, the trustworthy loss enhances robustness and ensures reliable predictions across diverse speech lengths, alleviating the domain independence problem. In the future work, one possible direction is modeling user-specific features to detect hate speech.
5 Limitations
While our proposed TrusV-HSD shows promising results in both explicit and implicit hate speech detection tasks, it is not without limitations.
Computational Overhead: The process of generating images from the speech adds computational complexity and time.
Potential Risk: Like many AI systems, TrusV-HSD could be susceptible to adversarial attacks designed to manipulate its outcomes.
Language Limitation: Our method has only been tested on English speech. Its effectiveness and accuracy in detecting hate speech in other languages remain unverified, which may limit its applicability in multilingual settings.
Bias and Fairness: While the trustworthy loss aims to reduce subjectivity and bias, it may not completely eliminate them. One possible solution is to provide the speaker’s prior, but related dataset is not collected yet.
6 Ethical Considerations
In this study, we emphasize that all datasets used are publicly available and have been sourced from established repositories. The content within these datasets, including any hate speech examples, does not reflect the views or opinions of the authors. Our research aims to advance the field of hate speech detection for the benefit of the community, and the use of such data is solely for academic and research purposes. Any offensive or harmful content present in the datasets is used only to develop and test our detection models, and we do not endorse or support any of the sentiments expressed in the data.
The image generator was primarily trained on subsets of LAION-2B Schuhmann et al. (2022), which consists mainly of images with English descriptions. Consequently, texts and images from non-English communities and cultures are underrepresented, often defaulting to white and western perspectives. This limitation affects the model’s ability to generate content with non-English prompts, producing significantly poorer results. Stable Diffusion v2 amplifies these biases to a degree that viewer discretion is advised, regardless of the input or its intent.
References
- Abro et al. (2020) Sindhu Abro, Sarang Shaikh, Zahid Hussain Khand, Zafar Ali, Sajid Khan, and Ghulam Mujtaba. 2020. Automatic hate speech detection using machine learning: A comparative study. International Journal of Advanced Computer Science and Applications, 11(8).
- Basile et al. (2019) Valerio Basile, Cristina Bosco, Elisabetta Fersini, Debora Nozza, Viviana Patti, Francisco Manuel Rangel Pardo, Paolo Rosso, and Manuela Sanguinetti. 2019. Semeval-2019 task 5: Multilingual detection of hate speech against immigrants and women in twitter. In Proceedings of the 13th international workshop on semantic evaluation, pages 54–63.
- Bhandari et al. (2023) Aashish Bhandari, Siddhant B. Shah, Surendrabikram Thapa, Usman Naseem, and Mehwish Nasim. 2023. Crisishatemm: Multimodal analysis of directed and undirected hate speech in text-embedded images from russia-ukraine conflict. In 2023 IEEE/CVF Conference on Computer Vision and Pattern Recognition Workshops (CVPRW), pages 1994–2003.
- Boishakhi et al. (2021) Fariha Tahosin Boishakhi, Ponkoj Chandra Shill, and Md. Golam Rabiul Alam. 2021. Multi-modal hate speech detection using machine learning. In 2021 IEEE International Conference on Big Data (Big Data), pages 4496–4499.
- Caselli et al. (2021) Tommaso Caselli, Valerio Basile, Jelena Mitrović, and Michael Granitzer. 2021. HateBERT: Retraining BERT for abusive language detection in English. In Proceedings of the 5th Workshop on Online Abuse and Harms (WOAH 2021), pages 17–25, Online. Association for Computational Linguistics.
- Chen et al. (2024) Yingyu Chen, Ziyuan Yang, Chenyu Shen, Zhiwen Wang, Zhongzhou Zhang, Yang Qin, Xin Wei, Jingfeng Lu, Yan Liu, and Yi Zhang. 2024. Evidence-based uncertainty-aware semi-supervised medical image segmentation. Computers in Biology and Medicine, 170:108004.
- Daouadi et al. (2023) Kheir Eddine Daouadi, Yaakoub Boualleg, and Oussama Guehairia. 2023. Deep random forest and arabert for hate speech detection from arabic tweets. Journal of Universal Computer Science, 29(11):1319–1335.
- Davidson et al. (2017) Thomas Davidson, Dana Warmsley, Michael Macy, and Ingmar Weber. 2017. Automated hate speech detection and the problem of offensive language. In Proceedings of the international AAAI conference on web and social media, volume 11, pages 512–515.
- Devlin et al. (2019) Jacob Devlin, Ming-Wei Chang, Kenton Lee, and Kristina Toutanova. 2019. BERT: Pre-training of deep bidirectional transformers for language understanding. In Proceedings of the 2019 Conference of the North American Chapter of the Association for Computational Linguistics: Human Language Technologies, Volume 1 (Long and Short Papers), pages 4171–4186, Minneapolis, Minnesota. Association for Computational Linguistics.
- El-Sayed and Nasr (2024) Ahmed El-Sayed and Omar Nasr. 2024. AAST-NLP at ClimateActivism 2024: Ensemble-based climate activism stance and hate speech detection : Leveraging pretrained language models. In Proceedings of the 7th Workshop on Challenges and Applications of Automated Extraction of Socio-political Events from Text (CASE 2024), pages 105–110, St. Julians, Malta. Association for Computational Linguistics.
- ElSherief et al. (2021) Mai ElSherief, Caleb Ziems, David Muchlinski, Vaishnavi Anupindi, Jordyn Seybolt, Munmun De Choudhury, and Diyi Yang. 2021. Latent hatred: A benchmark for understanding implicit hate speech. In Proceedings of the 2021 Conference on Empirical Methods in Natural Language Processing, pages 345–363, Online and Punta Cana, Dominican Republic. Association for Computational Linguistics.
- Fortuna et al. (2022) Paula Fortuna, Monica Dominguez, Leo Wanner, and Zeerak Talat. 2022. Directions for NLP practices applied to online hate speech detection. In Proceedings of the 2022 Conference on Empirical Methods in Natural Language Processing, pages 11794–11805, Abu Dhabi, United Arab Emirates. Association for Computational Linguistics.
- Gambäck and Sikdar (2017) Björn Gambäck and Utpal Kumar Sikdar. 2017. Using convolutional neural networks to classify hate-speech. In Proceedings of the First Workshop on Abusive Language Online, pages 85–90, Vancouver, BC, Canada. Association for Computational Linguistics.
- Gao and Huang (2017) Lei Gao and Ruihong Huang. 2017. Detecting online hate speech using context aware models. In Proceedings of the International Conference Recent Advances in Natural Language Processing, RANLP 2017, pages 260–266, Varna, Bulgaria. INCOMA Ltd.
- Gu and Dao (2024) Albert Gu and Tri Dao. 2024. Mamba: Linear-time sequence modeling with selective state spaces. Preprint, arXiv:2312.00752.
- Hebert et al. (2024) Liam Hebert, Gaurav Sahu, Yuxuan Guo, Nanda Kishore Sreenivas, Lukasz Golab, and Robin Cohen. 2024. Multi-modal discussion transformer: Integrating text, images and graph transformers to detect hate speech on social media. Proceedings of the AAAI Conference on Artificial Intelligence, 38(20):22096–22104.
- Hu et al. (2018) Jie Hu, Li Shen, and Gang Sun. 2018. Squeeze-and-excitation networks. In Proceedings of the IEEE conference on computer vision and pattern recognition, pages 7132–7141.
- Jsang (2018) Audun Jsang. 2018. Subjective Logic: A formalism for reasoning under uncertainty.
- Kingma and Ba (2017) Diederik P. Kingma and Jimmy Ba. 2017. Adam: A method for stochastic optimization. Preprint, arXiv:1412.6980.
- Li et al. (2022) Bolian Li, Zongbo Han, Haining Li, Huazhu Fu, and Changqing Zhang. 2022. Trustworthy long-tailed classification. In Proceedings of the IEEE/CVF Conference on Computer Vision and Pattern Recognition, pages 6970–6979.
- Li et al. (2021) Mingqi Li, Song Liao, Ebuka Okpala, Max Tong, Matthew Costello, Long Cheng, Hongxin Hu, and Feng Luo. 2021. Covid-hatebert: a pre-trained language model for covid-19 related hate speech detection. In 2021 20th IEEE International Conference on Machine Learning and Applications (ICMLA), pages 233–238.
- Maity et al. (2022) Krishanu Maity, Prince Jha, Sriparna Saha, and Pushpak Bhattacharyya. 2022. A multitask framework for sentiment, emotion and sarcasm aware cyberbullying detection from multi-modal code-mixed memes. In Proceedings of the 45th International ACM SIGIR Conference on Research and Development in Information Retrieval, SIGIR ’22, page 1739–1749, New York, NY, USA. Association for Computing Machinery.
- Mehdad and Tetreault (2016) Yashar Mehdad and Joel Tetreault. 2016. Do characters abuse more than words? In Proceedings of the 17th Annual Meeting of the Special Interest Group on Discourse and Dialogue, pages 299–303, Los Angeles. Association for Computational Linguistics.
- Miao et al. (2024) Zhenxiong Miao, Xingshu Chen, Haizhou Wang, Rui Tang, Zhou Yang, Tiemai Huang, and Wenyi Tang. 2024. Detecting offensive language based on graph attention networks and fusion features. IEEE Transactions on Computational Social Systems, 11(1):1493–1505.
- Mishra et al. (2019) Pushkar Mishra, Marco Del Tredici, Helen Yannakoudakis, and Ekaterina Shutova. 2019. Abusive Language Detection with Graph Convolutional Networks. In Proceedings of the 2019 Conference of the North American Chapter of the Association for Computational Linguistics: Human Language Technologies, Volume 1 (Long and Short Papers), pages 2145–2150, Minneapolis, Minnesota. Association for Computational Linguistics.
- Park and Fung (2017) Ji Ho Park and Pascale Fung. 2017. One-step and two-step classification for abusive language detection on Twitter. In Proceedings of the First Workshop on Abusive Language Online, pages 41–45, Vancouver, BC, Canada. Association for Computational Linguistics.
- Qin et al. (2022) Yang Qin, Dezhong Peng, Xi Peng, Xu Wang, and Peng Hu. 2022. Deep evidential learning with noisy correspondence for cross-modal retrieval. In Proceedings of the 30th ACM International Conference on Multimedia, MM ’22, page 4948–4956, New York, NY, USA. Association for Computing Machinery.
- Radford et al. (2021) Alec Radford, Jong Wook Kim, Chris Hallacy, Aditya Ramesh, Gabriel Goh, Sandhini Agarwal, Girish Sastry, Amanda Askell, Pamela Mishkin, Jack Clark, et al. 2021. Learning transferable visual models from natural language supervision. In International conference on machine learning, pages 8748–8763. PMLR.
- Rawat et al. (2024) Anchal Rawat, Santosh Kumar, and Surender Singh Samant. 2024. Hate speech detection in social media: Techniques, recent trends, and future challenges. Wiley Interdisciplinary Reviews: Computational Statistics, 16(2):e1648.
- Rombach et al. (2022) Robin Rombach, Andreas Blattmann, Dominik Lorenz, Patrick Esser, and Björn Ommer. 2022. High-resolution image synthesis with latent diffusion models. In Proceedings of the IEEE/CVF Conference on Computer Vision and Pattern Recognition (CVPR), pages 10684–10695.
- Sarkar et al. (2021) Diptanu Sarkar, Marcos Zampieri, Tharindu Ranasinghe, and Alexander Ororbia. 2021. fBERT: A neural transformer for identifying offensive content. In Findings of the Association for Computational Linguistics: EMNLP 2021, pages 1792–1798, Punta Cana, Dominican Republic. Association for Computational Linguistics.
- Schlichtkrull et al. (2018) Michael Schlichtkrull, Thomas N. Kipf, Peter Bloem, Rianne van den Berg, Ivan Titov, and Max Welling. 2018. Modeling relational data with graph convolutional networks. In The Semantic Web, pages 593–607, Cham. Springer International Publishing.
- Schuhmann et al. (2022) Christoph Schuhmann, Romain Beaumont, Richard Vencu, Cade Gordon, Ross Wightman, Mehdi Cherti, Theo Coombes, Aarush Katta, Clayton Mullis, Mitchell Wortsman, et al. 2022. Laion-5b: An open large-scale dataset for training next generation image-text models. Advances in Neural Information Processing Systems, 35:25278–25294.
- Sensoy et al. (2018) Murat Sensoy, Lance Kaplan, and Melih Kandemir. 2018. Evidential deep learning to quantify classification uncertainty. In Proceedings of the Advances in Neural Information Processing Systems (NIPS), volume 31.
- Song et al. (2022) Rui Song, Fausto Giunchiglia, Qiang Shen, Nan Li, and Hao Xu. 2022. Improving abusive language detection with online interaction network. Information Processing and Management, 59(5):103009.
- Tan et al. (2024) Felicia Fang-Yi Tan, Peisen Xu, Ashwin Ram, Wei Zhen Suen, Shengdong Zhao, Yun Huang, and Christophe Hurter. 2024. Audioxtend: Assisted reality visual accompaniments for audiobook storytelling during everyday routine tasks. In Proceedings of the CHI Conference on Human Factors in Computing Systems, CHI ’24, New York, NY, USA. Association for Computing Machinery.
- Yang et al. (2022) Chuanpeng Yang, Fuqing Zhu, Guihua Liu, Jizhong Han, and Songlin Hu. 2022. Multimodal hate speech detection via cross-domain knowledge transfer. In Proceedings of the 30th ACM International Conference on Multimedia, MM ’22, page 4505–4514, New York, NY, USA. Association for Computing Machinery.
- Zhu et al. (2024) Lianghui Zhu, Bencheng Liao, Qian Zhang, Xinlong Wang, Wenyu Liu, and Xinggang Wang. 2024. Vision mamba: Efficient visual representation learning with bidirectional state space model. Preprint, arXiv:2401.09417.
Appendix A Appendix
In the appendix, we first present the motivation behind this paper, followed by a detailed discussion of the trustworthy loss and its effectiveness in this task. Next, we describe the experimental setup. Finally, we conduct a generation experiment to demonstrate the flexibility of the proposed method.
A.1 Motivation
Our main motivation is to introduce a novel learning paradigm for the hate speech detection task by leveraging feature learning from both text and vision modalities simultaneously, rather than proposing a specific framework. This approach differs from previous paradigms that rely solely on the text modality. Additionally, our learning paradigm does not require paired text-image data, ensuring higher flexibility and broader applicability.
We also want to highlight that all the pre-trained feature extraction components in the proposed TrusV-HSD are pluggable and replaceable. In other words, the performance of our method could be further improved with more advanced text or visual pre-trained backbones in the future.
| Models | SE | FNUC | |||||
|---|---|---|---|---|---|---|---|
| F1 | Precision | Recall | F1 | Precision | Recall | ||
| BERT Devlin et al. (2019) | 72.11 3.37 | 77.36 4.92 | 77.67 4.21 | 69.39 3.37 | 69.45 3.27 | 69.82 3.99 | |
| TrusV-HSD* | 77.93 4.12 | 68.26 6.78 | 74.41 4.53 | 62.27 5.16 | 64.29 4.93 | 62.05 4.97 | |
| \hdashlinefBERT Sarkar et al. (2021) | 71.37 5.97 | 75.84 5.74 | 71.68 5.49 | 62.41 2.83 | 64.63 3.99 | 61.75 2.52 | |
| TrusV-HSD# | 78.92 4.26 | 78.80 4.05 | 79.44 4.51 | 70.27 3.87 | 69.37 3.79 | 72.77 4.61 | |
A.2 Trustworthy Loss
Different speech lengths can lead to various distributions, causing the model to struggle with this issue. A similar problem also occurs with other parameters, such as for people of different regions or genders. If the test distribution differs from the training distribution (e.g., different races, genders, religions), it results in a typical out-of-distribution (OOD) problem. Numerous studies Sensoy et al. (2018); Chen et al. (2024) have demonstrated that the trustworthy loss can effectively handle this problem by replacing this parameter set with the parameters of a Dirichlet density. The trustworthy loss transforms the model’s predictions into a distribution over possible softmax outputs, rather than a point estimate of a softmax output. In this way, our model could measure that if the test data is in or out of the distribution.
Specifically, the traditional classification loss classifies the test data into known classes based on the prior knowledge of the training data. However, if the test and training data follow different distributions, this process may lead to misclassification. The trustworthy loss can effectively alleviate this problem by quantifying the uncertainty Li et al. (2022). This approach allows our model to reduce the high reliance on prior knowledge and provide a trustworthy prediction.
Our experiment in our manuscript, Figure 3 in the main text, supports the above statement. 86.44% of the speech in SE is less than 35 words, leading to the model overfitting to the prior knowledge of the high-frequency data distribution. Consequently, standard classification loss (cross-entropy loss)-based methods exhibit a significant performance gap between short and long speeches. Our trustworthy loss effectively alleviates this problem, ensuring the model maintains performance across different data distributions (short and long speeches).
A.3 Experiment Setting
In our paper, 10-fold cross-validation is used to evaluate the robustness and performance of our model comprehensively. This way reduces the variance associated with random partitioning of the data and provides a more thorough assessment of our model’s performance across different subsets, leading to more reliable and stable results. Meanwhile, 10-fold cross-validation is a classical validation protocol in hate speech detection Song et al. (2022), so we chose to validate both our method and the compared methods using this approach.
In the ablation study, our multi-modal baseline has linear layers (without Connection block and Mamba block) after the feature concatenation operation. "Detector" refers to replacing one linear layer with a Mamba Block but without the connection block. "Detector" refers to use both Mamba and connection blocks. "Detector" and "Detector" are optimized with cross-entropy loss, not the trustworthy loss.
A.4 Generation Experiment
To evaluate the generalization performance and illustrate that our proposed method is a pretrained backbone-free method, we evaluated our methods with different backbones: TrusV-HSD# (with BERT) and TrusV-HSD* (with fBERT). The results, as shown in Table 1, clearly indicate that our proposed framework significantly improves detection performance on two public datasets, achieving a 5% F-1 score improvement with BERT and a 7% F-1 score improvement with fBERT in the SE dataset.
Mamba can effectively model long-range interactions within the joint modalities while maintaining linear computational complexity Gu and Dao (2024). For the multi-modal feature extractor, the long-range relationship between the features of the two modalities is crucial. Therefore, in this paper, we utilize Mamba to extract discriminative multi-modal features. Related ablation experiments with and without Mamba can be found in our manuscript (Table 3). Simply replacing the classification head (linear layer) with the Mamba block did not improve performance, likely because the latent relationships between the two modalities were not well connected. In this finding, we carefully designed the connection module to align the features of the two modalities.