Data Diet: Can Trimming PET/CT Datasets Enhance Lesion Segmentation?
Abstract
In this work, we describe our approach to compete in the autoPET3 datacentric track. While conventional wisdom suggests that larger datasets lead to better model performance, recent studies indicate that excluding certain training samples can enhance model accuracy. We find that in the autoPETIII dataset, a model that is trained on the entire dataset exhibits undesirable characteristics by producing a large number of false positives particularly for PSMA-PETs. We counteract this by removing the easiest samples from the training dataset as measured by the model loss before retraining from scratch. Using the proposed approach we manage to drive down the false negative volume and improve upon the baseline model in both false negative volume and dice score on the preliminary test set. Code and pre-trained models are available at: github.com/alexanderjaus/autopet3_datadiet
Keywords:
Semantic Segmentation FDG-PET/CT PSMA-PET/CT Data-Centric AI1 Introduction and Motivation
The segmentation of cancer and other diseases in multimodal medical images, including CT, MRI, X-ray, and PET, is a long-standing challenge in the field of medical image analysis [5], [9], [1]. The autoPET challenge [3] aims to address the segmentation of lesions in a PET/CT dataset and is in its third iteration. This third iteration brings two novelties: (1) the dataset contains FDG-PET and PSMA-PET allowing participants to test their models on two different tracers and (2) participants may compete in two tracks, the standard- and the datacentric track. While wide-ranging modifications to the model architecture, used datasets, loss functions, and training pipeline are allowed in the standard track, the datacentric track keeps the model and optimization procedure fixed. As such, in this track, only specific modifications to the dataset and training pipeline are permitted. In particular, no external data may be used, alterations to augmentation strategies in the training pipeline are permitted while minor changes in the training setup, e.g. altering the number of training epochs, are allowed.
Inspired by the spirit of this challenge, we embrace a data-centric approach and ask: Do we really need all annotated volumes in training? Generally, the mantra in deep learning is ‘more data is better’, while this sentiment seems to be true for the most part [8] it does not apply without restriction as recent research on excluding thoughtfully selected samples in training [2] shows. We deem approaches that weed out data which obfuscates training, to align closer to the principle of data-centrism as opposed to employing advanced data augmentation techniques [11, 4, 10] or enhancing performance through scaling training epochs and hardware for an increased batch size. To this effect, we do not change a single line of code from the baseline source-code 111https://github.com/ClinicalDataScience/datacentric-challenge and solely control which samples are used in training.
2 Method
In the following section, we first describe the baseline model and then highlight its weaknesses. Subsequently, we provide reasoning behind our data-centric filtering strategy with which we aim to address the weaknesses by sample exclusion.
2.1 Baseline Segmentation Model
The autoPET authors present the DynUnet [7] as their baseline model of choice following the well-known setup of nnU-Net [6]. The setup of the fixed model hyperparameters can be found in Table 1.
| Architecture | Patch Size | Spacing | Kernels | Strides |
|---|---|---|---|---|
| DynUnet [7] | (128, 160, 112) | (2.036, 2.036, 3.0) | , | |
| , | ||||
The basic training pipeline used by the authors of this baseline includes training the model on the full autoPET dataset. More specifically, normalization is used to reorient the images into a coordinate framework, resample to a common spacing, and bring the CT and PET values to a fixed range of . Further, the basic training makes use of data augmentation techniques such as introducing gaussian noise, gaussian smoothing, simulating low-resolution images, randomly adjusting image contrast, and flipping along all three axes. For reproducibility, a deterministic setup is used through fixing random seeds.
2.2 Analyzing the Baseline
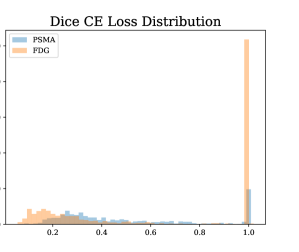
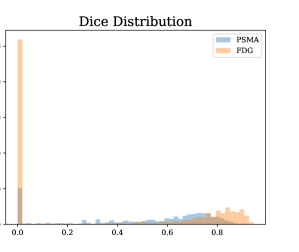
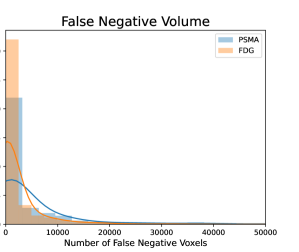
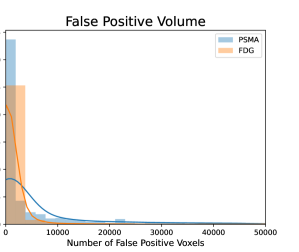
As the authors provide the weights of the baseline model, we start by exploring its properties. The model was trained on the entire training dataset using all folds, to characterize it, we evaluate it’s performance on this same data.Particularly, we measure the magnitude of the loss function, the Dice score, the false positive volumes, and the false negative volumes for each sample. These measurements in the form of histograms and regressed graphs, split into PSMA- and FDG-PETs are shown in Figure 1. Following insights can be drawn from these measurements:
(1) Generally, FDG-PETs are learned better than PSMA-PETs. This can be seen in both, a right-shifted distribution of the FDG-PET Dice scores in the upper right plot, and a left-shifted distribution of loss values in the upper left plot, which indicates better alignment of the learned and target distribution.
(2) The model tends to under-segment metastasis for both FDG- and PSMA-PETs. We find that, the PSMA and FDG distribution of false negative volumes in the lower left plot roughly share the same shape, indicating that the baseline model tends to under-segment metastasis equally for FDG- and PSMA-PETs.
(3) PSMA-PETs exhibit a higher number of false positive voxels. When comparing the distribution of false positive volumes, we find a slight difference in the distributions between PSMA and FDG tracers, where the false positive distribution of PSMA-PETs tends to be skewed more to the right compared to FDG-PETs indicating that PSMA-PETs exhibit more false positive voxels.
Putting these insights together, we hypothesize that the observed performance of the baseline model is to a large extent limited by its predictions in PSMA-PETs, leading to high false positive values.
 |
 |
 |
 |
2.3 Analyzing the Dataset
Upon investigation of the dataset, we find that there is some form of imbalance between the FDG-PET and the PSMA-PET samples. The total number of images in the training dataset is of which are FDG-PET and are PSMA-PET images. Further, the ratio between sick and healthy patients for each tracer are quite balanced for FDG-PETs but severely imbalanced for PSMA PETs, as seen in Figure 2.
This clue supports our stated hypothesis that the baseline tends to overconfidently predict metastasis in PSMA-PET images, since it is trained with only few healthy PSMA-PETs. Thus, the model opts to predict critical regions as cancer, rahter than not.
2.4 Proposed Method
According to our previous analysis, we find, that an ideal, data-centric solution should focus on reducing the predicted false positive volumes of the model for PSMA-PETs. With our intent of selecting samples to exclude from the training set, we reduce the search space for such samples to the PSMA-PETs and keep all FDG-PET images as FDG tracer images scored already quite high in our measurements. Regarding the PSMA-PETs we exclude images for which the baseline model produces a very low loss, which are potential candidates that tilt the model towards overconfidence, as the model overfits on them. To this end, we use the measured loss from the previous step and order the PSMA-images by their loss magnitude in ascending order, then we prune the percentile from the training dataset before retraining from scratch, where is a hyperparameter that we ablate. When analyzing the PSMA images that produce very low loss values (), we find not a single image of them contains a healthy patient. This approach that we call data diet poses two advantages: (1) It improves the sick-to-healthy ratio of the training dataset and (2) hard examples – where learning happens – remain in the training dataset which should lead to a better calibrated model and thus reduce the false positives.
3 Results
As defined by the challenge, we copy the exact setup of the baseline model and do not make any changes, neither to the model nor to the training pipeline. In order to compare our setup directly to the baseline, we use the preliminary test set of the challenge for evaluation. We vary the percentile of easiest PSMA examples and measure the model performance. We summarize our results in Table 2.
| Excluded Percentile | Dice | FN Volume | FP Volume |
|---|---|---|---|
| Baseline | 0.7990 | 23.8380 | 2.0503 |
| Percentile | 0.7879 | 24.3688 | 2.7718 |
| Percentile | 0.8129 | 18.8968 | 2.1739 |
| Percentile | 0.7569 | 20.8366 | 2.3273 |
| Percentile | 0.7980 | 17.3220 | 8.2732 |
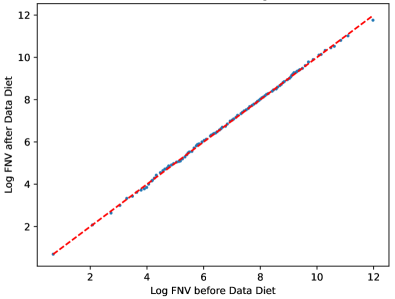
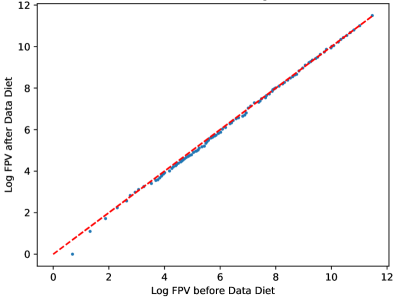
We find that our established intuition holds quite well with the false negative volume generally decreasing with increasing data exclusion. The false positive volume tends to increase as well, which is reasonable, given the model becomes more cautious when predicting metastasis. Taking a look at the Dice score, which is driven by both, false positives as well as false negatives, we find the best results when excluding of the easiest PSMA images. We give the full list of excluded images for the and the scenario in Appendix 0.A. To further evaluate whether the proposed approach reduced the number of false positive predictions in the PSMA-Tracer, we generated a QQ-plot of the log-percentiles from the PSMA False-Positive Distribution, comparing the training dataset before and after a 3% data diet. The results are presented in fig. 3. The plot reveals that most quantiles of the distribution shifted below the dashed reference line, which indicates that the pre- and post-diet distributions are equal. This shift demonstrates a reduction in false positive values, supporting the effectiveness of the data diet approach. Interestingly, the data diet did not alter the False-Negative Volume distribution, as shown in a similar log QQ-plot in Appendix 0.C.
4 Discussion and Limitation
While the overall hypothesis seems to match the observed results it has to be noted that due to the rather small size of the preliminary test set consisting only of a handful of patients, further experiments would be required to strengthen the empirical evidence. Further, we rely on the assumption that modifying the PSMA-data does not influence the performance of the FDG-PET images which would require additional experiments to be validated or falsified.
5 Acknowledgements
The present contribution is supported by the Helmholtz Association under the joint research school “HIDSS4Health – Helmholtz Information and Data Science School for Health and was supported by funding from the pilot program Core-Informatics of the Helmholtz Association (HGF). This work was performed on the HoreKa supercomputer funded by the Ministry of Science, Research and the Arts Baden-Württemberg and by the Federal Ministry of Education and Research.
References
- [1] Antonelli, M., Reinke, A., Bakas, S., Farahani, K., Kopp-Schneider, A., Landman, B.A., Litjens, G., Menze, B., Ronneberger, O., Summers, R.M., et al.: The medical segmentation decathlon. Nature communications 13(1), 4128 (2022)
- [2] Gadre, S.Y., Ilharco, G., Fang, A., Hayase, J., Smyrnis, G., Nguyen, T., Marten, R., Wortsman, M., Ghosh, D., Zhang, J., et al.: Datacomp: In search of the next generation of multimodal datasets. Advances in Neural Information Processing Systems 36 (2024)
- [3] Gatidis, S., Früh, M., Fabritius, M., Gu, S., Nikolaou, K., La Fougère, C., Ye, J., He, J., Peng, Y., Bi, L., et al.: The autopet challenge: towards fully automated lesion segmentation in oncologic pet/ct imaging (2023)
- [4] Ghiasi, G., Cui, Y., Srinivas, A., Qian, R., Lin, T.Y., Cubuk, E.D., Le, Q.V., Zoph, B.: Simple copy-paste is a strong data augmentation method for instance segmentation. In: Proceedings of the IEEE/CVF conference on computer vision and pattern recognition. pp. 2918–2928 (2021)
- [5] Heller, N., Isensee, F., Maier-Hein, K.H., Hou, X., Xie, C., Li, F., Nan, Y., Mu, G., Lin, Z., Han, M., et al.: The state of the art in kidney and kidney tumor segmentation in contrast-enhanced ct imaging: Results of the kits19 challenge. Medical image analysis 67, 101821 (2021)
- [6] Isensee, F., Jaeger, P.F., Kohl, S.A., Petersen, J., Maier-Hein, K.H.: nnu-net: a self-configuring method for deep learning-based biomedical image segmentation. Nature methods 18(2), 203–211 (2021)
- [7] Isensee, F., Jäger, P.F., Kohl, S.A., Petersen, J., Maier-Hein, K.H.: Automated design of deep learning methods for biomedical image segmentation. arXiv preprint arXiv:1904.08128 (2019)
- [8] Radford, A., Kim, J.W., Hallacy, C., Ramesh, A., Goh, G., Agarwal, S., Sastry, G., Askell, A., Mishkin, P., Clark, J., et al.: Learning transferable visual models from natural language supervision. In: International conference on machine learning. pp. 8748–8763. PMLR (2021)
- [9] Simpson, A.L., Antonelli, M., Bakas, S., Bilello, M., Farahani, K., Van Ginneken, B., Kopp-Schneider, A., Landman, B.A., Litjens, G., Menze, B., et al.: A large annotated medical image dataset for the development and evaluation of segmentation algorithms. arXiv preprint arXiv:1902.09063 (2019)
- [10] Yun, S., Han, D., Oh, S.J., Chun, S., Choe, J., Yoo, Y.: Cutmix: Regularization strategy to train strong classifiers with localizable features. In: Proceedings of the IEEE/CVF international conference on computer vision. pp. 6023–6032 (2019)
- [11] Zhang, H.: mixup: Beyond empirical risk minimization. arXiv preprint arXiv:1710.09412 (2017)
Appendix 0.A Excluded Patients in percentile
psma_324f91cd0ec8a80e_2017-03-04
psma_ec45934c2fa23c76_2019-08-05
psma_ec55aac3ff6bec15_2017-04-24
psma_709da54824f16bc1_2018-02-19
psma_a2ff166a8aad6c9f_2018-03-01
psma_5095b111f4d06a37_2017-02-03
psma_25c60014bb1469d3_2022-05-14
psma_698f9e802d84253c_2014-08-03
psma_a672c1e6a35c21b8_2019-07-20
psma_9a8d486e8ddd0427_2021-03-20
psma_c408e60627628585_2021-11-19
psma_4c9d9614d81f3005_2019-10-04
psma_5813d6984082108d_2016-10-23
psma_a17bb16aa6d2f6fa_2020-10-31
psma_8f09d57384f77ce6_2017-07-31
psma_4c9d9614d81f3005_2019-04-15
psma_7e25beff54698eb8_2021-02-06
psma_56e540714db4775a_2020-03-27
psma_18f866bfa3d793d4_2016-08-01
psma_ba5034e13e4c31f5_2019-07-05
psma_6d5c002d629eb131_2022-01-22
psma_0ec0e718244b2a79_2018-09-28
psma_28b47ab366f7ec9d_2016-04-04
psma_ffcaa75377465b37_2018-03-04
psma_80a782c4b998fefd_2020-07-31
psma_57a5841a095d55d1_2018-06-30
psma_95a4d87af2bc56f7_2019-03-11
psma_7fa68d5b0861c0b4_2014-10-30
psma_ffcaa75377465b37_2017-07-20
psma_ffcaa75377465b37_2016-11-14
Appendix 0.B Excluded Patients in percentile
psma_5813d6984082108d_2016-10-23
psma_a17bb16aa6d2f6fa_2020-10-31
psma_8f09d57384f77ce6_2017-07-31
psma_4c9d9614d81f3005_2019-04-15
psma_7e25beff54698eb8_2021-02-06
psma_56e540714db4775a_2020-03-27
psma_18f866bfa3d793d4_2016-08-01
psma_ba5034e13e4c31f5_2019-07-05
psma_6d5c002d629eb131_2022-01-22
psma_0ec0e718244b2a79_2018-09-28
psma_28b47ab366f7ec9d_2016-04-04
psma_ffcaa75377465b37_2018-03-04
psma_80a782c4b998fefd_2020-07-31
psma_57a5841a095d55d1_2018-06-30
psma_95a4d87af2bc56f7_2019-03-11
psma_7fa68d5b0861c0b4_2014-10-30
psma_ffcaa75377465b37_2017-07-20
psma_ffcaa75377465b37_2016-11-14
Appendix 0.C Comparison of False Negative Distribution Pre- vs. Post Data Diet