Thermal spectrometer for superconducting circuits
Abstract
Superconducting circuits provide a versatile and controllable platform for studies of fundamental quantum phenomena as well as for quantum technology applications. A conventional technique to read out the state of a quantum circuit or to characterize its properties is based on rf measurement schemes involving costly and complex instrumentation. Here we demonstrate a simple dc measurement of a thermal spectrometer to investigate properties of a superconducting circuit, in this proof-of-concept experiment a coplanar waveguide resonator. A fraction of the microwave photons in the resonator is absorbed by an on-chip bolometer, resulting in a measurable temperature rise. By monitoring the dc signal of the thermometer due to this process, we are able to determine the resonance frequency and the lineshape (quality factor) of the resonator. The demonstrated scheme, which is a simple dc measurement, has a wide band up to , well exceeding that of the typical rf spectrometer. Moreover, the thermal measurement yields a highly frequency independent reference level of the Lorentzian absorption signal, unlike the conventional rf measurement. In the low power regime, the measurement is fully calibration-free. Our technique thus offers an alternative spectrometer for quantum circuits, which is in many ways superior with respect to conventional methods.
Introduction
Superconducting circuits are vastly used for quantum phenomena experiments and quantum technology applications [1, 2, 3, 4]. Josephson junction (JJ) and coplanar waveguide (CPW) resonator are the central elements as they provide realization of a macroscopic artificial atom, a quantum bit (qubit), that can be conveniently controlled, probed, and integrated with other non-superconducting elements. For instance, realization of a thermal reservoir by integration of dissipative element such as a normal-metal absorber provides experimental platform for studies of quantum thermodynamics [5, 6] and heat management [7, 8, 9]. Quantum information [10, 11] and metrology [12, 13, 14, 15] are the most prominent examples of the technology applications of superconducting circuits.
Detection in superconducting devices is a central key in the characterization and operation of the devices. For example, rf spectroscopy becomes a standard technique to measure qubit energy spectrum and its coherent interaction with microwave photons [16, 17, 18]. The study of a resonator and its loss mechanisms relies on the spectroscopy technique, either transmission () or reflection () measurement [19, 20]. Conventional rf spectroscopy, involving amplification of a microwave probe tone at different temperature stages followed by heterodyne detection at room temperature, requires costly electronics and cryogenic elements such as vector network analyzer (VNA), low-temperature amplifiers, circulators, and superconducting coaxial lines. These components are bulky and lossy. Precise cabling, grounding, and connection of the lines and components are crucial to avoid any microwave mismatch and leakage, that can result to parasitic resonances and suppression of the desired signals[21].
A bolometer consists of an energy absorbing element and the associated thermometer detecting temperature changes due to energy input [22, 23]. Bolometric detection in a superconducting circuit offers advantages compared to conventional schemes of rf measurement. Using a bolometric detector, that can be placed at the millikelvin stage, the use of cryogenic elements can be avoided. A single-shot qubit readout has been demonstrated by using a bolometer that is located on a separate chip [24]. Without the use of low-temperature parametric amplifier, the authors could measure the qubit state by monitoring temperature in the bolometer. Another advantage is the broadband operation of the bolometer, while a typical rf setup is limited to narrow frequency range of . A nano-bolometer has been used to calibrate the attenuation of a coaxial line in a broad frequency range [25]. A bolometric measurement of a high frequency Josephson ac current has been demonstrated [26] where the authors could detect ac current up to 100 GHz. Morever, the bolometer could reach small energy resolution as demonstrated by proximitized thermometer and graphene as the thermal detector [27, 28], and it is a potential candidate of a single photon detector.
In this work we design, build and measure an on-chip bolometer that performs as a sensitive and broadband spectrometer to characterize the properties of a superconducting resonator. The bolometer absorbs the decaying photons from the driven resonator leading to a temperature rise. By measuring the dc signals corresponding to the steady-state temperature in the bolometer, we are able to determine the resonance frequency and the internal quality factor of the resonator. We observe that the loss due to two level systems (TLSs) dominates at the low power regime, while at high power regime quasiparticles (QPs) are the dominant source of losses. The measurements are done by using a simple dc voltmeter.
Principle of thermal spectrometer
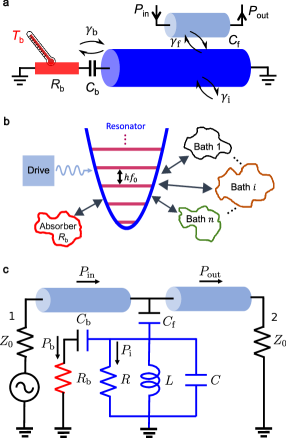
The principle of characterizing a superconducting resonator by an on-chip bolometer is shown in Fig. 1a. The resonator (dark blue) is coupled to a feedline (light blue) via capacitance . The open-circuit end of the resonator (left) is coupled by capacitance to a bolometer that consists of an absorber (red) with resistance and the associated thermometer to detect temperature change due to input energy. A microwave tone is injected through the input feedline to excite photons in the resonator. The photons subsequently decay via several loss channels. Internal loss is mostly due to TLSs or QPs depending on power and temperature, and external losses are dominated by the proximity of the feedline and the bolometer itself. Thus, the total loss rate is , where is the internal loss rate, is loss rate to the feedline, and is loss rate to the bolometer. The system is the case of a driven resonator (a harmonic oscillator) coupled to several thermal baths, as shown in Fig.1b. The photons that are absorbed by the bolometer heat the resistor with power , leading to temperature rise . The power takes Lorentzian form as a function of the driving frequency around resonance with the linewidth . Due to the linearity of the resonator, is independent on bolometer temperature and takes a form
| (1) |
a result that one can obtain both by circuit theory and open quantum system approach (see Supplementary Information I and II). By measuring the frequency dependence of , which can be measured by a steady-state temperature measurement of the bolometer, the total-loss rate and the resonance frequency of the resonator can thus be determined.
Moreover, from the lumped circuit model, the heating power depends on the impedance of the circuit elements [29]. At frequency around resonance , the resonator can be approximated as a parallel LCR circuit, which is capacitively coupled to the absorber and two ports of feedline as shown in Fig. 1c (see Supplementary Information I). The driving field excites the circuit and the energy losses to the dissipative elements, which is to the feedline , to the bolometer , and to the internal bath . The is power dissipated at internal bath. Thus, the total inverse quality factor of the circuit (resonator) is , where , , , and . Therefore, the inverse internal quality factor can be expressed as
| (2) |
Experimental setup and result
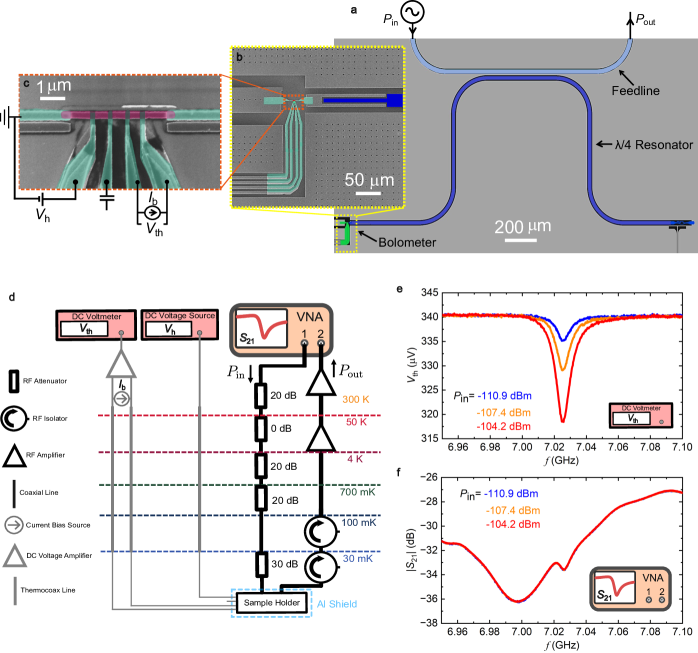
The studied device consists of a quarter-wavelength () coplanar waveguide (CPW) resonator capacitively probed by the feedline and the on-chip bolometer as shown in the device layout in Fig. 2(a). Both resonator and feedline are made of niobium (Nb) film on top of silicon (Si) substrate. We design , is about , total inductance of the resonator is , and total capacitance of the resonator is . These values correspond to the quality factor of the feedline and bolometer as and respectively. The shorted end of the resonator (right) is shunted by inactive flux qubit consisting of a parallel aluminium (Al) line and Josephson junctions, tuned at zero magnetic flux thus effectively shunted only by the Al line [30, 31]. The open-circuit end of the resonator is capacitively connected to a copper (Cu) film functioning as the bolometer as shown in Fig. 2(b). In the experiment, we employ a pair of normal metal-insulator-superconductor (NIS) junctions in SINIS configuration to probe the temperature () in the Cu absorber (red), as shown in Fig. 2(c). The temperature rise manifests in the change of voltage accross the SINIS pair [23, 32]. Once the temperature is determined from the calibration conversion (see Supplementary Information III), the power can be calculated by electron phonon relation as
| (3) |
where is electron phonon coupling constant, is the volume of the Cu absorber, is the electronic temperature in Cu, is temperature of phonon bath, and is constant background heating from the environment. The volume and electron phonon constant of the Cu absorber are estimated to be and [23, 32, 33].
The resonator is probed simultaneously by both the feedline and bolometer. The measurement schemes consisting of dc and rf setup are shown in Fig. 2d. The measurements are performed in a dilution refrigerator at around 50 mK temperature. Input power is injected from Port-1 of the feedline, and the output power from Port-2 is amplified and measured at room temperature. Comparing the output and input signal by using VNA, the scattering parameter can be measured. From the VNA, we sweep the frequency around a resonance frequency at fixed input power varying from to . Simultaneously with the measurement, the SINIS voltage is recorded with a dc voltmeter. The and at three different input powers are shown in Fig. 2e-f. We observe noticeable reduction of at frequency , which is the fundamental resonance frequency. As expected, this voltage reduction is due to heating that increases the temperature in the bolometer, caused by photons emitted by the resonator. The minimum values of are located at resonance frequency where the heating power is at maximum. On the contrary in measurement, the resonance dip is weak () buried in the varying background. This is due to the frequency dependent transmission in the line and low loaded quality factor of the resonator. From these two measurements we can see that with the thermal detector, the signal is more pronounced compared to the scattering measurement.
| Quantity | Symbol | Value |
|---|---|---|
| Low power TLSs losses | ||
| Design-dependent constant | ||
| TLSs characteristic power | ||
| Resonance frequency | ||
| Temperature | ||
| Amplitude constant | ||
| QPs characteristic power |
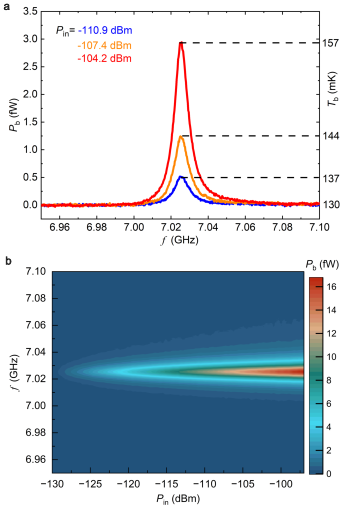
We convert the measured to its corresponding temperature and power dissipation . By using the conversion formula obtained from the bolometer calibration (see Supplementary Information III), we obtain around the resonance as shown in Fig 3a on the right axis. Although the measurement is carried out at 50 mK, saturates at around 130 mK. This saturation is dominated by heating from the environment with effective background power [32, 34]. The heating power , converted from Eq.3, is plotted in Fig 3a on the left axis. Figure 3b displays 2d plot of versus at different powers. At resonance , the heating power grows by increasing input power due to the rising of average photon number in the resonator. The thermal measurement results in a highly frequency independent reference level of the Lorentzian absorption signal .
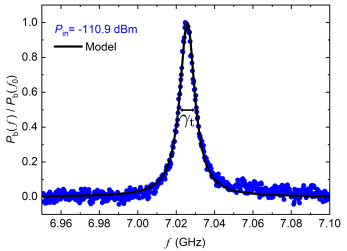
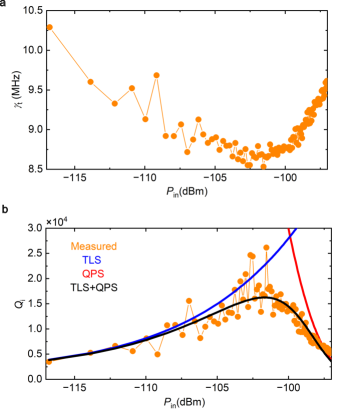
We normalize the measured by its magnitude at resonance as plotted in Fig 4 for . We fit the data with normalized Lorentzian function of model Eq.1 to obtain the total loss rate as shown in Fig 4. The plot of versus is shown in Fig 5a. It is known that has power dependence that is due to varying internal loss rate . We observe two different behaviors at below and above power around . To understand this behavior, we estimate the internal quality factor of the resonator as plotted in Fig 5b calculated by Eq. 2. The increase of at low power regime is well known to be due to saturation of TLSs [19], and at sufficiently high power the resonator is heated up [20]. We confirm this by comparing the data with model of internal quality factor due to TLSs and QPs.
| (4) |
where is due to losses by TLSs [19]and is phenomenological model describing quasiparticle losses [20]. The list of values of fitting parameters used is shown in Table 1.
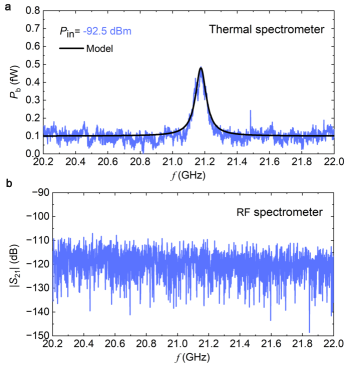
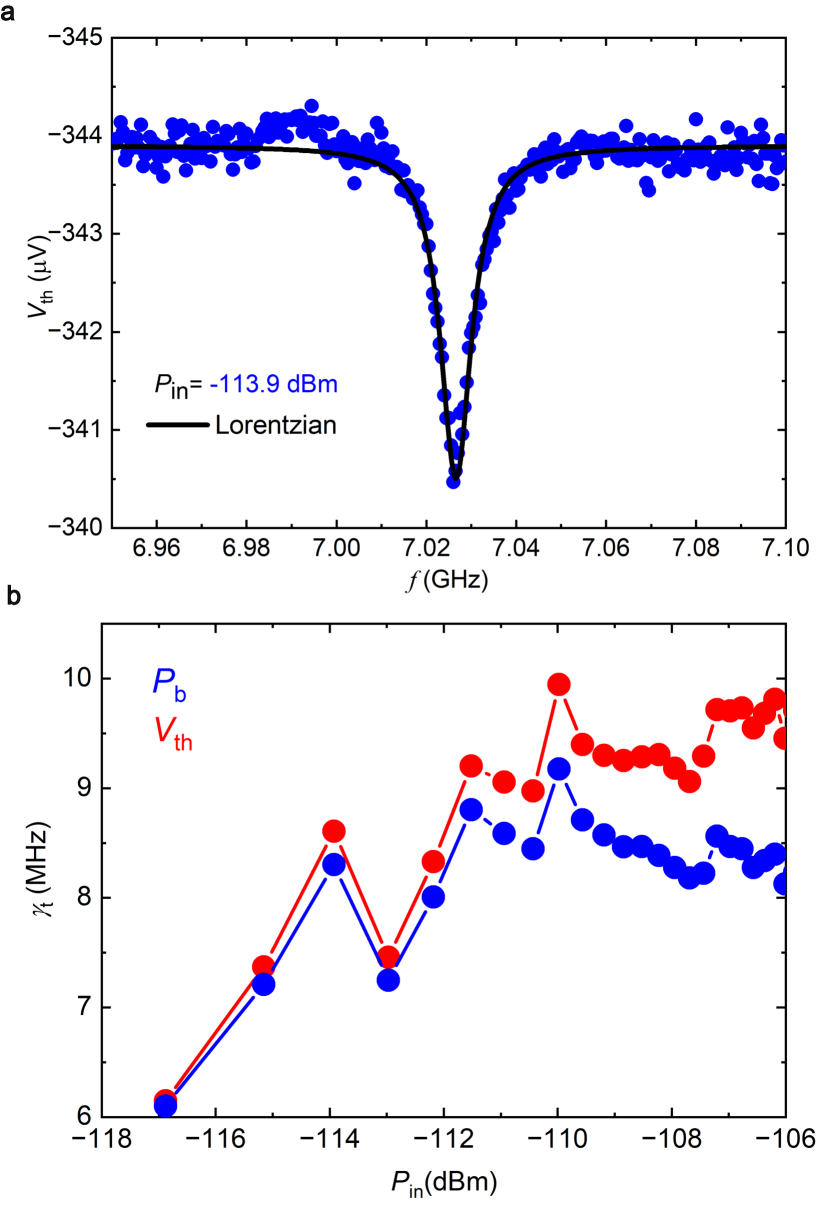
Furthermore, we measure the and at frequency above 20 GHz to detect the mode of of the resonator shown in Fig 6a-b. With the bolometer, we observe the Lorentzian heating at around frequency , which is the mode of . While with the scattering measurement, due to the limitation of the bandwidth of the rf low-temperature amplifier and rf isolators, we cannot detect any signal at this frequency range. The bolometer has an estimated cut-off frequency of about , limited by the LR-circuit resonance cutoff , where is the inductance of the Cu wire. This is a clear demonstration of the advantage of the bolometer thanks to its broad operational frequency compared to standard rf measurement scheme. Moreover, there is a regime where the thermal spectrometer is fully calibration-free. When the temperature difference is small (), we can approximate Eq.3 by [35]. Since in this regime is approximately linear, we have . Therefore, follows already the Lorentzian spectrum. In this case, we can fit directly with Lorentzian function as shown in Fig 7a. Figure 7b displays obtained from fitting and . They show equal results at low power but deviate at higher power levels due to large temperature rise, i.e. non-linearity in Eq.3.
The noise-equivalent power (NEP) extracted from this experiment is . On the other hand, the thermal fluctuation limit is given by at mK, which is the saturation temperature in the current experiment. Thus our experiment is less than one order of magnitude above this fundamental lower bound. For implementation as a qubit readout device, we may compare the experimental performance with the single photon power at with the loss rate from the resonator to the copper strip. This power could be measured using steady-state spectroscopy, even at a relatively high temperature, with the current signal-to-noise ratio at a low speed (several Hz). The thermal spectrometer could then be used in the single-photon regime to perform both one-tone and two-tone spectroscopy of a qubit. This would be useful especially for resonators and qubits operating at high frequency above the standard spectrometer range [36, 37].
Conclusion
In summary, we have demonstrated operation of an on-chip bolometric spectrometer to characterize a superconducting resonator. The measurement is done by a simple dc measurement setup. The bolometer operates by absorbing the energy decay of the resonator, leading to temperature rise in the bolometer, which is detected by measuring the dc voltage change acrross a pair of NIS thermometer junctions. The resonance frequency and the lineshape (quality factor) of the resonator can be determined based on the temperature change. We have demonstrated additional advantages of the bolometer compared to standard rf measurement in the high frequency range: the bandwidth of the bolometer exceeds that of a standard rf spectrometer. Furthermore, we found a calibration-free regime where the measured voltage follows Lorentzian spectrum. The thermal spectrometer could then be used in the single-photon regime to perform both one-tone and two-tone spectroscopy of a qubit.
Methods
Fabrication
The fabrication of the device is done in a multistage process on a -thick and highly resistive silicon (Si) substrate, resulting to device shown in Fig. 2a-c. The fabrication consists of there main steps: (1) fabricating niobium (Nb) structures (resonator, feedline, ground plane, and pads), (2) fabrictaing flux qubit made of three junctions of superconductor–insulator–superconductor (SIS) with aluminium (Al) film, (3) fabricating bolometer consisting absorber and thermometer. A -thick Al2O3 layer is deposited onto a silicon substrate using atomic layer deposition, followed by a deposition of a -thick Nb film using DC magnetron sputtering. Positive electron beam resist, AR-P6200.13, is spin-coated with a speed of 6000 rpm for 60 s, and is post-baked for 9 minutes at 160∘C, which is then patterned by electron beam lithography (EBL) and etched by reactive ion etching. A shadow mask defined by EBL on a 1 -thick poly(methyl-metacrylate)/copolymer resist bilayer is used to fabricate the flux qubit made of Al film shunting the resonator at the shorted end [30]. Before the deposition of Al film, the Nb surface is cleaned in-situ by Ar ion plasma milling for 60 s. The bolometer structure is fabricated with three angle deposition technique. To have a clean contact between Nb film and Al film, the Nb surface is cleaned in-situ by Ar ion plasma milling for 45 s, followed by deposition at +40∘ of 20 nm-thick Al lead. The Al lead is oxidized at 2.5 mbar pressure for 2 minutes. After that, 3 nm-thick Al buffer layer is deposited at -6.5∘, followed by deposition of 30 nm-thick Cu film at -6.5∘. Finally, 90 nm-thick Al film is deposited at +20∘ on top of the edge of Cu film to connect the Cu to the Nb capacitor. Finally, after liftoff in hot acetone (52 degrees for 30 minutes) and cleaing with isopropyl alcohol, the substrate is cut by an automatic dicing-saw machine to the size mm and wire-bonded to an cooper rf-dc holder for the low-temperature characterization.
Measurement setup
Measurements are performed in a cryogen-free dilution refrigerator at temperature of 30 mK with the setup shown in Fig. 2d. To obtain scattering data , using a VNA, a probe microwave tone is supplied to the input feedline through a 90 dB of attenuation distributed at the various temperature stages of the fridge. The output probe signal is then passed through two cryogenic circulators, before being amplified first by a 40 dB cryogenic amplifier and then by a 40 dB room-temperature amplifier. The volatge is measured by a dc voltmeter through thermocoax line. The device is mounted in a tight cooper holder and covered by an Al shield.
Acknowledgements
We thank Mikko Möttönen, Sergey Kubatkin, Sergei Lemziakov, Vasilii Vadimov, Andrew Guthrie, Diego Subero, Dmitrii Lvov, Elias Ankerhold, and Miika Rasola for fruitful discussions and supports. This work is financially supported by the Foundational Questions Institute Fund (FQXi) via Grant No. FQXi-IAF19-06, the Research Council of Finland Centre of Excellence programme grant 336810 and grant 349601 (THEPOW). We sincerely acknowledge the facilities and technical supports of Otaniemi Research Infrastructure for Micro and Nanotechnologies (OtaNano) to perform this research. We thank VTT Technical Research Center for sputtered Nb films.
References
- Blais et al. [2021] A. Blais, A. L. Grimsmo, S. M. Girvin, and A. Wallraff, Circuit quantum electrodynamics, Reviews of Modern Physics 93, 025005 (2021).
- Blais et al. [2020] A. Blais, S. M. Girvin, and W. D. Oliver, Quantum information processing and quantum optics with circuit quantum electrodynamics, Nature Physics 16, 247–256 (2020).
- Clerk et al. [2020] A. A. Clerk, K. W. Lehnert, P. Bertet, J. R. Petta, and Y. Nakamura, Hybrid quantum systems with circuit quantum electrodynamics, Nature Physics 16, 257 (2020).
- Carusotto et al. [2020] I. Carusotto, A. A. Houck, A. J. Kollár, P. Roushan, D. I. Schuster, and J. Simon, Photonic materials in circuit quantum electrodynamics, Nature Physics 16, 268 (2020).
- Ronzani et al. [2018] A. Ronzani, B. Karimi, J. Senior, Y.-C. Chang, J. T. Peltonen, C. Chen, and J. P. Pekola, Tunable photonic heat transport in a quantum heat valve, Nature Physics 14, 991 (2018).
- Senior et al. [2020] J. Senior, A. Gubaydullin, B. Karimi, J. T. Peltonen, J. Ankerhold, and J. P. Pekola, Heat rectification via a superconducting artificial atom, Communications Physics 3, 1–5 (2020).
- Yoshioka et al. [2023] T. Yoshioka, H. Mukai, A. Tomonaga, S. Takada, Y. Okazaki, N.-H. Kaneko, S. Nakamura, and J.-S. Tsai, Active initialization experiment of a superconducting qubit using a quantum circuit refrigerator, Physical review applied 20, 10.1103/physrevapplied.20.044077 (2023).
- Partanen et al. [2018] M. Partanen, K. Y. Tan, S. Masuda, J. Govenius, R. E. Lake, M. Jenei, L. Grönberg, J. Hassel, S. Simbierowicz, V. Vesterinen, J. Tuorila, T. Ala-Nissila, and M. Möttönen, Flux-tunable heat sink for quantum electric circuits, Scientific Reports 8, 6325 (2018).
- Tan et al. [2017] K. Y. Tan, M. Partanen, R. E. Lake, J. Govenius, S. Masuda, and M. Möttönen, Quantum-circuit refrigerator, Nature Communications 8, 10.1038/ncomms15189 (2017).
- Barends et al. [2014] R. Barends, J. Kelly, A. Megrant, A. Veitia, D. Sank, E. Jeffrey, T. C. White, J. Mutus, A. G. Fowler, B. Campbell, Y. Chen, Z. Chen, B. Chiaro, A. Dunsworth, C. Neill, P. O’Malley, P. Roushan, A. Vainsencher, J. Wenner, A. N. Korotkov, A. N. Cleland, and J. M. Martinis, Superconducting quantum circuits at the surface code threshold for fault tolerance, Nature 508, 500–503 (2014).
- Devoret and Schoelkopf [2013] M. H. Devoret and R. J. Schoelkopf, Superconducting circuits for quantum information: An outlook, Science 339, 1169 (2013).
- Shaikhaidarov et al. [2022] R. S. Shaikhaidarov, K. H. Kim, J. W. Dunstan, I. V. Antonov, S. Linzen, M. Ziegler, D. S. Golubev, V. N. Antonov, E. V. Il’ichev, and O. V. Astafiev, Quantized current steps due to the a.c. coherent quantum phase-slip effect, Nature 608, 45–49 (2022).
- Shlyakhov et al. [2018] A. R. Shlyakhov, V. V. Zemlyanov, M. V. Suslov, A. V. Lebedev, G. S. Paraoanu, G. B. Lesovik, and G. Blatter, Quantum metrology with a transmon qutrit, Phys. Rev. A 97, 022115 (2018).
- Danilin et al. [2018] S. Danilin, A. V. Lebedev, A. Vepsäläinen, G. B. Lesovik, G. Blatter, and G. S. Paraoanu, Quantum-enhanced magnetometry by phase estimation algorithms with a single artificial atom, npj Quantum Information 4, 10.1038/s41534-018-0078-y (2018).
- Lvov et al. [2024] D. S. Lvov, S. A. Lemziakov, E. Ankerhold, J. T. Peltonen, and J. P. Pekola, Thermometry based on a superconducting qubit (2024), arXiv:2409.02784 [quant-ph] .
- Wallraff et al. [2004] A. Wallraff, D. I. Schuster, A. Blais, L. Frunzio, R.-S. Huang, J. Majer, S. Kumar, S. M. Girvin, and R. J. Schoelkopf, Strong coupling of a single photon to a superconducting qubit using circuit quantum electrodynamics, Nature 431, 162 (2004).
- Schuster et al. [2005] D. I. Schuster, A. Wallraff, A. Blais, L. Frunzio, R.-S. Huang, J. Majer, S. M. Girvin, and R. J. Schoelkopf, ac stark shift and dephasing of a superconducting qubit strongly coupled to a cavity field, Physical Review Letters 94, 10.1103/physrevlett.94.123602 (2005).
- Wallraff et al. [2007] A. Wallraff, D. I. Schuster, A. Blais, J. M. Gambetta, J. Schreier, L. Frunzio, M. H. Devoret, S. M. Girvin, and R. J. Schoelkopf, Sideband transitions and two-tone spectroscopy of a superconducting qubit strongly coupled to an on-chip cavity, Physical Review Letters 99, 10.1103/physrevlett.99.050501 (2007).
- Goetz et al. [2016] J. Goetz, F. Deppe, M. Haeberlein, F. Wulschner, C. W. Zollitsch, S. Meier, M. Fischer, P. Eder, E. Xie, K. G. Fedorov, E. P. Menzel, A. Marx, and R. Gross, Loss mechanisms in superconducting thin film microwave resonators, Journal of applied physics 119, 10.1063/1.4939299 (2016).
- McRae et al. [2020] C. R. H. McRae, H. Wang, J. Gao, M. R. Vissers, T. Brecht, A. Dunsworth, D. P. Pappas, and J. Mutus, Materials loss measurements using superconducting microwave resonators, Rev. Sci. Instrum. 91, 091101 (2020).
- Huang et al. [2021] S. Huang, B. Lienhard, G. Calusine, A. Vepsäläinen, J. Braumüller, D. K. Kim, A. J. Melville, B. M. Niedzielski, J. L. Yoder, B. Kannan, T. P. Orlando, S. Gustavsson, and W. D. Oliver, Microwave package design for superconducting quantum processors, PRX Quantum 2, 020306 (2021).
- Richards [1994] P. L. Richards, Bolometers for infrared and millimeter waves, Journal of Applied Physics 76, 1 (1994).
- Giazotto et al. [2006] F. Giazotto, T. T. Heikkilä, A. Luukanen, A. M. Savin, and J. P. Pekola, Opportunities for mesoscopics in thermometry and refrigeration: Physics and applications, Rev. Mod. Phys. 78, 217 (2006).
- Gunyhó et al. [2024] A. M. Gunyhó, S. Kundu, J. Ma, W. Liu, S. Niemelä, G. Catto, V. Vadimov, V. Vesterinen, P. Singh, Q. Chen, and M. Möttönen, Single-shot readout of a superconducting qubit using a thermal detector, Nature Electronics 7, 288–298 (2024).
- Girard et al. [2023] J.-P. Girard, R. Lake, W. Liu, R. Kokkoniemi, E. Visakorpi, J. Govenius, and M. Möttönen, Cryogenic sensor enabling broad-band and traceable power measurements, Review of Scientific Instruments 94, 10.1063/5.0143761 (2023).
- Karimi et al. [2024] B. Karimi, G. O. Steffensen, A. P. Higginbotham, C. M. Marcus, A. Levy Yeyati, and J. P. Pekola, Bolometric detection of josephson radiation, Nature Nanotechnology 10.1038/s41565-024-01770-7 (2024).
- Kokkoniemi et al. [2020] R. Kokkoniemi, J.-P. Girard, D. Hazra, A. Laitinen, J. Govenius, R. Lake, I. Sallinen, V. Vesterinen, M. Partanen, J. Tan, K. Chan, K. Y. Tan, P. Hakonen, and M. Möttönen, Bolometer operating at the threshold for circuit quantum electrodynamics, Nature 586, 47 (2020).
- Karimi et al. [2020] B. Karimi, F. Brange, P. Samuelsson, and J. P. Pekola, Reaching the ultimate energy resolution of a quantum detector, Nature Communications 11, 367 (2020).
- Satrya et al. [2023] C. D. Satrya, A. Guthrie, I. K. Mäkinen, and J. P. Pekola, Electromagnetic simulation and microwave circuit approach of heat transport in superconducting qubits, Journal of Physics Communications 7, 015005 (2023).
- Upadhyay et al. [2021] R. Upadhyay, G. Thomas, Y.-C. Chang, D. S. Golubev, A. Guthrie, A. Gubaydullin, J. T. Peltonen, and J. P. Pekola, Robust strong-coupling architecture in circuit quantum electrodynamics, Physical review applied 16, 10.1103/physrevapplied.16.044045 (2021).
- Abdumalikov et al. [2008] A. A. Abdumalikov, O. Astafiev, Y. Nakamura, Y. A. Pashkin, and J. Tsai, Vacuum rabi splitting due to strong coupling of a flux qubit and a coplanar-waveguide resonator, Phys. Rev. B 78, 180502 (2008).
- Meschke et al. [2006] M. Meschke, W. Guichard, and J. P. Pekola, Single-mode heat conduction by photons, Nature 444, 187 (2006).
- Roukes et al. [1985] M. L. Roukes, M. R. Freeman, R. S. Germain, R. C. Richardson, and M. B. Ketchen, Hot electrons and energy transport in metals at millikelvin temperatures, Phys. Rev. Lett. 55, 422 (1985).
- Partanen et al. [2016] M. Partanen, K. Y. Tan, J. Govenius, R. E. Lake, M. K. Mäkelä, T. Tanttu, and M. Möttönen, Quantum-limited heat conduction over macroscopic distances, Nature Physics 12, 460 (2016).
- Pekola and Karimi [2021] J. P. Pekola and B. Karimi, Quantum heat transport in condensed matter systems, Reviews of Modern Physics 93, 10.1103/revmodphys.93.041001 (2021).
- Anferov et al. [2024a] A. Anferov, S. P. Harvey, F. Wan, K. H. Lee, J. Simon, and D. I. Schuster, Low-loss millimeter-wave resonators with an improved coupling structure, Superconductor Science and Technology 37, 035013 (2024a).
- Anferov et al. [2024b] A. Anferov, S. P. Harvey, F. Wan, J. Simon, and D. I. Schuster, Superconducting qubits above 20 ghz operating over 200 mk, PRX Quantum 5, 030347 (2024b).