How Consistent Are Humans When Grading Programming Assignments?
Abstract.
Providing consistent summative assessment to students is important, as the grades they are awarded affect their progression through university and future career prospects. While small cohorts are typically assessed by a single assessor, such as the module/class leader, larger cohorts are often assessed by multiple assessors, typically teaching assistants, which increases the risk of inconsistent grading.
To investigate the consistency of human grading of programming assignments, we asked 28 participants to each grade 40 CS1 introductory Java assignments, providing grades and feedback for correctness, code elegance, readability and documentation; the 40 assignments were split into two batches of 20. The 28 participants were divided into seven groups of four (where each group graded the same 40 assignments) to allow us to investigate the consistency of a group of assessors. In the second batch of 20, we duplicated one assignment from the first to analyse the internal consistency of individual assessors.
We measured the inter-rater reliability of the groups using Krippendorf’s – an is recommended to make tentative conclusions based on the rating. Our groups were inconsistent, with an average when grading correctness and an average for code elegance, readability and documentation.
To measure the individual consistency of graders, we measured the distance between the grades they awarded for the duplicated assignment in batch one and batch two. Only one participant of the 22 who didn’t notice that the assignment was a duplicate was awarded the same grade for correctness, code elegance, readability and documentation. The average grade difference was 1.79 for correctness and less than 1.6 for code elegance, readability and documentation.
Our results show that human graders in our study can not agree on the grade to give a piece of student work and are often individually inconsistent, suggesting that the idea of a “gold standard” of human grading might be flawed, and highlights that a shared rubric alone is not enough to ensure consistency.
1. Introduction
As many computer science cohorts are becoming larger (Liao et al., 2017; Lehman et al., 2021; Brodley, 2022), delivering high-quality grades and feedback for student assignments within a timeframe that maximises learning is becoming increasingly difficult (Eicher and Joyner, 2021; Kay, 2022). Promptly providing consistently applied assessment criteria is critical to maintaining student satisfaction (Kane et al., 2008).
Summative grades and formative feedback majorly impact the students’ outcomes throughout and after their degree. During their degree, their grades in the previous year’s courses can determine the students’ progression to the next year. Students’ final degree classification or grades are often factors in their employment prospects outside of education (Stepanova et al., 2021). Having processes to ensure consistent or fair marking is crucial to maintaining the perceived value of summative grades and students’ perceptions of justice(Nesbit and Burton, 2006).
While small cohorts are often assessed by a single assessor, such as the module/class leader, larger cohorts require multiple assessors, typically graduate teaching assistants, to provide grades and meaningful feedback in a short timeframe. These assessors often use a rubric comprising the evaluation criteria, quality definitions, and a scoring strategy (Reddy and Andrade, 2010) to grade and provide meaningful feedback on the students’ work. The rubrics can be written at varying granularities, from generic criteria encompassing the final grades, to individual rubric items allocating individual marks. However, using multiple assessors can lead to issues with how consistently the rubric is applied (Mustapha et al., 2016), especially for subjective elements of an assignment like code quality. Feedback quality can also vary between assessors, especially those who were themselves taught at different institutions or who have gained professional experience. Though rubrics provide a scoring strategy for teaching assistants, many experience uncertainty when assessing, even those who are experienced teaching assistants (Riese, 2018).
Instead of using multiple graders to assess large cohorts, many large programming courses often use automated assessment tools to grade their assignments. While the automated approaches can provide a consistent grade based on provided criteria, such as unit tests, they often introduce other issues. For example, using automated assessment tools that implement tests requires a stringent structure and a well-tested and developed test suite to produce grades accurately (Messer et al., 2024). These test suite approaches often take time to perfect and cannot search for additional marks for students on the grade boundary or grade those that submit uncompilable code. Nor can they grade issues such as code structure or readability.
Neither human grading nor automated assessment tools are infallible. As the grades awarded are of such high importance, many higher education institutions have policies or practices to minimise the impact of mistakes within the assessment. Examples of these policies or practices in our country and our institution specifically include:
-
•
Assessment boards and sub-boards often oversee all aspects of assessment, from the design of the exam or coursework to the marking scheme to the awarded marks.
-
•
Second marking is often used to validate a single marker’s work and can be done blind, without the grades and feedback from the first marker, or they can be provided with the grades and feedback from the first marker.
-
•
Scaling marks, especially if a new exam or coursework has performed significantly lower than previous course iterations.
-
•
Stepped marking is where assessors can only select certain marks steps, such as for a first, 72, 75, or 78 can be selected, limiting issues with students getting final marks at the classification bounds.
-
•
Student appeals is where the students can request a regrade request on coursework if they disagree with a grade or feedback they have been given.
Our study aims to investigate the consistency of human graders when assessing a CS1 programming assignment, including how consistently the rubric is applied between multiple and individual graders, by answering the following research questions:
-
RQ1
How consistently does a group of typical graders apply a grading rubric? Specifically, what is the inter-rater agreement of multiple assessors grading the same submissions?
-
RQ2
Are individual graders consistent at applying a grading rubric? Specifically, do they provide the same marks for the same work when marked a second time?
These questions will have implications for CS1 courses: how consistent is the grading on large courses with multiple markers; how consistent are single graders (relevant to small courses); and how consistent is human grading in general, given that many course leaders will contemplate the use of automated or AI-driven grading?
We pre-registered our study on the Open Science Foundation before conducting the study (\anonMesser, Marcus and Brown, Neil and Kölling, Michael and Shi, Miaojing, 2024). Section 2 discusses existing work on consistency of grading practices and grading with groups of assessors. Section 3 introduces our data collection and analysis methodology. Section 4 presents the results from our pilot study and our full study, and Section 5 discusses our results and answers our research questions. We describe threats to validity in section 6 and conclude our results and discussion in Section 7. Our contributions in this paper include:
-
•
A new “\anonMenagerie” dataset: a publicly available graded dataset of students’ assignments, available to the research community, and suitable as a data source for further studies concerning grading accuracy and consistency.
-
•
An in-depth analysis of the consistency of awarded grades when utilising multiple graders.
-
•
A comprehensive investigation into the awarded grades for individual graders when marked the same assessment a second time.
2. Related Work
2.1. Consistency in Grading
Applying assessment criteria consistently with detailed feedback is a key factor in student satisfaction (Kane et al., 2008). However, evaluating the consistency of grading and feedback is not often researched. Migut and Wiersma (2020) presented a poster showing their preliminary study on whether grading an online exam matches traditional paper grading and found a small but significant difference between online and paper grading. Borela and Roy (2023) also presented a poster showing the outcome of a workshop to train TAs with a rubric, which showed a reduction in grade variance after the workshop.
Both Ahoniemi et al. (2008) and Auvinen (2011) developed rubric-based grading tools to improve grading consistency when grading large classes. Auvinen’s tool, Rubyric, provides an interface for instructors to create rubrics and add feedback phrases. They conducted user satisfaction surveys and found that the six undergraduate teaching assistants who graded the assignments thought that Rubyric made them more consistent. Students tended to agree that the feedback was useful and detailed (Auvinen, 2011). Similarly, Ahoniemi et al. developed a tool called ALOHA, which allows instructors to construct a rubric and add feedback phrases for common mistakes. They conducted both an instructor survey and a statistical evaluation of the tool. The survey found that the instructors found the semi-automated feedback phrasing particularly useful. The statistical analysis, which compared grades when graded with a paper rubric and those graded with the tool, found that those using the tool had no significant difference between the graders, and when grading without the tool, had a significant difference between the grades given by the most lenient grader and two stricter graders.
Evaluating the consistency of assessment has been conducted in numerous other disciplines. Bloxham et al. (2016) took a multidisciplinary approach and investigated 24 assessors from various disciplines: psychology, nursing, chemistry and history. Each assessor was given five assignments to grade, each on a typical task for their discipline. They used Kelly’s repository grid exercise (Fransella et al., 2004) to elicit constructs and grades by first comparing combinations of three assignments, stating which two are the same and how one is different, and applying a score between 1-5 for these constructs. This study aimed to determine the consistency of the individual constructs, and they found no consistency in the rankings of constructs within any of the subjects.
Within medical education, Dunbar (2018) evaluated the consistency of nursing assessment. They ran a study asking seven educators to assess a reenacted physical examination in person and a recording of the same examination a month later. They found that the grading in person and the recording had an inter-rater agreement of approximately 84% between the participants, with the inter-rater measurement calculated by percentage agreement. McManus et al. (2006) explored the variance of examiner leniency and stringency within clinical examination. They used three years of exam grades, approximately 10,000 candidates, each graded by two examiners, and applied the Rasch model, a latent trait model used to determine the probability of a person succeeding on an item (Wright, 1977). Their results suggest that greater examiner stringency was associated with greater examiner experience.
Henderson et al. (2004) examined the grading practices of 30 assessors when grading exams. The participants, who were from multiple institutions, were provided with five answers to an introductory calculus exam, with two answers being of interest for investigating the conflict between valuing reasoning and correctness. Overall, the scoring of these two solutions differed significantly among individual instructors, with 12 instructors awarding higher grades for one solution than the other, 13 awarding lower grades, and 5 awarding equal grades for both submissions.
Hicks and Diefes-Dux (2017) examined the consistency of teaching assistants when grading a first-year engineering course’s engineering MATLAB assignments. The course was split into 15 sections, with five undergraduate and one graduate teaching assistant, where the undergraduate teaching assistants graded the homework assignments while supervised by the graduate teaching assistant. The undergraduate teaching assistants were asked to grade against a rubric, with most criteria having four achievement levels: no evidence, under-achieved, partially achieved and fully achieved. As a baseline grade, the course leader graded 172 submissions. The authors utilised percentage agreement, Cohen’s kappa and Krippendorff’s alpha to measure the consensus and consistency between the course leader and the undergraduate teaching assistants. They found that the course leaders and undergraduate teaching assistants had an agreement of 49.4% and that all metrics indicated that the undergraduate teaching assistants were applying the same interpretations of the rubrics that the course leaders intended.
Passonneau et al. (2023) as part of their investigation into whether analytic grading rubrics, which have more specifics than the rubrics provided to the students to define expectations, produce reliable assessments, they analyse the inter-rater reliability of four undergraduate teaching assistants when grading physics lab reports. They found that grades administered by the teaching assistants did not correlate to posthoc assessments from trained raters, identified missed learning opportunities for students and that instructors were misled about student progress.
While investigating the consistency of the grading process is conducted within other domains, from the best of our knowledge, this research is rarely conducted within computer science education. Multiple and individual graders consistently applying a grading rubric is critical in providing a fair and meaningful assessment of students’ work. In turn, it improves a student’s learning and overall satisfaction with the course.
2.2. Teaching Assistants and Assessment
Teaching assistants are often crucial in supporting students’ learning; they typically consist of undergraduate, master’s and PhD students (Riese et al., 2021).
The three most common duties for teaching assistants include assisting in programming labs, leading sections to reinforce concepts, and grading; many institutions utilise undergraduate and graduate teaching assistants (Mirza et al., 2019).
Mirza et al. (2019) conducted a systematic literature review into how undergraduate teaching assistants (UTAs) are used within computer science courses and found that UTAs often grade assignments, whether they provide the final grades for the assignment, assign coarse primary grades or are one of multiple UTAs to grade each student assignment.
Riese et al. (2021) explored the challenges faced by teaching assistants in computer science education across Europe. At all the institutions involved in their analysis, teaching assistants were involved in assessment in some form, whether that be assigning points or pass/fail grades. They found that teaching assistants often faced challenges when assessing student work, including understanding the assessment criteria, providing meaningful feedback and failing students.
2.3. Educational Datasets
For our study, we required a dataset of student submissions for the grader participants to grade. While several datasets of students’ programming assignments exist, many are not publicly accessible (Messer et al., 2024), consist of small-scale programs (de Freitas et al., 2023; Azcona and Smeaton, 2020) or do not capture contextual details (Brown et al., 2014).
Some project-scale datasets exist, such as the Scratch website scenarios111Scratch Scenarios: https://scratch.mit.edu/ideas or the Blackbox dataset (Brown et al., 2014) that are public or available on request. However, they have the disadvantage that the context of the users is unknown (they may be students at any stage of education or not even students at all), and the aim of their project is unknown, preventing judgment against any criteria for progress or success.
In smaller-scale datasets, including FalconCode (de Freitas et al., 2023), Hour of Code222Hour Of Code: https://code.org/research, Dublin City University’s Programming Submission Dataset (Azcona and Smeaton, 2020), and online judge tools, such as HackerRank333HackerRank: https://www.hackerrank.com/, the task is known. However, all of these datasets are closed-ended and focus on small-scale tasks, including highly structured template code, specific names of classes and functions defined in the requirements, or simple one-function tasks, such as FizzBuzz or the Rainfall Problem (Soloway, 1986). Therefore, we would not be able to evaluate the graders consistently when evaluating aspects of code quality, as many of the students’ decisions regarding code design are already made for them, and many of these datasets use documentation to explain the task.
To the best of our knowledge, no large project-scale publicly available datasets exist. Therefore, we developed our dataset, \anonMenagerie. It consists of real CS1 Java programming submissions for a simulation-based assignment and the associated grades and feedback that arose during this study; more details can be found in Section 3.1.
3. Methodology
3.1. The \anonMenagerie Dataset
As discussed in Section 2, most publicly available programming datasets do not contain detailed grading or feedback data. If they contain grades, they are often limited to whether the program passes or fails a set of automated tests, as most automated assessment tools utilise unit testing to assess the submissions (Messer et al., 2024). As such, we developed our own publicly available programming dataset containing human graders’ assessments.
We introduce the \anonMenagerie dataset, which comprises 667 real student submissions for \anonKing’s College London’s second semester CS1 Introduction to Programming Java course and is available publicly, see Section 8. The same assignment was given to students between 2017 and 2021 inclusive, with minor changes each year. The changes each year included updating the assignment instructions to clarify points of misunderstanding from the previous years’ assignments, with the tasks and the provided template code remaining the same year on year.
The dataset consists of the following:
-
•
The assignment requirements and grading rubric.
-
•
The project’s starter code.
-
•
The students’ Java files.
-
•
Grades and associated feedback for 272 submissions (produced by the current study).
The dataset does not include the students’ original awarded grades, as we did not receive ethical approval to release them publicly. However, as part of the current study, we asked seven groups of four to grade and give feedback on 40 submissions per group. We produced grades and feedback for 272 submissions; seven assignments were duplicated to evaluate grader self-consistency. Details about the grades and feedback can be found in Section 3.2.
We have received ethical approval from our institution444Ethics review reference: LRS/DP-22/23-35578 to conduct this study and publicly release the summary of the grader demographics and the individual grades and feedback from each grader.
3.1.1. Assignment Outline
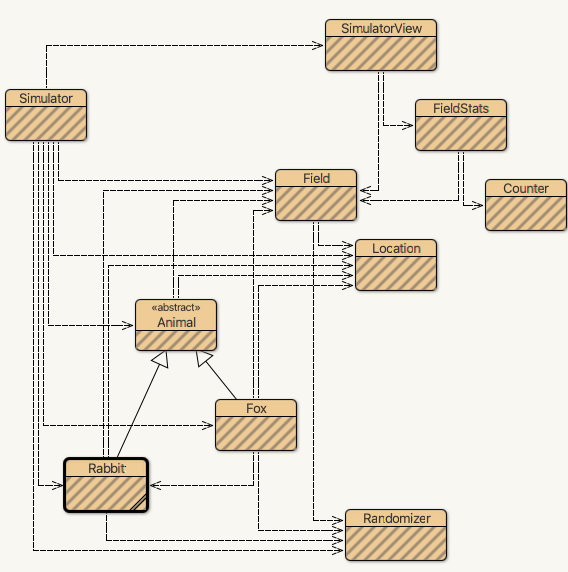
The assignment was a small-group, open-ended paired programming assignment to utilise object-oriented programming concepts to develop a predator/prey simulator with groups of two or three. The students were provided with a template project based on the “foxes-and-rabbit” project from the sixth edition of Barnes and Kölling (2006)’s book on “Objects First with Java”. The template includes a graphical user interface (GUI), a Field class, which contains a two-dimensional array for the simulation environment, and two animals, a Fox and a Rabbit; Figure 1 shows the class diagram of the template code. Students were asked to extend the template code with the following base tasks:
-
•
The simulation should have at least five species, with at least two being predators and at least two not being predators.
-
•
At least two predators should compete for the same food source.
-
•
Some or all species should distinguish between male and female animals and only propagate when male and female species are in a neighbouring cell of the two-dimensional array.
-
•
The simulation should keep track of the time of the day, and some species should exhibit different behaviours at some time of the day.
After completing the base tasks, the students were asked to implement one or more challenge tasks. The students could choose to invent their own tasks or to use one or more of the following suggestions:
-
•
Simulate the lifecycle of plants, including growth and being a food source for at least one animal.
-
•
Simulate changing weather states and how they affect other simulation aspects.
-
•
Simulate disease within the species, including the spread of the disease.
During the assignment, students could choose which species they implemented, how those interacted with other species, and how their implementation completed the provided tasks. These opportunities to decide what they implemented allowed students to apply their creativity, choose how they designed their code, implement object-oriented principles, and name classes and functions. The ability of the students to design their solution to a problem and the open-ended nature of the assignment allows instructors to assess a wider variety of skills than they typically could in a close-ended small-scale assignment like the Rainfall problem (Soloway, 1986; Fisler, 2014). In this assignment, the students were assessed on the correctness of the implementation, how elegantly they implemented the solution, the overall readability of the source code, and how well they documented their code. A detailed example submission and the details on the data processing pipeline for cleaning the dataset can be found in Appendix A.
3.1.2. Dataset Limitations
The students were asked to submit a report discussing their implementation as part of the assignments. However, we have excluded these from the dataset, and they were not used to grade the assignments, as they can not be suitably anonymised for public release. While we automated the de-duplication of the group submissions and removed further duplicate submissions during the anonymisation, there is a remote chance that some repeated assignments within the dataset could still exist.
The students were asked to conduct pair programming with explicit instructions on how to pair program. One student was the “driver”, who wrote the code, and the other was the “navigator”, who reviewed the code as it was written, and they were instructed to switch roles throughout the assignment. However, the assessment did not capture if and how the students conducted pair programming. Anecdotally, some groups started pair programming, especially in the associated lab sessions. However, as the submission deadline approached, groups tended to separate the work, with both students writing code in parallel.
As these are historical assignments that we received post hoc permission to release, the students’ demographics were not captured. However, all students were in their first year at \anonKing’s College London and were a mixture of domestic and international students.
3.2. Grading
The graders graded the submissions from the \anonMenagerie dataset, a set of 667 CS1 open-ended assignments, and used the rubric from the course as guidelines on how to assign grades. We chose to use the rubric from the original course, as the students who took the course were supplied with the rubric at the start of the assignment. Graders were asked to grade the key programming skills: correctness, code elegance, readability and documentation. We asked the graders to supply feedback and letter grades between A and F, with ‘+’ and ‘-’ grades for all letters; for exceptional submissions, graders could award A++. The rubric provided an overview of what a submission must include or not include for each grade but did not provide individual points and associated grades. The grades and feedback were captured using Gradescope (Singh et al., 2017), a commercial grading platform designed for STEM assignments, including programming assessments, and allows for rubrics to be uploaded and for graders to provide line-level or overall feedback.
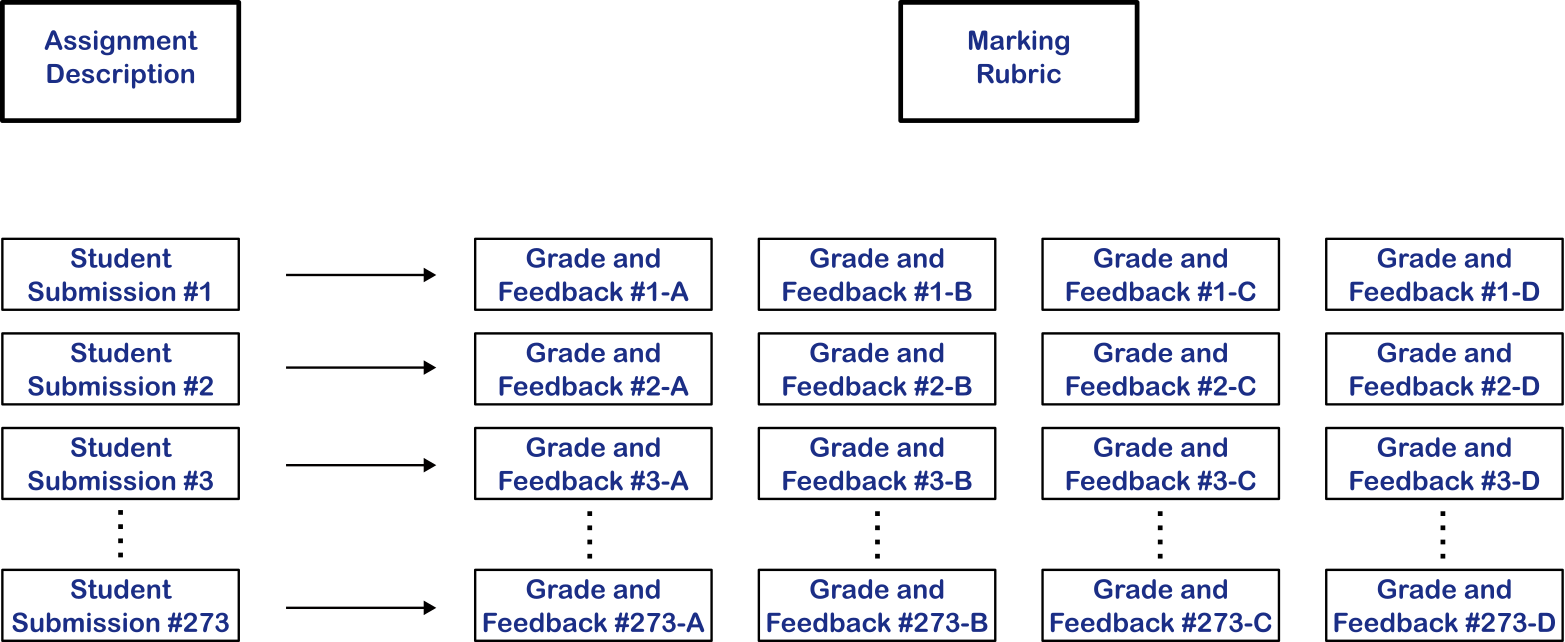
To explore the consistency between graders, each assignment was graded four times, each time by a different grader. Figure 2 shows an example of what the data includes after the grading is complete. Grading each assignment multiple times by different graders allowed us to investigate how consistently a group of graders apply the grading rubric to individual assignments. To investigate self-consistency, we made graders grade a few assignments multiple times, spaced apart.
To aid in the research into self-consistency and the study pacing, we supplied the graders with batches of submissions, allowing us to repeat a few chosen submissions for the graders to regrade, resulting in some submissions being graded eight times. We chose to repeat assignments representative of the dataset, specifically assignments of the median size, a common theme, and submissions that fall near the mean of the grades awarded within the previous batch. The original assignment for \anonMenagerie was a pair-programming assignment, which was de-duplicated; however, duplicates could still exist and we told our graders this as a cover story for why they might see multiple similar assignments. The possibility of duplicates, specifically choosing assignments and the time between batches, helped mitigate the likelihood of the graders noticing that they were grading the same assignment (which might have led to the graders going back to the first grading attempt and copying and pasting their grades instead of grading it fresh a second time).
In addition to collecting grades and feedback, we asked the graders to complete a diary each time they completed a grading session. The diary included where and when they graded, how long they graded, how many assignments they graded, and how rushed they felt to complete the grading that day. After completing the study, we invited the participants to complete a semi-structured interview, where we discussed their grading experience. Our prompt questions for the interview include:
-
(1)
Can you tell me about your experience grading these assignments?
-
(2)
Can you tell me about your grading process?
-
(3)
How well do you think the rubric aided you when grading the assignment?
-
(4)
Did you review your grades to validate your consistency?
-
(5)
How do you think the environment you were in while grading affected your grading?
-
(6)
How do you think the mood you were in while grading affected your grading?
-
(7)
How do you think the time of day you graded per session affected your grading?
-
(8)
Were there any specific submissions that stuck in your mind?
-
(9)
Did you notice any duplicates or near-duplicates in the data?
-
(10)
Do you have any further comments on your experience?
3.3. Analysis
To investigate how consistently a group of graders apply a grading rubric (RQ1), we used Krippendorff’s alpha (implemented using the Fast Krippendorff library (Castro, 2017)) to assess the reliability of agreement between the graders on the awarded grades. Krippendorff’s alpha is a generalised measure allowing any number of raters and categories while allowing for missing data (Krippendorff, 2013). It also has several weightings that can be applied to different types of data, including ordinal, which is data that is both categorical and has an order, such as letter grades. While the number of grades per assignment was fixed after participant recruitment, each assignment was only graded by four of the graders rather than all graders, making Krippendorff’s alpha the ideal measure. We evaluated the individual graders’ consistency using repeated assignments by validating the distance between the grades they awarded. This varies from our pre-registration, as our original choice of metric (Fliess’ Kappa) required a complete set of grades and did not consider the ordinal nature of grading.
To provide further context for how the graders undertook their grading, we analysed and produced summary statistics from the data provided by the grading diary, including when and where they conducted their grading, how long they graded, and how rushed they felt to complete the grading by the deadline. Additionally, we coded our semi-structured interview transcripts, which were automatically generated by Microsoft Teams and then validated by the authors.
3.4. Pilot Study
To validate our data collection process, we conducted a pilot study with two assessors: one who was a final-year computer science PhD student with numerous years of grading this specific assignment and a first-year computer science PhD student with one year of grading experience and had previously completed this assignment as an undergraduate. They were provided the pre-study survey, asked to grade two batches of twenty assignments each, and given two weeks to complete each batch, with a two-week break. After grading, both participants were asked to attend the post-study semi-structured interview, which we expanded for the pilot study to ask for any improvements that could be made for the full study.
The participants completed the grading within the supplied time frame and found Gradescope helpful when grading. However, they both struggled to remember to complete the grading diary and requested more information about the assignment to be supplied.
For the full study, we provided detailed instructions on using Gradescope, a brief overview of what the students had learned before submitting the assignment, the coursework specification, rubric, and template code. We added a link to this information and the diary to each submission in Gradescope, so that participants were automatically reminded at the end of grading each submission.
4. Results
Our results section first explores the grader participant demographics, diary and interview results, which provides context for the analysis of the consistency of a group of graders before finally analysing the consistency of individual graders.
4.1. Participant Demographics
We conducted a pre-study survey to identify suitable grader participants and collect demographic data. We selected 28 participants to complete the grading.
Figure 3 shows the overall demographics of our participants. Most of our participants identified as male, with only five identifying as female, which follows a similar distribution of students enrolled in the computer science courses at our institution. We sought participants undertaking a PhD or Masters or who were in their final undergraduate year, with most participants being Masters students. Many of our participants studied or are studying their undergraduate at institutions in our country. While they may not have grading experience, they are well-versed in how grading is conducted at the university level in our country from the student perspective. These are a relatively typical profile of those recruited to act as graders at our institution, and as described in subsection 2.2, typical of graders at many other institutions as well.
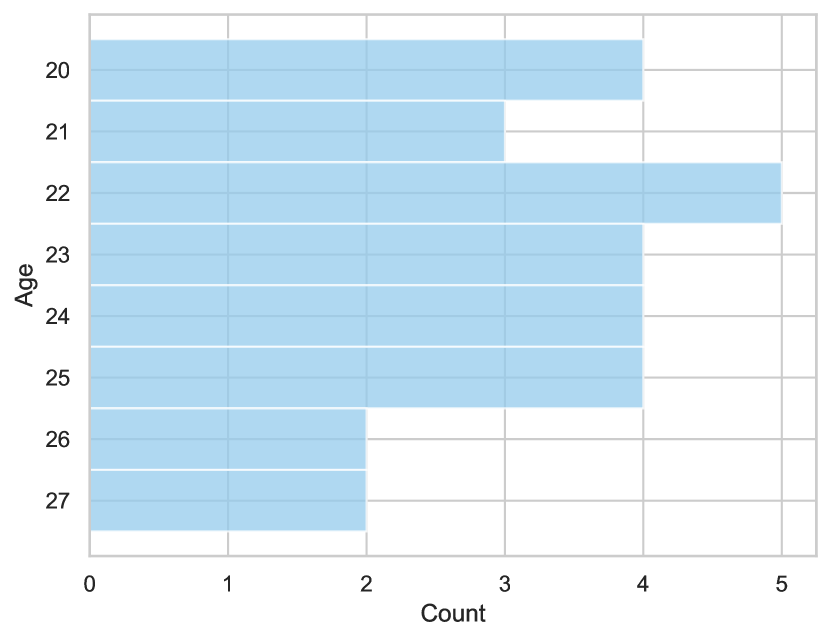
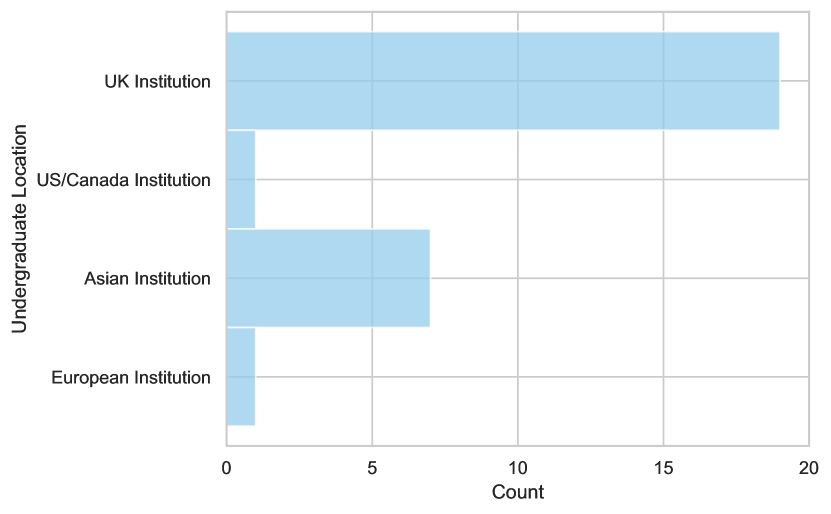
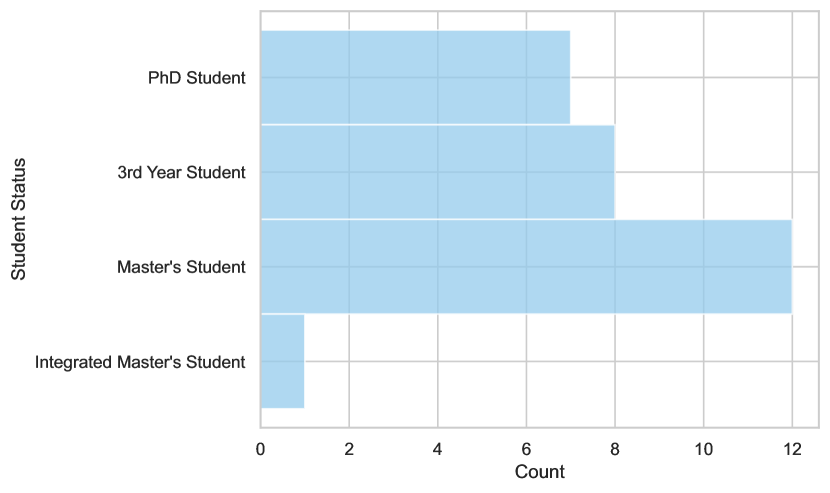
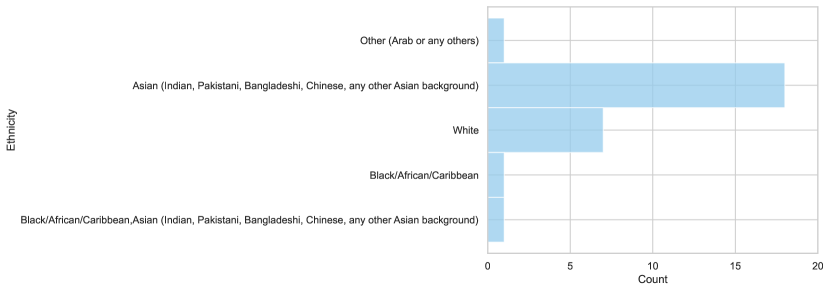
Figure 4 shows how long our participants have been grading, if they have had previous grading experience, and how often they graded per academic year. Though most of our participants have never done grading before, all are experienced programmers, with only two participants programming for less than five years and all having some knowledge of Java. Figure 5 shows the time our participants have been programming and which languages they deem themselves proficient.
All participants received a participant expense payment congruent with hourly grading rates at our institution.
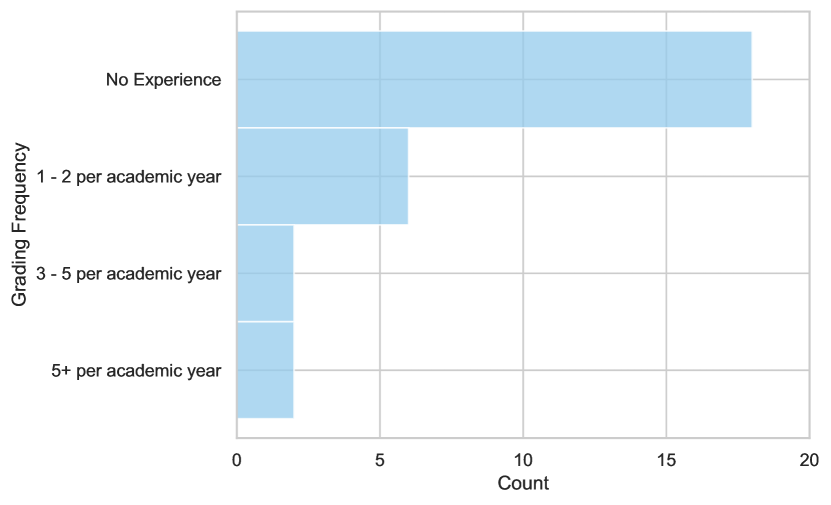
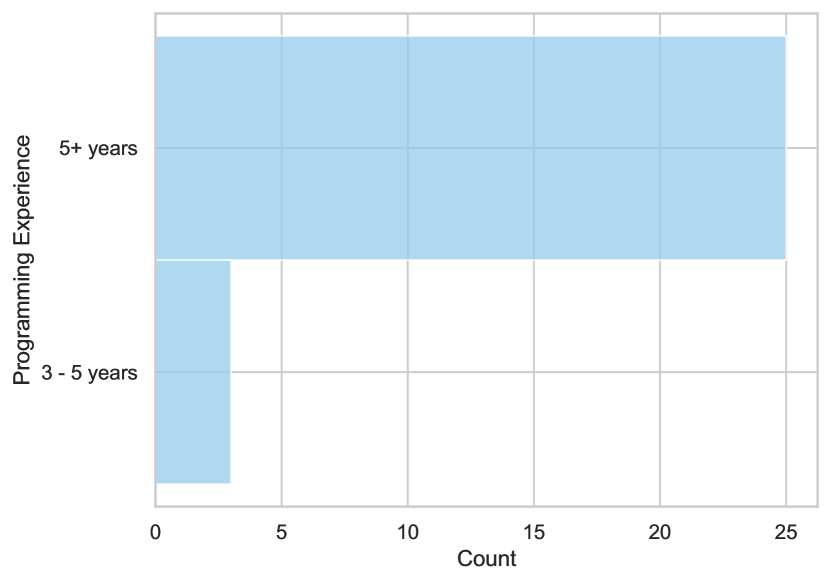
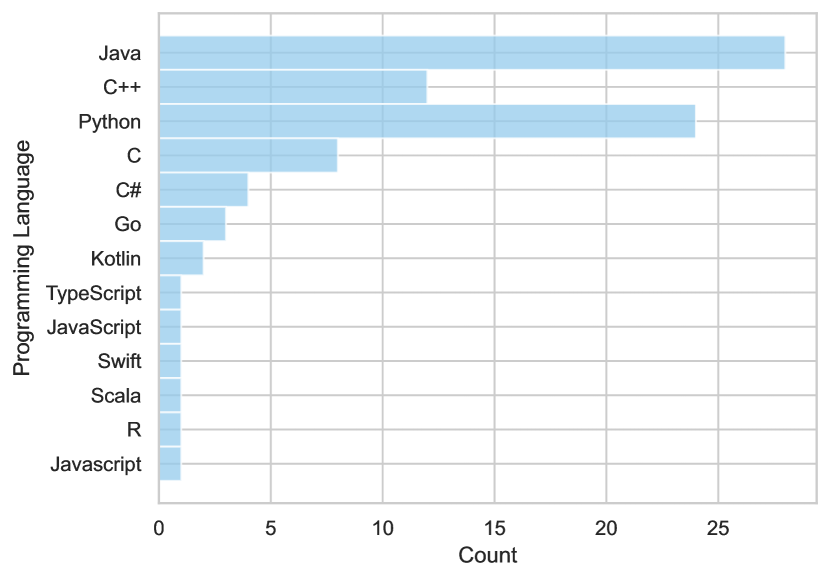
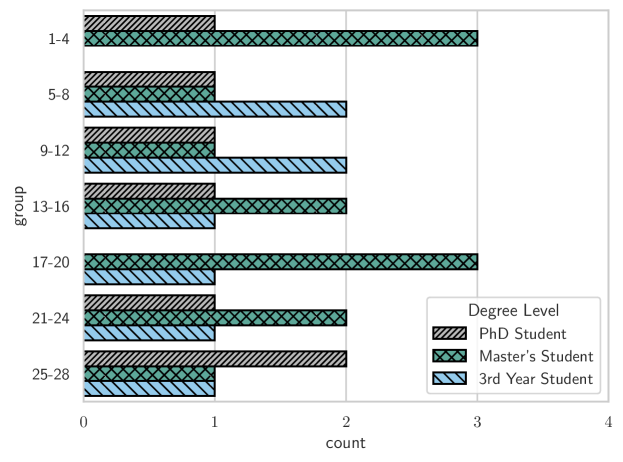
Figure 6 shows the degree level composition for each group of four. Nearly every group contained one or more PhD students, over half the groups contained two or more master’s students, and most groups and one or two third-year students.
4.2. Diary Results
In this section, we discuss the results of the grading diary, including how often the participants graded, how many assignments they graded per session, and details about the environment and time of day they graded.
Figure 12 shows a box plot of the number of diary entries per participant. Some participants opted to grade in two sessions, while others graded over 14, with the average grading over 6 sessions.
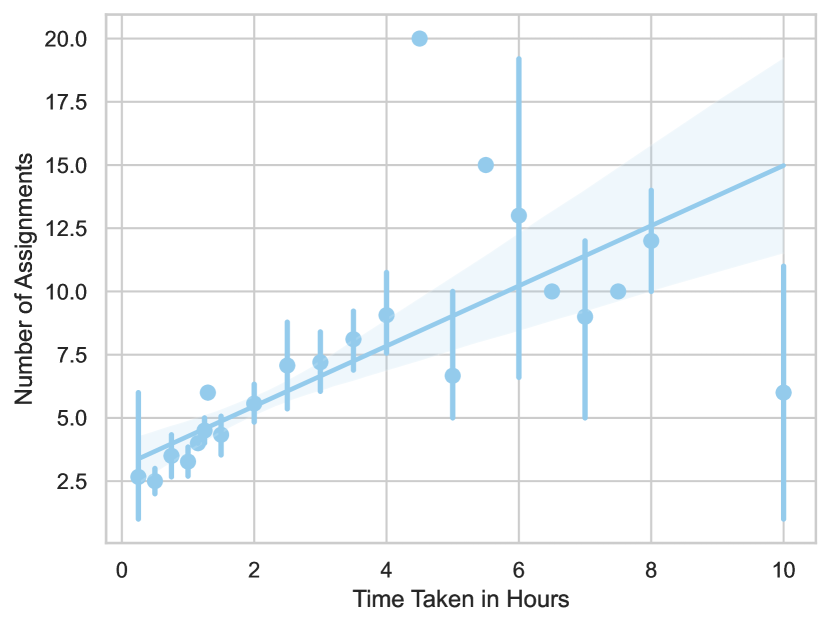
Figure 12 shows the relationship between the number of assignments graded in a session and the number of hours spent grading and shows that more time spent grading correlates to the number of assignments graded. However, a few graders do not follow this trend. Some graders take less time to grade many assignments, and one grader takes much longer to grade 6 assignments.
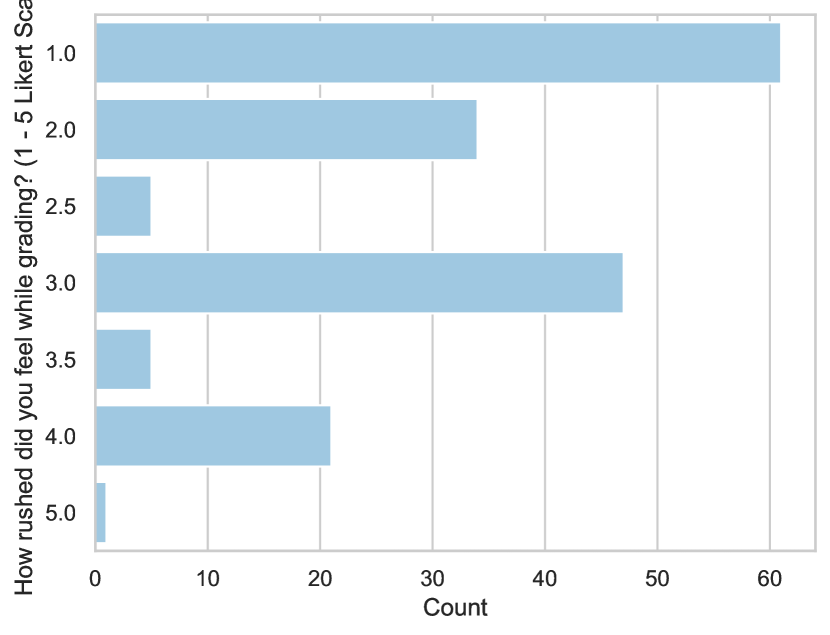
As part of the diary, we asked participants how rushed they felt to complete the grading, the results of which are in Figure 12. Most graders did not feel rushed to complete the grading, even with a two-week deadline to complete the grading and other external factors such as coursework deadlines and work.
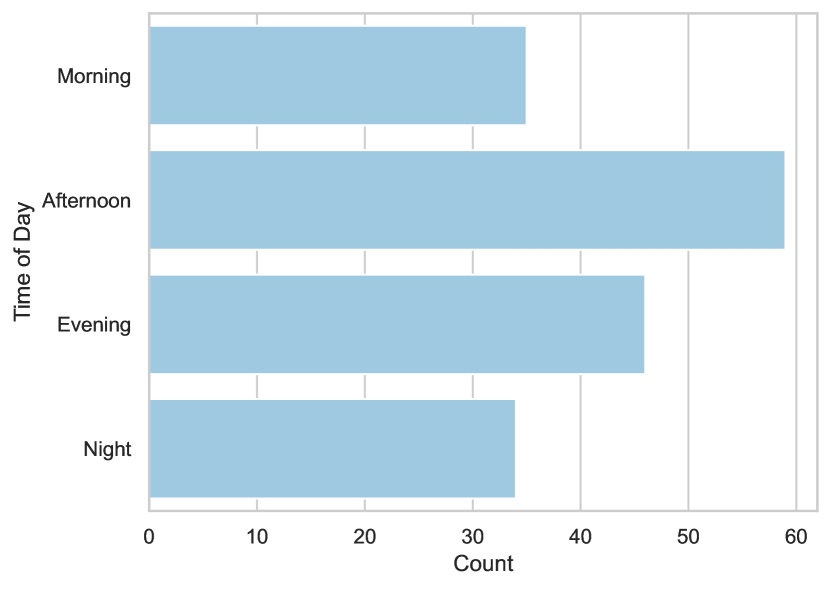
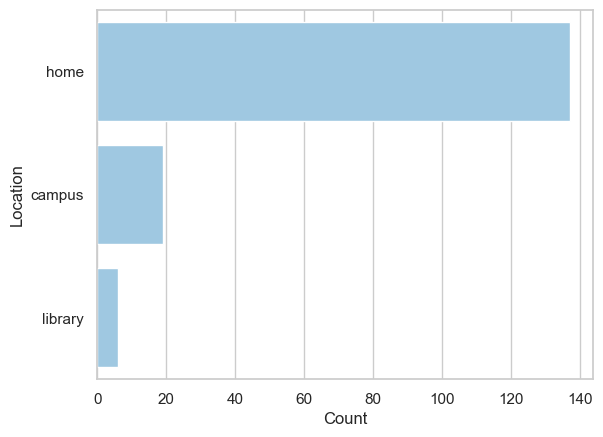
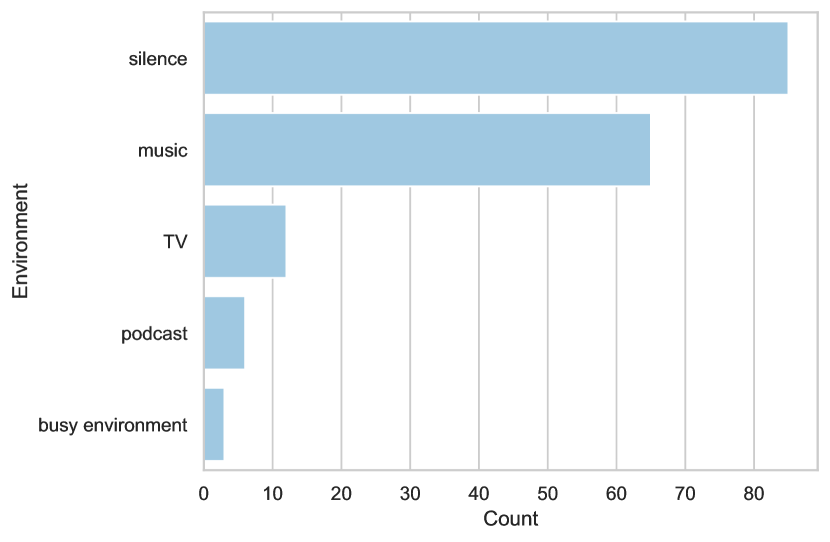
Figures 12, 12, and 12 show the results of when, where and the environmental factors, respectively. Most grading sessions occurred at home in the evening while sitting silently or listening to music. While most grading was conducted in the evening, many sessions were conducted at other times of the day, with the number of sessions in morning (35) and night (34) nearly identical.

4.3. Interview Results
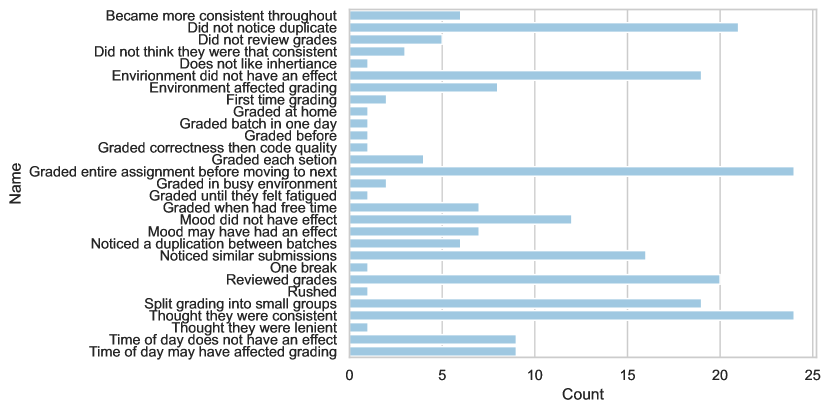
We extracted key terms from our end-of-study semi-supervised interviews with our participants; Figure 13 shows the results. Most participants split each batch of twenty assignments into smaller groups (3 - 5 assignments) and graded each of the four elements before moving to the next assignment. Few opted to split the batch into larger groups (10+ assignments), and some graded each element before moving on to the next.
Nearly all of our participants thought they consistently applied the rubric throughout both batches, while some thought they became more consistent over time. While not specifically instructed to, many participants opted to review the grades they awarded at the end of the batch or their session.
As part of our study investigating the participants’ individual consistency, we duplicated a single assignment between the first and second batches. This duplicate assignment was assigned a different assignment number and selected based on the batch’s median grade. During our interview, we asked participants if they noticed any duplicated assignments. Excluding those submissions that submitted the template code, six participants (1, 2, 10, 11, 20, 25) reported noticing the duplicates; 22 participants did not see that they were regrading a repeated assignment. One who noticed the duplicate opted to revise the grades in both batches to F because they believed it was plagiarism.
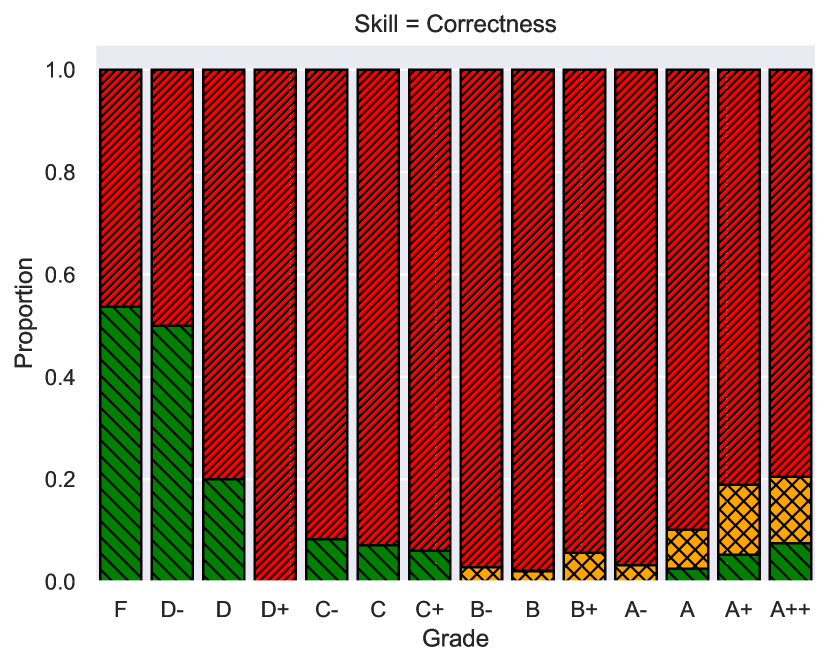
4.4. Grade Overview
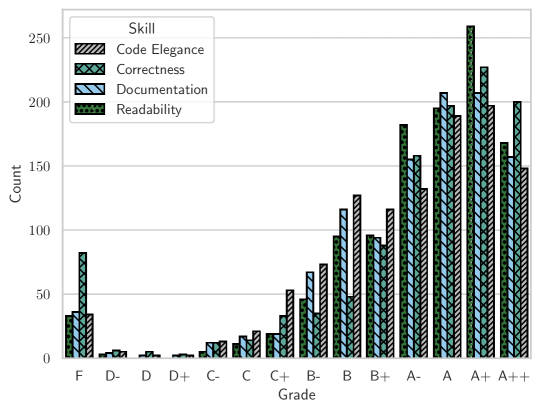
Figure 14 shows the grade distribution for each skill. Most assignments achieved high grades, with approximately 10% achieving below a B-. Those graded F for correctness include assignments that failed to compile. Some participants failed to select a grade for certain skills within certain submissions; these have been omitted from our results. While there is not a lot of variance in the data, anecdotally this is a similar distribution of grades that we saw while conducting the original summative grading.
4.5. Grading Consistency of Multiple Graders (RQ1)
Each batch of 20 assignments was graded by a group of four graders. We discuss our inter-rater reliability results, using Krippendorff’s Alpha () for each group of four graders and each skill, the spread of the awarded grades, and the reliability of individual grades.
Krippendorff’s is a percent chance-based reliability coefficient, similar to Cohen’s and Fleiss’ , and evaluates the deviation from perfect reliability by the proportion of observed to expected disagreement (Krippendorff, 2013).
We opted to use the ordinal metric within Krippendorf’s , as letter grades are inherently ordinal; they are categorical and have an order. The ordinal metric applies weights to the calculation by utilising the ordinal difference between ranks (Krippendorff, 2013).
When using Krippendforf’s alpha, if the raters completely agree, ; if there is no agreement, then . Krippendorf also suggests that is acceptable and are only for drawing tentative conclusions (Krippendorff, 2013).
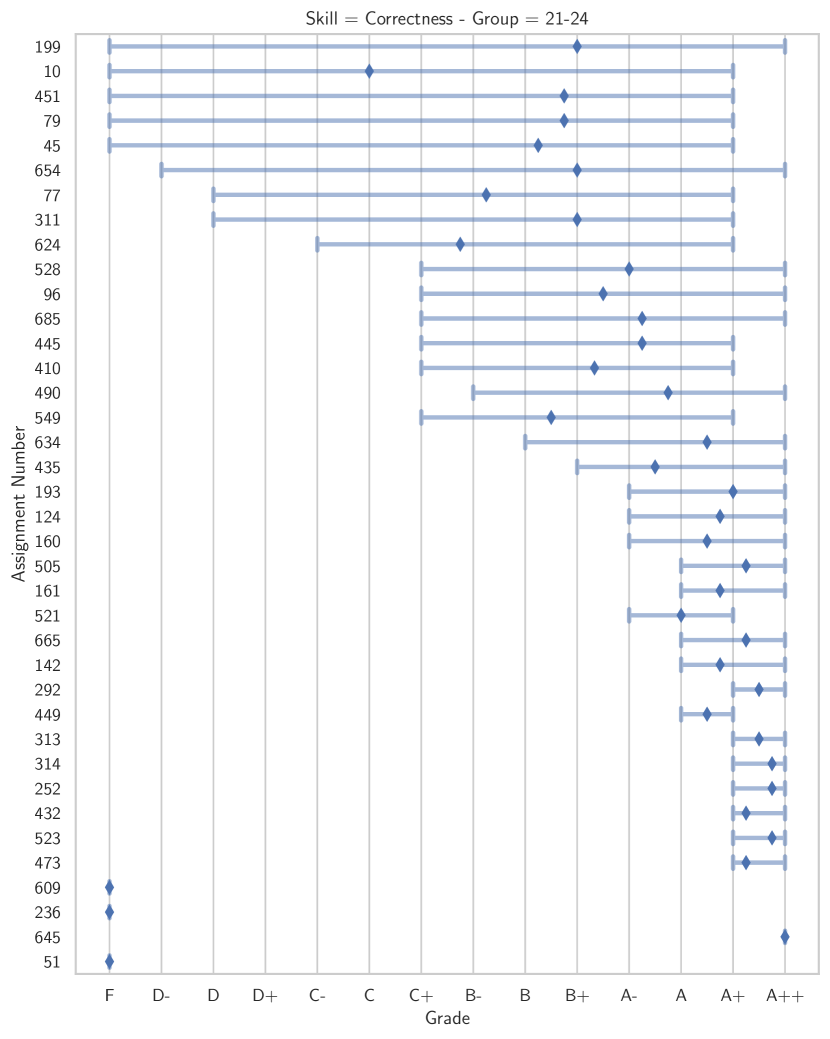
Due to an accidental duplicate when setting up the second batch, participants 21-24 graded assignment 105 twice, these grades have been omited from our results.
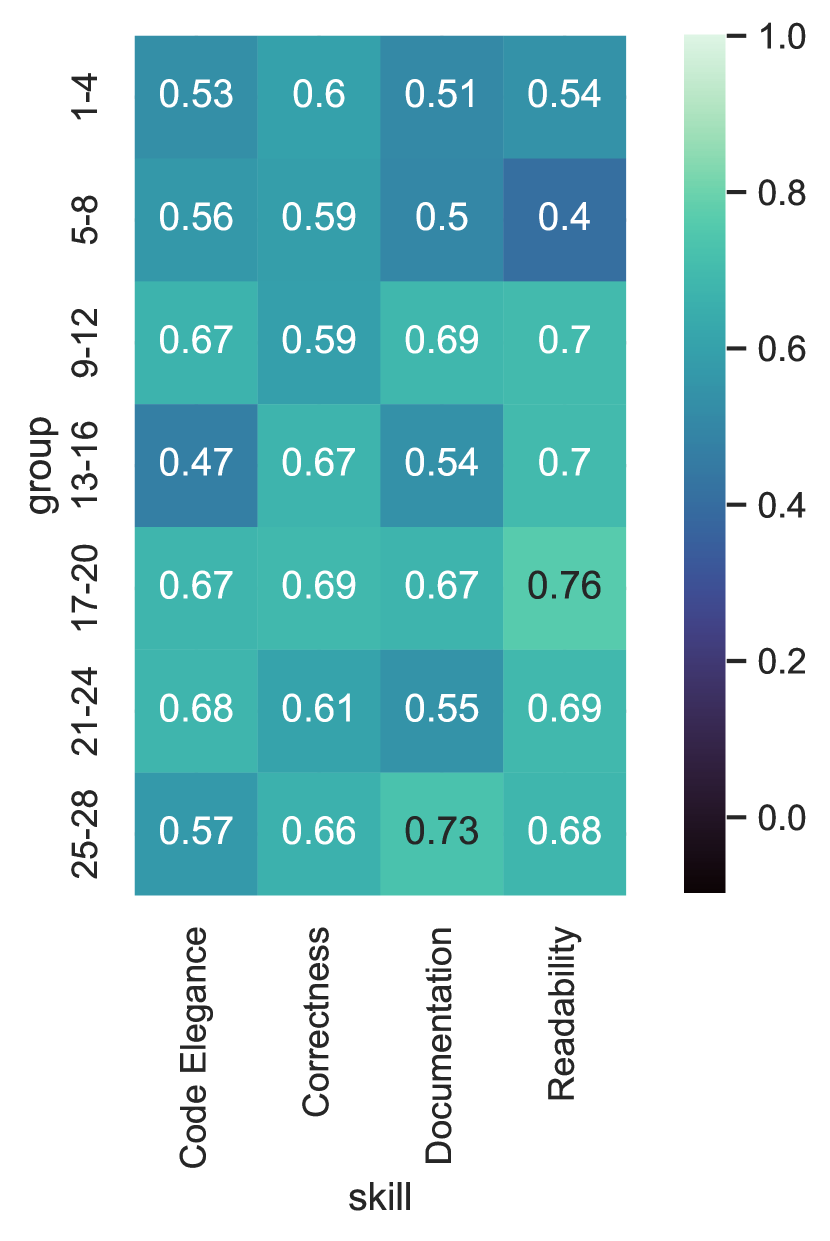
Figure 16 shows the for each of the seven groups and each skill. These results show that in our study, consistency was low, but were slightly more likely to agree on the grades for correctness and code elegance but did not agree on the grades for readability or documentation, with the average being 0.220210, 0.098628, 0.045598, and 0.054779, respectively.
Many percent chance agreement-based coefficients, including Krippendorf’s and Fleiss’ , underestimate the agreement when one of the labels is dominant (Gwet, 2008; Doughty et al., 2024; Wongpakaran et al., 2013). As such, we compute Gwet’s , which is a weighted variant to Gwet’s , which was designed to be robust in the high prevalence of a single class (Gwet, 2008). Gwet’s is more robust in instances of high prevalence, as it removes from consideration all agreements that occurred by chance (Gwet, 2008).
Figure 16 shows the results of Gwet’s . Following the same bounds defined by Krippendorf, no groups achieve acceptable agreement () for any of the skills evaluated. However, some groups show partial agreement with for specific skills, though on average, no skill had an , with the average for correctness being 0.628587, for code elegance being 0.592377, for readability being 0.638274 and for documentation being 0.596593.
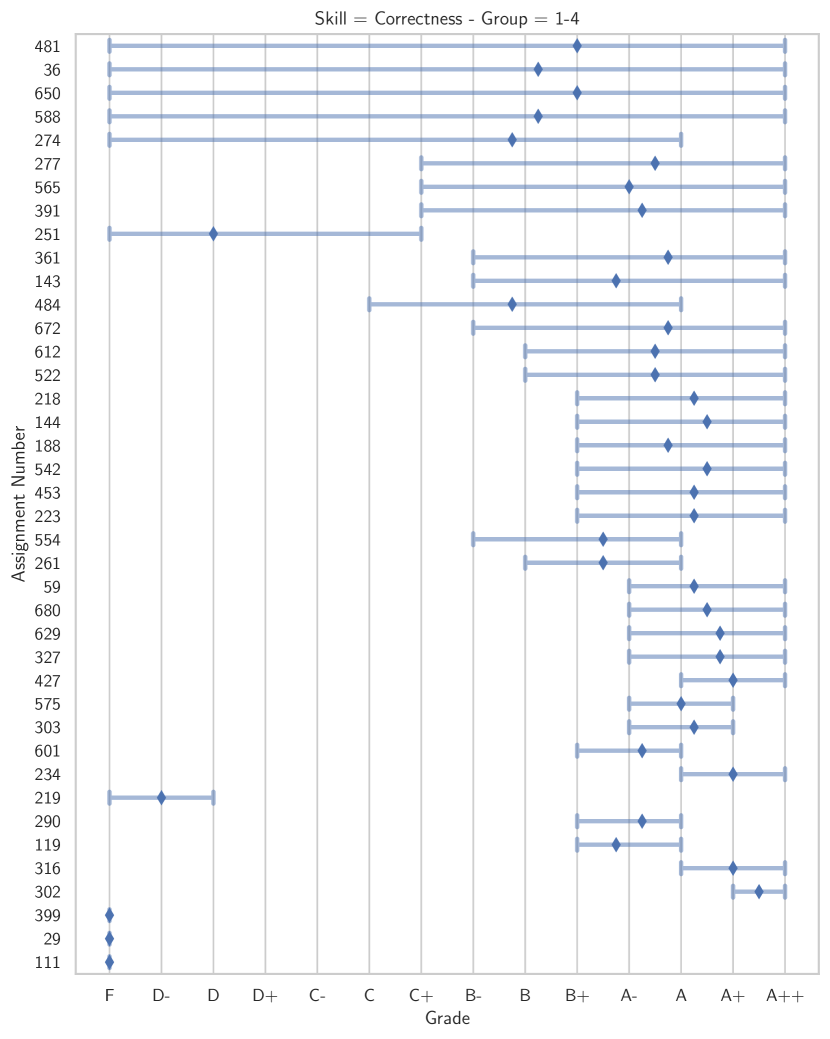
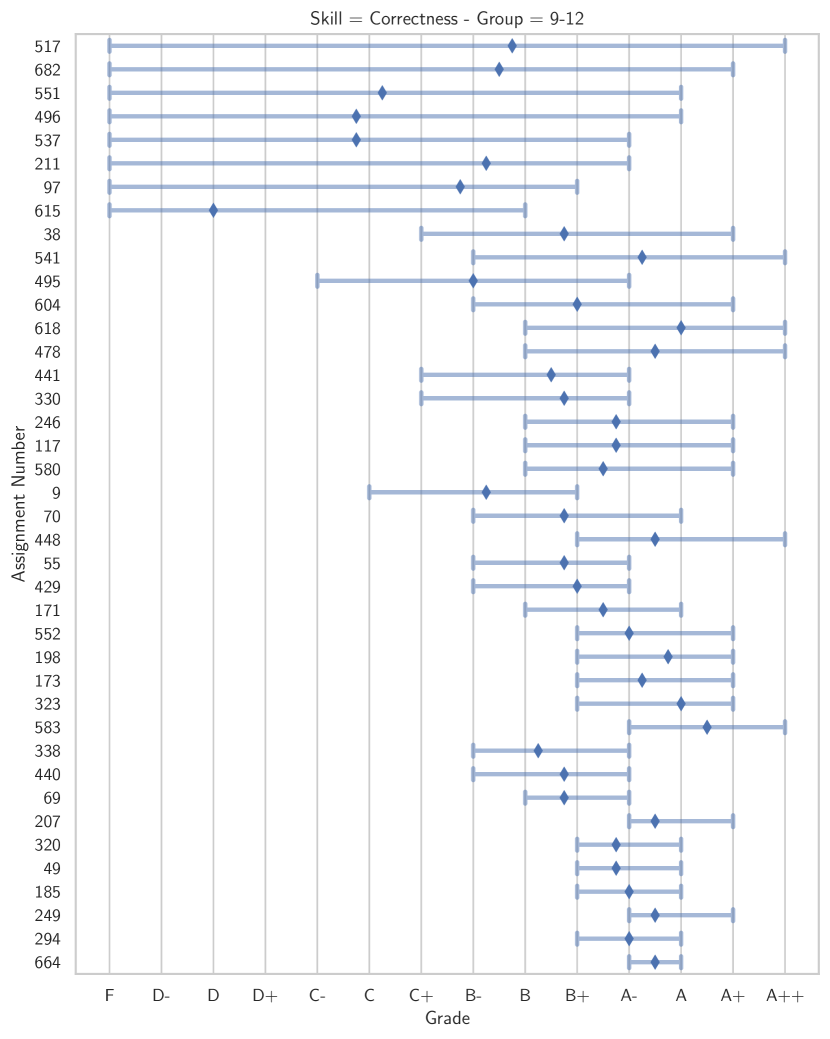
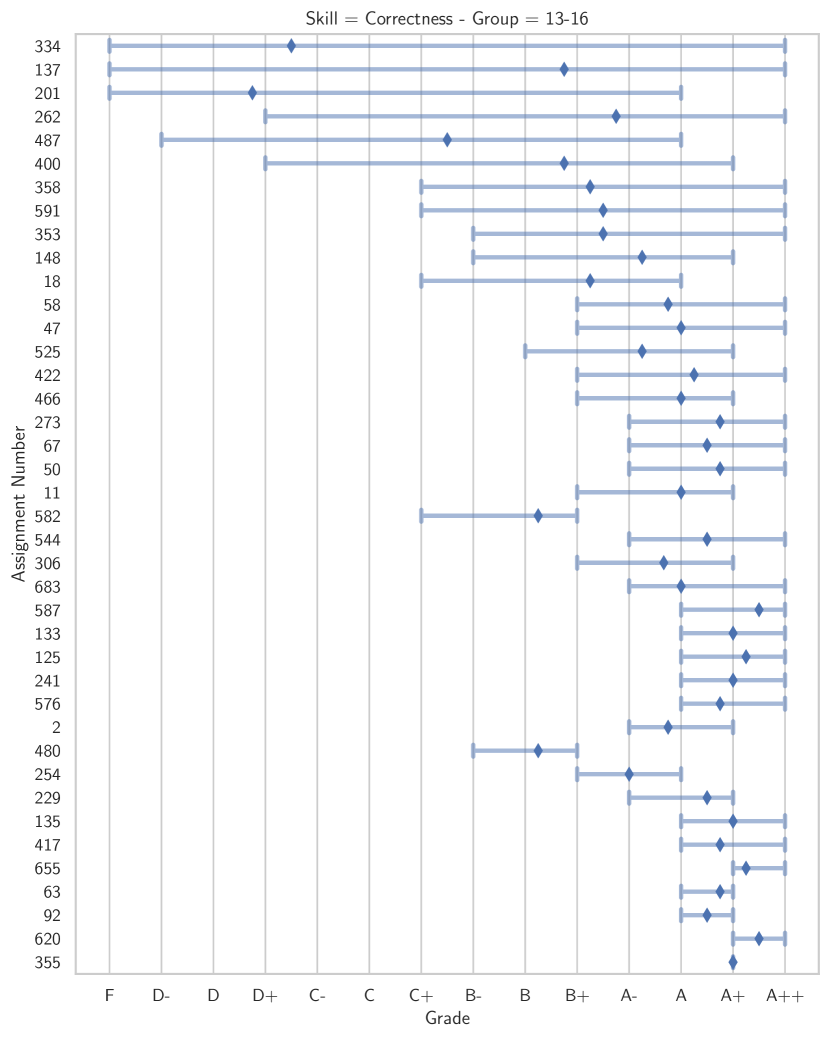
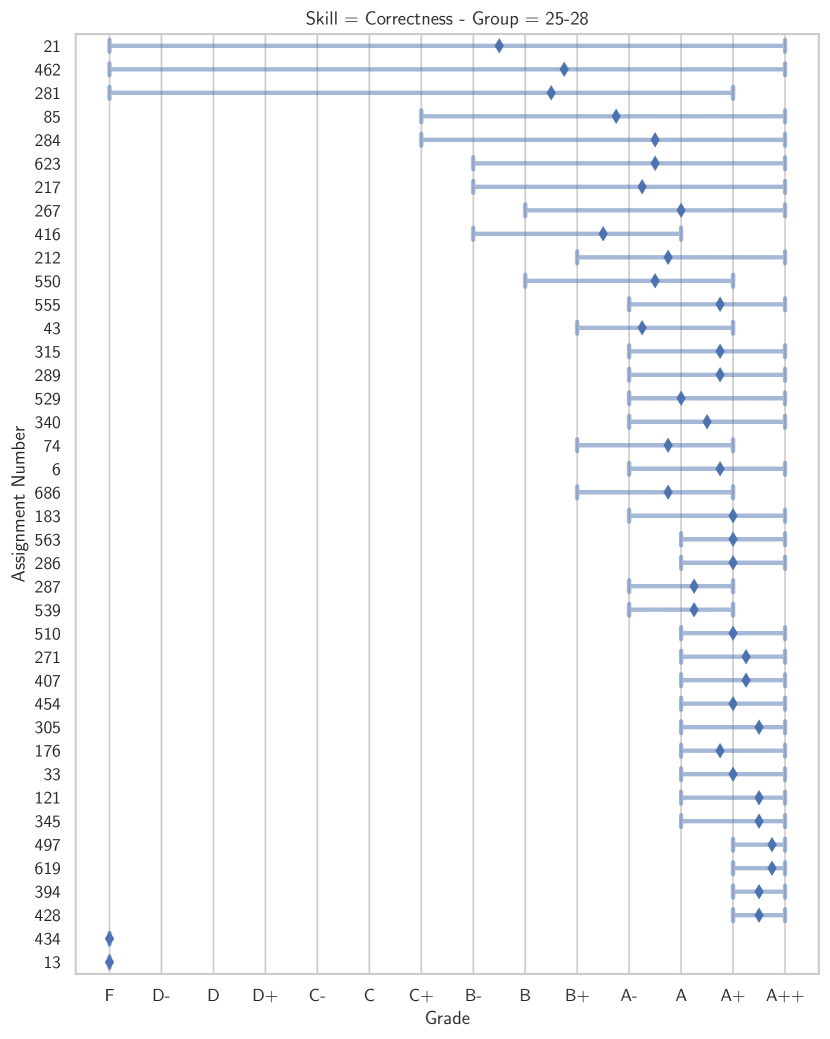
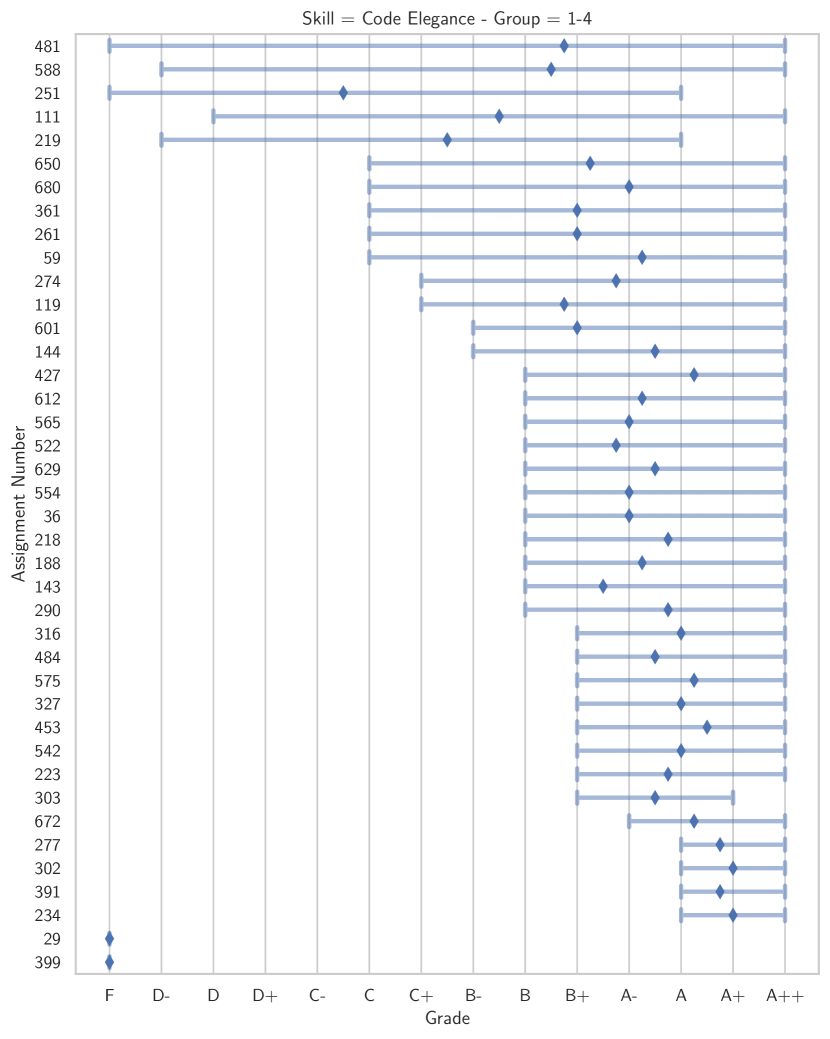
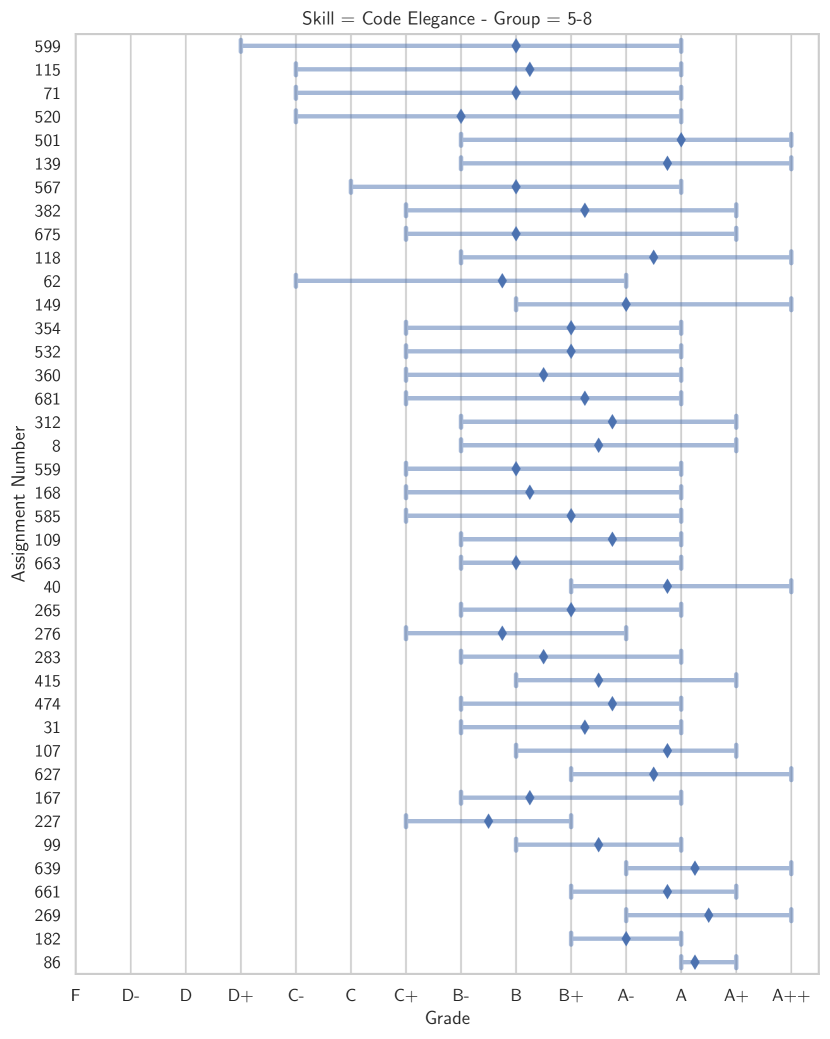
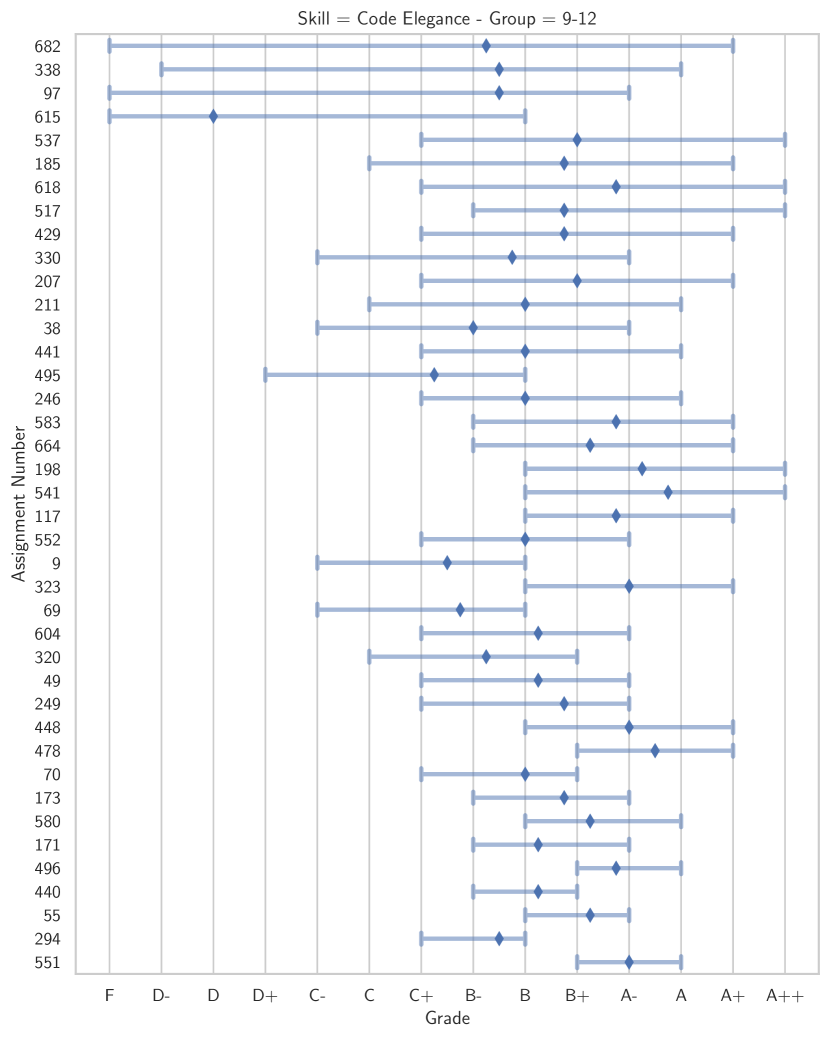
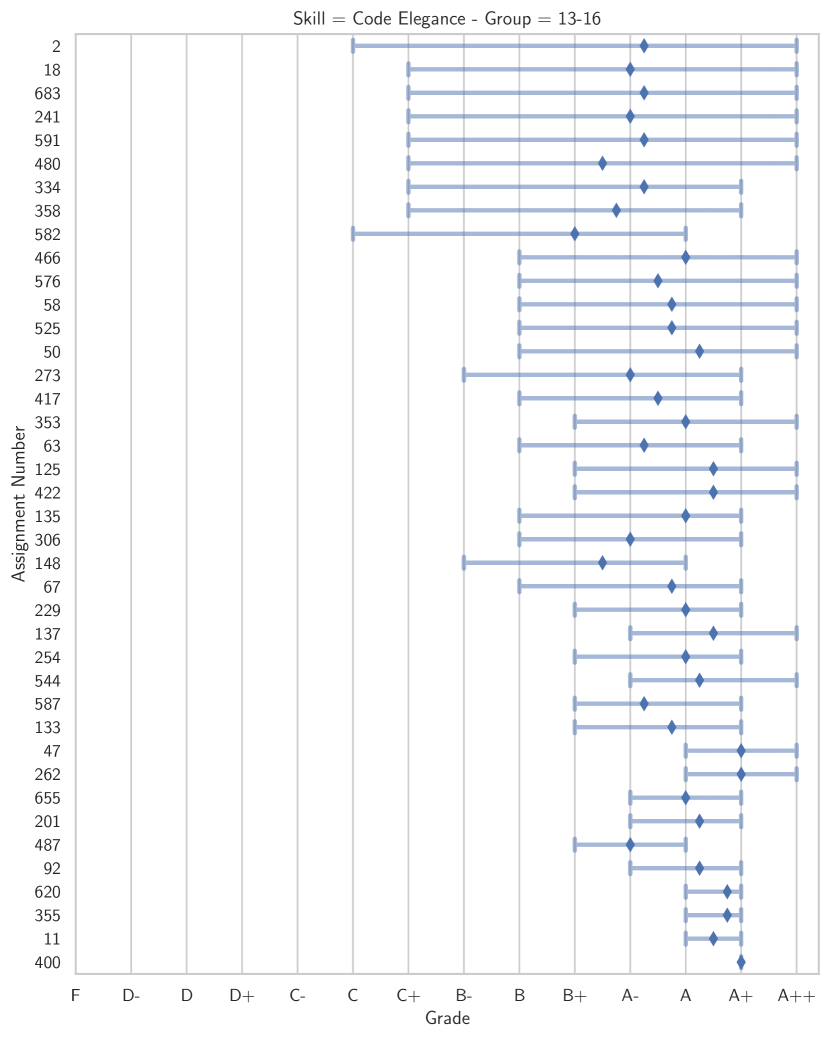
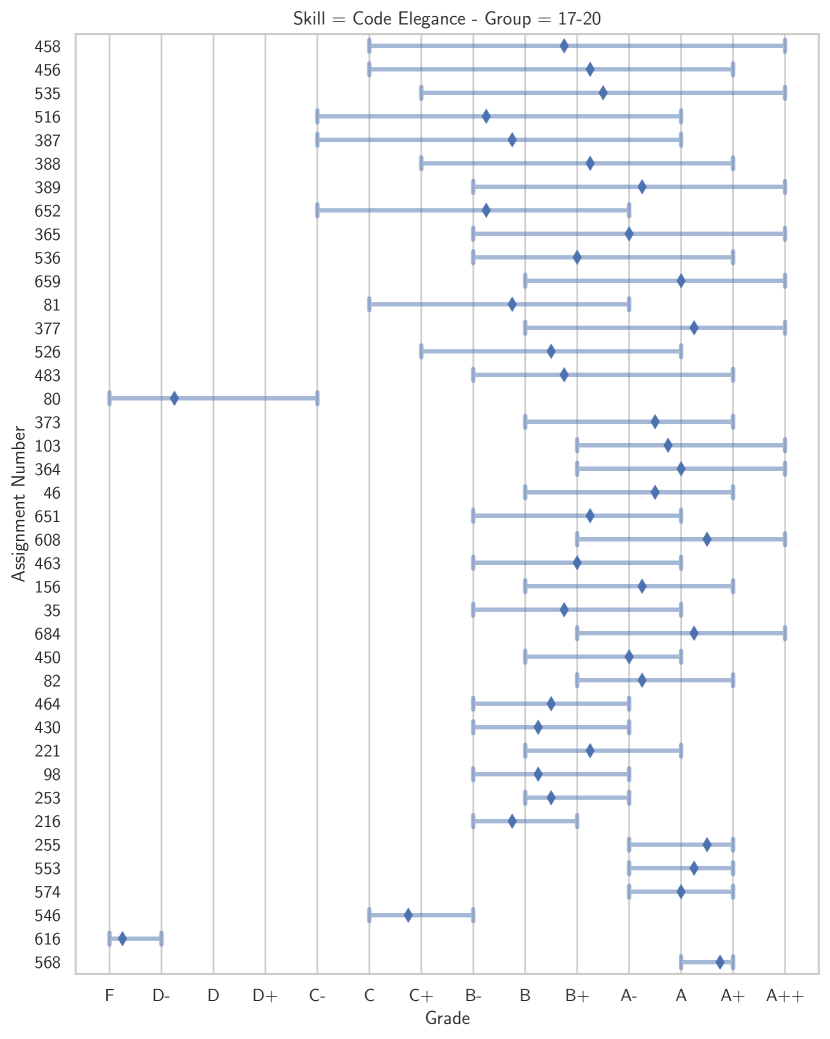
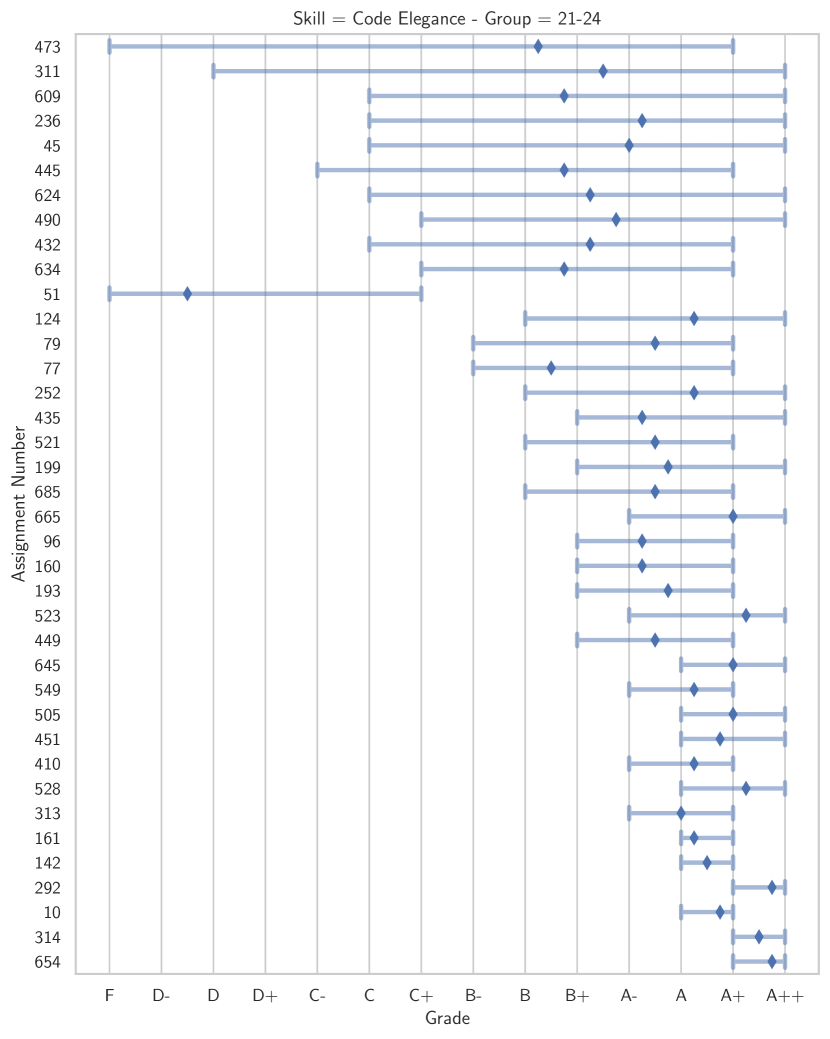
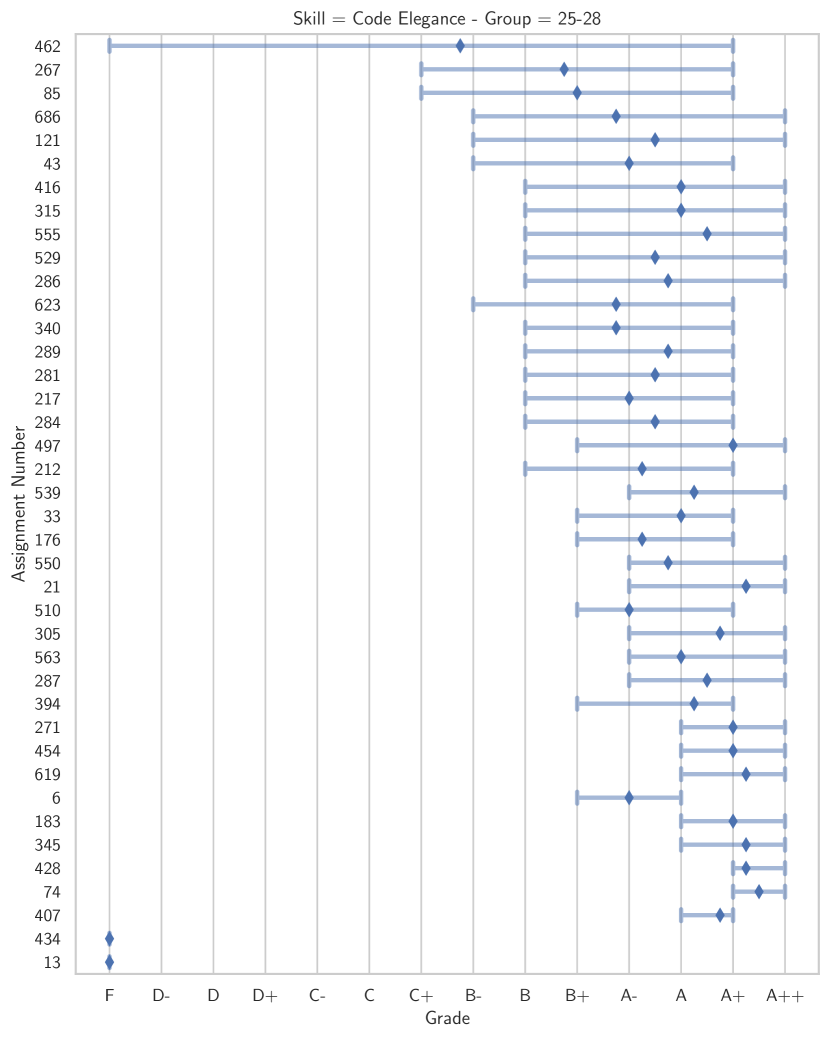
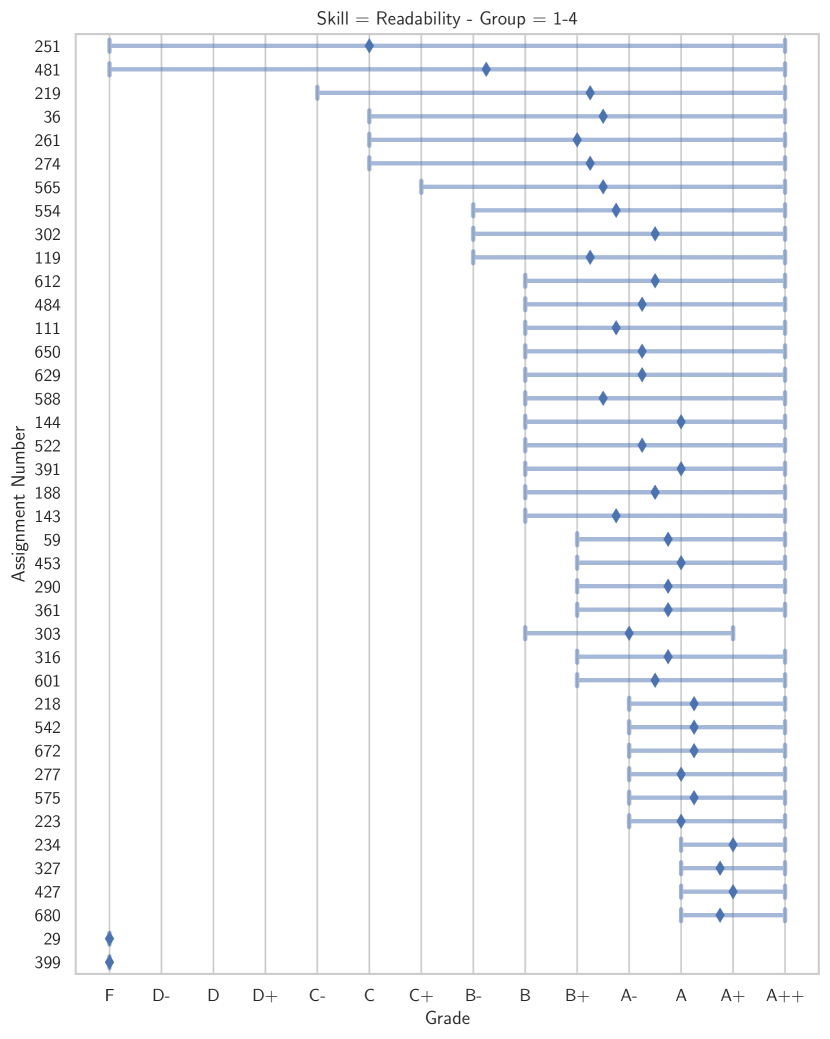
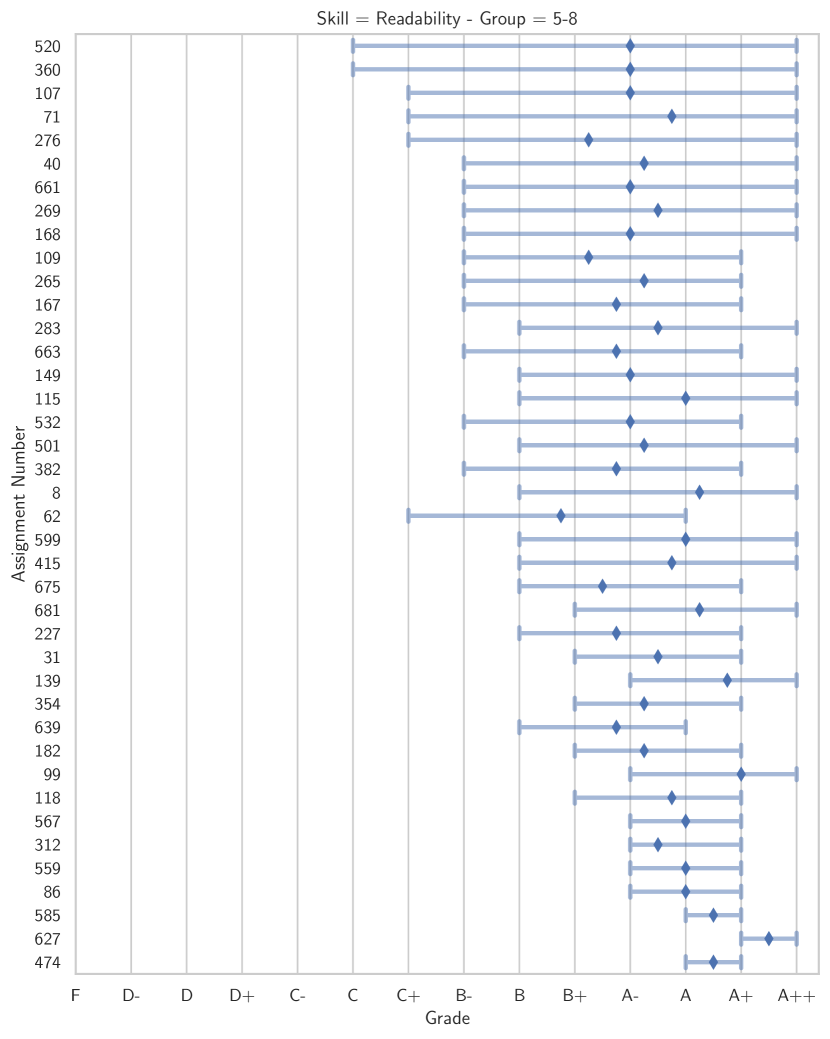
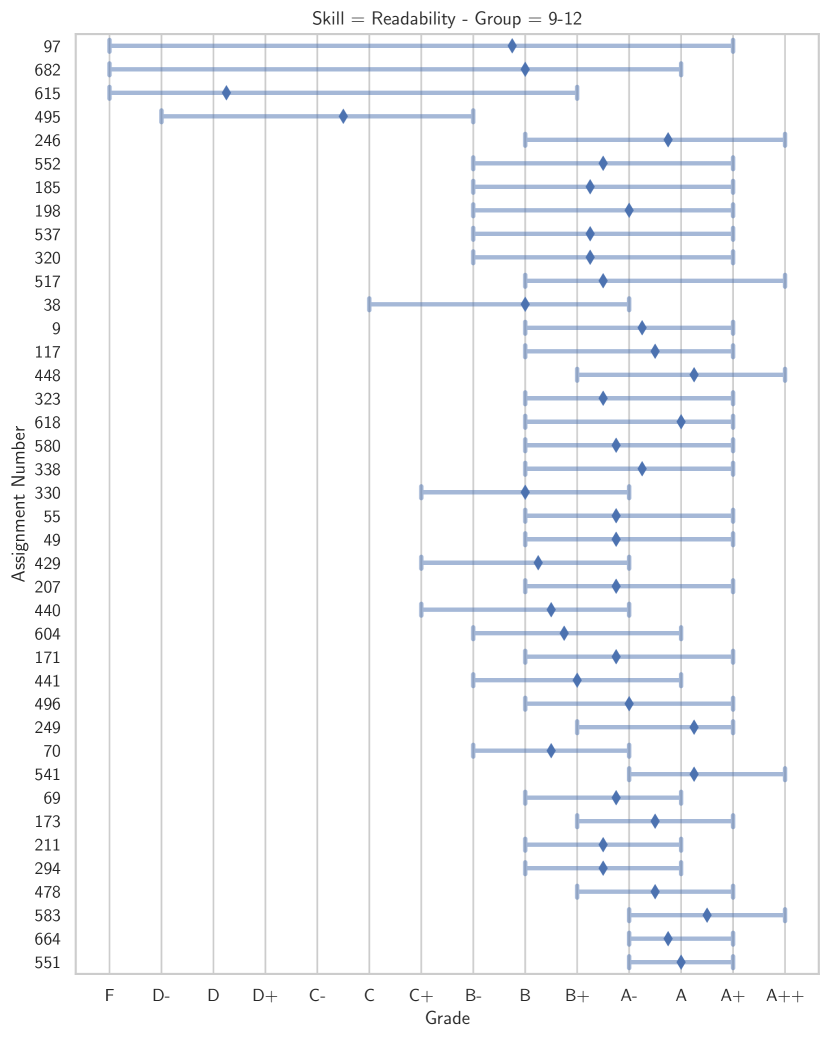
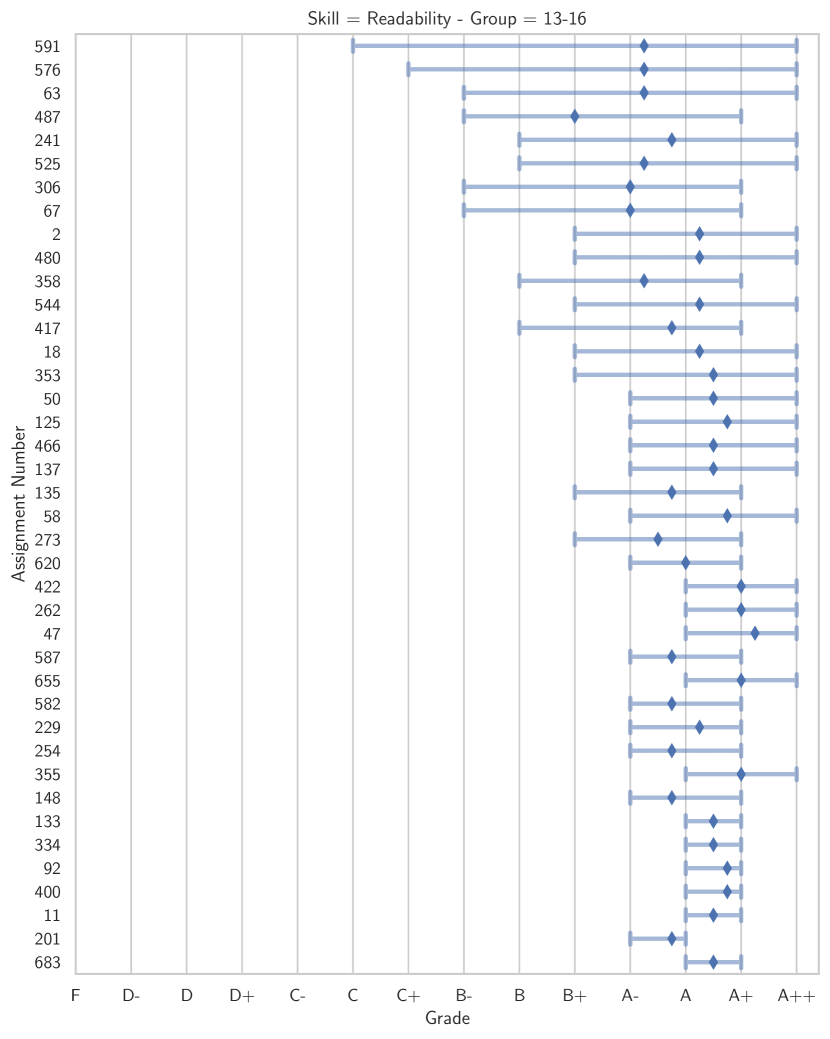
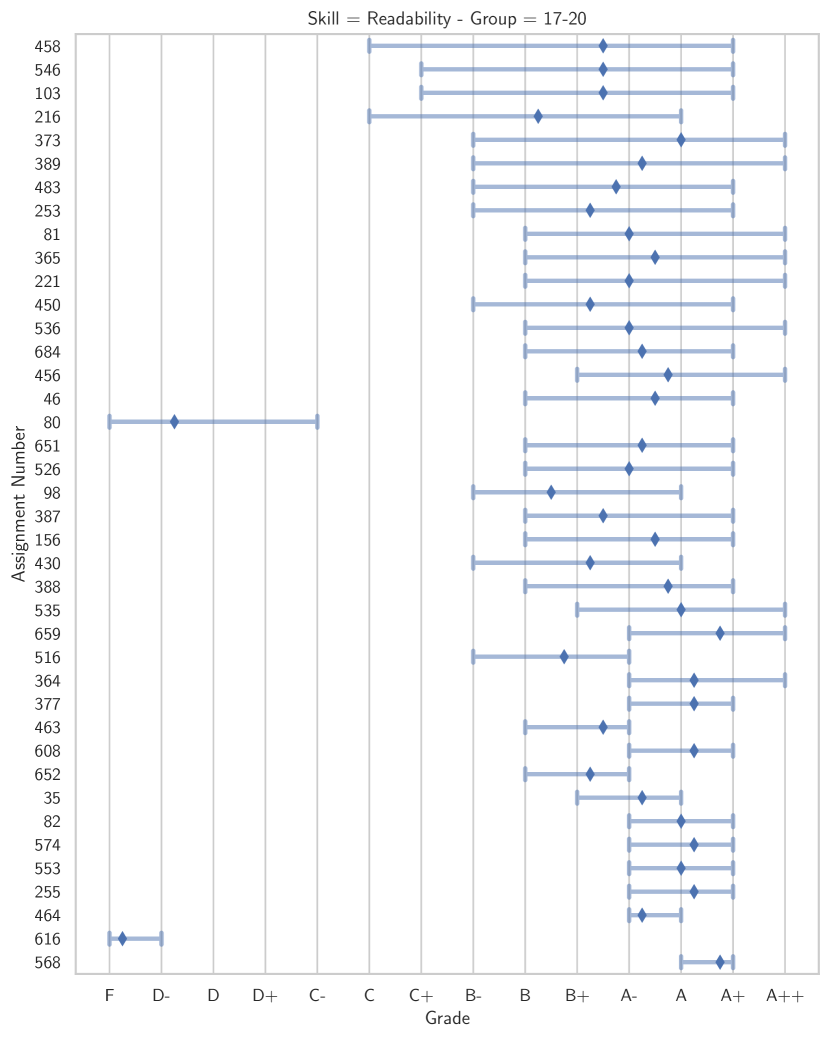
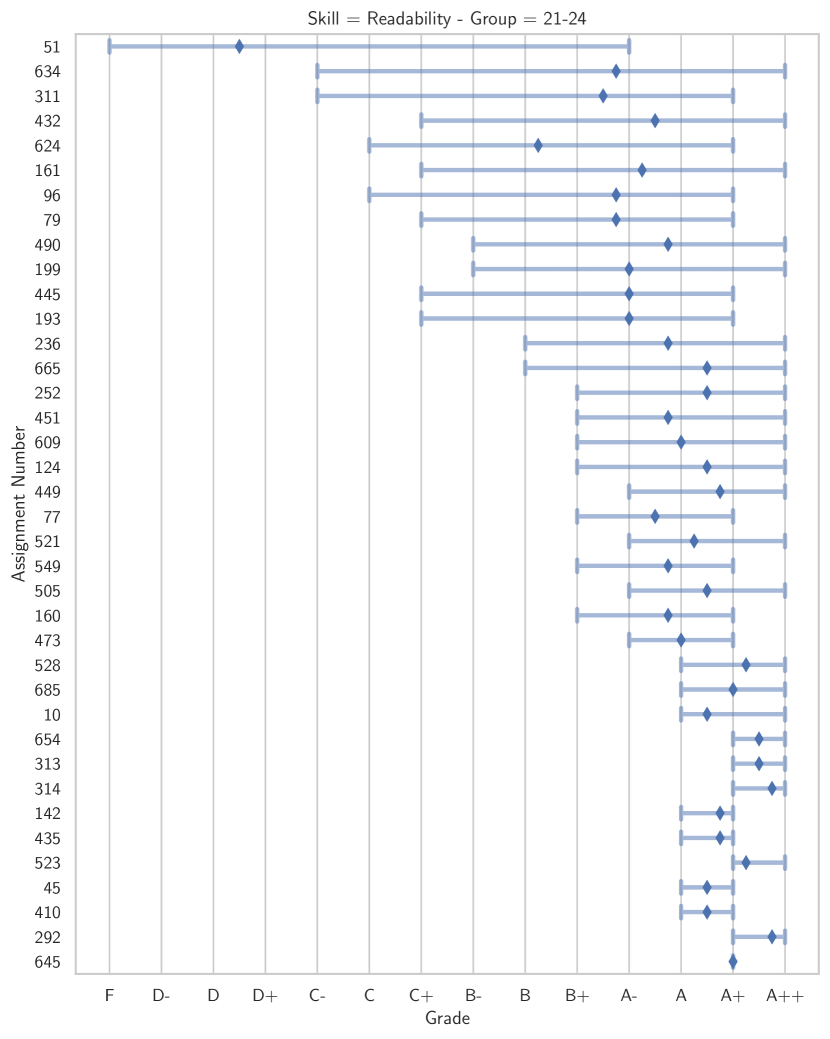
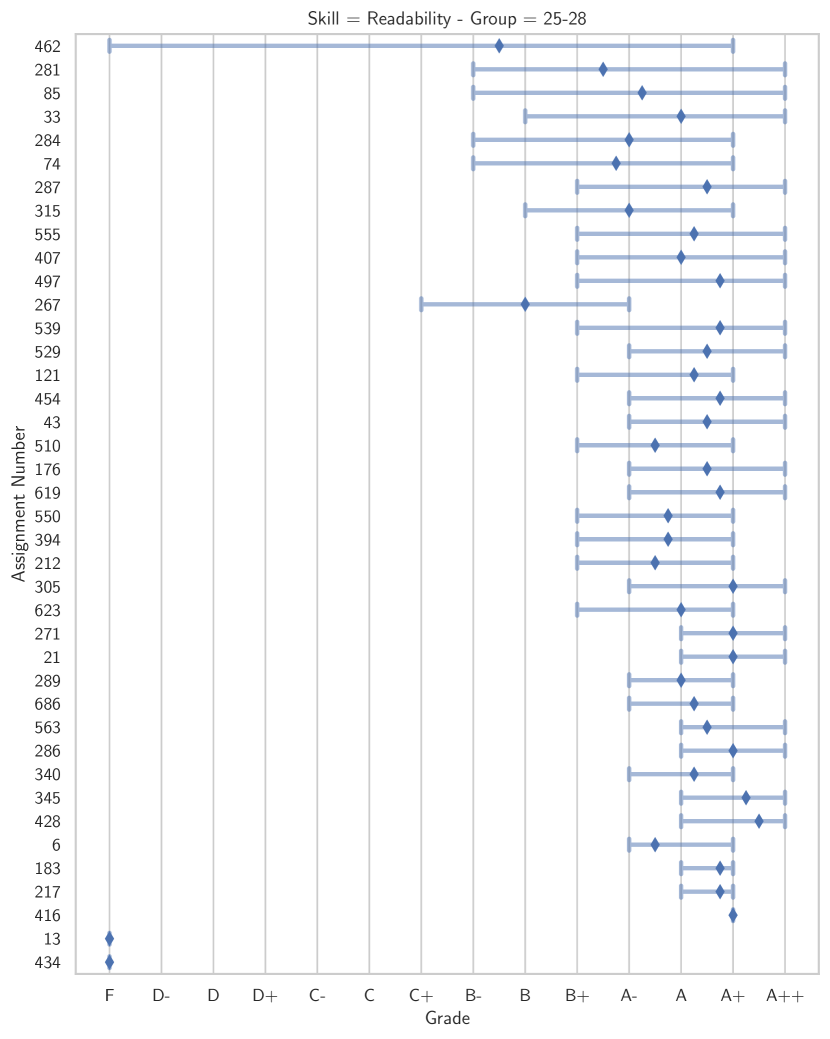
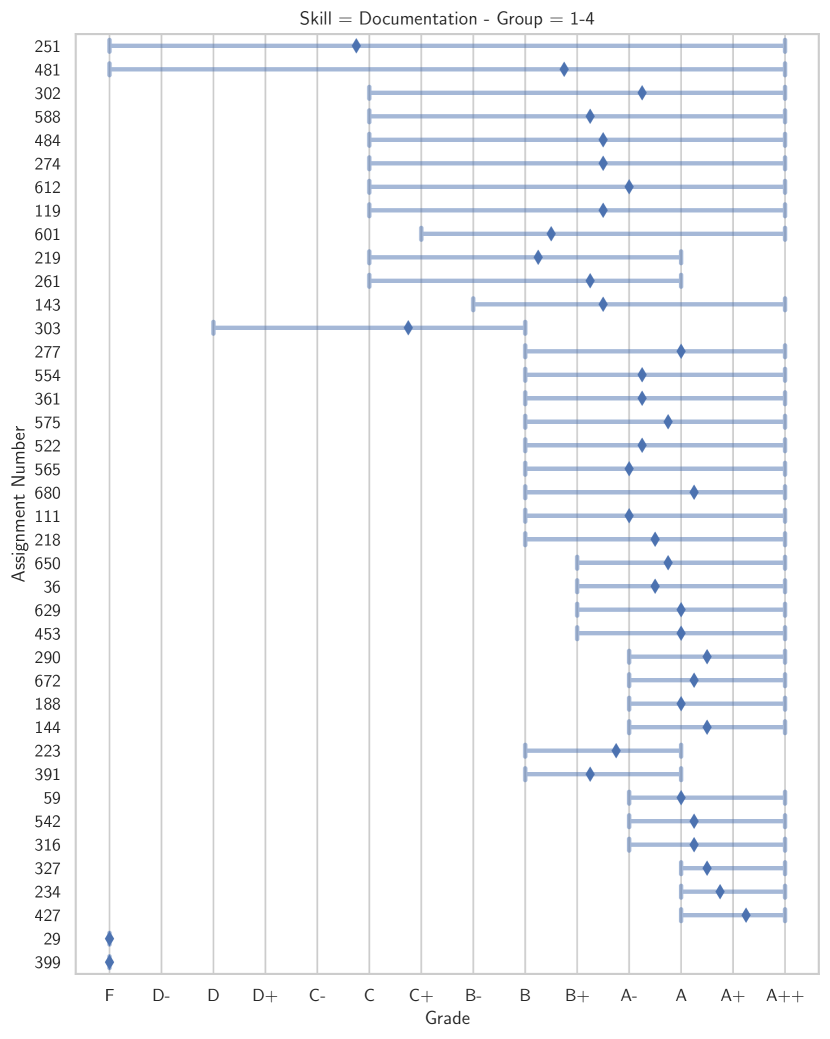
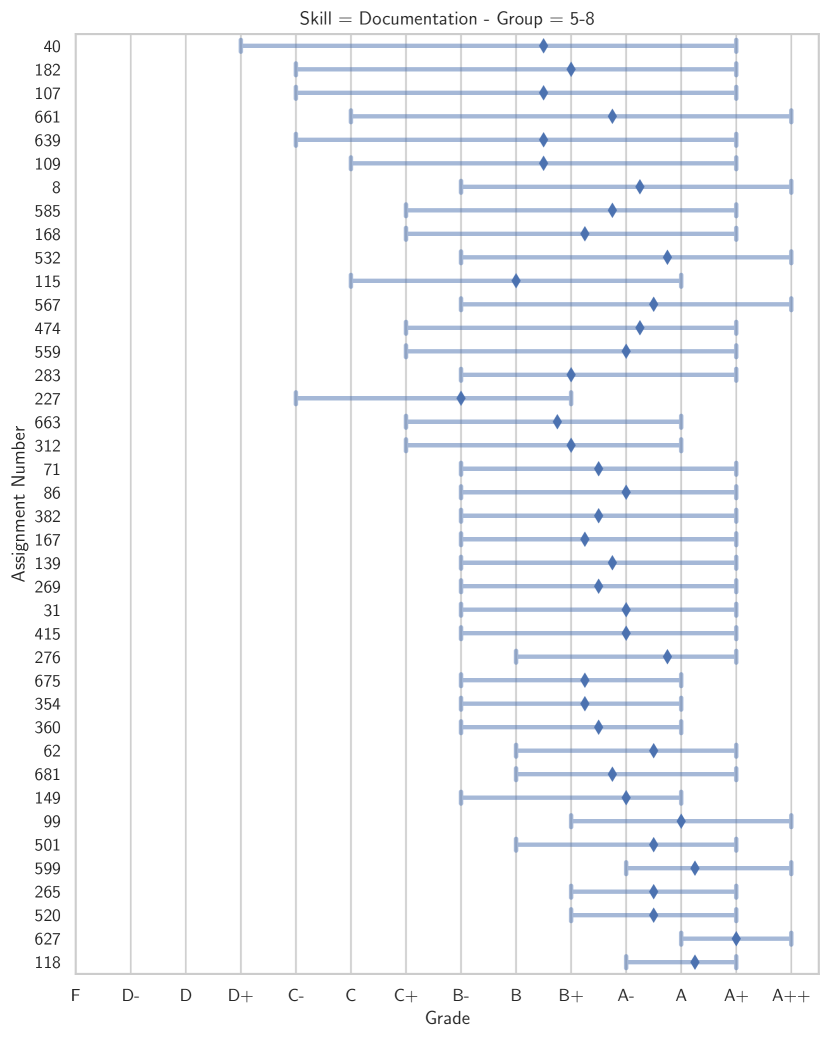
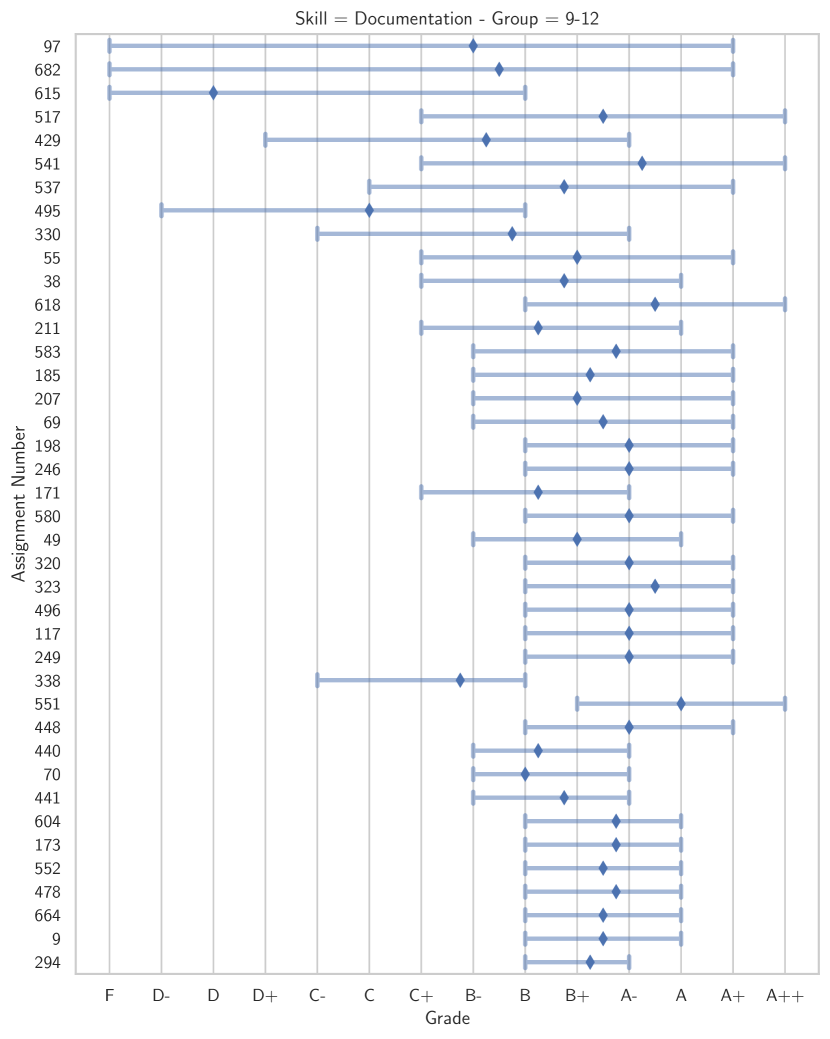
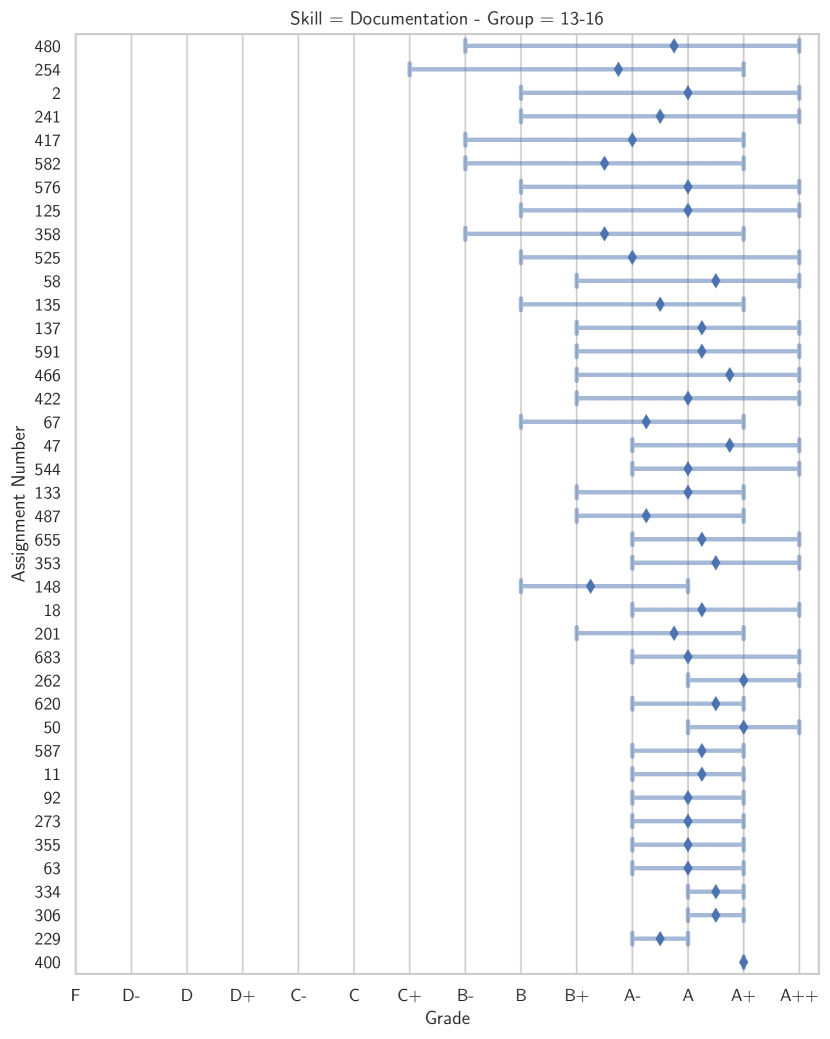
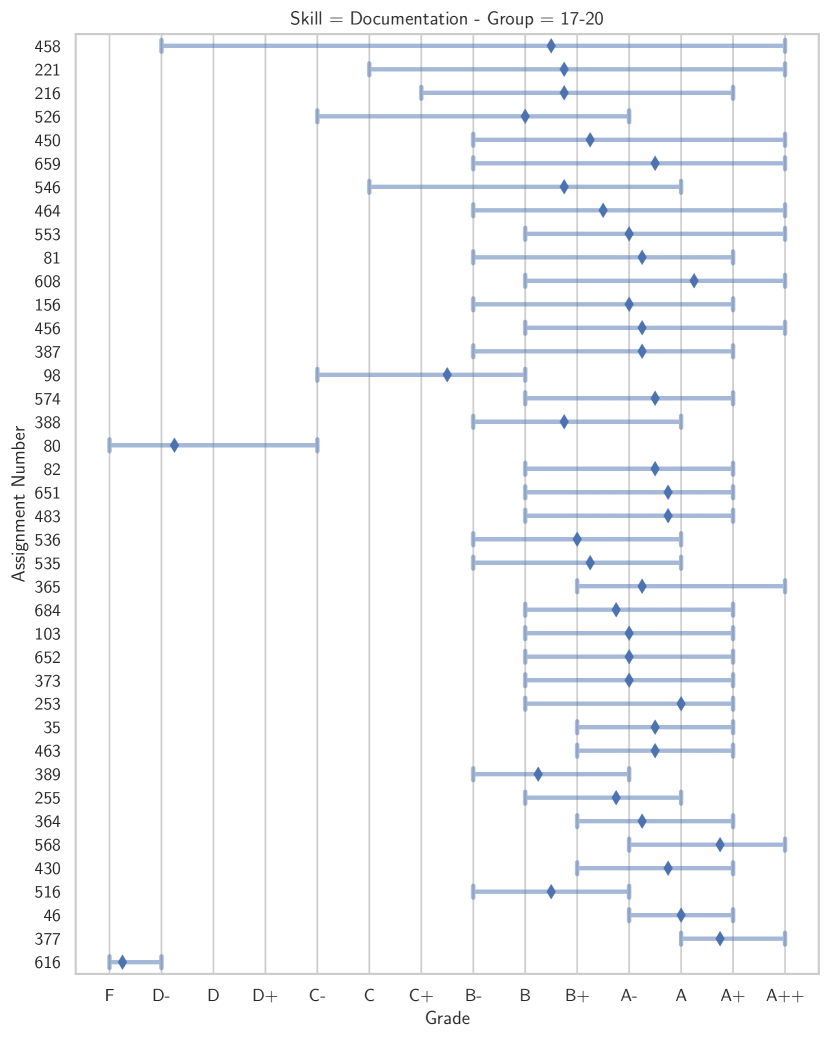
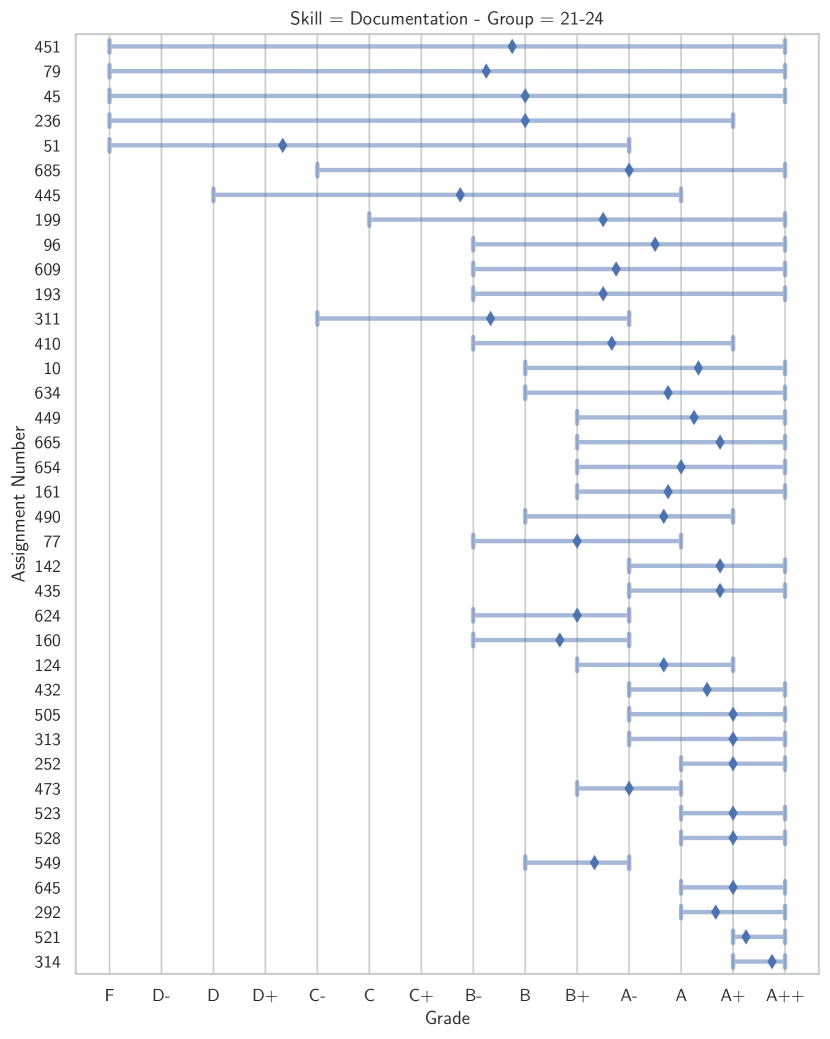
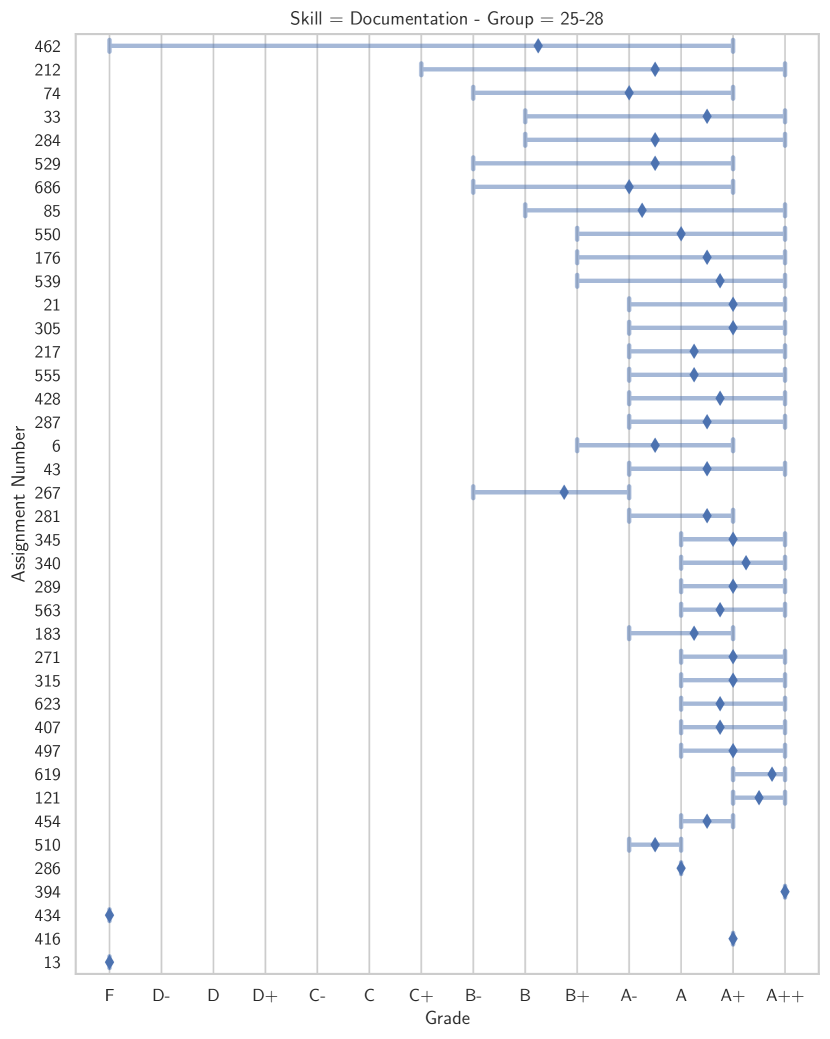
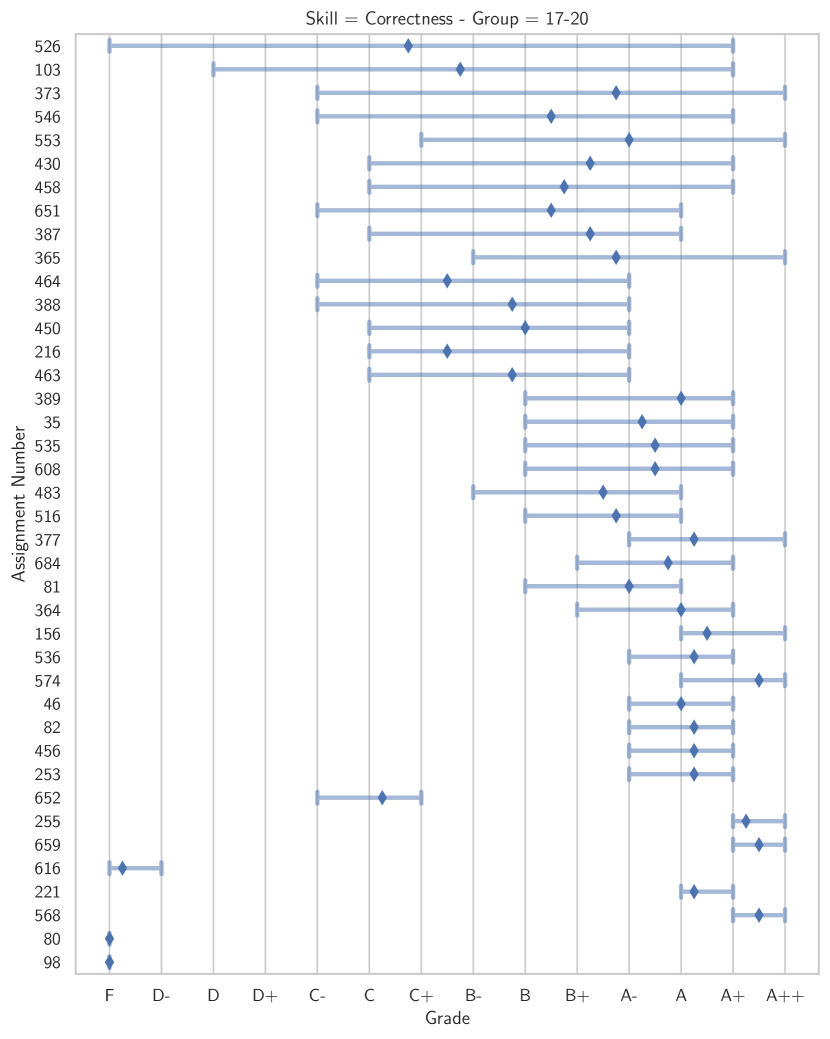
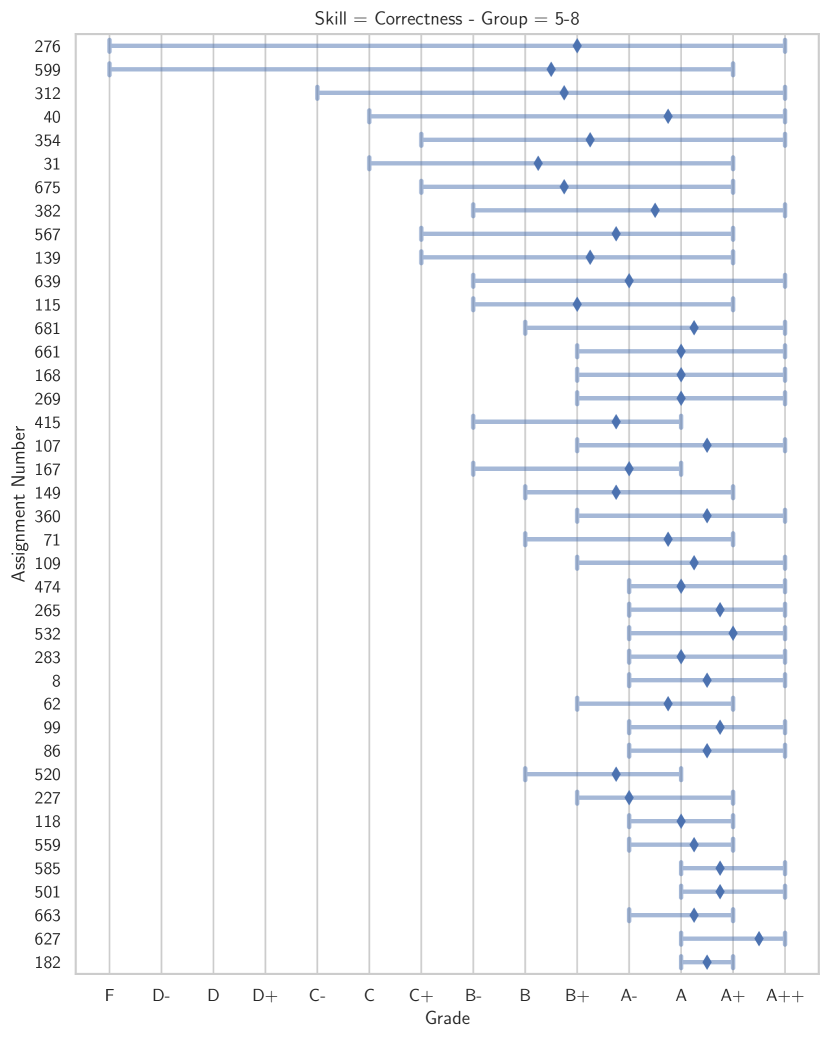
To further explore the inter-rater reliability, we evaluated the spread of grades awarded by each group. Figure 17 shows the minimum, maximum, and mean correctness grades for group 17-20, which was the most consistent when grading correctness, with an , and for group 5-8, which was the least consistent when grading correctness, with an . Appendix B shows the distribution of grades for all groups and all grades.
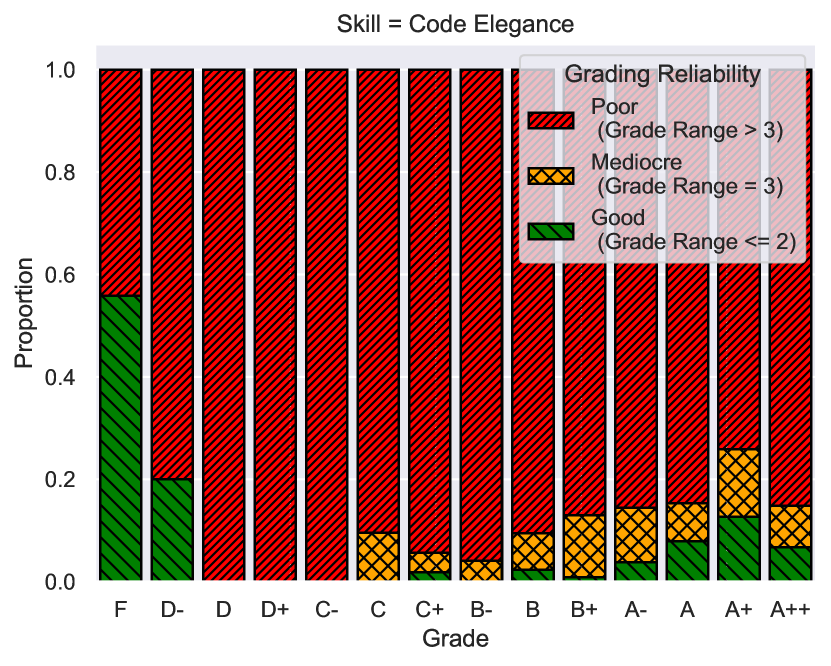
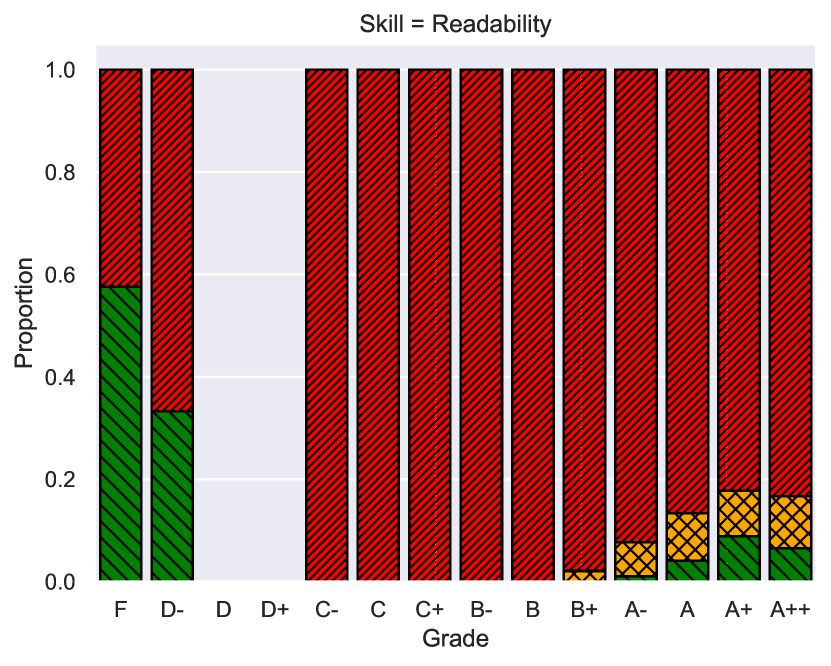
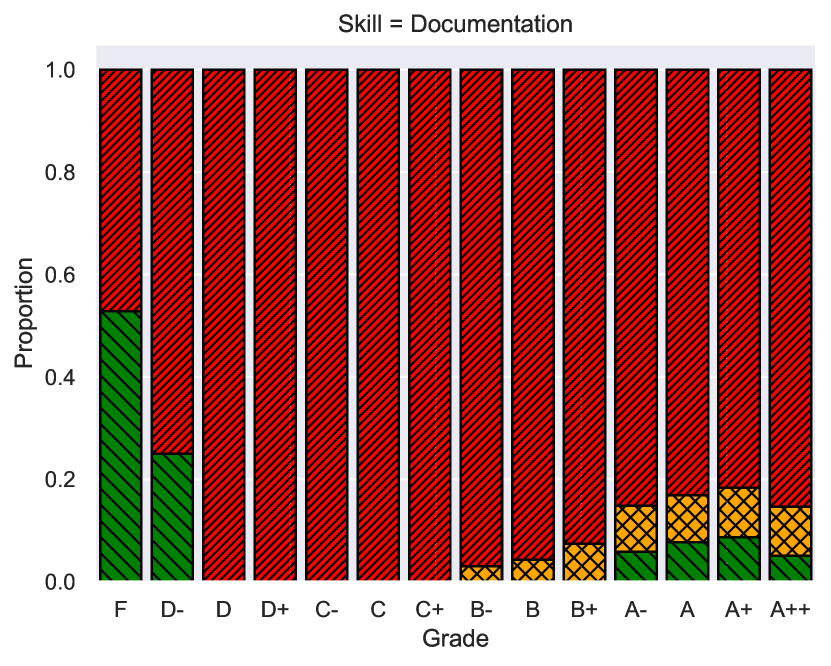
To further investigate the reliability when awarding each grade, we stipulate that assignments grade ranges less than or equal to two (e.g. A to B+ is two grades away, and A to A- is one grade away) have good reliability; those with a range of three (e.g. A+ to B+) have mediocre reliability, and those with a range greater than three (e.g. A- to C+) have poor reliability; where the grade range is the maximum awarded grade minus the minimum awarded grade for each assignment. Figure 18 shows the proportion of the reliability for each grade and skill.
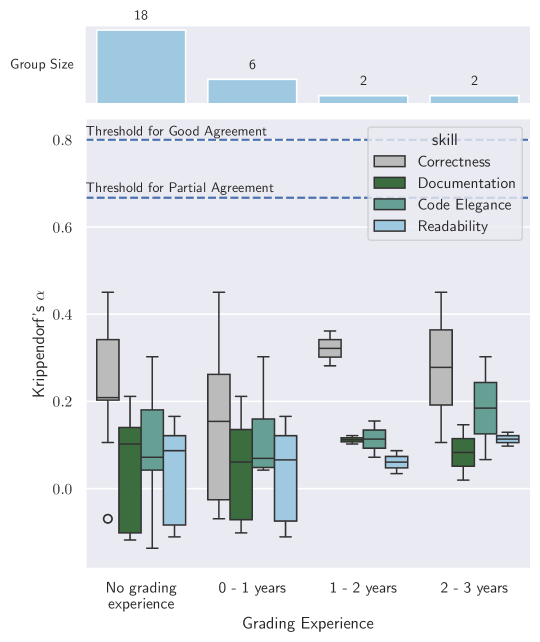
Our participants had varying grading experience levels, which could have affected the consistency of their grading. Figure 19 shows the distribution of Krippendorf’s for each of the four skills. Independent of the years of experience, no groups achieved an agreement close to the threshold for partial agreement. Our results for 1-2 years and 2-3 years of experience show varying levels of agreement, as the sample size of participants who had more than one year of grading experience was small, which is typical at many institutions where undergraduate, master’s and PhD students all assess student work (Mirza et al., 2019), as many students typically graduate after one or two years of working as teaching assistants. Those with one year of experience in grading show no significant improvement in inter-rate agreement compared to those with no grading experience.
4.6. Grading Consistency of Individual Graders (RQ2)
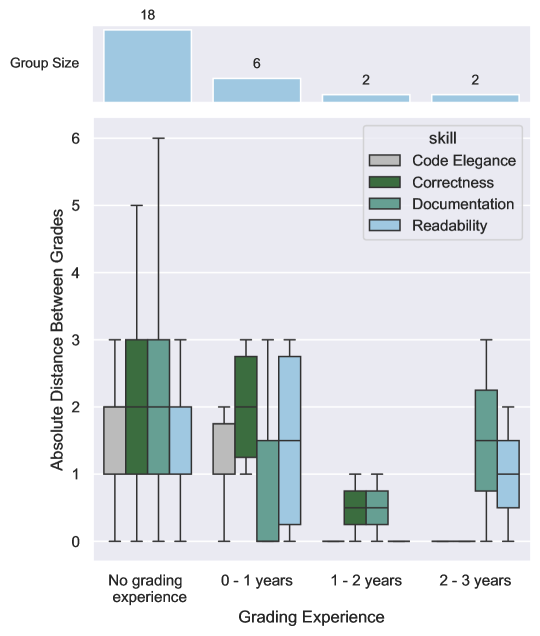
As part of our study, we purposefully duplicated an assignment within the second batch to allow us to evaluate the consistency of the individual graders. 22 participants did not notice the duplicate in the second batch; six participants (1, 2, 10, 11, 20, 25) did. Figure 20 shows the distance between the 14 awarded grades when regarding the same assignment for a second time, for each participant for each skill.
Only two participants, three and ten, provided the same grade in both batches for all four skills. Participant 10 noticed the duplicate, and during the interview, participant 10 mentioned that they noticed the duplicate and changed the grades for both batches to F as they believed it was plagiarism, while the other five participants followed the instruction that if you notice a duplicate, treat it as you are grading it the first time; as this was a pair programming assignment, duplicates could still exist within the dataset. Participant 3 did not notice the duplicate and said, “…like some assignments used the same animals… but [the implementation] was a little bit different so not like an exact copy of those two assignments…”.
The average absolute distance between grades when regrading the same assignment a second time was correctness = 1.7857, code elegance = 1.2500, readability = 1.3571 and documentation = 1.5714. These results show that for the consistency of the individual graders in our study, on average, they were between one and two grades apart between batches one and two, with a higher variability in correctness and documentation, and were more consistent with themselves when grading code elegance or readability.
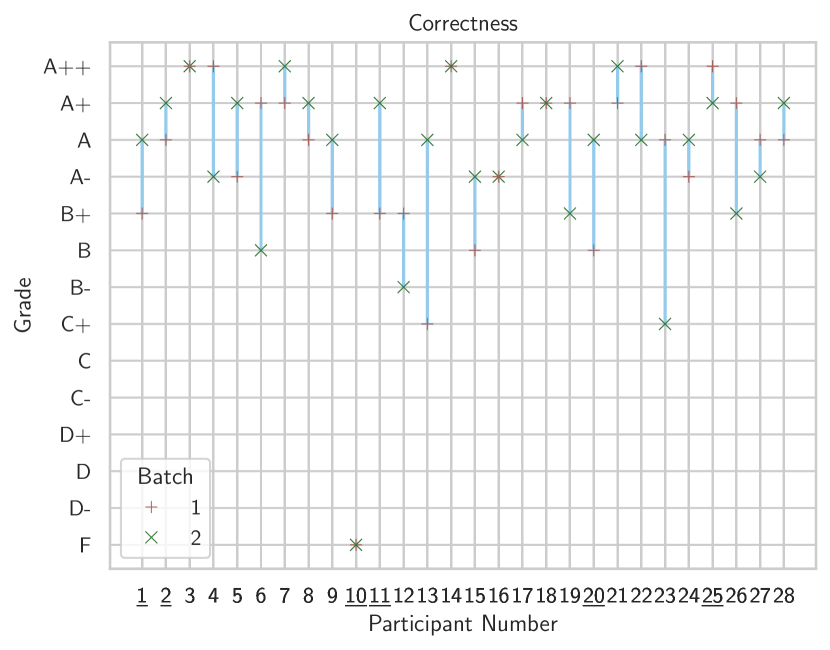
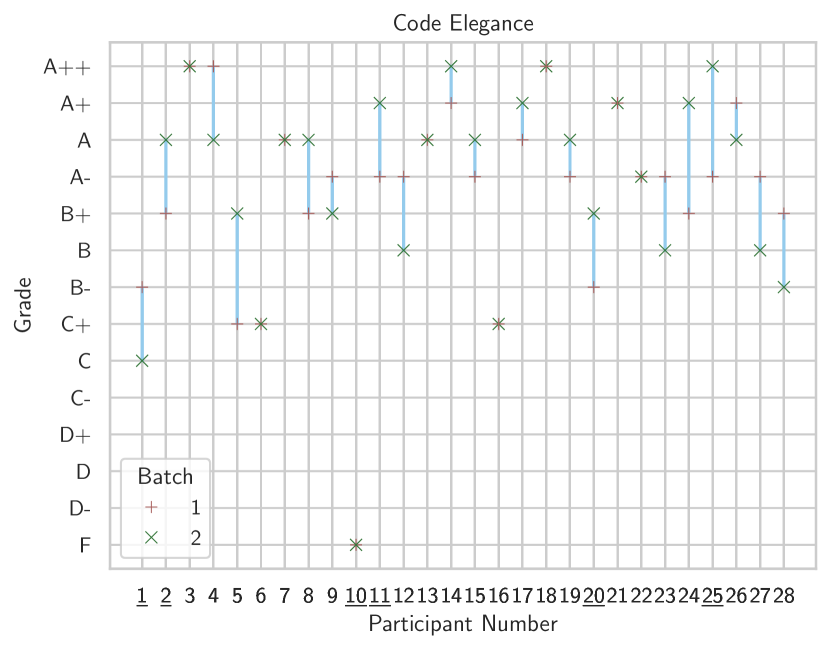
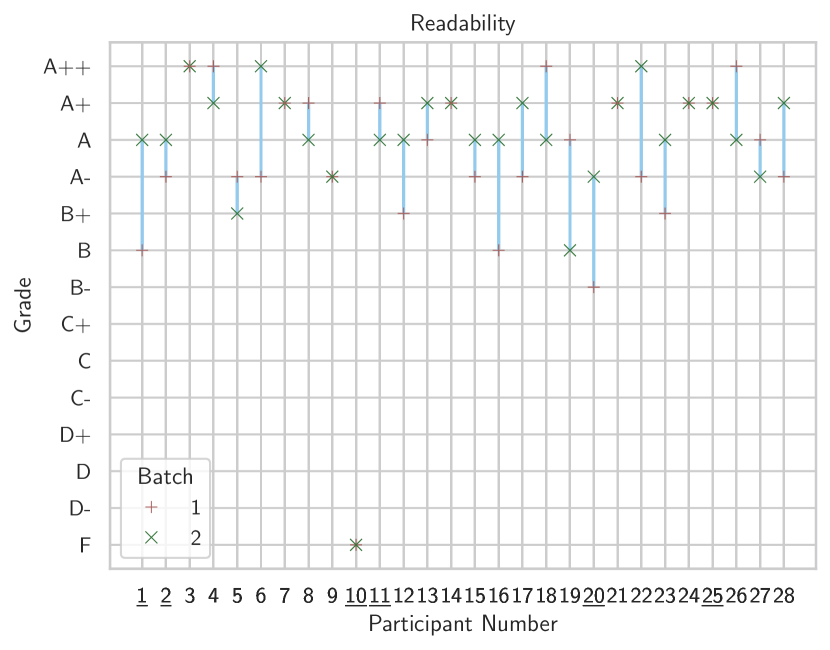
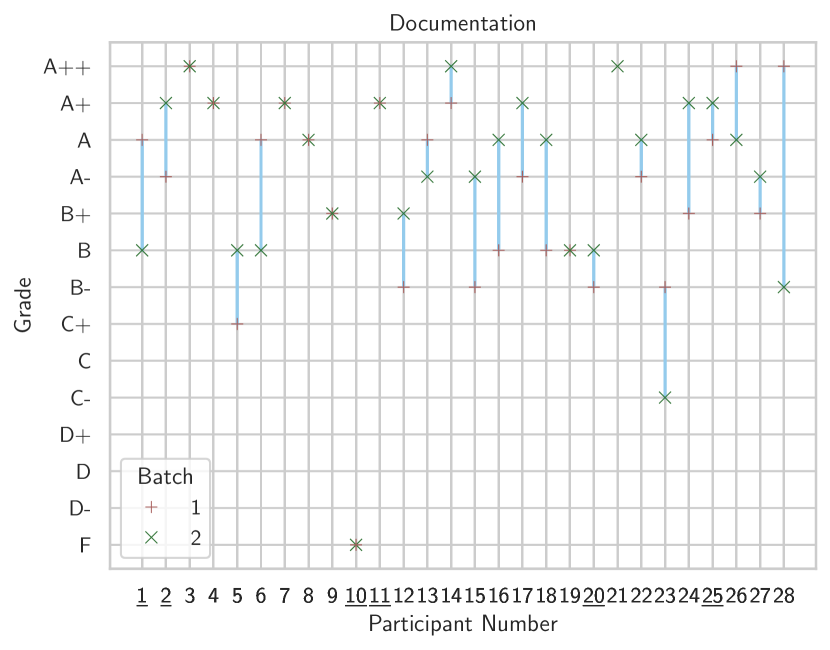
Figure 21 shows the distribution of the absolute distance between grades awarded in batch one and batch two for each of the four skills. Those with no prior grading experience have the largest difference between grades across all skills. Those with 1-2 years of grading experience have at most a difference of three grades between the first and second time they graded the duplicated assignment, and those with one or more years of grading have a grade difference of less than one for most skills. However, readability and documentation for those with two or three years of grading experience had a maximum grade distance of two or three, respectively.
5. Discussion
5.1. How Consistently Does a Group of Graders Apply a Rubric? (RQ1)
Consistency was very poor overall. Even the best values for Krippendorf’s achieved reflect distinctly poor consistency, with none of our seven groups of graders achieving an , the lower bound to consider reliable (Krippendorff, 2013), with the average across all groups and skills. Out of the four skills that the participants graded, correctness was most likely to be graded more consistently, with five of the seven groups achieving a higher than the other four skills, with groups 5-8 and 25-28 achieving the second most consistently graded skill for their respective groups. In comparison, all participant groups were similarly inconsistent when grading code elegance, readability and documentation, all skills achieving an average .
The correctness of a program is, in most cases, inherently objective, though there can be elements of subjectiveness, especially within open-ended coursework assignments. The nature of open-ended assignments, where students decide how they implement a set of features using their ideas and creativity, can make it difficult for the groups of assessors to grade consistently.
Our most consistent group while grading correctness was 17-20, with an ; Figure 17(a) shows the range of the awarded grades for the 40 assignments that they graded. Only assignments awarded an F (assignments 80 and 98) – since they either did not compile or did not include any student code – were assessed with complete agreement. The original authors of assignment 80 submitted the template code they provided, and assignment 98 did not compile or, if the assessors fixed the compilation error, had an unhandled NumberFormatException, causing the simulator not to execute.
Group 17-20, which had the highest average of three master’s students and one third-year student. Another group with a similar composition was group 1-4, consisting of three master’s students and one PhD student; however, they had an average , the fourth lowest average .
Group 25-28, which had the highest proportion of PhD students, at two, with one master’s and one third-year, had the second highest average . Those that primarily consisted of third-year students, at two, with one master’s and one-third year, performed the worst in terms of inter-rater reliability, with Group 13-16 having an average and Group 5-8 having an average . In most cases, being of a higher degree level when grading CS1 introductory programming does not increase the consistency when using multiple graders.
Our participants follow the typical demographics of teaching assistants, being undergraduate, master’s or PhD students (Mirza et al., 2019), and many are new to assessment and have little experience. None of our participants met the threshold for partial agreement (). While having experienced teaching assistants to conduct the grading could improve the consistency, having those with many years of grading experience is typically rare; at our institution, many teaching assistants do not start assessing student work until they have nearly finished their degree. However, those with one year of grading experience had similar inter-rater reliability to those with no previous grading experience, indicating that more grading experience alone will not improve the grading consistency to an acceptable level.
5.1.1. An In-Depth Analysis of the Grades Awarded by Group 17-20
Several assignments were awarded grades that were one grade bound away, with assignments 568, 211, 659, and 255 all being awarded an A++ or an A+ and assignment 616 being awarded a D- or an F. With these assignments being at the tails of the potential grades, it can be difficult to differentiate between the two furthest bounds, especially with the subjectiveness of open-ended assignments. For assignment 616, three of the four assessors graded the assignment an F for correctness, as the submission only contained the base code. However, participant 18 opted to assign the grade D- and gave the feedback, “The submission does not cover any of the requirements in the coursework”. We do not know why Participant 18 opted to grade assignment 616 with a D- and assignment 80, another assignment that did not meet the coursework requirements, with an F. However, this does highlight the potential issues with the internal consistency of human graders, which we discuss in more detail in Section 5.2.
Assignment 526 was the most inconsistently graded within the group 17-20, with grades ranging from A+ to F, with two awarding the assignment F for failing to compile, one awarded the assignment an A, and the other awarding the assignment an A+. As part of the anonymisation process, some base classes were copied into the submission. This was brought to our attention early within batch one; all participants were instructed to delete the problem classes and regrade any assignments that could not be compiled. However, some may not have completed this step.
The second most inconsistently graded assignment was 103, with the four participants awarding a D, a C-, a B+ and an A+. Participants 19 and 20, who awarded the assignment a D and a C-, respectively, highlighted that the assignment spawned three windows, with one having no visible functionality, but completed all the base tasks and some of the challenge tasks. Participants 17 and 18, who awarded the assignment a B+ and an A+, respectively, chose to focus on completing the challenge tasks and decided not to penalise the submission for spawning three windows as heavily. Participant 17 stated in their feedback, “Whilst the base tasks were correctly implemented, the challenge tasks were incorrectly configured…”. This is an excellent example of the hawk and dove effect, where some examiners are more stringent and require higher performance, the hawks, than others, the doves (McManus et al., 2006). In this case, participants 19 and 20 are the hawks and require the program to have minimal errors, while participants 17 and 18 are the doves, and chose to focus on the highlights of what the student has submitted and provide a more lenient grade by overlooking the bugs within the application.
While correctness is mostly objective, code elegance, readability, and documentation are inherently subjective. Even if aspects of these are defined in the course, such as the specific code style or code design practice that the students must use, the examiners have their personal preferences on what makes code readable, well-designed or well-documented. In this assignment, students were asked to use the code style demonstrated in Barnes and Kölling (2006) “Objects First with Java” and to use object-oriented programming, including inheritance and polymorphism, which they covered in class in the few weeks before the coursework was set.
Out of our seven groups, group 17-20 had the highest while grading code elegance with an , less than the tentative acceptable value of . When grading code elegance, Group 17-20 did not agree for any of the 40 assignments they graded. Two assignments, 568 and 616, out of the 40 that group 17-20 graded were one grade bound away. Assignment 616 was awarded the same grades as correctness, with three awarding an F and the fourth awarding a D-. Assignment 568 was awarded grades at the opposite end of the spectrum, with three assessors awarding an A+ and one awarding an A. The assessor that awarded an A gave the feedback that “… some functions are very long…”, whereas two of the assessors who awarded the A+ praised the student for their implementation, while the third did not provide any feedback with their grade.
The largest variance in grades awarded by group 17-20 for code elegance was for assignment 458; the grades awarded were C, B-, A- and A++. Participant 17, who awarded the A-, gave the feedback “Solid implementation on both core and challenge class.”. Participant 20, who was awarded the C, commented on the repetitiveness of the code and how functions could be refactored to the superclass. These differences in awarded grades and the associated feedback can suggest how grading subjective elements of assignments can introduce a higher variance in the awarded grades.
This trend of a few assignments being somewhat consistently graded and many being inconsistently graded holds for readability and documentation, with Appendix B showing the grade range for each skill. Figure 18 shows this trend for each grade, with the middle grades (D - B+) more likely to have a larger variance in awarded grades across all four skills. While the middle grades showed no cases of any grading achieving acceptable levels of consistency, the high (A++ - A) and low ranges (F - D-) displayed at least some instances of grader agreement. Grades F and D- have the largest portions of grade ranges, being less than or equal to two. At the other end of the grade spectrum, grades A, A+ and A++ have a smaller proportion of grade ranges that are less than or equal to two.
Submissions at the failing end of the grade spectrum may make it easier to provide consistent grading, as they are more likely to be incorrect, uncompilable, poorly designed, incomprehensible or missing documentation. Meanwhile, grades at the opposite end of the grade spectrum may make it easier to provide consistent grading. They are more likely to have fully-featured code that compiles, follows sound design principles, is easy to read, and has complete and meaningful documentation. Still, assessors can have different opinions on what makes a submission great, such as those that get awarded an A+ and exceptional submissions or those that are awarded an A++.
The rubric, which was provided to the students when they were completing their coursework, is a generalised rubric for each of the four assignments in the introductory Java course at our institution. It describes each of the four aspects, correctness, code elegance, documentation and readability, for the grades A+ - A++, A, B, C, D and F. While the +/- grades were not included in the rubric, we chose to include them in our study, as they were used when grading the original submissions.
Some aspects of the rubric are very clear, especially for the grades at either end of the grade spectrum. For example, for correctness, an F is defined as “Significant details of a task are violated, or the program often exhibits incorrect behaviour.’ and an A+ - A++ is defined as “The application works as described in the assignment; all base tasks are completed; the implementation demonstrates originality, creativity and technical excellence…”.
Meanwhile, for the middle grades, the rubric becomes more subjective. For example, for correctness, a D is defined as “Some tasks are incomplete; the application functions incorrectly on some inputs/actions.” and a C is defined as “Minor details of the task(s) are violated; the application functions correctly on the majority inputs/actions”. Other examples from the rubric include D - code elegance, “The application is unnecessarily complex…”, D - documentation, “…the code is overly commented.”, D - readability, “The application has more than two issues that make the program difficult to understand”. The lack of specificity in the rubric, especially for the middle grades, could have impacted the consistency of the grading, as different assessors can have differing opinions on what constitutes “some” and “majority” correct inputs and if the source code is unnecessarily complex, over-documented or difficult to understand.
Using multiple graders is an inconsistent method of assessing programming assignments, especially for subjective aspects, such as code elegance, readability and documentation. None of our seven groups achieved even a tentative acceptable , with all being substantially lower with the highest for correctness, for code elegance, for documentation, and for readability.
There is likely to be less disagreement at either end of the grading spectrum, an F or an A+/A++, though rarely do any of these have complete agreement unless the submissions do not compile or do not contain any student code, with most groups being within one or two grades at these grades. Whereas the middle grades are not graded consistently, with most groups having a grade difference of three or more.
5.2. Are Individual Graders Consistent at Applying a Rubric? (RQ2)
During the post-study interview, 24 out of 28 graders stated that they graded consistently. However, our results show that when grading a repeated assignment at a later period, only two participants graded the duplicated assignment the same across all skills; in the post-study interview, participant 10 indicated that they noticed the duplicate. Both times, Participant 3 graded the duplicated assignment; they awarded all four skills an A++. They also gave identical feedback and said for correctness, “All listed core tasks completed… Challenge Tasks: Three challenge tasks are completed… demonstrating exceptional technical aptitude…”. While they gave identical feedback in this case, it does not indicate that they noticed the assignment was a duplicate, as they used a common grading practice of using the same feedback across multiple assignments. The average difference between grades across all skills was 1.4911, with correctness being the least consistently graded, with an average grade difference of 1.7857.
Correctness, being the most inconsistent when evaluating an individual’s consistency, is the inverse of evaluating consistency between multiple graders, where the subjectivness of code quality has a more prominent impact. The higher consistency of code elegance, readability, and documentation could be due to our participants being experienced programmers and having learnt programming standards in these areas, which they apply in their grading. Many of our participants have not graded before, and while some may have completed the assignment as a student, they would have only seen a limited set of other submissions. This could explain the variance in the grades, as many of our participants learnt how to judge the differing qualities of work, as they saw varying examples of high or low-quality submissions.
In an effort to improve their consistency, 20 of the participants opted to review their grades. However, only 10 participants had a two or less grade difference between grading the first and second batches. While many opted to review their grades, many only gave a cursory review or reviewed if they thought they graded an assignment exceptionally high. Participant 12 stated, “… not too much time on all the of the like remarking all of them, just spending a minute on each assignment…” and Participant 11 said “…if I graded someone high. I’ll go back and see if I graded anyone else at the same level…”. While the participants’ reviewing process may have increased their consistency for the grades they reviewed, it did not improve their overall consistency.
The environment in which the grading took place, the mood the graders were in, and the time of day in which the grading took place may have also impacted the consistency of the graders. Our participants felt like the environment they graded did not negatively impact their consistency, as most of them graded in the office or in silence at home. During our study, one participant was abroad and staying in a hotel; they said, “…we had visitors quite often, and so it was very hard to find a quiet space in my hotel room..”.
Some participants thought their mood could have affected their consistency, especially when they felt frustrated, bored or stressed. Participant 21 explained “…during the first set of assignments that we were grading when I had to submit a lot of submissions for my own semester as well. So I had a lot of hectic stress from that side.” Participant 28 noticed when they were getting frustrated or bored with the grading and took breaks to allow them to refocus. Participant 8 attempted to grade in a good mood and explained that “… if I am in a bad mood then I was complaining a lot…” and “…try to make empathy with the students as they are first-year students.”.
The time of day participants graded may have affected their consistency, as someone’s most productive period can vary from person to person. Participant 5 stated, “I think time of day affected me the most [out of the environment, mood and time of day] because I’m more of an afternoon person”. Whereas, Participant 8 said, “Evening is less desirable for me, as I am more of a morning person”.
Many factors can affect an individual consistency when awarding grades for assessment. Whether that be the graders’ experience with the assignment, their programming experience, the time of day they graded, the environment they graded in or the mood they were in when graded could have impacted their consistency.
The graders’ experience impacts consistency most, as they have learnt standards and formed their own opinions on what makes code elegant, readable and well-documented. As these standards and opinions are generic for any assignment, the participants were more consistent with grading these aspects than grading correctness, where they have to learn the specificity of what makes a submission good for this specific assignment.
While the environment the graders were in, the time of day they graded or the mood they were in could all impact the consistency of their grading, they could all be easily mitigated by grading in the same place, at the same time, and recognising when the graders are not in the right mood to grade. However, these mitigations are not always feasible, as grading deadlines, teaching and academic commitments can all factor into when, where and the mood they are in when they grade.
Having more grading experience can lead to being more internally consistent when grading similar work. However, grading experience alone does not completely mitigate errors in consistency with experienced graders, especially when assessing subjective aspects, like documentation and readability. While summative assignments should be assessed by experienced graders, this is not always possible; a course may have an early-stage academic leading the course and assessment and preferred and experienced graduate teaching assistants may have graduated and left the institution and new graduate teaching assistants are asked to grade. These are just some factors where assignments may have to be assessed by inexperienced individuals.
6. Threats to Validity
6.1. Internal
One limitation of this study is that the participants knew it was a study that was not providing real grades and did not affect student outcomes. However, based on the interviews, many participants treated it as if they were marking for real, with many students opting to review their grades. The participants were aware that this was a study into grading consistency and, as such, may have altered their behaviour to maximise their internal consistency. While the participants may have altered their behaviour, our results still show significant inconsistency within their grades between a group of graders and when they graded an identical assignment later.
The rubric that was used in the original coursework provided generic descriptions for each grade, which may be less clear and well-defined than point-based rubrics that provide a detailed rubric and the points associated with each specific element. However, as the rubric was provided to the students when they originally submitted the coursework, we decided to mimic real-world assessment at our institution to provide an accurate insight into the consistency of assessment within this course.
We opted to provide only one identical submission in the second batch, which limits the validity of our evaluation of the internal consistency of human graders. We chose to only have one repeat to maximise the number of graded unique submissions, allowing for a more robust dataset when conducting future work. While only having one repeated assignment limits the validity of this part of our experiment, the results show that even with our small sample size, with each group of four graders grading a different duplicate, nearly all participants did not provide the same grade when grading the assignment a second time.
As we are using historical assignments from the CS1 programming course at our institution and many of our participants took that course during their undergraduate, there is a remote chance that the participants graded their own work. As these assignments were completely anonymised before undertaking this study, we could not tell if we asked the participants to mark their work. However, as the dataset of anonymised consists of over 600 submissions, the chances that one of the 272 graded submissions will be graded by its author is very low.
6.2. External
Our raw data and participants were all captured from one institution and one course, which could limit how these results can be applied to other institutions or courses. However, as assessment is such a core aspect of education and students’ prospects, we believe our results highlight a fundamental issue with how summative assessment is currently conducted. This is further supported by many institutions implementing rigorous assessment procedures to ensure that the assessment practices within their institutions are fair to all students.
7. Conclusion
Inconsistent grading can impact students throughout their education and their post-education opportunities. Receiving inconsistent grades can confuse many students about why they received a particular grade, especially when comparing their grades with those of their peers, and affect their progression through their degree, especially if they do not meet course prerequisites, as well as affecting their sense of justice (Nesbit and Burton, 2006). Post-education, inconsistent grading can affect a student’s career prospects, as many companies utilise degree classification or average grade in their hiring process (Stepanova et al., 2021).
Our study investigated the consistency of human grading by asking 28 participants to grade 272 authentic student assignments. We selected participants from our institution who were PhD or master’s students with more than 3 years of programming knowledge; previous grading experience was not a requirement. This selection of participants mimics the demographics of the teaching assistants who complete the grading at many institutions, especially those with large cohorts, where the individual module/class leaders can not feasibly grade the cohort in the required timeframe for feedback to be meaningful.
We split our 28 participants into groups of 4; each group graded the same 40 assignments in two batches of 20, with a two-week gap between them. To investigate the consistency of using multiple graders, we evaluated the inter-rater reliability using Krippendorf’s (Krippendorff, 2013), which factors the ordinal nature of grades by applying weights to the metric calculation. We found that our participants provided inconsistent grades across correctness, code elegance, readability and documentation, with the most consistent being correctness with an average and code elegance, readability and documentation all having an average – where an is required to draw tentative conclusions and an suggests acceptable consistency (Krippendorff, 2013). This indicates a very high level of inconsistency of grading between graders.
In addition to investigating the consistency of multiple graders, we analysed the individual graders’ self-consistency by duplicating one of the assignments in the first batch to the second batch with a different submission ID and measuring the difference between the grades they awarded in the first batch, and the grade they awarded in the second batch. Only one participant did not notice the duplicate assignment and graded consistently for all four skills. We found that an individual’s self-consistency was, on average, higher for the subjective elements under assessment, code elegance, readability and documentation, compared to correctness, which was more inconsistent. The average grade difference was 1.79 for correctness, and the subjective elements all had an average grade difference of less than 1.6.
We also captured where, when, and what mood the graders were in when they graded to investigate whether these factors affected the grader’s consistency. These factors were also discussed in a post-study interview, where we asked the participants if they noticed the duplicated submission. As our participants mostly graded in the office or at home, the environment had little impact on the consistency. However, our participants were more likely to report being impacted by the time of day they graded or the mood they were in while they were grading, as the time of day someone is productive varies from person to person. Many factors can affect a grader’s mood and grading, including other deadlines, frustration or boredom.
7.1. Implications for Human Grading
We have found that, in our study, typical graders are very inconsistent with each other and also are inconsistent with themselves. This suggests that current grading practices that use multiple assessors are likely to be quite unfair, which can lead to unfair outcomes for the students and demotivation among the students. Borela and Roy (2023) investigated using a workshop to train students in grading, and it may be that this is a necessary step to ensure fairness in grading.
We believe that our result warrants further consideration and investigation. Programming assignments are supposed to be relatively objectively judgeable and yet our research suggests that even with a shared rubric, inconsistency is the default outcome. This also lends support to the idea of investigating alternative grading approaches, such as those suggested by Decker et al. (2024) for making grading more equitable. They propose changing the grading scales (such as making them coarser) in order to speed up grading and reduce disputes about exact grading scores – although our study already uses a coarser scale than 0–100 and found inconsistency even on a coarser scale.
7.2. Implications for Automated Grading
Part of our motivation for conducting this study was to get a “gold standard” baseline human work in order to later investigate the accuracy of automated grading. However, our results suggest that the idea of a gold standard of human grading may be flawed, given that human graders cannot agree on the grade to give a piece of student work, even with themselves: inconsistency was high between and “within” individual graders. This has strong implications for the acceptability of automated grading. One could argue that automated grading (including AI-based grading) needs to be within the same range as human grading to be considered acceptable, and since the range for human grading is wide, automated grading is more likely to be considered sufficient. However, this is an unconvincing argument. Rather than using the weakness of human grading as a convenient, low bar for assessing auto-graders, we – as a teaching community – should recognise and address the serious problem and try to find ways to improve the fundamental practice of grading student assignments. Automated grading may or may not have a part in this. One of the contributions of this paper is a public release of our dataset, including the human grades, which can be used by all researchers for future work on automated grading.
7.3. Future Work
As assessment plays a crucial role in a student’s education and future career prospects, we recommend that further research be undertaken on how to improve the consistency of grading, whether that be investigating how the specificity of a rubric affects the consistency or use of alternative assessment approaches such as comparative judgement or automated assessment tools.
In the future, we plan on expanding on this work by evaluating the consistency of the feedback provided as part of this study, including the topics on which the assessors gave feedback and the quality of their feedback.
8. Data Availability
All our raw data and data analysis notebooks can be found on GitHub555Data analysis repository: https://anonymous.4open.science/r/Consistency_In_Grading_Analysis-AC73/README.md. The \anonMenagerie dataset, which includes all the anonymised student submissions and all the human grades gathered during this study, can be found on the Open Science Foundation666Menagerie: https://osf.io/q8jbt/.
Acknowledgements.
\anonWe thank the King’s College Teaching Fund for providing the funding necessary to undertake this research. We also thank Jeffery Raphael for providing the original data and Zara Lim and Nikolaj Jensen for anonymising the student assignments dataset. Finally, we thank Carlos Matos and Nuno Barreiro for their comments and ideas throughout the project and Mark Guzdial and Jarmoir Savelka for proofreading and commenting on the final draft.References
- (1)
- Ahoniemi et al. (2008) Tuukka Ahoniemi, Essi Lahtinen, and Tommi Reinikainen. 2008. Improving pedagogical feedback and objective grading. In Proceedings of the 39th SIGCSE Technical Symposium on Computer Science Education (Portland, OR, USA) (SIGCSE ’08). Association for Computing Machinery, New York, NY, USA, 72–76. https://doi.org/10.1145/1352135.1352162
- \anonMesser, Marcus and Brown, Neil and Kölling, Michael and Shi, Miaojing (2024) \anonMesser, Marcus and Brown, Neil and Kölling, Michael and Shi, Miaojing. 2024. How Consistent Are Human Graders? - Pre-registration. https://osf.io/3nc7p/?view_only=d37833bc919d4a1f96d0fa0dcd43b5c7
- Auvinen (2011) Tapio Auvinen. 2011. Rubyric. In Proceedings of the 11th Koli Calling International Conference on Computing Education Research (Koli, Finland) (Koli Calling ’11). Association for Computing Machinery, New York, NY, USA, 102–106. https://doi.org/10.1145/2094131.2094152
- Azcona and Smeaton (2020) David Azcona and Alan Smeaton. 2020. +5 Million Python & Bash Programming Submissions for 5 Courses & Grades for Computer-Based Exams over 3 academic years. https://doi.org/10.6084/m9.figshare.12610958.v1
- Barnes and Kölling (2006) David John Barnes and Michael Kölling. 2006. Objects First with Java: A practical introduction using BlueJ. Pearson/Prentice Hall, London, United Kingdom.
- Bloxham et al. (2016) Sue Bloxham, Birgit den Outer, Jane Hudson, and Margaret Price. 2016. Let’s stop the pretence of consistent marking: exploring the multiple limitations of assessment criteria. Assessment & Evaluation in Higher Education 41, 3 (2016), 466–481. https://doi.org/10.1080/02602938.2015.1024607 arXiv:https://doi.org/10.1080/02602938.2015.1024607
- Borela and Roy (2023) Rodrigo Borela and Nimisha Roy. 2023. Creating Equitable Grading Practices with Rubrics: A Teaching Assistant Training Activity. In Proceedings of the 2023 ACM Conference on International Computing Education Research - Volume 2 (Chicago, IL, USA) (ICER ’23). Association for Computing Machinery, New York, NY, USA, 26–27. https://doi.org/10.1145/3568812.3603485
- Brodley (2022) Carla E. Brodley. 2022. Why universities must resist GPA-based enrollment caps in the face of surging enrollments. Commun. ACM 65, 8 (jul 2022), 20–22. https://doi.org/10.1145/3544547
- Brown et al. (2014) Neil C. C. Brown, Michael Kölling, Davin McCall, and Ian Utting. 2014. Blackbox: A Large Scale Repository of Novice Programmers’ Activity. In Proceedings of the 45th ACM Technical Symposium on Computer Science Education (Atlanta, Georgia, USA). Association for Computing Machinery, New York, NY, USA, 223–228. https://doi.org/10.1145/2538862.2538924
- Castro (2017) Santiago Castro. 2017. Fast Krippendorff: Fast computation of Krippendorff’s alpha agreement measure. https://github.com/pln-fing-udelar/fast-krippendorff.
- de Freitas et al. (2023) Adrian de Freitas, Joel Coffman, Michelle de Freitas, Justin Wilson, and Troy Weingart. 2023. FalconCode: A Multiyear Dataset of Python Code Samples from an Introductory Computer Science Course. In Proceedings of the 54th ACM Technical Symposium on Computer Science Education V. 1. Association for Computing Machinery, New York, NY, USA, 938–944. https://doi.org/10.1145/3545945.3569822
- Decker et al. (2024) Adrienne Decker, Stephen H. Edwards, Brian M. McSkimming, Bob Edmison, Audrey Rorrer, and Manuel A. Pérez Quiñones. 2024. Transforming Grading Practices in the Computing Education Community. In Proceedings of the 55th ACM Technical Symposium on Computer Science Education V. 1 (Portland, OR, USA) (SIGCSE 2024). Association for Computing Machinery, New York, NY, USA, 276–282. https://doi.org/10.1145/3626252.3630953
- Doughty et al. (2024) Jacob Doughty, Zipiao Wan, Anishka Bompelli, Jubahed Qayum, Taozhi Wang, Juran Zhang, Yujia Zheng, Aidan Doyle, Pragnya Sridhar, Arav Agarwal, Christopher Bogart, Eric Keylor, Can Kultur, Jaromir Savelka, and Majd Sakr. 2024. A Comparative Study of AI-Generated (GPT-4) and Human-crafted MCQs in Programming Education (ACE ’24). Association for Computing Machinery, New York, NY, USA, 114–123. https://doi.org/10.1145/3636243.3636256
- Dunbar (2018) Sabine SS Dunbar. 2018. Consistency in grading clinical skills. Nurse Education in Practice 31 (2018), 136–142.
- Eicher and Joyner (2021) Bobbie Lynn Eicher and David Joyner. 2021. Components of Assessments and Grading At Scale. In Proceedings of the Eighth ACM Conference on Learning @ Scale (Virtual Event, Germany) (L@S ’21). Association for Computing Machinery, New York, NY, USA, 303–306. https://doi.org/10.1145/3430895.3460165
- Fisler (2014) Kathi Fisler. 2014. The Recurring Rainfall Problem. In Proceedings of the Tenth Annual Conference on International Computing Education Research (Glasgow, Scotland, United Kingdom). Association for Computing Machinery, New York, NY, USA, 35–42. https://doi.org/10.1145/2632320.2632346
- Fransella et al. (2004) Fay Fransella, Richard Bell, and Don Bannister. 2004. A manual for repertory grid technique. John Wiley & Sons.
- Gwet (2008) Kilem Li Gwet. 2008. Computing inter-rater reliability and its variance in the presence of high agreement. Brit. J. Math. Statist. Psych. 61, 1 (2008), 29–48. https://doi.org/10.1348/000711006X126600 arXiv:https://bpspsychub.onlinelibrary.wiley.com/doi/pdf/10.1348/000711006X126600
- Henderson et al. (2004) Charles Henderson, Edit Yerushalmi, Vince H. Kuo, Patricia Heller, and Kenneth Heller. 2004. Grading student problem solutions: The challenge of sending a consistent message. American Journal of Physics 72, 2 (02 2004), 164–169. https://doi.org/10.1119/1.1634963
- Hicks and Diefes-Dux (2017) Nathan M Hicks and Heidi A Diefes-Dux. 2017. Grader consistency in using standards-based rubrics. In 2017 ASEE Annual Conference & Exposition.
- Kane et al. (2008) David Kane, James Williams, and Gillian Cappuccini-Ansfield. 2008. Student Satisfaction Surveys: The Value in Taking an Historical Perspective. (7 2008), 135–155. Issue 2. https://doi.org/10.1080/13538320802278347
- Kay (2022) Jennifer S. Kay. 2022. Peer Grading Without Protest: The SPARK Approach to Summative Peer Assessment. In Proceedings of the 53rd ACM Technical Symposium on Computer Science Education - Volume 1 (Providence, RI, USA) (SIGCSE 2022). Association for Computing Machinery, New York, NY, USA, 119–125. https://doi.org/10.1145/3478431.3499284
- Krippendorff (2013) Klaus Krippendorff. 2013. Content analysis : an introduction to its methodology (3rd ed. ed.). SAGE, Los Angeles ;.
- Lehman et al. (2021) Kathleen J. Lehman, Julia Rose Karpicz, Veronika Rozhenkova, Jamelia Harris, and Tomoko M. Nakajima. 2021. Growing Enrollments Require Us to Do More: Perspectives on Broadening Participation During an Undergraduate Computing Enrollment Boom. In Proceedings of the 52nd ACM Technical Symposium on Computer Science Education (Virtual Event, USA) (SIGCSE ’21). Association for Computing Machinery, New York, NY, USA, 809–815. https://doi.org/10.1145/3408877.3432370
- Liao et al. (2017) Soohyun Nam Liao, William G. Griswold, and Leo Porter. 2017. Impact of Class Size on Student Evaluations for Traditional and Peer Instruction Classrooms. In Proceedings of the 2017 ACM SIGCSE Technical Symposium on Computer Science Education (Seattle, Washington, USA) (SIGCSE ’17). Association for Computing Machinery, New York, NY, USA, 375–380. https://doi.org/10.1145/3017680.3017764
- McManus et al. (2006) IC McManus, M. Thompson, and J. Mollon. 2006. Assessment of examiner leniency and stringency (’hawk-dove effect’) in the MRCP(UK) clinical examination (PACES) using multi-facet Rasch modelling. BMC Medical Education 6, 1 (2006), 42. https://doi.org/10.1186/1472-6920-6-42
- Messer et al. (2024) Marcus Messer, Neil C. C. Brown, Michael Kölling, and Miaojing Shi. 2024. Automated Grading and Feedback Tools for Programming Education: A Systematic Review. ACM Trans. Comput. Educ. 24, 1, Article 10 (feb 2024), 43 pages. https://doi.org/10.1145/3636515
- Migut and Wiersma (2020) Gosia Migut and Ruben Wiersma. 2020. Are We Consistent? The Effects of Digitized Exams Grading. In Proceedings of the 51st ACM Technical Symposium on Computer Science Education (Portland, OR, USA) (SIGCSE ’20). Association for Computing Machinery, New York, NY, USA, 1338. https://doi.org/10.1145/3328778.3372630
- Mirza et al. (2019) Diba Mirza, Phillip T. Conrad, Christian Lloyd, Ziad Matni, and Arthur Gatin. 2019. Undergraduate Teaching Assistants in Computer Science: A Systematic Literature Review. In Proceedings of the 2019 ACM Conference on International Computing Education Research (Toronto ON, Canada) (ICER ’19). Association for Computing Machinery, New York, NY, USA, 31–40. https://doi.org/10.1145/3291279.3339422
- Mustapha et al. (2016) Aida Mustapha, Noor Azah Samsudin, Nurieze Arbaiy, Rozlini Mohammed, and Isredza Rahmi Hamid. 2016. Generic Assessment Rubrics for Computer Programming Courses. Turkish Online Journal of Educational Technology - TOJET 15 (1 2016), 53–68. Issue 1.
- Nesbit and Burton (2006) Paul L. Nesbit and Suzan Burton. 2006. Student justice perceptions following assignment feedback. Assessment & Evaluation in Higher Education 31, 6 (2006), 655–670. https://doi.org/10.1080/02602930600760868 arXiv:https://doi.org/10.1080/02602930600760868
- Passonneau et al. (2023) Rebecca J. Passonneau, Kathleen Koenig, Zhaohui Li, and Josephine Soddano. 2023. The Ideal versus the Real Deal in Assessment of Physics Lab Report Writing. European Journal of Applied Sciences 11, 2 (Apr. 2023), 626–644. https://doi.org/10.14738/aivp.112.14406
- Reddy and Andrade (2010) Y. Malini Reddy and Heidi Andrade. 2010. A review of rubric use in higher education. Assessment & Evaluation in Higher Education 35, 4 (2010), 435–448. https://doi.org/10.1080/02602930902862859
- Riese (2018) Emma Riese. 2018. Teaching Assistants’ Experiences of Lab Sessions in Introductory Computer Science Courses. In 2018 IEEE Frontiers in Education Conference (FIE). 1–5. https://doi.org/10.1109/FIE.2018.8659243
- Riese et al. (2021) Emma Riese, Madeleine Lorås, Martin Ukrop, and Tomáš Effenberger. 2021. Challenges Faced by Teaching Assistants in Computer Science Education Across Europe. In Proceedings of the 26th ACM Conference on Innovation and Technology in Computer Science Education V. 1 (Virtual Event, Germany) (ITiCSE ’21). Association for Computing Machinery, New York, NY, USA, 547–553. https://doi.org/10.1145/3430665.3456304
- Singh et al. (2017) Arjun Singh, Sergey Karayev, Kevin Gutowski, and Pieter Abbeel. 2017. Gradescope: A Fast, Flexible, and Fair System for Scalable Assessment of Handwritten Work. In Proceedings of the Fourth (2017) ACM Conference on Learning @ Scale (Cambridge, Massachusetts, USA) (L@S ’17). Association for Computing Machinery, New York, NY, USA, 81–88. https://doi.org/10.1145/3051457.3051466
- Soloway (1986) E. Soloway. 1986. Learning to Program = Learning to Construct Mechanisms and Explanations. Commun. ACM 29, 9 (1986), 850–858. https://doi.org/10.1145/6592.6594
- Stepanova et al. (2021) Anna Stepanova, Alexis Weaver, Joanna Lahey, Gerianne Alexander, and Tracy Hammond. 2021. Hiring CS Graduates: What We Learned from Employers. ACM Trans. Comput. Educ. 22, 1, Article 5 (oct 2021), 20 pages. https://doi.org/10.1145/3474623
- Wongpakaran et al. (2013) Nahathai Wongpakaran, Tinakon Wongpakaran, Danny Wedding, and Kilem L. Gwet. 2013. A comparison of Cohen’s Kappa and Gwet’s AC1 when calculating inter-rater reliability coefficients: a study conducted with personality disorder samples. BMC Medical Research Methodology 13, 1 (2013), 61. https://doi.org/10.1186/1471-2288-13-61
- Wright (1977) Benjamin D. Wright. 1977. Solving Measurement Problems with the Rasch Model. Journal of Educational Measurement 14, 2 (1977), 97–116.
Appendix A Further Details on the \anonMenagerie dataset
A.1. Data Processing
This project was a small-group project, with students in groups of two (or rarely three). Each student was required to submit a copy of the assignment, so all submissions were duplicated at least once. We first generated hashes to remove these duplicated assignments.
Additionally, we manually reviewed potential duplicates based on the number of classes and the number of source lines of code; if they were identical, the copy was removed. After removing the duplicates, we extracted the students’ submissions and removed unnecessary files, such as IDE property files and .class files.
To anonymise the dataset, we automatically removed the JavaDoc @author tag lines in all classes. The @author tag is typically used to identify who wrote the class and would be the most likely place for a student’s name or identification number to appear in the code. To verify that no further personally identifiable information was left in the source code and to minimise duplicated submissions, we generated a list of changes made by the student compared to the template code. Multiple research assistants then used the list of changes to review the submitted code and remove any remaining personally identifiable information. Our data anonymisation approach limits the potential for students to be identified from the anonymised submission while retaining all other information.
During the anonymisation process, we found that many projects opted to include image files as part of their project. As these cannot be removed as they would interfere with how the submission is executed and cannot be anonymised easily, we opted to replace all images with equivalently sized black images.
A.2. An In-Depth Example Submission
To give a specific example of an assessment submission, we picked submission 189, which is median-sized regarding the number of classes implemented and the number of code source lines, with 19 classes and 1345 source lines of code. Figure 22 is the final UML of the submission and, by comparison to Figure 1, shows that the students significantly expanded on the template project.
To complete the tasks, as defined in section 3.1.1, the students implemented the five species, with at least two being prey and at least two being predators, using inheritance and abstract classes to implement shared functionality. All of the five species classes inherit from the Animal class, with the prey and predators inheriting the Animal class indirectly through their parent classes, Prey and Predator respectively (which were not present in the original code, and have been added as part of the object-oriented design by the students). Both the Fox and Hawk species compete for Voles and Frogs, and Frogs hunt for Crickets by implementing the abstract method hunt from the Predator class and using instanceof to validate if the adjacent locations contain one of the prey.
To distinguish between male and female animals, the students added a boolean field and a function to randomly assign male or female in the Animal class. In each species class, the students added functions to validate whether the two members of the same species were adjacent and of opposite genders. If so, they add a new animal to a space in the two-dimensional array.
To incorporate the time of day into their submission, the students added fields hour, day and dayNightStatus to the Simulator class, and a isDay field to the Field class. The Cricket is the only species with different actions during the day or night. During the day and night, the Cricket’s age increases, and they handle the disease, as explained later in this section, and at night they also propagate.
For the challenge tasks, the students implemented all three suggestions outlined in section 3.1.1. To simulate the lifecycle of plants, the students added an abstract Plant class and concrete class BambooPlant. The plant propagated based on a probability to produce seeds and was food for the Panda class, which inherited directly from the Animal class.
The students implemented the four seasons to implement weather, which changed every 90 time steps. The BambooPlant has different functionality depending on the season. In the spring, it gets water, grows, and spreads, whereas in the winter, it loses water and does not grow or spread.
Finally, the students implemented a disease that affects all animals by adding an isInfected, probability of infection and death fields, and functions to catch, spread and check if the animal is infected to the Animal class. These functions were called as part of each animal’s act methods, which were responsible for simulating each object at each time step.
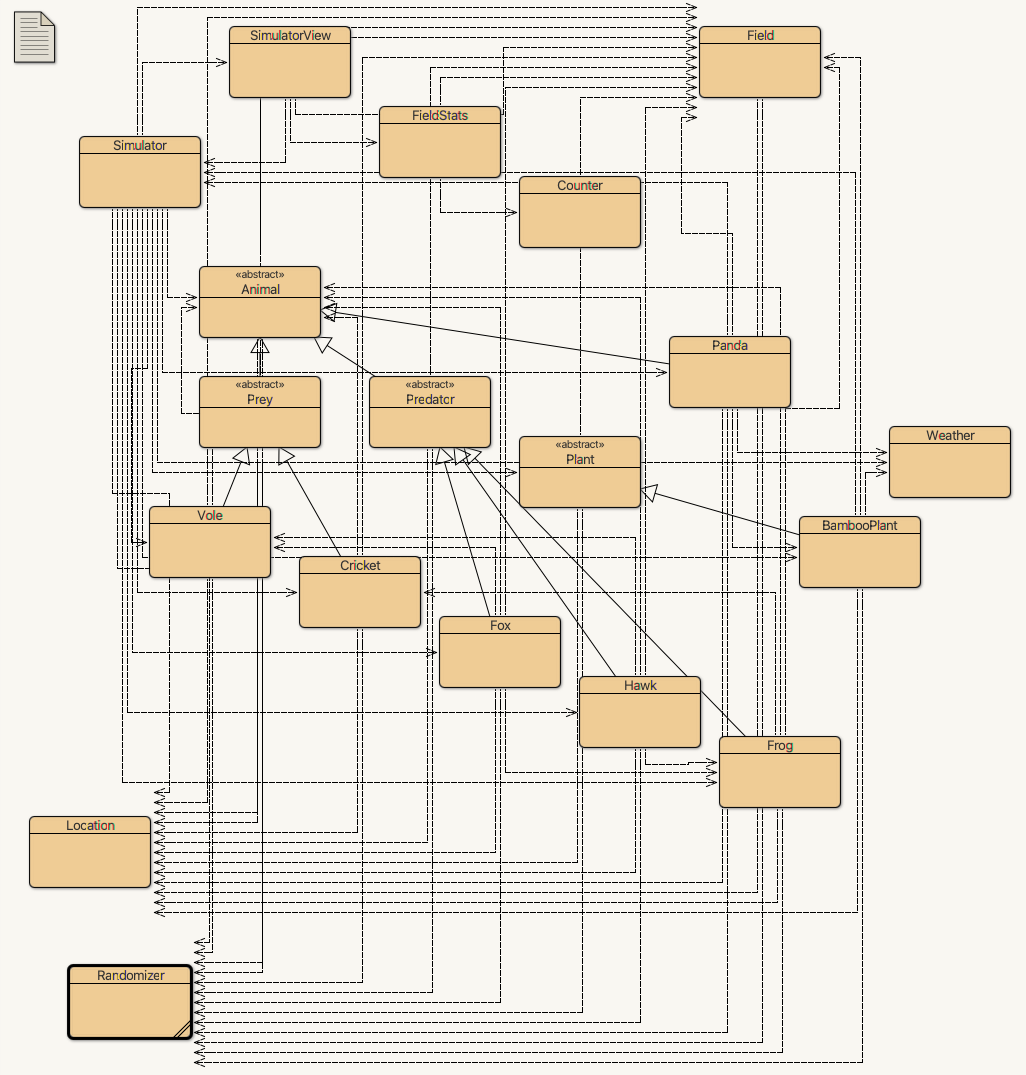
Appendix B Grades Per Assignment
This section shows all our results for the minimum, maximum and mean grade per group and per skill:
-
•
Figure 23 shows the minimum, maximum and mean grades for each of the seven groups when grading correctness.
-
•
The mean, maximum, and minimum grades for each of the seven groups when grading code elegance are displayed in Figure 24.
-
•
Figure 25 shows the minimum, maximum and mean grades for each of the seven groups when grading readability.
-
•
The mean, maximum, and minimum grades for each of the seven groups when grading documentation are displayed in Figure 26.