1Novartis Pharmaceuticals Corporation, East Hanover, NJ, USA
2School of Biomedical Informatics
The University of Texas Health Science Center at Houston, Houston, TX, USA
3Novartis Pharma AG, Basel, Switzerland
4Novartis Pharmaceuticals Corporation, Cambridge, MA, USA
5Department of Radiation Oncology
The University of Texas MD Anderson Cancer Center, Houston, TX, USA
Using Large Language Models to Generate Clinical Trial Tables and Figures
*Correspondence to: Gen Zhu, gen.zhu@novartis.com
Abstract
Tables, figures, and listings (TFLs) are essential tools for summarizing clinical trial data. Creation of TFLs for reporting activities is often a time-consuming task encountered routinely during the execution of clinical trials. This study explored the use of large language models (LLMs) to automate the generation of TFLs through prompt engineering and few-shot transfer learning. Using public clinical trial data in ADaM format, our results demonstrated that LLMs can efficiently generate TFLs with prompt instructions, showcasing their potential in this domain. Furthermore, we developed a conservational agent named “Clinical Trial TFL Generation Agent”: An app that matches user queries to predefined prompts that produce customized programs to generate specific pre-defined TFLs.
1 Introduction
In the pharmaceutical industry, submission of a clinical study report (CSR) is part of the drug approval process with health authorities. CSRs are highly standardized: For example, ICH (International Council for Harmonisation of Technical Requirements for Pharmaceuticals for Human Use) provides a guideline about the structure and content of the CSR (E3 Structure and Content of Clinical Study Reports — FDA). In the CSR, tables, figures and listings (TFLs) are the essential elements for summarizing clinical trial data, including, for example, summaries of demographic data, efficacy and safety results. Importantly, all analyses and TFLs that summarize outcomes are pre-specified from the protocol and statistical analysis plan through a set of highly detailed documents that are produced before any data are collected. Data shown in each TFL is pre-determined and traceable to data collection, and the layout of TFLs is specified via TFL shells – mockup versions of the table or figure that explicitly determine formatting, labels and footnotes. Once data have been collected, the industry practice to populate the TFLs is based on the data in Study Data Tabulation Model (SDTM ) and Analysis Data Model (ADaM) formats which are introduced in 2006 by the Clinical Data Interchange Standards Consortium (CDISC) as data standards for drug submissions (CDISC ADaM)cdisc_adam.
To implement TFLs, statisticians and statistical programmers need to prepare and validate statistical programs from a data & variable specification/data dictionary and a TFL shell that specifies the layout and calculation of each table or figure or listing. Once these programs and outputs are validated, they can be included in the clinical study report (CSR). This workflow ensures consistency, accuracy, and comprehensibility of the trial data, ensuring effective and un-biased analysis and interpretation. It critically relies on skilled statisticians and programmers to produce each TFL output and is time-consuming due to the large number of outputs, as well as complexity introduced by study-specific pre-specifications, such as specific custom variable mappings, counts and visual representations. Recent advances in large language models (LLMs) have demonstrated substantial potential to accelerate applications that involve text generation, classification, and natural language understandingluo2022biogpt, yang2022large, zhu2021twitter. Such LLMs have already shown power in many fieldswu2023bloomberggpt, shin2020biomegatron, fan2024advanced; their applications in clinical trials have been particularly promising, with LLMs being employed to assist in various tasks, such as the classification of clinical trial eligibility criteria and the extraction of relevant medical information from unstructured data sources. Some research focuses on using language models to extract the eligibility criteria from clinical trial protocolsyang2023text, yang2024exploring, while others explore using these models to assess patients’ eligibility from electric health record (EHR)juhn2020artificial, zeng2018natural. As LLMs have also been successfully applied to link natural language specifications and program code – e.g. by generating programs or test casesjiang2024survey, using LLMs for statistical programming has received much attention recentlycoello2024effectiveness, impact_ai_cs_education.
In our work, we investigated the use of LLMs for generating TFLs for clinical trial data analysis. We focused on table and figure generation (a listing can be treated as a table) from tabular data. Tabular data are different in structure from the text datasets that LLMs are typically used and trained with. Integrating LLMs into the TFLs generation from tabular data is not straightforward, as the ability to understand table structure and analyze tables using LLMs has not been explored as thoroughly as work with plain textzhang2024survey, lu2024large, sui2024table. Different from plain text documents, tables are structured with complex interrelations between rows and columns. Previously, table reasoning tasks such as table-based question answeringiyyer2017search, table-based fact verificationchen2019tabfact and table-to-textwang2021tuta were often tackled by pre-training or fine-tuning neural language models. Recent development of LLMs provide potential to solve these tasks with higher accuracyzhang2024survey, lu2024large, sui2024table. Our TFL use case presented the additional challenge of table-to-table/figure tasks, which may require advanced data manipulation and data analysis. A critical aspect of working with tabular data is enabling the model to understand the relationships between rows and columns, which is essential for accurate data interpretation. Three primary LLM-based approaches from the literature may provide solutions to our problem: 1) fine-tuning open-source LLMs with labeled data; 2) prompting LLMs directly by taking advantage of LLMs’ reasoning ability; 3) developing an LLM-based agent that can be integrated with other computing tools such as Pythonlu2024large, zha2023tablegpt, zhang2023tablellama. In our study, we only considered the second and third approaches.
This work focused on leveraging LLM-based approaches to automate the generation of TFLs that are guided in ICH E3 (E3 Structure and Content of Clinical Study Reports — FDA). More specifically, we investigated the use of LLMs to reproduce the outputs from the CDISC pilot dataset, an open-source dataset for testing tools and methods for clinical trial reporting and analysisatorus_research_cdisc_pilot_replication. We considered demographic summaries, baseline calculations, and efficacy summaries at different endpoints. More details about the approaches and data are discussed in the Methods section. The Evaluation and Results section discusses the performance of our approach and introduces an app based on the outputs generated by AI that can serve as an example for how this approach may be operationalized. Limitations and future development ideas are discussed at the end.
2 Method
2.1 Data Description
The data in our study is from the CDISC Pilot replication Github repository which aims to reproduce the table outputs within the CDISC Pilot Project using the PHUSE Test Data Factory project’s dataphuse_test_dataset_factory. This dataset has been used to demonstrate new analytical methods and tools for clinical studies, for example, utilizing open-source software tools such as the R programming languageatorus_research_cdisc_pilot_replication.
We started with datasets in ADaM format and aimed to produce TFL outputs from these. The goals of starting with the ADaM data format include easier and more efficient data review, replication, and output generation. The homogeneity of column names in the ADaM format simplifies the expansion to various trials in the future. The data used to generate the table results include the following datasets adhering to CDISC standards: adsl, adadas, adcibc, and adnpix. These datasets provide a comprehensive overview of the clinical trial, covering various dimensions of patient information and assessments on a subject level. The adsl dataset gives subject-level data with one record per subject, capturing demographics, treatment arms, and key study-specific attributes. In addition, adlb, adadas, adcibc, and adnpix provide data on visit-based assessments, offering detailed insights into cognitive function, clinician impressions, and neuropsychiatric symptoms, respectively. Together, these datasets allow for an in-depth analysis of treatment efficacy and patient outcomes throughout the trial. In order to derive summaries for TLF outputs, we typically subset some of these datasets to a specific set of events, visits or variables, joined with adsl for subject-level summaries and then produced listings or counts.
Our method involved leveraging LLMs as agents to generate Python code based on specific prompts or tasks related to data analysis. While R and Python are both among the commonly-used open-source statistical programming languages in the pharmaceutical setting, LLMs have been shown to yield executable code more often for Python than for Rbuscemi2023comparative. SAS is also a commonly used statistical programming language, however it is proprietary. The model interprets the user’s input, understands the task requirements, and generates the corresponding Python code by calling the LLM API. Once the code is generated, it is automatically executed in a Python interpreter with access to the input datasets to produce the results. This approach streamlines the data analysis process and allows incremental experimentation with the outputs by generating code and output simultaneously. Being able to inspect both code and output helps us to ensure accuracy and transparency in the analysis. Notably, we also experimented with prompting without the intermediate code generation step, having the model populate, e.g., table shells directly. However, we found that the accuracy of the table results was too low to pursue this solution further.
2.2 Prompts Design
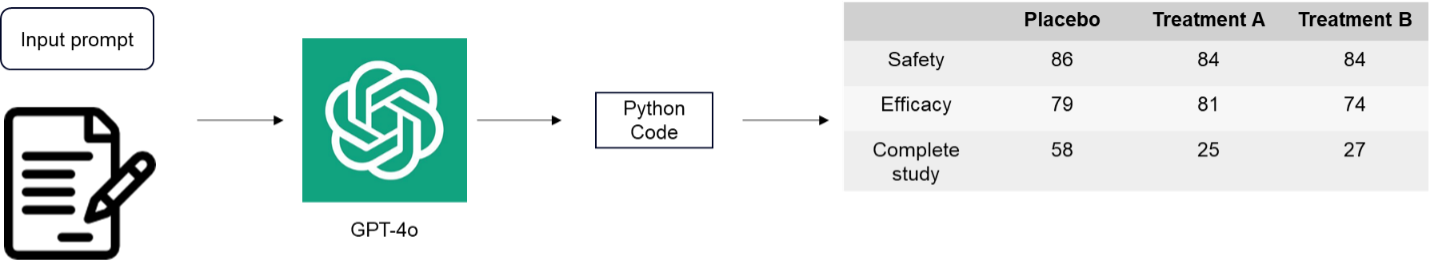
LLMs have been shown to be sensitive to the format of promptszhao2021calibrate, lu2021fantastically, liu2024large. In our approach, we provided three key components to the model: the system prompt, the user prompt, and a few-shot coding examples. The system prompt defines the model’s scope of work; in our case, we set it as, “You are a statistical programming assistant,” to focus the model’s responses on statistical analysis tasks. The user prompt contains detailed instructions to guide the model, including filtering relevant columns, categorizing data by treatment groups, performing counting calculations, and computing specific statistical measurements such as mean, median, standard deviation (SD), and range. More details on these instructions can be found in table 1.
Additionally, we included some Python code examples in the prompt to help the model understand how to read different formats of inputs files and convert byte strings to regular strings. We also instructed the model to avoid printing intermediate steps and instead directly generate the desired Python code, execute it automatically, and then display the final result. The first prompt was designed to generate Python code to calculate the summary statistics for each treatment arm, with the results shown in Figure 2. The second prompt was intended to generate Python code for plotting the Kaplan-Meier curve for time to the first dermatologic event, with the results displayed in Figure 3. Both sets of generated code matched the manually coded results with 100% accuracy.