Personalized Speech Emotion Recognition in Human-Robot Interaction using Vision Transformers
Abstract
Emotions are an essential element in verbal communication, so understanding individuals’ affect during a human-robot interaction (HRI) becomes imperative. This paper investigates the application of vision transformer models, namely ViT (Vision Transformers) and BEiT (BERT Pre-Training of Image Transformers) pipelines, for Speech Emotion Recognition (SER) in HRI. The focus is to generalize the SER models for individual speech characteristics by fine-tuning these models on benchmark datasets and exploiting ensemble methods. For this purpose, we collected audio data from different human subjects having pseudo-naturalistic conversations with the NAO robot. We then fine-tuned our ViT and BEiT-based models and tested these models on unseen speech samples from the participants. In the results, we show that fine-tuning vision transformers on benchmark datasets and and then using either these already fine-tuned models or ensembling ViT/BEiT models gets us the highest classification accuracies per individual when it comes to identifying four primary emotions from their speech: neutral, happy, sad, and angry, as compared to fine-tuning vanilla-ViTs or BEiTs.
Index Terms:
Speech Emotion Recognition, Vision Transformers, Human-Robot InteractionI Introduction
The increasing integration of social robots across various sectors, from healthcare to customer service, underscores their potential to revolutionize human-machine interactions [1, 2, 3, 4]. A crucial factor in their success lies in their ability to perceive and respond appropriately to human emotions, facilitating meaningful and engaging interactions [2, 5]. In this context, SER emerges as a critical field within human-computer interaction [6]. By enabling machines to understand and respond to the emotional nuances embedded in human speech (affective speech), SER can transform our interactions with technology, fostering more natural and empathetic communication [6]. When social robots can accurately interpret affective speech, they can adapt their behavior and responses, leading to more personalized and impactful human interactions [2]. This emotional connection ability holds tremendous potential for enhancing the effectiveness and acceptance of social robots in various real-world applications.
The importance of affective speech in human-robot interaction (HRI) lies in its ability to enhance the robot’s social intelligence and facilitate natural communication [6, 7]. Emotions play a fundamental role in human interactions. By understanding and responding to affective cues, robots can build trust, rapport, and cooperation with their human counterparts [8]. Affective speech recognition capability enables social robots to accurately perceive the emotional state of the user, allowing them to tailor their responses and provide appropriate support or feedback [9].
The area of Speech Emotion Recognition (SER) has witnessed significant advancements over time, driven by the exploration of diverse feature extraction methods and suitable machine learning techniques. Early research focused on traditional approaches like Mel-frequency spectral coefficients (MFCCs) and prosodic features, laying the groundwork for subsequent extensions and improvements [10, 11, 12]. The emergence of deep learning further matured the area, with models like DNNs, RNNs, and CNNs demonstrating improved capabilities in capturing emotional nuances from speech [13, 14, 15].
Recent advancements in computer vision, particularly with the emergence of Vision Transformers (ViTs), have opened up new possibilities for leveraging visual data in SER [16]. ViTs, originally designed for image classification tasks, have demonstrated exceptional performance in capturing spatial dependencies and global contextual information [17, 18]. Their ability to model long-range dependencies and extract high-level features makes them well-suited for analyzing visual representations of speech, such as spectrograms [19]. The application of ViTs in SER is still an emerging field, and several research directions warrant further exploration.
In this work, we evaluate vision transformer based models for speech emotion recognition. To the best of our knowledge, this work is one of the earliest in the literature to evaluate vision transformer based models for speech emotion recognition in pseudo-naturalistic verbal communications in HRI. This evaluation of ViT based models has been done for modeling the individual characteristics in SER. This means, given a set of audio clips from an individual with labelled emotions (here neutral, happy, sad, and angry), we can predict the speech emotion of that individual for a different set of sentences spoken during a one-to-one HRI. To support our claim, we collect data from human participants an engage them in a pseudo-naturalistic conversation with the robot (explained more in section III-A).
This paper makes the following contributions:
-
•
To the best of our knowledge, this work is among the first/earliest to investigate vision transformer-based models (both ViT and BEiT) for SER in the context of pseudo-naturalistic verbal HRi.
-
•
We show that personalization of SER models can be done by fine-tuning ViT and BEiT models on benchmark datasets and then fine-tuning on participant data and/or ensembling these vision transformer models.
-
•
Lastly, we also achieve SOTA performance on some benchmark datasets by a full fine-tuning of the vision transformer-based models.
This paper has been arranged in the following manner: Section II outlines the background literature supporting this work. Section III descibes the methodology, which includes the data acquisition (Section III-A), description about mel-spctrograms (Section III-B), datasets used (Section III-C), and problem formulation (Section III-D). This is followed by Section IV, which discusses the results we obtained, and followed by the conclusion in Section VI.
II Related Works
The evolution of Speech Emotion Recognition (SER) has been marked by a continuous exploration of increasingly sophisticated techniques, each building upon the foundations laid by its predecessors. Early research in SER relied heavily on traditional approaches, such as Mel-frequency cepstral coefficients (MFCCs) and prosodic features [10, 11, 12]. MFCCs, derived from the human auditory system’s response to sound, capture spectral characteristics crucial for distinguishing various speech sounds, while prosodic features like pitch, intensity, and duration provide insights into the emotional tone of speech. These handcrafted features, though valuable, often struggled to capture the subtle and complex interplay of acoustic cues that contribute to emotional expression.
The advent of deep learning revolutionized the field of SER, offering a powerful framework for automatically learning intricate patterns and representations from raw speech data. Deep Neural Networks (DNNs), with their multiple layers of interconnected nodes, enabled the extraction of high-level features that better captured the subtle nuances of emotional speech [13]. Recurrent Neural Networks (RNNs), particularly Long Short-Term Memory (LSTM) networks, proved adept at modeling the temporal dynamics of speech, crucial for understanding the evolution of emotions over time [14]. Convolutional Neural Networks (CNNs), originally designed for image processing, demonstrated their effectiveness in capturing local patterns and spatial dependencies in spectrograms, further enhancing SER performance [15].
The authors in [20] proposed to use CNN and RNN pipelines along with data augmentation techniques to improve the robustness of these models. This robustness was crucial for a human-robot interaction scenario with robot’s ego noise. Further, the authors in [21] propose a machine learning pipeline for SER. Their approach involves using personalized and non-personalized features for SER. However, neither of these papers contributes to evaluating transformer-based architectures, which are currently state-of-the-art (SOTA) in numerous fields of study [19].
A number of benchmark datasets have been developed for SER that capture speaker characteristics owing to the number of actors involved for generating the data. More information about these datasets have been discussed in Section III-C. Owing to this large number of datasets, numerous approaches have been proposed in the literature. Even with transformer-based architectures, limited work has been shown in the SER literature. The authors in [22] show the highest performance on the Ryerson Audio-Visual Database of Emotional Speech and Song (RAVDESS) [23] (described more in Section III-C), using a pre-trained xlsr-Wav2Vec2.0 transformer. A more recent transformer-based approach includes the work by the authors in [24] where they used a Whisper-based speech emotion recognition. Other attention mechanism-based approaches for the RAVDESS dataset include [25]. For the Toronto emotional speech set (TESS) [26], authors in [27] tested the accuracies for SER tasks using a vision-transformer-based architecture. These transformers-based approaches have also been evaluated on the Crowd Sourced Emotional Multimodal Actors Dataset (CREMA-D) [28, 29]. The authors in [29] tested their approach called the improVed emotion-specific pre-trained encoder (Vesper) on benchmark datasets like Multimodal EmotionLines Dataset (MELD) and Interactive Emotional Dyadic Motion Capture (IEMOCAP) database in addition to the CREMA-D. Further, the authors in [30] approach to use Acoustic Word Embeddings (AWEs) to push the classification accuracies on the Emotional Speech Database (ESD) and IEMOCAP.
However, the literature on SER and the datasets available have not been extensively leveraged to model speaker characteristics in a one-to-one human-robot situation using these SOTA transformer architectures.
III Methodology
III-A Data Acquisition
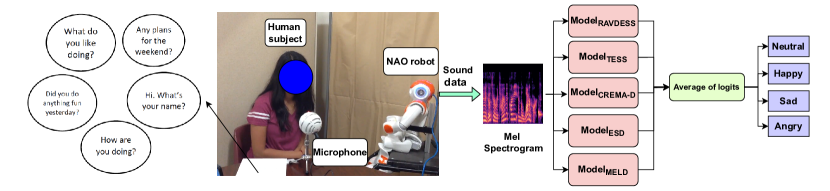
Six neurotypical adults were recruited to participate in a human-robot interaction study to classify their speech into four primary emotions. This one-to-one HRI involves two-way communication between the robot and the participants. Each participant asks pre-defined questions as shown in Figure 1. The robot responds with appropriate answers to those questions and asks those questions back to the participant. The participants’ replies are not pre-defined. They were asked to reply to the robot’s questions with short answers. For each of these question-and-answer pairs, each participant was asked to speak in an emotional tone depicting one of the four primary emotions, i.e., neutral, happy, sad, and angry. The voices of the participants were recorded during this pseudo-natural human-robot interaction where the questions that the participant asks were pre-defined but their answers weren’t.
III-B Mel Spectrogram
In this paper, since we are using vision based models, we convert the sound signals to 2D images. This is where we leverage the use of mel spectrograms. The mel spectrogram is used usually for better perception of sounds by humans. Considering as the normal frequency, the frequency on the mel scale () will be given by [31, 32, 33]:
| (1) |
As can be seen form equation 1, the mel scale is a logarithmic scale to convert the frequency of the sounds from Hz to mels. The audio signal first goes through a fast Fourier transform performed on overlapping signal segments. These frequencies are converted to the log scale and the amplitude is converted to decibels to make the color dimension as shown in Figure 1.
III-C Datasets
| Datasets | |||||
|---|---|---|---|---|---|
| Emotion | RAVDESS | TESS | CREMA-D | ESD | MELD |
| Neutral | 96 | 359 | 1087 | 3500 | 6527 |
| Happy | 192 | 350 | 1271 | 3500 | 2416 |
| Sad | 192 | 352 | 1271 | 3500 | 917 |
| Angry | 192 | 370 | 1271 | 3510 | 1560 |
For fine-tuning our vision transformer-based models, we use four benchmark datasets from the literature.
-
•
RAVDESS [23]: This dataset has 1440 files containing data from 24 actors making sixty trials each. These actors cover seven emotions: calm, happy, sad, angry, fearful, surprise, and disgust. All of these emotions are deliberately displayed in the speech characteristics of each of the actors by speaking two sets of sentences, each with these seven emotional traits.
-
•
TESS [26]: TESS contains data from two actresses aged 26 and 64 years. Each of the actresses speak pre-defined sentences in different ways so as to create a total of 2800 stimuli. These cover seven emotions: happiness, sadness, fear, pleasant surprise, anger, disgust, and neutral.
-
•
CREMA-D [28]: This dataset captures six different emotions: happy, sad, neutral, anger, disgust, and fear. These stimuli were created by 91 actors generating a total of 7442 clips.
-
•
ESD [34] : This dataset captures the speakers’ emotions for five emotional classes: neutral, happiness, anger, sadness, and surprise. These emotional stimuli were recorded by 20 speakers, 10 of whom were native English speakers.
-
•
MELD [35] : It is a multiparty multimodal dataset that captures speakers’ emotions from the TV-series Friends. This dataset captures emotions in both continuous and discrete ways. Among the discrete emotions, it captures seven emotions: anger, disgust, sadness, joy, neutral, surprise, and fear.
For all of these datasets, we have used only four emotion classes that are common between these four datasets, i.e., neutral, happiness, sadness, and anger. In addition to it, we used only ten actors for the ESD dataset who were native English speakers.

III-D Problem Formulation and Proposed Pipeline
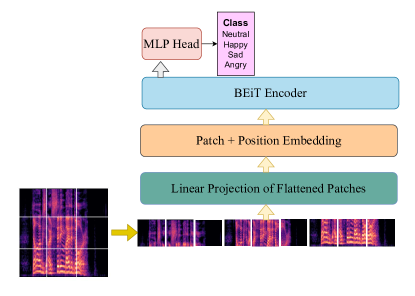
For each of the datasets used, we generate mel-spectrograms of the speech data. Given a set of mel-spectrograms extracted from the speech data, the task is to classify each spectrogram into one of four emotion categories: neutral, happy, sad, and angry. Each spectrogram, , where , , and is the index of the datapoint, is passed through two pipelines (see Figure 2) to evaluate the performance of vision transformers for speech emotion recognition tasks. Here , represent the height, width, and the number of channels of the image respectively.
The formulation of both of these pipelines remains the same with the only difference of using a pre-trained base ViT encoder (vit-base-patch16-224) for the first pipeline (see Figure 2a) whereas using a base BEiT encoder (microsoft/beit-base-patch16-224-pt22k-ft22k) for pipeline 2 (shown in Figure 2b) [17, 18]. Each image is first divided into patches, , where P = 16 is the dimension of the image patch. So the output of the linear projection layer, , where is the number of patches. The patch and position embedding is then done using:
| (2) |
| (3) |
where LN(.) is the layer normalization layer and pos_embed is the position embedding added to each vector at the end of the linear projection layer. Then the values in the sequence are weighted through learnable matrices: query (q), key (k), and value (v) to calculate self-attention given by the authors in [19, 17]:
| (4) |
where, are learnable matrices. Then the self-attention is calculated as:
| (5) |
So, the multihead attention, which is the multiple self attention operations in parallel heads can be expressed as [19, 17]:
| (6) |
where, , is the dimension of each head, is the number of attention heads, and is the dimension of the transformer model. The output of the transformers encoder is given by:
| (7) |
where MLP(.) is the multilayer perception.
IV Results and Discussion
We evaluate both the ViT (Figure 2a) and the BEiT (Figure 2b) pipelines in two ways:
-
•
Approach 1: In this approach, we train the individual ViTd and BEiTd models, where . We split each of the datasets, into and . Then we train separate ViTd and BEiTd models, individually for each of these datasets. Since we have a four class classification problem of classifying the mel spectrograms into four primary emotions, we use cross entropy loss.
-
•
Approach 2: In this we combine the datasets together:
(8) and then fine-tune a ViTmix and a BEiTmix model on this mix training set .
We perform full fine-tuning of our models on two A5000 GPUs, using K-Fold-Cross validation (f-fold-cross-validation in our case) with a constant learning rate of . Further, we evaluate the performance of both pipelines for both Approach 1 and 2 using accuracy, precision, recall, and f-1 scores.
Table II shows the performance of both Approach 1 and Approach 2 for both the ViT and BEiT models. Fine-tuning vanilla ViTs and vanilla BEiTs gives us some promising results when compared to the SOTA. For the RAVDESS dataset, we currently achieve SOTA using the vanilla-ViT model, with the highest performance of 97.49% accuracy as compared to the current SOTA, which has a classification accuracy of 86.70% using multimodal data [23]. For the TESS dataset, we again achieve SOTA using vanilla-ViTs and vanilla-BEiTs, which is very similar to the ones obtained by the authors in [27]. The classification accuracy for the CREMA-D dataset was the highest for the mixed dataset approach (Approach 2) with vanilla-ViTs, which is better than the performance of comparable transformer architectures presented by the authors in [36] and other non-transformer-based approaches [37, 38]. For the ESD dataset, our peak classification accuracy (96.25%) was obtained by a vanilla-BEiT model fine-tuned only on , which is again comparable to the current SOTA (93.20%) as presented by the authors in [30]. Since MELD dataset has numerous speakers, it covers a wide-range of speaker characteristics (see Figure 3). This can be see in the low classification accuracy of the MELD dataset from the Table II. We obtained peak accuracy when the BEiT model fine-tuned over . However, our results with the MELD come close to the classification accuracies presented by the authors in [24].
| Dataset | Model name | 5 fold cross validation | learning rate | Accuracy% | Precision | Recall | F1-score |
|---|---|---|---|---|---|---|---|
| RAVDESS | google/vit-base-patch16-224 | ✓ | 2.00e-05 | 97.49 | 0.9749 | 0.9749 | 0.9749 |
| microsoft/beit-base-patch16-224-pt22k-ft22k | ✓ | 94.62 | 0.9486 | 0.9462 | 0.9463 | ||
| TESS | google/vit-base-patch16-224 | ✓ | 2.00e-05 | 100.00 | 1.0 | 1.0 | 1.0 |
| microsoft/beit-base-patch16-224-pt22k-ft22k | ✓ | 100.00 | 1.0 | 1.0 | 1.0 | ||
| CREMA-D | google/vit-base-patch16-224 | ✓ | 2.00e-05 | 72.06 | 0.7237 | 0.7206 | 0.7213 |
| microsoft/beit-base-patch16-224-pt22k-ft22k | ✓ | 71.85 | 0.72 | 0.7185 | 0.7173 | ||
| ESD | google/vit-base-patch16-224 | ✓ | 2.00e-05 | 95.84 | 0.9585 | 0.9584 | 0.9584 |
| microsoft/beit-base-patch16-224-pt22k-ft22k | ✓ | 96.25 | 0.9626 | 0.9625 | 0.9625 | ||
| MELD | google/vit-base-patch16-224 | ✓ | 2.00e-05 | 49.83 | 0.4402 | 0.4983 | 0.4601 |
| microsoft/beit-base-patch16-224-pt22k-ft22k | ✓ | 43.32 | 0.4304 | 0.4332 | 0.4317 | ||
| RAVDESSmix | google/vit-base-patch16-224 | ✓ | 2.00e-05 | 95.7 | 0.9572 | 0.957 | 0.957 |
| TESSmix | 100.00 | 1.00 | 1.00 | 1.00 | |||
| CREMA-Dmix | 74.51 | 0.7522 | 0.7451 | 0.7467 | |||
| ESDmix | 95.13 | 0.9513 | 0.9513 | 0.9513 | |||
| MELDmix | 49.48 | 0.4413 | 0.4948 | 0.4594 | |||
| RAVDESSmix | microsoft/beit-base-patch16-224-pt22k-ft22k | ✓ | 2.00e-05 | 94.98 | 0.9498 | 0.9498 | 0.9497 |
| TESSmix | 100.00 | 1.00 | 1.00 | 1.00 | |||
| CREMA-Dmix | 72.36 | 0.7281 | 0.7236 | 0.7217 | |||
| ESDmix | 95.28 | 0.9533 | 0.9528 | 0.9528 | |||
| MELDmix | 50.22 | 0.448 | 0.5022 | 0.4638 |
| Data | Neutral | Happy | Sad | Angry | Total | |
|---|---|---|---|---|---|---|
| Participanti | Train | 6 | 6 | 6 | 6 | 24 |
| Test | 4 | 4 | 4 | 4 | 16 |
IV-A Human subjects’ study
| Participant | Name of Model | Acc.% | Pr. | Rec. | F1 Score | Participant | Name of Model | Acc.% | Pr. | Rec. | F1 Score |
| Participant 1 | Vanilla-ViT | 56.25 | 0.5625 | 0.5625 | 0.5486 | Participant 2 | Vanilla-ViT | 37.5 | 0.2905 | 0.375 | 0.3189 |
| Vanilla-BEiT | 62.5 | 0..6458 | 0.625 | 0.6208 | Vanilla-BEiT | 43.75 | 0.333 | 0.4375 | 0.3631 | ||
| ViTmix | 68.75 | 0.7125 | 0.6875 | 0.6935 | ViTmix | 56.25 | 0.5833 | 0.5625 | 0.5607 | ||
| BEiTmix | 75.00 | 0.8 | 0.75 | 0.75 | BEiTmix | 37.5 | 0.3854 | 0.375 | 0.3512 | ||
| ViTensemble | 68.75 | 0.7738 | 0.6875 | 0.6959 | ViTensemble | 37.5 | 0.2708 | 0.375 | 0.3006 | ||
| BEiTensemble | 56.25 | 0.5089 | 0.5625 | 0.5284 | BEiTensemble | 43.75 | 0.25 | 0.4375 | 0.3154 | ||
| ViTensemble,d | 68.75 | 0.7946 | 0.6875 | 0.79 | ViTensemble,d | 43.75 | 0.35 | 0.4375 | 0.3611 | ||
| BEiTensemble,d | 75.00 | 0.8304 | 0.75 | 0.7193 | BEiTensemble,d | 56.25 | 0.6625 | 0.5625 | 0.5486 | ||
| Participant | Name of Model | Acc.% | Pr. | Rec. | F1 Score | Participant | Name of Model | Acc.% | Pr. | Rec. | F1 Score |
| Participant 3 | Vanilla-ViT | 43.75 | 0.3571 | 0.4375 | 0.3697 | Participant 4 | Vanilla-ViT | 50.00 | 0.375 | 0.50 | 0.4278 |
| Vanilla-BEiT | 43.75 | 0.5769 | 0.4375 | 0.3843 | Vanilla-BEiT | 50.00 | 0.583 | 0.5 | 0.4393 | ||
| ViTmix | 25.00 | 0.3125 | 0.25 | 0.1938 | ViTmix | 50.00 | 0.4583 | 0.5 | 0.4679 | ||
| BEiTmix | 56.00 | 0.7875 | 0.5625 | 0.5304 | BEiTmix | 37.5 | 0.3854 | 0.375 | 0.3512 | ||
| ViTensemble | 50.00 | 0.6111 | 0.5 | 0.4622 | ViTensemble | 75.00 | 0.7875 | 0.75 | 0.7431 | ||
| BEiTensemble | 43.75 | 0.4405 | 0.4375 | 0.4161 | BEiTensemble | 62.5 | 0.7986 | 0.625 | 0.608 | ||
| ViTensemble,d | 50.00 | 0.6417 | 0.5 | 0.469 | ViTensemble,d | 56.25 | 0.525 | 0.5625 | 0.5214 | ||
| BEiTensemble,d | 43.75 | 0.475 | 0.4375 | 0.3679 | BEiTensemble,d | 62.5 | 0.6667 | 0.625 | 0.6071 | ||
| Participant | Name of Model | Acc.% | Pr. | Rec. | F1 Score | Participant | Name of Model | Acc.% | Pr. | Rec. | F1 Score |
| Participant 5 | Vanilla-ViT | 37.5 | 0.211 | 0.375 | 0.265 | Participant 6 | Vanilla-ViT | 56.25 | 0.6 | 0.5625 | 0.5754 |
| Vanilla-BEiT | 25.00 | 0.3527 | 0.25 | 0.23236 | Vanilla-BEiT | 43.75 | 0.4146 | 0.4375 | 0.4206 | ||
| ViTmix | 37.5 | 0.3708 | 0.375 | 0.37 | ViTmix | 37.50 | 0.4015 | 0.375 | 0.3381 | ||
| BEiTmix | 37.5 | 0.425 | 0.375 | 0.3631 | BEiTmix | 43.75 | 0.3917 | 0.4375 | 0.3944 | ||
| ViTensemble | 43.75 | 0.333 | 0.4375 | 0.375 | ViTensemble | 62.50 | 0.70 | 0.625 | 0.5972 | ||
| BEiTensemble | 50.00 | 0.5833 | 0.5 | 0.4631 | BEiTensemble | 50.00 | 0.5 | 0.5 | 0.4667 | ||
| ViTensemble,d | 31.25 | 0.375 | 0.3125 | 0.3167 | ViTensemble,d | 56.25 | 0.75 | 0.5625 | 0.5916 | ||
| BEiTensemble,d | 43.75 | 0.4571 | 0.4375 | 0.4141 | BEiTensemble,d | 43.75 | 0.4208 | 0.4375 | 0.4256 |
We evaluated our speech emotion recognition in a pseudo-naturalistic human-robot interaction scenario using our fine-tuned ViTs and BEiTs. Since each participant asked five questions to the robot and responded to those five questions asked by the robot, we have 40 audio clips from each participant. We divided them into train and test datasets such that two sets of questions and answers each participant gave were separated for the test set. So, each participant had three questions and answer sets for train data. Each of those questions and answers was spoken in a way that depicts each of the four primary emotions of the individual. The split of the train and test data for each participant is shown in Table III. Once the audio has been recorded from the participants, we convert the WAV files into spectrograms as shown in Figure 1.
As described in Section III-A, each question-answer set was spoken in the four primary emotions. Hence, each participant had six audio clips for each emotion for the train set and four for the test set. Owing to the performance of Vision transformers-based approaches from Table II, we used similar approaches to evaluate the use of vision transformers for speech emotion recognition in pseudo-naturalistic human-robot interaction.
-
•
Model 1- Vanilla-ViT and BEiT: Each individual’s data is converted to mel-spectrograms, and then vanilla-ViT and BEiT models are fine-tuned.
-
•
Model 2- ViTmix and BEiTmix: The fine-tuned models from Approach 2 are fine-tuned on the participants’ mel-spectrograms.
-
•
Model 3- ViTensemble and BEiTensemble: We use five vanilla-ViTs and five vanilla-BEiTs and average the logits. If the output of each ViTi, where and of each BEiTi are and respectively, then the ensemble of models is:
(9) (10) -
•
Model 4- ViTensemble,d and BEiTensemble,d: In this approach, we use the ViTd and BEiTd models trained in Approach 1 on each of the benchmark datasets. So the ensemble works as follows:
(11) (12)
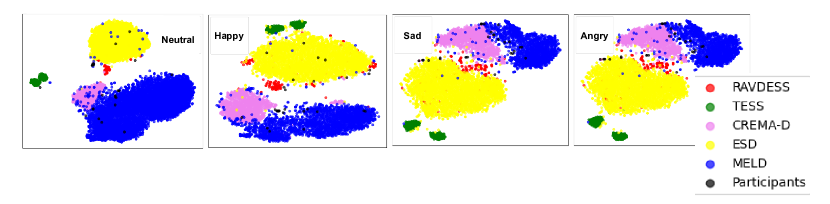
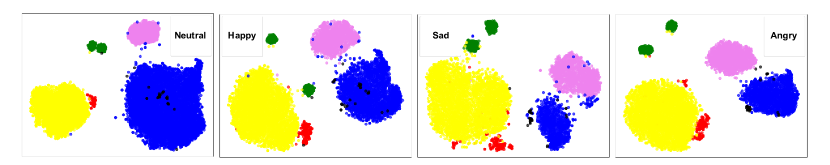
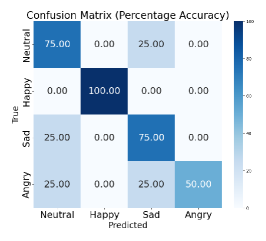
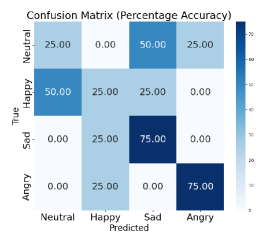
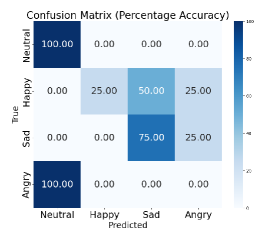
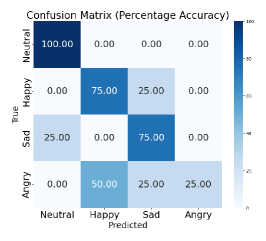
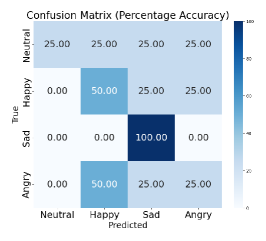
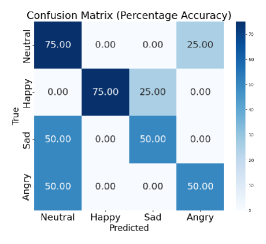
Table IV shows the model performance of all the above-proposed models. It becomes evident that the best performance is obtained when we use two broad approaches. First, when we use ViTmix or BEiTmix. This means that fine-tuning a vision transformer-based model on already existing benchmark datasets like the RAVDESS, TESS, CREMA-D, ESD, and MELD helps in recognizing the individual speech emotion characteristics of an individual speaker. The reason can be seen in Figure 3a showing the t-sne plots of the vanilla-ViT embeddings. These t-sne plots show the ViT embeddings for each emotion, plotted for all the benchmark datasets and the participants’ data. The overlap between the speech characteristics of speakers from these benchmark datasets and the participants for our human-robot interaction study helped better classify speech emotion compared to vanilla ViTs or vanilla-BEiTs. For some participants, the ensemble models worked better since their speech characteristics didn’t exactly overlap with the benchmark datasets used in this paper. These outliers can be seen from the t-sne plots in Figure 3. Fine-tuning Vanilla-ViTs or BEiTs on each participant data for recognizing an individual’s speech emotion had the worst classification accuracies as compared to its other counterparts shown in Table III. The confusion matrix for each of the participants’ best performing models have been shown in Figure 4.
V Ethics Statement
Since this paper includes a human subjects’ study, we took consent of all the participants on a consent form approved by the Institute Review Board (IRB Number: 18.0726). The participants had the opportunity to discontinue at any point of the study if they wanted to.
VI Conclusion
In this work, we address the gap in speech emotion recognition for pseudo-naturalistic and personalized verbal HRI. We evaluate the use of vision transformer based models for identifying four primary emotions: neutral, happy, sad, and angry from the speech characteristics of our participants’ data. We do this by first fine-tuning the vision transformer-based models on benchmark datasets. We then use these fine-tuned models to fine-tune them again on participants’ speech data and/or perform ensembling of these models. This helps us choose the best model for each participant, hence contributing towards understanding the emotional speech characteristics of each individual instead of proposing a group model. In addition to creating these personalized speech emotion recognition models, we also evaluate vanilla-ViT and vanilla-BEiTs on benchmark datasets like RAVDESS, TESS, CREMA-D, ESD, and MELD. We observed SOTA performances on some of these benchmark datasets.
References
- [1] D. L. Johanson, H. S. Ahn, and E. Broadbent, “Improving interactions with healthcare robots: a review of communication behaviours in social and healthcare contexts,” International Journal of Social Robotics, vol. 13, no. 8, pp. 1835–1850, 2021.
- [2] R. Mishra, “Towards adaptive and personalized robotic therapy for children with autism spectrum disorder,” in 2022 10th International Conference on Affective Computing and Intelligent Interaction Workshops and Demos (ACIIW). IEEE, 2022, pp. 1–5.
- [3] R. Mishra and K. C. Welch, “Towards forecasting engagement in children with autism spectrum disorder using social robots and deep learning,” in SoutheastCon 2023. IEEE, 2023, pp. 838–843.
- [4] J. Nakanishi, I. Kuramoto, J. Baba, K. Ogawa, Y. Yoshikawa, and H. Ishiguro, “Continuous hospitality with social robots at a hotel,” SN Applied Sciences, vol. 2, pp. 1–13, 2020.
- [5] R. Kirby, J. Forlizzi, and R. Simmons, “Affective social robots,” Robotics and Autonomous Systems, vol. 58, no. 3, pp. 322–332, 2010.
- [6] A. Ibrahim, S. Shehata, A. Kulkarni, M. Mohamed, and M. Abdul-Mageed, “What does it take to generalize ser model across datasets? a comprehensive benchmark,” arXiv preprint arXiv:2406.09933v1 [cs.SD], 2024.
- [7] L. Pepino, P. Riera, and L. Ferrer, “Emotion recognition from speech using wav2vec 2.0 embeddings,” arXiv preprint arXiv:2104.03502v1 [cs.SD], 2021.
- [8] T. Bott, F. Lux, and N. T. Vu, “Controlling emotion in text-to-speech with natural language prompts,” arXiv preprint arXiv:2406.06406v2 [cs.CL], 2024.
- [9] K.-W. Chang, W.-C. Tseng, S.-W. Li, and H.-y. Lee, “Speechprompt: An exploration of prompt tuning on generative spoken language model for speech processing tasks,” arXiv preprint arXiv:2203.16773v3 [eess.AS], 2022.
- [10] P. Zhou, X.-P. Li, J. Li, and X.-X. Jing, “Speech emotion recognition based on mixed mfcc,” in Applied Mechanics and Mechanical Engineering III. Trans Tech Publ, 2013.
- [11] S. Lalitha, A. Mudupu, B. Nandyala, and R. Munagala, “Speech emotion recognition using dwt,” in 2015 IEEE International Conference on Computational Intelligence and Computing Research (ICCIC). IEEE, 2015, pp. 1–4.
- [12] K. S. Rao, S. G. Koolagudi, and R. R. Vempada, “Emotion recognition from speech using global and local prosodic features,” International Journal of Speech Technology, 2013.
- [13] K. Han, D. Yu, and I. Tashev, “Speech emotion recognition using deep neural network and extreme learning machine,” in Proc. Interspeech, 2014.
- [14] J. Lee and I. Tashev, “High-level feature representation using recurrent neural network for speech emotion recognition,” in Proc. Interspeech, 2015.
- [15] A. Satt, S. Rozenberg, and R. Hoory, “Efficient emotion recognition from speech using deep learning on spectrograms,” in Proc. Interspeech, 2017.
- [16] Y. Khasgiwala and J. Tailor, “Vision transformer for music genre classification using mel-frequency cepstrum coefficient,” in 2021 IEEE 4th International Conference on Computing, Power and Communication Technologies (GUCON). IEEE, 2021, pp. 1–5.
- [17] A. Dosovitskiy, L. Beyer, A. Kolesnikov, D. Weissenborn, X. Zhai, T. Unterthiner, M. Dehghani, M. Minderer, G. Heigold, S. Gelly et al., “An image is worth 16x16 words: Transformers for image recognition at scale,” arXiv preprint arXiv:2010.11929, 2020.
- [18] H. Bao, L. Dong, S. Piao, and F. Wei, “Beit: Bert pre-training of image transformers,” arXiv preprint arXiv:2106.08254, 2021.
- [19] A. Vaswani, “Attention is all you need,” arXiv preprint arXiv:1706.03762, 2017.
- [20] E. Lakomkin, M. A. Zamani, C. Weber, S. Magg, and S. Wermter, “On the robustness of speech emotion recognition for human-robot interaction with deep neural networks,” in 2018 IEEE/RSJ International Conference on Intelligent Robots and Systems (IROS). IEEE, 2018, pp. 854–860.
- [21] L. Chen, W. Su, Y. Feng, M. Wu, J. She, and K. Hirota, “Two-layer fuzzy multiple random forest for speech emotion recognition in human-robot interaction,” Information Sciences, vol. 509, pp. 150–163, 2020.
- [22] C. Luna-Jiménez, R. Kleinlein, D. Griol, Z. Callejas, J. M. Montero, and F. Fernández-Martínez, “A proposal for multimodal emotion recognition using aural transformers and action units on ravdess dataset,” Applied Sciences, vol. 12, no. 1, p. 327, 2021.
- [23] S. R. Livingstone and F. A. Russo, “The ryerson audio-visual database of emotional speech and song (ravdess): A dynamic, multimodal set of facial and vocal expressions in north american english,” PloS one, vol. 13, no. 5, p. e0196391, 2018.
- [24] A. Ibrahim, S. Shehata, A. Kulkarni, M. Mohamed, and M. Abdul-Mageed, “What does it take to generalize ser model across datasets? a comprehensive benchmark,” arXiv preprint arXiv:2406.09933, 2024.
- [25] K. Chumachenko, A. Iosifidis, and M. Gabbouj, “Self-attention fusion for audiovisual emotion recognition with incomplete data,” in 2022 26th International Conference on Pattern Recognition (ICPR). IEEE, 2022, pp. 2822–2828.
- [26] K. Dupuis and M. K. Pichora-Fuller, “Toronto emotional speech set (tess)-younger talker happy,” University of Toronto, Psychology Department, Tech. Rep., 2010.
- [27] S. Akinpelu, S. Viriri, and A. Adegun, “An enhanced speech emotion recognition using vision transformer,” Scientific Reports, vol. 14, no. 1, p. 13126, 2024.
- [28] H. Cao, D. G. Cooper, M. K. Keutmann, R. C. Gur, A. Nenkova, and R. Verma, “Crema-d: Crowd-sourced emotional multimodal actors dataset,” IEEE transactions on affective computing, vol. 5, no. 4, pp. 377–390, 2014.
- [29] W. Chen, X. Xing, P. Chen, and X. Xu, “Vesper: A compact and effective pretrained model for speech emotion recognition,” IEEE Transactions on Affective Computing, 2024.
- [30] A. Saliba, Y. Li, R. Sanabria, and C. Lai, “Layer-wise analysis of self-supervised acoustic word embeddings: A study on speech emotion recognition,” arXiv preprint arXiv:2402.02617, 2024.
- [31] J. Ancilin and A. Milton, “Improved speech emotion recognition with mel frequency magnitude coefficient,” Applied Acoustics, vol. 179, p. 108046, 2021.
- [32] Z. K. Abdul and A. K. Al-Talabani, “Mel frequency cepstral coefficient and its applications: A review,” IEEE Access, vol. 10, pp. 122 136–122 158, 2022.
- [33] B. Zhang, J. Leitner, and S. Thornton, “Audio recognition using mel spectrograms and convolution neural networks,” Noiselab University of California: San Diego, CA, USA, 2019.
- [34] K. Zhou, B. Sisman, R. Liu, and H. Li, “Seen and unseen emotional style transfer for voice conversion with a new emotional speech dataset,” in ICASSP 2021-2021 IEEE International Conference on Acoustics, Speech and Signal Processing (ICASSP). IEEE, 2021, pp. 920–924.
- [35] S. Poria, D. Hazarika, N. Majumder, G. Naik, E. Cambria, and R. Mihalcea, “Meld: A multimodal multi-party dataset for emotion recognition in conversations,” arXiv preprint arXiv:1810.02508, Tech. Rep., 2018.
- [36] N.-C. Ristea, R. T. Ionescu, and F. S. Khan, “Septr: Separable transformer for audio spectrogram processing,” arXiv preprint arXiv:2203.09581, 2022.
- [37] N.-C. Ristea and R. T. Ionescu, “Self-paced ensemble learning for speech and audio classification,” arXiv preprint arXiv:2103.11988, 2021.
- [38] M.-I. Georgescu, R. T. Ionescu, N.-C. Ristea, and N. Sebe, “Nonlinear neurons with human-like apical dendrite activations,” Applied Intelligence, vol. 53, no. 21, pp. 25 984–26 007, 2023.