New correlations for the interphase drag in the two-fluid model of gas-liquid flows through packed-bed reactors
Abstract
Understanding transport phenomena through porous media is essential for applications ranging from water treatment systems to heat pipes. In many of these systems, packed-bed reactors (PBRs) are crucial components, and understanding and quantifying the pressure drop due to flow through the PBR is critical to effective operation. Recent experiments conducted by NASA measured the pressure drop due to gas-liquid flow through a PBR under microgravity conditions. Based on these experiments, we develop correlations for the interphase drag in a two-fluid model (TFM). Specifically, two closure relations are needed for the TFM: the liquid-solid and gas-liquid interphase force. We use an Ergun-type closure for . Then, under a 1D flow assumption, the TFM equations are rewritten with as the only unknown. We employ data-driven calculations to determine , which we correlate (via composite fits) as a function of the liquid and gas Reynolds numbers, and , respectively, and the Suratman number . To validate the proposed closure, we perform two-dimensional (2D) transient, multiphase computational fluid dynamics (CFD) simulations at low and (laminar flow) in ANSYS Fluent employing an Euler-Euler formulation. We find good agreement between the CFD simulations based on the proposed closure and the experimental data.
1 Introduction
Multiphase flows through porous media (Adler and Brenner, 1988; Wooding and Morel-Seytoux, 1976) find applications across various systems, from heat pipes to volatile removal assembly and hydrogenation plants, to name a few (Azarpour, Rezaei, and Zendehboudi, 2021). One such problem is gas-liquid (two-phase) flow through a packed-bed reactor (PBR). A typical PBR consists of spherical catalyst particles packed within a cylindrical (or cuboidal) pipe (Ranade, Chaudhari, and Gunjal, 2011). In the presence of gravity, the gas and liquid phases arrange themselves in the trickle flow regime (the liquid phase trickles over the packing in a gas continuous medium), and the corresponding pressure drops and trickle-to-pulse flow regime transitions have been studied extensively (see, for instance, Refs. Wang, Chen, and Larachi, 2013; Attou, Boyer, and Ferschneider, 1999; Holub, Duduković, and Ramachandran, 1992, 1993 and those therein). On the other hand, in the absence of gravity (or under microgravity conditions), the capillary force becomes important. Bubble flow (gas droplets in liquid continuous medium) and pulse flow (alternating regions of gas-rich and liquid-rich) regimes are observed in two-phase flow through PBRs at low-gravity conditions (Motil et al., 2021; Motil, Balakotaiah, and Kamotani, 2003; Taghavi et al., 2022). However, determining the pressure drop across the PBR at microgravity conditions remains an active research problem (Balasubramaniam et al., 2006). Recently, progress has been made via new experimental and theoretical efforts.
Specifically, Motil, Balakotaiah, and Kamotani (2003) reported on parabolic flight experiments of gas-liquid flow through a PBR. By developing flow regime maps, they demonstrated that different flow physics compete in microgravity conditions compared to terrestrial gravity conditions. In addition, a new correlation known as the “modified Ergun equation” was proposed to predict the frictional pressure drop for gas-liquid flows through PBRs at microgravity conditions. The duration of low-gravity conditions on parabolic flights is short. To remedy this shortcoming and gather data on longer-duration PBR flows, further experiments were conducted aboard the International Space Station (ISS)(Motil et al., 2021; Taghavi et al., 2022). Specifically, the wettability and hysteresis effects were studied in the viscous-capillary regime (low Reynolds number flow) by measuring pressure drops and bubble-to-pulse flow regime transitions for Teflon (nonwetting) and glass (wetting) packing materials (Motil et al., 2021). These experiments suggested that contributions from capillarity dominate the pressure drop for wetting packing, whereas contributions from viscous drag dominate the pressure drop for the nonwetting cases. Further, the effect of pre-flow (i.e., gas-flush versus liquid-flush) through a PBR on the pressure drop was investigated (Taghavi et al., 2022). Higher gas holdup and pressure drops were observed for liquid pre-flow conditions compared to gas pre-flow conditions. More recently, a novel technique to characterize flow regime transitions via the slope of the pressure drop versus flow rate curve (from the ISS data) demonstrated the dominance of capillarity at low flow rates and the dependence of the gas holdup on pre-flow conditions (Taghavi et al., 2023).
One-dimensional (1D) two-fluid models (TFMs) have been developed to understand these experimental observations from a fundamental (continuum) point of view (Gidaspow, 1994). Assuming the flow to be 1D, uniform in the cross-section, and at steady-state, the full TFM equations can be simplified so that the unknowns are the axial pressure drop, the liquid holdup, and the interphase drag force (Zhang et al., 2017; Salgi and Balakotaiah, 2014, 2017). Following this approach, Zhang et al. (2017) performed experiments and developed a 1D TFM at low Bond number (the ratio of gravitational to surface tension forces), within which the trickle flow regime is dominant. They incorporated Ergun-type correlations in the three interphase drag forces (i.e., the liquid-solid , gas-liquid , and gas-solid ones) with appropriate relative velocities (Attou, Boyer, and Ferschneider, 1999; Holub, Duduković, and Ramachandran, 1992, 1993). At low , capillarity implies a pressure jump (drop) across a gas-liquid interface: , where is pressure and the subscripts “”, “”, and “” stand for “capillary,” “gas”, and “liquid,” respectively. For example, Zhang et al. (2017) employed the correlation from Attou and Ferschneider (2000) to model as a function of surface tension, particle diameter, gas holdup, and the ratio of gas and liquid densities. Next, the shared pressure in the 1D gas and liquid phases’ momentum equations was eliminated to obtain a single momentum equation, with the liquid holdup being the only unknown. Finally, the pressure drop across the PBR was calculated by substituting the predicted liquid holdups, which were determined for different gas and liquid flow rates, obtaining a good agreement between the 1D TFM predictions and the experiments.
Meanwhile, Salgi and Balakotaiah (2014) used a modified Ergun correlation to calculate the pressure drop under microgravity conditions (Motil, Balakotaiah, and Kamotani, 2003). They treated the liquid holdup and as unknown in their model. They used a so-called “dynamic interaction term” from Motil, Balakotaiah, and Kamotani (2003) to improve the fit to the experimental pressure drops. Further, a capillary pressure drop correlation, derived under terrestrial gravity conditions, was incorporated because there are no acceptable capillary pressure drop correlations for microgravity conditions. A linear stability analysis was performed to obtain and liquid holdups at different gas and liquid flow rates. Similarly, Salgi and Balakotaiah (2017) developed experimentally-based correlations for from pulse velocity and frequency data to predict pressure drops through PBRs at both microgravity and terrestrial gravity conditions.
In these prior 1D TFM studies, model calibration (of one or more fitting parameters) is key to accurately predicting pressure drops. Further, as Motil et al. (2021) stated in their paper, “Ergun type expressions for cannot be justified in the dispersed bubble flow regime.” However, it is the dispersed bubble and pulse flow regimes that are observed at microgravity conditions (Motil et al., 2021; Motil, Balakotaiah, and Kamotani, 2003), which we seek to model in this work. Therefore, the goal of the present work is to perform a data-driven calculation of the drag coefficient (fitting coefficient of our model) to obtain composite fits that reveal a novel correlation for at microgravity conditions. To the best of our knowledge, this is one of the first gas-liquid interphase drag force correlations for flows through PBRs at microgravity conditions.
In addition to theoretical efforts, computational fluid dynamics (CFD) has been widely used to study resolved two-phase flows through PBRs. Specifically, an Euler-Euler TFM approach is used to predict pressure drop and liquid holdup within PBRs. Previous CFD studies(Atta, Roy, and Nigam, 2007b, a; Lopes and Quinta-Ferreira, 2008; Lu et al., 2018; Gunjal et al., 2005) considered an “empty” channel and incorporated the relevant closure relations for interphase drag terms (such as , , and ) as momentum source terms, which implicitly accounts for the porous medium. In this modeling approach, one does not have to resolve the complex flow domain of interstitial void spaces to extract relevant flow parameters (Nagrani, Marconnet, and Christov, 2024). In the present study, we follow this approach and incorporate the proposed closure relations (developed from the 1D TFM model) as momentum source terms in CFD simulation. Then, we compare the pressure drop from these CFD simulations with the experimental pressure drop measured by NASA’s Packed Bed Reactor Experiment (PBRE), provided as data in NASA’s Physical Sciences Informatics (PSI) system (Motil, Mitchell, and Balakotaiah, 2020). This comparison serves as an example demonstration of the utility of the proposed correlations.
To this end, in Sec. 2, we introduce the governing equations (Sec. 2.1) and the data-driven development of correlations for (Sec. 2.2). Then, in Sec. 3, we showcase the utility of the proposed correlation in a CFD simulation (Sec. 3.1) for two different scenarios — wetting and nonwetting packing materials. We compare the pressure drop calculated by CFD against the experimental ones (Sec. 3.2). Finally, Sec. 4 concludes the study.
2 Mathematical model
Our goal is to obtain a novel closure relation for interphase gas-liquid drag force in a TFM, based on microgravity experiments (Motil, Mitchell, and Balakotaiah, 2020). The idea of a TFM is to treat the carrier and dispersed phases of a two-phase flow as interpenetrating continua, each having its own thermophysical properties and obeying suitable balance laws (Gidaspow, 1994). The two continua “interact” through the interphase drag force, denoted . Therefore, the interphase drag force couples the momentum equations of the two phases. Throughout, it should be understood that usually represents a body force density (i.e., a force per unit volume), but we refer to it as “force” for clarity and simplicity.
In this section, we present our proposed procedure for obtaining . Specifically, in Sec. 2.1, we start from the basic mass and momentum balances under the TFM. In Sec. 2.2, we employ experimental data from NASA’s PBRE (Motil, Mitchell, and Balakotaiah, 2020) to perform a data-driven inference and calibration of a model for . In Sec. 2.3, we demonstrate the self-consistency of the modeling approach by comparing the predicted pressure drops with the original experimental data.
2.1 Governing equations
The governing equations of gas-liquid flow through a PBR are those of conservation of mass and conservation of momentum. We assume the flow is predominantly 1D, with gradients along the axial (i.e., flow) direction of PBR being of interest. Under this assumption, the conservation of mass for liquid and gas phases, respectively, can then be simplified to:
| (1a) | ||||
| (1b) | ||||
where is time, is the axial coordinate, is the volume fraction (and is termed the liquid holdup), and is the mesoscale velocity. Here, the subscripts “”, “”, and later “”, stand for “gas,” “liquid,” and “solid” phases, respectively.
In a 1D TFM model of two-phase flow through a PBR, it is generally assumed (an approximation is made) that the mesoscale velocities are and , where and are the corresponding gas or liquid superficial velocities, and is the PBR void fraction (porosity) (Salgi and Balakotaiah, 2014, 2017; Zhang et al., 2017). Next, the 1D conservation of momentum equations for the liquid and gas phases (based on the mesoscale velocities), respectively, are
| (2a) | |||
| (2b) | |||
where is the material derivative, is density, is pressure, is dynamic viscosity, is the acceleration due to gravity, and represents body forces densities. The gas phase is treated as inviscid.
To close the TFM (Eqs. (1) and (2)), we need to specify the interphase momentum transfer terms, which are represented by the forces and . Note that the expressions for and can each have a number of additive contributions, depending on the physics at hand. To arrive at expressions for and , we assume that the interaction between the gas phase and the solid packing is negligible, i.e., , because the liquid wets the solid packing (Salgi and Balakotaiah, 2014, 2017). Then, we write the phase-specific forces in terms of the interphase ones as and . We remind the reader that is the interphase drag force between the liquid and solid phases, and is the interphase drag force between the gas and liquid phases.
Next, it is standard to assume fully developed flow at steady state (Salgi and Balakotaiah, 2014, 2017; Zhang et al., 2017). Further, a shared pressure exists between the gas and liquid phases: . Incorporating these assumptions into Eqs. (2), we have
| (3a) | |||
| (3b) | |||
Note that the static pressure contribution (due to gravity) is negligible in microgravity conditions. In such cases, the total pressure gradient is essentially only due to the frictional contribution (from viscous stresses). Therefore, for ease of representation, we omit the subscript “total” on .
2.2 Interphase drag forces
Next, we construct correlations for the interphase drag forces, in Sec. 2.2.1 and in Sec. 2.2.2, required to close Eqs. (3).
2.2.1 Two-phase Ergun correlation for the liquid-solid drag
Previous studies(Salgi and Balakotaiah, 2014, 2017; Zhang et al., 2017) used an Ergun-type (Ergun and Orning, 1949; Ergun, 1952) equation to determine . An Ergun-type equation consists of additive viscous and inertial contributions to the pressure gradient across a PBR, but the relation can also be used to express the drag. Specifically, Salgi and Balakotaiah (2014, 2017) adapted the Ergun-type equation:
| (4) |
where is the diameter of the spherical particles comprising the packing. Here, is a single-phase Ergun-type (Ergun and Orning, 1949; Ergun, 1952) equation for the liquid phase, which has been adjusted by the denominator to account for the presence of a gas phase reducing the area available for the flow of the liquid phase. In the present study, we use Eq. (4) to model the drag between the liquid and solid phases where the coefficients and for vicious and inertia components respectively are from Motil et al. (2021).
2.2.2 Data-driven calibration of the gas-liquid drag
Next, we propose a novel way of obtaining a closure relation (i.e., a correlation) for from experimental PBR pressure drop data obtained from NASA’s PBRE, which we accessed via NASA’s PSI (Motil, Mitchell, and Balakotaiah, 2020). As indicated in the works of Salgi and Balakotaiah (2014), bubble and pulse flow regimes are predominant at microgravity conditions, and the trickle flow regime does not occur. Hence, one cannot use an Ergun-type correlation for , with a relative velocity because that is valid only in the trickle flow regime (Attou, Boyer, and Ferschneider, 1999; Holub, Duduković, and Ramachandran, 1992, 1993). To circumvent this issue, we use a traditional drag force formulation: , where is the drag coefficient, and is the relative velocity. Using this formulation, the shared pressure gradient can be eliminated between Eqs. (3a) and (3b), while is eliminated via Eq. (4), to obtain a single governing equation:
| (5) |
To justify the shared pressure assumption in the present work, we note the absence of an acceptable correlation for the capillary pressure drop at microgravity conditions (Salgi and Balakotaiah, 2014). If (i.e., we cannot let ), then a term proportional to would arise in Eq. (5), which is a priori unknown. In the simplest case of a static gas bubble, the Young–Laplace law governs the pressure jump, , across the gas-liquid interface due to surface tension. However, the gas-liquid interface continuously evolves throughout the PBR and hence cannot be modeled using just the Young–Laplace law (Taghavi et al., 2023). Nevertheless, we can still implicitly account for capillarity through the dependence of (or, ) on an appropriate Suratman number (a combined measure of the relative importance of surface tension to both inertial and viscous forces in the flow).
The PBRE data in the PSI repository (Motil, Mitchell, and Balakotaiah, 2020) consists of two sets, one for glass packing (wetting) and one for Teflon packing (nonwetting). Each data set has gas and liquid flow rates as input and the resulting pressure gradient across the PBR as output. We repeat our analysis shown below twice for each of the packing materials used in the PBRE to implicitly capture the contact angle dependence (effect of wetting) in our model. To use the PBRE data in conjunction with Eq. (5), the flow rates must be converted to and and into . First, the flow rates can be converted into relevant gas and liquid mass fluxes (units of ) represented as and , then and are the corresponding superficial velocities. We further define dimensionless Reynolds numbers based on the superficial velocities as: and . Next, as explained by Salgi and Balakotaiah (2014), and can be related as by adding Eqs. (3) together and eliminating the via Eq. (4). Hence, the data from PBRE datasets can be converted into .
Using and as inputs and as output, and along with the PBR’s properties, Eq. (5) has only as an unknown. We use the lsqnonlin function of Matlab to calculate from Eq. (5) for each set of conditions processed from the PBRE datasets. Specifically, we calculate for each set of input velocities. Then, turning the input velocities into Reynolds numbers, we calculate as a function of the input and for the Teflon packing dataset. Finally, we plot versus in Fig. 1 and observe a linear dependence for each (represented by color).
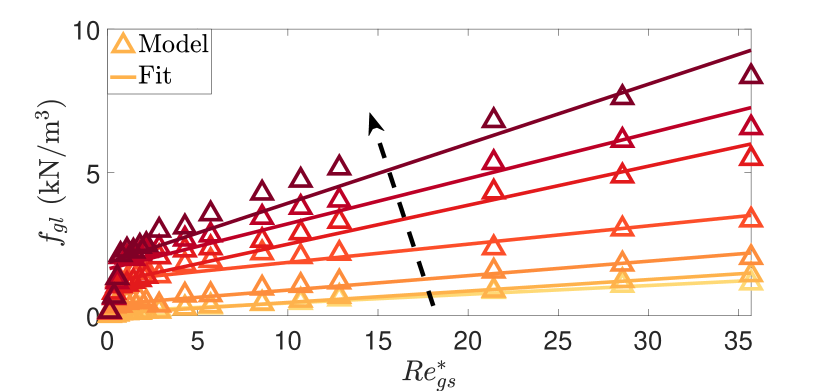
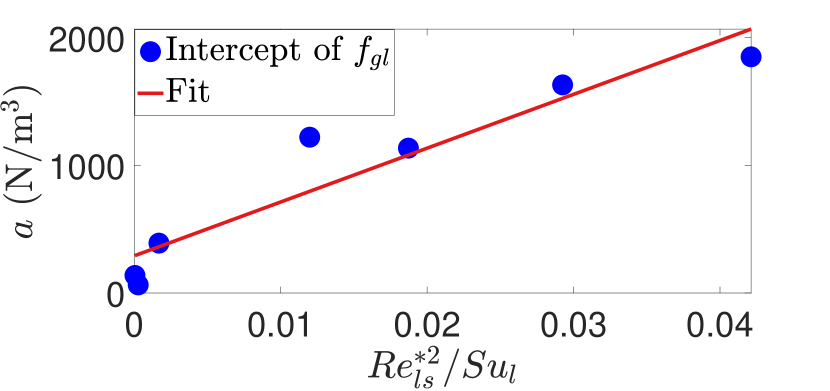
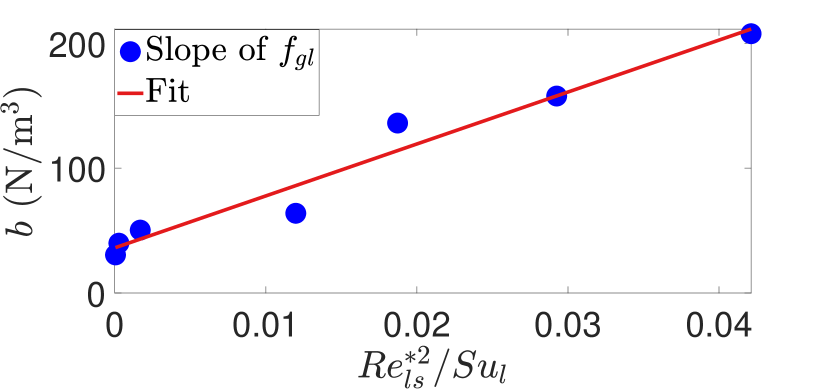
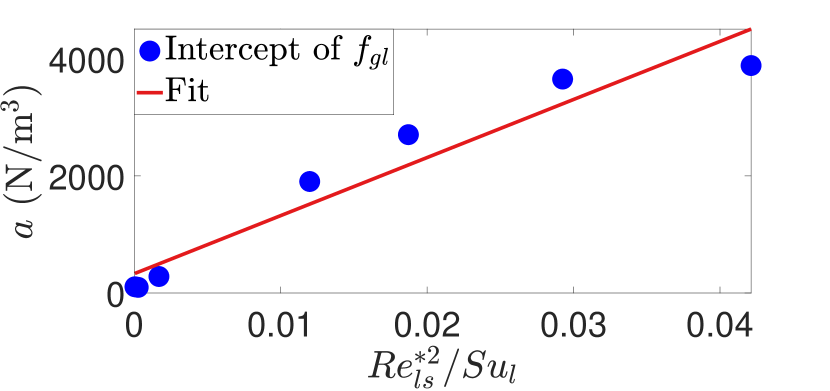
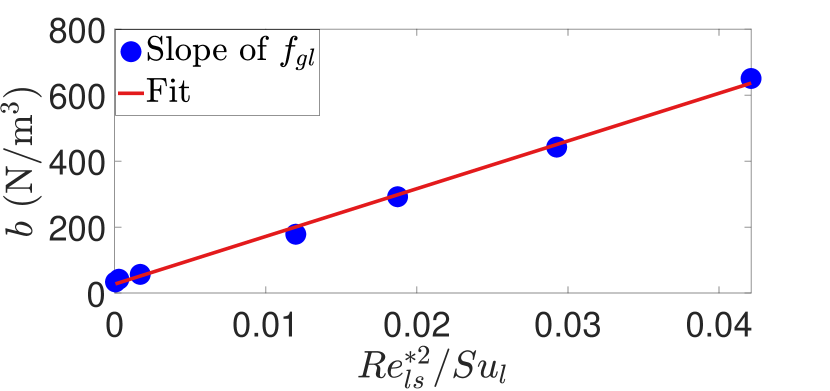
To quantify this dependence, we performed a set of linear curve fits on the versus data at each to obtain correlations of the form: , where and are, respectively, the intercept and slope of the curvefit at fixed value of . To combine these multiple correlations into a single correlation, we perform a composite linear fit to the coefficients and (obtained across all values) with respect to , where is the Suratman number, as shown in Fig. 1(b) and Fig. 1(c) of the forms: and . We introduced here to implicitly account for surface tension (capillarity effects) between the gas and liquid phases.
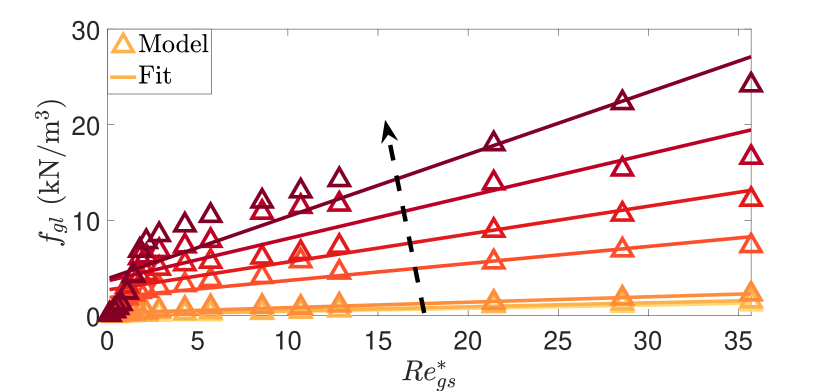
We performed an identical analysis on the PBRE dataset for a glass packing. The corresponding data and curve fit are shown in Fig. 2.
Finally, the proposed interphase drag force closure relation is . Explicitly, the correlations obtained for the Teflon and glass packings, respectively, are
| (6a) | ||||
| (6b) | ||||
Finally, if one were to have accepted correlations for the capillary pressure in a two-phase flow in microgravity conditions, it can be added back into Eq. (5). In that case, the fitting process can be repeated, and the curve-fit coefficients would change. Thus, if one wanted to explicitly incorporate capillarity effects into this approach, one would obtain different coefficient values and dependencies, but the methodology remains the same.
2.3 Model verification
In this subsection, we verify (i.e., perform a self-consistency check on) the proposed correlations given in Eqs. (6). We use and in our calculations to be consistent with the PBRE dataset (i.e., the experiments of Motil et al. (2021)). Specifically, we resolve Eq. (5), which was obtained by eliminating the pressure gradient from the momentum equations (3), by treating (in ) as one of the inputs (along with and ) and using Matlab’s fsolve routine (with default settings, such as tolerances) to solve the nonlinear equation (5), which yields as an output. The process is repeated for each and . Then, (recall Sec. 2.1), which is compared to the PBRE dataset values of in Fig. 3. As seen from Fig. 3, the pressure drops for both the packing materials match exactly, as expected, because the PBRE data was used to infer . This comparison verifies the self-consistency of the approach by which we obtained the correlations. Based on this approach, the next section provides a validation of the correlations.
3 Example implementation of the proposed in an Euler-Euler CFD simulation
One approach to CFD simulation of a PBR is to explicitly resolve the gas-liquid flow through the tortuous paths created in a three-dimensional (3D) packing (Nagrani, Marconnet, and Christov, 2024; Ambekar, Rüde, and Buwa, 2022a; Ambekar, Mondal, and Buwa, 2021; Ambekar, Rüde, and Buwa, 2022b; Xu et al., 2022). Interface-resolved CFD simulations are computationally expensive, in particular because they require a fine mesh to resolve the interstitial flow domain between the packing structures. Another approach to CFD simulations of PBRs is an Euler-Euler two-fluid formulation (Jakobsen, 2008). In this approach, suitable drag force closures must be provided to a TFM to capture the liquid-solid and liquid-gas interactions. When properly calibrated, Euler-Euler simulations can be used to predict bulk (or integrated) quantities, such as the pressure drop across the PBR. However, the accuracy of this approach requires suitable drag correlations. In this section, we demonstrate that the correlations derived in Sec. 2 from the PBRE data are useful for Euler-Euler CFD formulations.
3.1 Simulation methodology
We simulate transient two-phase gas-liquid flow through an empty 2D planar channel using an Euler-Euler CFD formulation in ANSYS Fluent 2022 R1 (ANSYS Inc., 2022b). This formulation is based on a TFM. We account for porous medium (and hence porosity) implicitly by incorporating the and closure relations from Sec. 2 using user-defined functions (UDFs).
The 2D channel and the corresponding mesh are shown in Fig. 4. We create a CFD geometry similar to the experimental test facility for NASA’s PBRE(Motil, Mitchell, and Balakotaiah, 2020; Motil et al., 2021). To reduce the computational power required to perform the simulations, however, the 2D channel width is and its length is , which is half of the experimental setup’s length (Motil et al., 2021). We believe the flow is fully developed much upstream of this region, and our CFD simulations predict linear pressure variation with axial position. Hence, the pressure drop from the CFD simulations can be compared to the data of Motil et al. (2021). In addition, the gas phase is nitrogen, the liquid phase is water, and constant properties are assumed as indicated in Table 1.
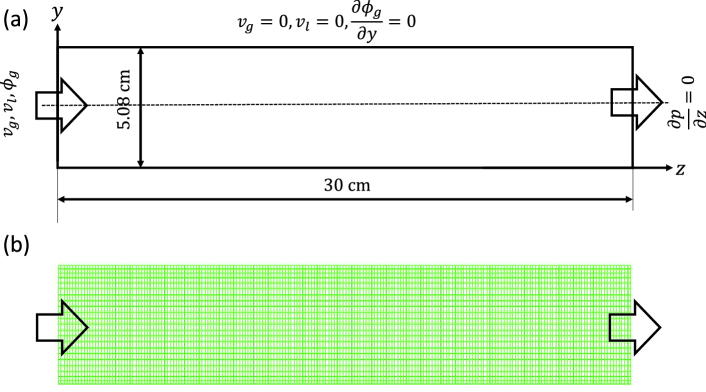
The boundary conditions (BCs) imposed on the CFD simulations are shown in Fig. 4. At the inlet, constant mesoscale velocities calculated from the superficial velocities (Gunjal et al., 2005) are specified as and for all and , assuming at the inlet plane. Since Motil et al. (2021) do not report the inlet volume fraction for the phases, we assumed perfectly mixed conditions and assigned for all and . A zero pressure gradient is assigned at the outlet. No-slip velocity conditions () and are imposed at the channel’s top and bottom walls. As mentioned before, the porous medium is accounted for implicitly via the interphase coupling drag terms, from Eq. (6) and from Eq. (4). The source terms for each phase’s axial momentum equation are defined as
| (7a) | ||||
| (7b) | ||||
and are implemented in Fluent using a UDF based on local velocities (instead of the superficial velocities used in Eq. (4) and Eq. (6)), following previous CFD studies (Atta, Roy, and Nigam, 2007b, a; Lopes and Quinta-Ferreira, 2008; Lu et al., 2018; Gunjal et al., 2005). We assume constant porosity of . For initial conditions, we assumed partial liquid holdup and hence for all points in the domain. We also simulated different initial conditions, for example, , and found the final CFD pressure drop to be generally independent of the initial liquid holdup .
| Phase | |||
|---|---|---|---|
| Nitrogen | 0.072 | ||
| Water |
In ANSYS Fluent (ANSYS Inc., 2022b), we used a “Least Squared Cell Based” numerical scheme to discretize gradients. The pressure equation was discretized using the “PRESTO!” scheme and “First Order Upwind” schemes were used to discretize the momentum and volume fraction equations, while a “First Order Implcit” transient formulation was employed to ensure the stability of the solver. Finally, the pressure-velocity coupling was achieved by the “Phase Coupled SIMPLE” algorithm. To ensure the stability and convergence of the solver, we treated the source terms semi-implicitly, meaning the constant part of the source term is explicit, and the terms involving the velocity are implicit in the momentum equations (see Ref. ANSYS Inc., 2022a for detailed explanation).
A grid convergence study was conducted with three different grid sizes, with , , and total number of elements. The final pressure drop across the 2D channel was found to be in all three cases for the Teflon packing at the same inlet velocities. Thus, we employed the grid with elements for the remaining simulations.
3.2 Comparison of pressure drop in PBRs
We performed CFD simulations for Teflon and glass packings, each across different and values. Next, we compare the pressure drop from the CFD simulations to the experimental pressure drops in PBRE dataset. We restrict our attention to the laminar regime of low and because we did not incorporate turbulence modeling in the simulations. However, it must be noted that we use the entire data set (Motil, Mitchell, and Balakotaiah, 2020) to calculate and obtain the relevant correlations (recall Sec. 2). The CFD simulations run until and stop varying with time, and hence, a steady state has been established.
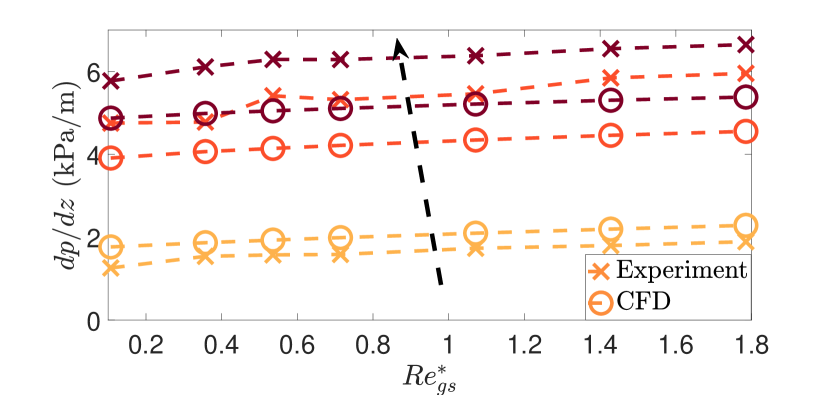
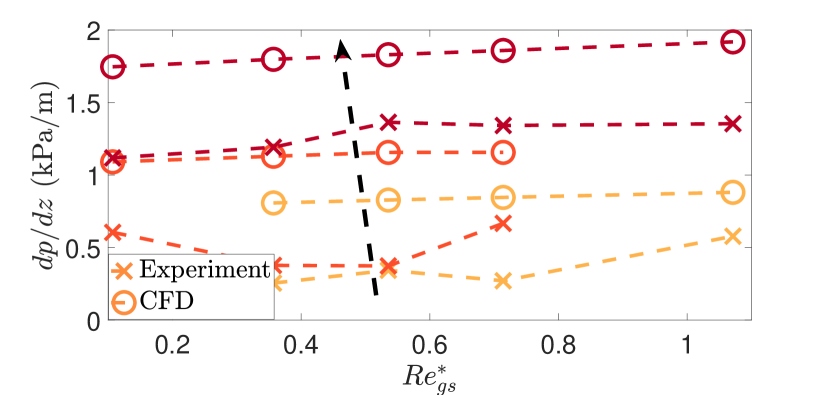
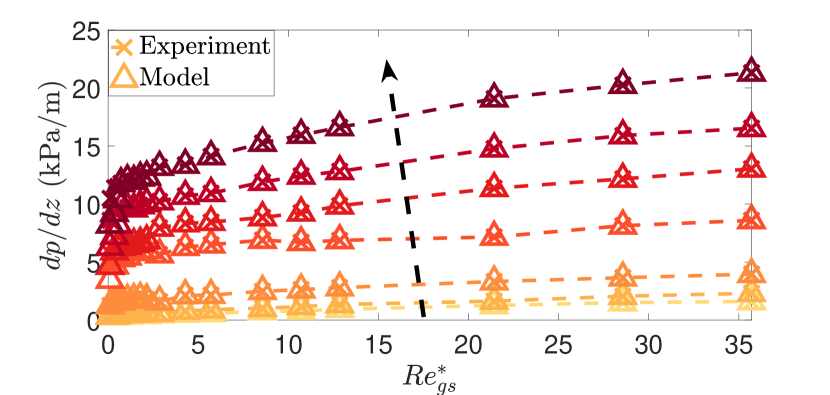
Figure 5 shows the variation of with at different for (a) Teflon and (b) glass packing conditions. For the Teflon packing, in Fig. 5(a), the CFD simulation is performed for , , , and . The CFD simulations predict a within of the experimental values, highlighting the validity of the proposed approach based on the Euler-Euler simulation using the proposed correlation for the Teflon packing. The highest error of occurs at the lowest flow rates and is an artifact of the small pressure drops under consideration. The PBRE datasets(Motil, Mitchell, and Balakotaiah, 2020) do not report the uncertainty of all experimental measurements.
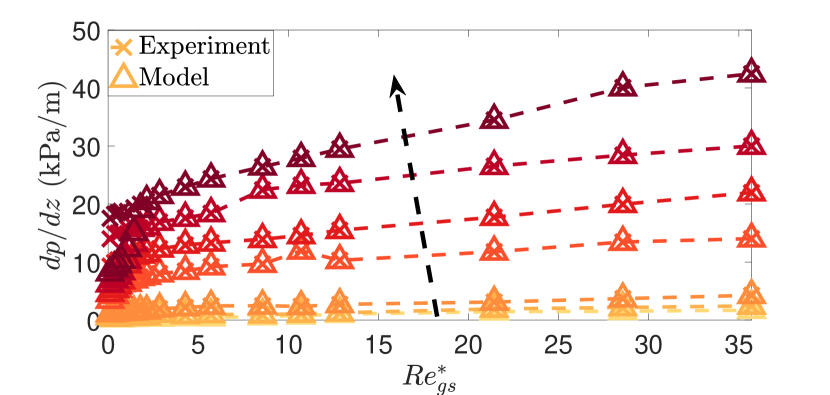
Similarly, for the glass packing, simulations are performed for , , , and to restrict the simulations to the laminar flow regime. As seen in Fig. 5, the CFD simulations predict values similar to the experimental ones. However, higher percent errors are observed due to the low values for glass beads and also because of higher uncertainty in the experimental values, especially for small . The uncertainty in the experiments for glass bead packing is expected to be large as there is a non-monotonic behavior of near .
4 Conclusion
Motivated by the lack of studies of two-phase gas-liquid flow through a PBR at microgravity conditions, we developed a data-driven methodology for the calibration of a gas-liquid drag, , closure that can be used in CFD simulations. Starting from a 1D TFM, we proposed a novel closure relation for for two different packing materials having different wettability characteristics — Teflon (nonwetting) and glass (wetting). Specifically, we assumed fully-developed 1D flow at steady-state with cross-sectionally uniform velocities and shared pressures between the gas and liquid phases, thus rendering the TFM into a single Eq. (5). Using the latter, we calculated a drag coefficient , such that , for each value of the gas and liquid Reynolds numbers, and , available in the PBRE dataset from NASA’s PSI system (Motil, Mitchell, and Balakotaiah, 2020). Then, we performed composite curve fitting to deduce correlations for for Teflon and glass packing, given in Eqs. (6). To the best of our knowledge, the proposed correlations are one of the first data-driven closure relations to be developed for gas-liquid flows through a PBR at microgravity conditions.
Next, we demonstrated the utility of the proposed correlation within a CFD simulation. Specifically, we used an Euler-Euler formulation in ANSYS Fluent to predict the pressure drop across a PBR under microgravity conditions. The proposed closure relations were incorporated as sources in the axial momentum equations via UDFs. We performed CFD simulations in the laminar regime (). The resulting pressure drops were compared to the experimental ones reported in the PBRE dataset. We observed general agreement between the two across different packing materials, within a tolerance of .
Author Contributions
Pranay P. Nagrani: conceptualization (equal); data curation (lead); formal analysis (lead); investigation (equal); methodology (equal); validation (lead); visualization (lead); writing - original draft (lead). Amy M. Marconnet: writing - review & editing (supporting); supervision (equal); funding acquisition (supporting). Ivan C. Christov: conceptualization (equal); formal analysis (supporting); investigation (equal); methodology (equal); writing - original draft (supporting); writing - review & editing (lead); supervision (equal); funding acquisition (lead).
Acknowledgements
This research was supported by the National Aeronautics and Space Administration under Grant No. 80NSSC22K0290. Simulations were performed using the community clusters of the Rosen Center for Advanced Computing at Purdue University.
ORCiD
Pranay P. Nagrani https://orcid.org/0000-0003-4568-9318
Amy M. Marconnet https://orcid.org/0000-0001-7506-2888
Ivan C. Christov https://orcid.org/0000-0001-8531-0531
References
- Adler and Brenner (1988) Adler, P. M. and Brenner, H., “Multiphase Flow in Porous Media,” Annual Review of Fluid Mechanics 20, 35–59 (1988).
- Ambekar, Mondal, and Buwa (2021) Ambekar, A. S., Mondal, S., and Buwa, V. V., “Pore-resolved volume-of-fluid simulations of two-phase flow in porous media: Pore-scale flow mechanisms and regime map,” Physics of Fluids 33, 102119 (2021).
- Ambekar, Rüde, and Buwa (2022a) Ambekar, A. S., Rüde, U., and Buwa, V. V., “Forces governing the dynamics of liquid spreading in packed beds,” Journal of Fluid Mechanics 948, A13 (2022a).
- Ambekar, Rüde, and Buwa (2022b) Ambekar, A. S., Rüde, U., and Buwa, V. V., “Particle-resolved simulations of local liquid spreading in packed beds: Effect of wettability at varying particle size,” Physics of Fluids 34, 062111 (2022b).
- ANSYS Inc. (2022a) ANSYS Inc.,, “ANSYS® Academic Research Fluent, Release 2022 R1, Fluent Theory Guide,” Tech. Rep. (ANSYS Inc., Canonsburg, PA, 2022).
- ANSYS Inc. (2022b) ANSYS Inc.,, “ANSYS® Academic Research Fluent, Release 2022 R1, Fluent User’s Guide,” Tech. Rep. (ANSYS Inc., Canonsburg, PA, 2022).
- Atta, Roy, and Nigam (2007a) Atta, A., Roy, S., and Nigam, K. D., “Investigation of liquid maldistribution in trickle-bed reactors using porous media concept in CFD,” Chemical Engineering Science 62, 7033–7044 (2007a).
- Atta, Roy, and Nigam (2007b) Atta, A., Roy, S., and Nigam, K. D., “Prediction of pressure drop and liquid holdup in trickle bed reactor using relative permeability concept in CFD,” Chemical Engineering Science 62, 5870–5879 (2007b).
- Attou, Boyer, and Ferschneider (1999) Attou, A., Boyer, C., and Ferschneider, G., “Modelling of the hydrodynamics of the cocurrent gas-liquid trickle flow through a trickle-bed reactor,” Chemical Engineering Science 54, 785–802 (1999).
- Attou and Ferschneider (2000) Attou, A. and Ferschneider, G., “A two-fluid hydrodynamic model for the transition between trickle and pulse flow in a cocurrent gas-liquid packed-bed reactor,” Chemical Engineering Science 55, 491–511 (2000).
- Azarpour, Rezaei, and Zendehboudi (2021) Azarpour, A., Rezaei, N., and Zendehboudi, S., “Performance analysis and modeling of catalytic trickle-bed reactors: a comprehensive review,” Journal of Industrial and Engineering Chemistry 103, 1–41 (2021).
- Balasubramaniam et al. (2006) Balasubramaniam, R., Rame, E., Kizito, J., and Kassemi, M., “Two Phase Flow Modeling: Summary of Flow Regimes and Pressure Drop Correlations in Reduced and Partial Gravity,” Tech. Rep. (National Center for Space Exploration Research, Cleveland, Ohio, 2006).
- Ergun (1952) Ergun, S., “Fluid Flow through Packed Columns,” Chemical Engineering Progress 48, 89–94 (1952).
- Ergun and Orning (1949) Ergun, S. and Orning, A. A., “Fluid Flow through Randomly Packed Columns and Fluidized Beds,” Industrial & Engineering Chemistry 41, 1179–1184 (1949).
- Gidaspow (1994) Gidaspow, D., Multiphase Flow and Fluidization: Continuum and Kinetic Theory Descriptions (Academic Press, San Diego, CA, 1994).
- Gunjal et al. (2005) Gunjal, P. R., Kashid, M. N., Ranade, V. V., and Chaudhari, R. V., “Hydrodynamics of Trickle-Bed Reactors: Experiments and CFD Modeling,” Industrial & Engineering Chemistry Research 44, 6278–6294 (2005).
- Holub, Duduković, and Ramachandran (1992) Holub, R. A., Duduković, M. P., and Ramachandran, P. A., “A phenomenological model for pressure drop, liquid holdup, and flow regime transition in gas-liquid trickle flow,” Chemical Engineering Science 47, 2343–2348 (1992).
- Holub, Duduković, and Ramachandran (1993) Holub, R. A., Duduković, M. P., and Ramachandran, P. A., “Pressure drop, liquid holdup, and flow regime transition in trickle flow,” AIChE Journal 39, 302–321 (1993).
- Jakobsen (2008) Jakobsen, H. A., Chemical Reactor Modeling (Springer Berlin Heidelberg, Berlin, Heidelberg, 2008).
- Lopes and Quinta-Ferreira (2008) Lopes, R. J. and Quinta-Ferreira, R. M., “Three-dimensional numerical simulation of pressure drop and liquid holdup for high-pressure trickle-bed reactor,” Chemical Engineering Journal 145, 112–120 (2008).
- Lu et al. (2018) Lu, X., Xie, P., Ingham, D. B., Ma, L., and Pourkashanian, M., “A porous media model for CFD simulations of gas-liquid two-phase flow in rotating packed beds,” Chemical Engineering Science 189, 123–134 (2018).
- Motil, Balakotaiah, and Kamotani (2003) Motil, B. J., Balakotaiah, V., and Kamotani, Y., “Gas–liquid two-phase flow through packed beds in microgravity,” AIChE Journal 49, 557–565 (2003).
- Motil, Mitchell, and Balakotaiah (2020) Motil, B. J., Mitchell, J., and Balakotaiah, V., “Packed Bed Reactor Experiment (PBRE),” (2020).
- Motil et al. (2021) Motil, B. J., Ramé, E., Salgi, P., Taghavi, M., and Balakotaiah, V., “Gas–liquid flows through porous media in microgravity: The International Space Station Packed Bed Reactor Experiment,” AIChE Journal 67, e17031 (2021).
- Nagrani, Marconnet, and Christov (2024) Nagrani, P. P., Marconnet, A. M., and Christov, I. C., “Hydrodynamics of bubble flow through a porous medium with applications to packed bed reactors,” AIChE Journal 70, e18343 (2024).
- Ranade, Chaudhari, and Gunjal (2011) Ranade, V. V., Chaudhari, R. V., and Gunjal, P. R., Trickle Bed Reactors: Reactor Engineering & Applications (Elsevier B.V., Oxford, UK, 2011).
- Salgi and Balakotaiah (2014) Salgi, P. and Balakotaiah, V., “Impact of gravity on the bubble-to-pulse transition in packed beds,” AIChE Journal 60, 778–793 (2014).
- Salgi and Balakotaiah (2017) Salgi, P. and Balakotaiah, V., “Experimentally-based constitutive relations for co-current gas-liquid flow in randomly packed beds,” AIChE Journal 63, 812–822 (2017).
- Taghavi et al. (2022) Taghavi, M., Motil, B. J., Nahra, H., and Balakotaiah, V., “Gas–liquid flows through porous media in microgravity: Packed Bed Reactor Experiment‐2,” AIChE Journal 68, e17727 (2022).
- Taghavi et al. (2023) Taghavi, M., Motil, B. J., Nahra, H., and Balakotaiah, V., “The international space station packed bed reactor experiment: capillary effects in gas-liquid two-phase flows,” npj Microgravity 9, 55 (2023).
- Wang, Chen, and Larachi (2013) Wang, Y., Chen, J., and Larachi, F., “Modelling and simulation of trickle-bed reactors using computational fluid dynamics: A state-of-the-art review,” Canadian Journal of Chemical Engineering 91, 136–180 (2013).
- Wooding and Morel-Seytoux (1976) Wooding, R. A. and Morel-Seytoux, H. J., “Multiphase Fluid Flow Through Porous Media,” Annual Review of Fluid Mechanics 8, 233–274 (1976).
- Xu et al. (2022) Xu, L., Yu, B., Wang, C., Jiang, H., Liu, Y., and Chen, R., “Particle-resolved CFD simulations of local bubble behaviors in a mini-packed bed with gas–liquid concurrent flow,” Chemical Engineering Science 254, 117631 (2022).
- Zhang et al. (2017) Zhang, J., Teixeira, A. R., Kögl, L. T., Yang, L., and Jensen, K. F., “Hydrodynamics of gas-liquid flow in micropacked beds: Pressure drop, liquid holdup, and two-phase model,” AIChE Journal 63, 4694–4704 (2017).