A Host Galaxy Morphology Link Between
Quasi-Periodic Eruptions and Tidal Disruption Events
Abstract
The physical processes that produce X-ray Quasi-Periodic Eruptions (QPEs) recently discovered from the nuclei of several low-redshift galaxies are mysterious. Several pieces of observational evidence strongly suggest a link between QPEs and Tidal Disruption Events (TDE). Previous studies also reveal that the morphologies of TDE host galaxies are highly concentrated, with high Sérsic indicies, bulge-to-total light (B/T) ratios, and stellar surface mass densities relative to the broader galaxy population. We use these distinctive properties to test the link between QPEs and TDEs, by comparing these parameters of QPE host galaxies to TDE host galaxies. We employ archival Legacy Survey images of a sample of 9 QPE host galaxies and a sample of 13 TDE host galaxies, and model their surface brightness profiles. We show that QPE host galaxies have high Sérsic indices of 3, high B/T ratios of 0.5, and high surface mass densities of 1010 kpc-2. These properties are similar to TDE host galaxies, but are in strong contrast to a mass- and redshift-matched control sample of galaxies. We also find tentative evidence that the central black holes in both QPE and TDE host galaxies are undermassive relative to their stellar mass. The morphological similarities between QPE and TDE host galaxies at the population level add to the mounting evidence of a physical link between these phenomena, and favor QPE models that also invoke TDEs.
1 Introduction
Quasi-periodic eruptions (QPEs) are X-ray flares emitted from the nuclei of a small handful of low-redshift galaxies, and they display a diverse array of puzzling properties. These quasi-periodic X-ray flares have luminosities of 1042-44 erg s-1, and recurrence times of 2–50 hours. QPEs have been detected in a total of 9 galaxies to date, through both blind searches in wide-field X-ray surveys such as eROSITA (e.g., Arcodia et al., 2021, 2024), and serendipitous discoveries in targeted X-ray observations (e.g., Miniutti et al., 2019; Giustini et al., 2020; Nicholl et al., 2024). Longer-term monitoring of this sample of QPEs has further revealed a variety of puzzling behaviors, such as the observed disappearance of QPEs in the long-term X-ray light curve, and their subsequent reappearance months later with significantly different periods and fluxes (e.g., Miniutti et al., 2023b, a), or slow fading of the QPE fluxes over years (Pasham et al., 2024). Furthermore, although many QPE host galaxies display X-ray emission during quiescence (i.e., between eruptions) and have optical emission line ratio signatures of active galactic nuclei (AGN) in their spectra (Wevers et al., 2022), others are nearly quiescent in X-rays (with Eddington ratios of to ; Arcodia et al. 2021), with no spectroscopic signatures of AGN. This rich diversity of properties poses challenges to theoretical models, and additional insights from observations are needed.
The physical origin of QPEs is highly uncertain, and many theoretical models have been proposed to explain this phenomenon. Current QPE models can be divided broadly into three categories. First, if QPE host galaxies harbor AGN, instabilities (Sniegowska et al., 2020) or tears (Raj & Nixon, 2021) in their accretion disks can lead to quasi-periodic outbursts, akin to QPEs (Pan et al., 2022, 2023; Kaur et al., 2023; Śniegowska et al., 2023). Second, a secondary star in a eccentric orbit around the central massive black hole (MBH) can be repeatedly stripped at periapsis, resulting in either a partial Tidal Disruption Event (TDE; King, 2020, 2022; Metzger et al., 2022; Wang et al., 2022; Lu & Quataert, 2023) or mass transfer through Roche lobe overflow (Krolik & Linial, 2022; Zhao et al., 2022; Linial & Sari, 2023; Wang, 2024), causing QPEs. Finally, a stellar-mass secondary in an orbit that intersects an existing accretion disk (either from an AGN or a TDE) around the central MBH could cause QPEs, due to collisions as the secondary punches through the disk (Xian et al., 2021; Suková et al., 2021; Linial & Metzger, 2023; Franchini et al., 2023; Tagawa & Haiman, 2023; Yao et al., 2024; Zhou et al., 2024). The possibilities involving a stellar-mass secondary orbiting the MBH are particularly exciting, as they represent the electromagnetic counterparts to Extreme Mass Ratio Inspiral (EMRI) systems that could be detected in gravitational waves by the Laser Interferometer Space Antenna (LISA; Amaro-Seoane et al., 2017, 2022). Periodic electromagnetic flares from these EMRI systems have long been predicted, well before the more recent discovery of QPEs (e.g., Zalamea et al., 2010; MacLeod et al., 2013, 2016; Metzger & Stone, 2017; Shen, 2019).
Some pieces of observational evidence intriguingly suggest an link between QPEs and TDEs. For example, the current sample of QPEs all occur in relatively low-mass galaxies (with stellar masses of ) that harbor low-mass central MBH (Wevers et al., 2022). This preference for low-mass host galaxies is also observed in TDE host galaxies (French et al., 2016; Law-Smith et al., 2017; Hammerstein et al., 2021), for which low-mass MBHs are required for the TDE to occur outside of the MBH event horizon and be observable (Hills, 1975). Furthermore, optical spectra of QPE host galaxies have revealed post-starburst and quiescent Balmer-strong stellar populations (Wevers et al., 2022), reminiscent of TDE host galaxies (French et al., 2016; Law-Smith et al., 2017; Hammerstein et al., 2021). Recently, Wevers & French (2024) compared Integral Field Unit spectra of QPE host galaxies to similar observation of TDEs (Wevers et al., 2024), and showed that both TDE and QPE host galaxies display extended emission line regions that indicate a recent ionizination event by a luminous non-stellar continuum. Finally, QPEs have been recently been directly observed in the X-ray light curve of at least one TDE (AT2019qiz; Nicholl et al., 2024). This discovery is the strongest and most direct piece of evidence linking TDEs to QPEs, but this evidence has only been observed for one object. Although it is now clear that at least some QPEs occur in TDEs, the extent and nature of the connection between TDEs and QPEs remains an open question.
TDE host galaxies are known to have distinct morphological properties (French et al., 2020), which would also be observed in QPE host galaxies if these phenomena are linked. Studies using samples of TDEs have revealed that TDE host galaxies are more centrally concentrated, with significantly higher Sérsic indicies relative to both comparison samples of galaxies matched in black hole mass (Law-Smith et al., 2017), as well as the broader galaxy population (Hammerstein et al., 2021). Furthermore, Graur et al. (2018) show that TDE host galaxies have higher stellar surface mass densities relative to a comparison sample of the broader galaxy population. These galaxy-scale morphological properties of TDE host galaxies may not be surprising, as it is possible that the high stellar densities in the nuclear regions of the hosts lead to increased rates of close stellar interactions with the central MBH. Regardless of the exact reasons for the high central stellar concentration of TDE host galaxies, we can test the link between TDEs and QPEs by determining whether QPE host galaxies also share these distinctive properties.


In this work, we test the link between TDEs and QPEs, by investigating the morphological properties of QPE host galaxies in archival optical imaging, and comparing them to TDE host galaxies. This comparison requires careful fitting of the surface brightness profiles in imaging, and has not previously been performed. We use archival optical images from the DESI Legacy Imaging Surveys (Legacy Survey; Dey et al., 2019) of the current sample of 9 QPE host galaxies, along with 13 TDE host galaxies, and model their surface brightness profiles using a uniform approach. We compare the Sérsic indices, bulge-to-total light ratios, and stellar mass densities of the QPE hosts to the TDE hosts, as well as a mass- and redshift-matched control sample of galaxies. We find that QPE host galaxies share similar morphological properties with TDE host galaxies, which are distinct from other galaxies of similar mass and redshift.
The outline of this paper is as follows. In Section 2, we describe our QPE and TDE host galaxy samples, archival imaging data, and our surface brightness modeling. In Section 3, we compare the morphological properties of QPE host galaxies to both TDE host galaxies and the control galaxy sample, and discuss the implications of our results for QPE models. We briefly summarize and conclude in Section 4. Throughout the paper, we assume a standard cosmology with , , and km s-1 Mpc-1, consistent with Planck Collaboration (2016).
| Object | Redshift | Half-light | Sérsic | Stellar Mass | Stellar Mass | Black Hole | |
|---|---|---|---|---|---|---|---|
| Radius | Index | ratio | Density | Mass | |||
| [kpc] | [ kpc-2] | [] | [] | ||||
| QPE host galaxies | |||||||
| GSN 069a | |||||||
| RX J1301.9+2747b | |||||||
| eRO-QPE1c | |||||||
| eRO-QPE2c | |||||||
| eRO-QPE3d | |||||||
| eRO-QPE4d | |||||||
| TDE+QPE host galaxies | |||||||
| AT 2019vcbe | |||||||
| 2MASX J0249f | |||||||
| AT 2019qizg | |||||||
| TDE host galaxies | |||||||
| ASASSN-14aeh | |||||||
| ASASSN-14lii | |||||||
| PTF-09gej | |||||||
| RBS 1032k | |||||||
| SDSS J1323l | |||||||
| SDSS J0748m | |||||||
| SDSS J1342n | |||||||
| SDSS J1350n | |||||||
| SDSS J0952n | |||||||
| SDSS J1201o | |||||||
| PTF-15afp | |||||||
| AT2018dykq | |||||||
| ASASSN18zjr | |||||||
aMiniutti et al. (2019); bGiustini et al. (2020); cArcodia et al. (2021); dArcodia et al. (2024); eQuintin et al. (2023); fChakraborty et al. (2021); gNicholl et al. (2020); hHoloien et al. (2014); iJose et al. (2014); jArcavi et al. (2014); kMaksym et al. (2014); lRead et al. (2006); mWang et al. (2011); nWang et al. (2012); oSaxton et al. (2012) pBlagorodnova et al. (2019) qHuang et al. (2023) rDong et al. (2018)
2 Modeling of QPE and TDE Host Galaxy Images
2.1 QPE Host Galaxies Sample
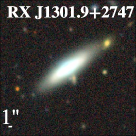
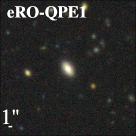
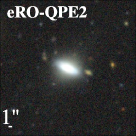
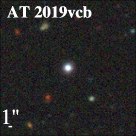
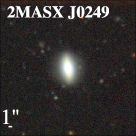
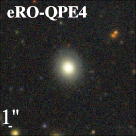
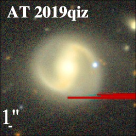
For our QPE host galaxy sample, we use all 9 currently-known QPE hosts in the literature (Miniutti et al., 2019; Arcodia et al., 2021; Quintin et al., 2023; Chakraborty et al., 2021; Arcodia et al., 2024), listed in Table 1. This sample of QPEs is inhomogenous, and was discovered through a variety of approaches, including in wide-field X-ray surveys (e.g., eROSITA; Predehl et al. 2003), and serendipitous discoveries in targeted XMM-Newton and Chandra observations (e.g., Giustini et al., 2020; Miniutti et al., 2019). We emphasize that our QPE and TDE host galaxy samples are not mutually exclusive, and include QPE+TDE hosts (i.e., galaxies in which both a TDE and QPEs were observed). Specifically, our sample of 9 QPE host galaxies includes one with confirmed QPEs in a confirmed TDE host (AT 2019qiz), and two with candidate QPEs in confirmed TDE hosts (AT 2019vcb and 2MASX J0249). All 9 of these QPE host galaxies have archival imaging in the Legacy Survey.
2.2 TDE Host Galaxies Sample
For our TDE host galaxies sample, we use the compilation of 13 TDE hosts from French et al. (2020) (listed in Table 1) that have black hole masses from the literature, along with the three QPE+TDE hosts. This sample consists primarily of TDEs from Law-Smith et al. (2017), with a few more recent discoveries. Both French et al. (2020) and Law-Smith et al. (2017) show that these TDE hosts have high Sérsic indicies relative to a comparison sample of galaxies.
2.3 Imaging Data
We use archival optical images of the QPE and TDE host galaxies from the Legacy Survey Data Release 10.1111https://www.legacysurvey.org/. The Legacy Survey is a wide field imaging survey that combines the Mayall -band Legacy Survey (MzLS), the Dark Energy Camera Legacy Survey (DECaLS), and the Beijing-Arizona Sky Survey (BASS), and is supplemented by additional Dark Energy Camera imaging, covering a total area of . We use coadded images produced by the Legacy Survey team, which have median AB magnitude depths of , , , . These coadded images include coadd point spread functions (PSFs), which have a typical FWHM of 12. We refer the reader to Dey et al. (2019) for more details on the Legacy Survey. Figure 1 shows cutouts of the Legacy Survey coadded images for our sample of 9 QPE host galaxies (including the 3 QPE+TDE hosts).
2.4 Surface Brightness Profile Modeling
We use the galight software (Ding et al., 2020) to model the surface brightness profile of each QPE and TDE host galaxy. We fetch calibrated coadded griz images of each host galaxy from the Legacy Survey archive, along with their corresponding weight maps, which we use to calculate noise maps for our fits. We also fetch the coadd PSF at the location of each galaxy, which we use in our modeling. We use galight to first perform source detection in each image, and mask out all sources except for the target host galaxy. We fit the background level in the masked image, and subtract the median value. We use a 121121 pixel cutout centered on each host galaxy for our detailed fits; in our tests, our fitting results are robust to the choice of this cutout size.
We first fit the r-band surface brightness profile of each QPE and TDE host galaxy to a single Sérsic model, to obtain a global Sérsic index . Specifically, we use galight to model each host galaxy with a Sérsic ellipse model from lenstronomy (Birrer & Amara, 2018; Birrer et al., 2021), convolved with the PSF. We use emcee (Foreman-Mackey et al., 2013) to perform Markov Chain Monte Carlo (MCMC) to produce posterior distributions of the free parameters, including the Sérsic index , and the Sérsic half-light radius . For the MCMC, we use 120 walkers with 5000 total iterations, including 500 burn-in iterations. The best-fitting values (median, along with the 16th–84th percentiles of the posterior as the uncertainty) of and for each host galaxy are listed in Table 1.
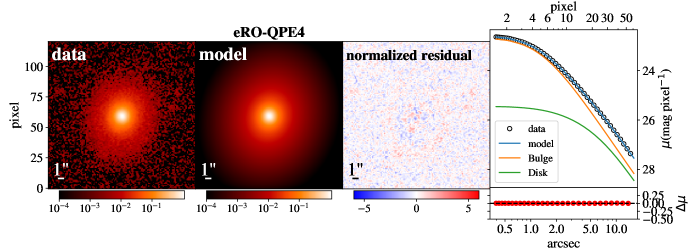
We next fit a two-component disk+bulge model to each galaxy, to obtain a -band bulge-to-total light ratio ()g. We model the host galaxy with two Sérsic ellipse models from lenstronomy, to represent a disk and a bulge. We refer to these disk and bulge Sérsic indices as and , respectively. For some galaxies, these disk+bulge fits produce unphysical results, because the galaxy is either strongly disk-dominated or strongly bulge-dominated, leaving the other component poorly-constrained. Thus, we use the results of our previous single-Sérsic fit to inform our disk+bulge fits. Specifically, for galaxies with from our single-Sersic fits (strongly disk-dominated), we fix the bulge-component Sersic index in our bulge+disk fit to , while leaving free. This ensures that the bulge component does not also fit the disk. Conversely, if from our single-Sersic fits (strongly bulge-dominated), we fix the disk-component Sersic index in our bulge+disk fit to , while leaving to be free. Finally, in the intermediate case where from our single-Sersic fits (both disk and bulge components are relatively equal), we leave both and free. We produce posterior distributions for the free parameters by performing MCMC, similar to our single-Sérsic fits above. The resultant ()g ratios are listed in Table 1. We show an example of our disk+bulge fit to a QPE host galaxy from our sample (eRO-QPE4) in Figure 2.
There is also spectroscopic evidence for low-luminosity AGN in most QPE host galaxies (Wevers et al., 2022), and thus we perform tests of our surface brightness fitting that include an additional point source to represent the AGN. Specifically, we compare our fits using the two-component disk+bulge model described above to those using a three-component disk+bulge+AGN model, where the AGN is a central point source based on the coadd PSF. We find that the two-component disk+bulge model is preferred for all objects, based on its Bayesian Information Criterion (BIC). Thus, we find no evidence for spatially-unresolved AGN emission in any of our QPE and TDE host galaxy images.
We use our two-component disk+bulge fits to compute stellar surface mass densities for each host galaxy. We calculate using the definition from Graur et al. (2018)
| (1) |
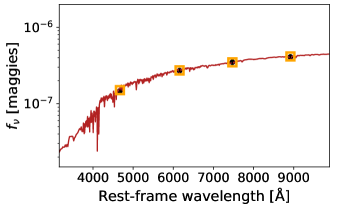
where is the r-band half-light radius obtained from our single-Sérsic fits to the surface brightness profile, and is the total stellar mass of the galaxy. We obtain through fitting the optical Spectral Energy Distribution (SED) of each host galaxy using our measured griz-band apparent magnitudes. To calculate these apparent magnitudes, we add the flux of the fitted bulge and disk components from our bulge+disk decomposition of each galaxy, and correct for Galactic extinction using the dust maps of Schlafly & Finkbeiner (2011), assuming the extinction law from Fitzpatrick (1999). We fit the resultant SEDs using the prospector software to obtain . We perform this inference using nested sampling with dynesty (Speagle, 2020), fixing the redshift to the value from the Sloan Digital Sky Survey (SDSS; York et al., 2000), and leaving the following free parameters: stellar mass , metallicity, optical depth at 5500Å (to model the host galaxy dust), the age of the stellar population , and the -folding time , such that the star formation history is (Bruzual A., 1983; Papovich et al., 2001). An example of the SED fitting for the QPE host galaxy eRO-QPE4 is shown in Figure 3. From these fits, we obtain posterior distributions of the free parameters, including , and use the median value and its 16th–84th percentiles as our uncertainty to calculate in Equation 1. The resultant and for each host galaxy are listed in Table 1.
2.5 Central Massive Black Hole Masses
We also compare the MBH masses, , of QPE host galaxies to TDE hosts. Although previous studies have pointed out that QPE host galaxies seem to have low that are similar to TDE hosts (e.g., Wevers et al., 2022), no explicit comparisons have been made. We thus estimate for each host galaxy based on its empirical relation with velocity dispersion from Kormendy & Ho (2013)
| (2) |
where is the velocity dispersion in , which is calculated from the measured velocity dispersion within the aperture as listed in the SDSS MPA-JHU Galaxy Properties 222https://www.sdss4.org/dr17/spectro/galaxy_mpajhu/ catalog. We use the equation
| (3) |
to convert from to (Jorgensen et al., 1995), where is the -band half-light radius from the Simard et al. (2011) catalog, and is the aperture radius of the SDSS observations used in the MPA-JHU catalog, which corresponds to . The resultant for each host galaxy is listed in Table 1, and their distributions are shown in Figure 4.
3 Discussion
3.1 Comparison of QPE Host Galaxies
to TDE Host Galaxies
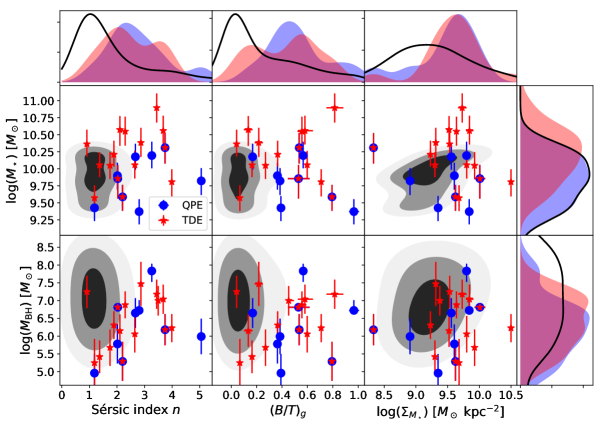
We compare our measured parameters for QPE host galaxies to TDE host galaxies, and find that they have similar Sérsic indices , bulge-to-total light ratios , and stellar surface mass densities . Specifically, we compare our sample of 9 QPE host galaxies (including the 3 QPE+TDE hosts) to our sample of 13 TDE host galaxies (also including the three QPE+TDE hosts). The TDE+QPE hosts are thus included in both the QPE and TDE samples. Figure 4 compares the distributions of , , , , and , for QPE (blue) and TDE (red) host galaxies. Qualitatively, the distributions of the Sérsic , , , , and are similar between the QPE and TDE host galaxies.
We next perform statistical tests to quantitatively demonstrate that the TDE and QPE host galaxy parameter distributions are similar. We first use a 2-sample Kolmogorov-Smirnov (K-S) test to compare the shape of the parameter distributions between TDE and QPE host galaxies. We find that we cannot reject the null hypothesis that the two samples belong to the same distribution for , , , , and , with -values of 0.93, 0.71, 0.98, 0.14 and 0.93, respectively. We next perform an Anderson-Darling test to further compare the tails of the parameter distributions, and also find that , , , , and all appear to be drawn from the same distribution, with -values of 0.87, 0.61, 0.97, 0.06, and 0.61, respectively. We note that although our QPE and TDE samples are not mutually exclusive, these results are not strongly biased by inclusion of the three QPE+TDE host galaxies. We find that excluding these QPE+TDE hosts in our statistical tests leads to similar conclusions.
3.2 Comparison of QPE Host Galaxies
to the Control Sample
To determine whether the properties of QPE host galaxies are distinct, we construct a control sample of galaxies from SDSS, matched in redshift and stellar mass to our QPE hosts. To enable this comparison and place this control sample on Figure 4, we build it using various SDSS galaxy catalogs that contain , , , , , and . Specifically, we use the Simard et al. (2011) catalog of galaxy properties from SDSS imaging to obtain , , and , and we obtain from the Mendel et al. (2014) catalog. For each galaxy, we estimate using the procedure described in Section 2.5.
We perform selection cuts on our control sample, so that both its redshift and stellar mass distribution will match our QPE host galaxies. We first exclude galaxies with a redshift to prevent aperture bias where the galaxy has a much larger angular size than the SDSS fiber diameter, which could cause the velocity dispersion (and consequently ) to be overestimated. To match our control galaxy sample in mass and redshift to the QPE hosts, we bin our QPE hosts and our control galaxies to a 2020 grid of and . We then pick 5,000 control galaxies from each bin containing a QPE host, thus selecting a total of 45,000 galaxies with similar and as our QPE hosts to generate our mass- and redshift-matched control sample.
We find that QPE host galaxies have higher , , and in comparison to the mass- and redshift-matched control sample, similar to TDE hosts. Figure 4 also compares these parameters between the QPE hosts to the control sample, which qualitatively shows a clear difference between these two galaxy samples. To quantify these differences, we calculate the percentage of galaxies above fiducal parameter values for both the QPE and the control sample distributions. We find that for QPE hosts, 89% of our sample has , 89% has , 67% has , and 89% has , in stark contrast (by a factor of 2) to 50%, 41%, 33%, and 58% for our control galaxies, respectively. Figure 4 also suggests that while QPE and TDE hosts have similar MBH masses of , these masses are systematically smaller than the control sample matched in stellar mass and redshift. A 2-sample K-S test gives -values of 0.09, 0.02, 0.11, and 0.16, and an Anderson-Darling test gives -values of 0.25, 0.041, 0.20 and 0.39, for , , , and , respectively. While the statistical significance threshold of is only formally met for , the other properties all exhibit low -values, pointing towards a difference between the QPE and control galaxy samples. Thus, the K-S tests indicate that the distribution of QPE host galaxies is distinct from the control sample, while the Anderson-Darling test indicates that the distribution of QPE host galaxies is distinct from the control sample at a statistically significant level. We note that the distributions of for QPE hosts and the control galaxy sample are similar by design (with -value of 1.00), since the control sample is matched in to the QPE hosts. Although neither the K-S test nor the Anderson-Darling test are able to provide statically robust conclusions for the majority of the parameters, these tests are dependent on sample size. Thus, more conclusive statistical tests will have to await the discovery of larger samples of QPEs.
3.3 Implications for the Origins of QPEs
Our results suggest that QPEs and TDEs both result from processes related to an increased rate of close stellar interactions with the central MBH. The similarly high , , and of both QPE and TDE host galaxies relative to the control sample suggest that their host galaxies are bulge-dominated, and have unusually high central stellar concentrations. In these dense stellar environments, the rates of close stellar encounters with the central MBH are elevated, and this scenario has previously been invoked to explain the distinct properties of TDE host galaxies (e.g., Law-Smith et al., 2017; Graur et al., 2018; Hammerstein et al., 2021). Our results here further extend this explanation to QPEs, which may also owe to close stellar encounters with the central MBH.
The link between QPE and TDE host galaxies supports QPE models that also invoke TDEs, and suggests that these two phenomena may be different manifestations of the same underlying physical process. For example, several studies have suggested that partial TDEs from a star on an elliptical orbit around a MBH could cause QPEs (King, 2020, 2022; Metzger et al., 2022; Wang et al., 2022; Lu & Quataert, 2023), although the exact emission mechanisms are still unclear, even for TDEs. Similarly, a link between QPEs and TDEs would also be consistent with models that invoke a star on an inclined orbit colliding with an accretion disk surrounding the central MBH (Xian et al., 2021; Suková et al., 2021; Linial & Metzger, 2023; Franchini et al., 2023; Tagawa & Haiman, 2023; Yao et al., 2024; Zhou et al., 2024), if this accretion disk is specifically due to a TDE. However, it is still unclear if the link between TDEs and QPEs is causal (i.e., if TDEs are necessarily required for QPEs to occur, or vice versa). More detailed comparisons between simulations and QPE light curves (e.g., Franchini et al., 2023) will be needed to differentiate between these models, and additional observations of both TDEs and QPEs will clarify their link.
We also find that both QPE and TDE host galaxies may have systematically undermassive black holes, which indirectly also supports a link between TDEs and QPEs. Figure 4 shows that the distribution of QPE and TDE host galaxies may be systematically smaller than the mass- and redshift-matched control galaxy sample. Since this control sample is matched in stellar mass to our QPE sample, this implies that both QPEs and TDEs may lie below the relation for galaxies. Previous observational studies have suggested that TDE host galaxies may preferentially host undermassive black holes relative to their host galaxy mass (Ramsden et al., 2022). This may owe to a bias in preferentially observing TDEs in galaxies with undermassive , since the tidal radius for these undermassive black holes is more likely to be outside the event horizon. If QPEs are linked to TDEs, the in QPE host galaxies would thus naturally also be undermassive. Thus, our finding of undermassive in both TDEs and QPEs also supports this link.
We perform tests to verify that our finding of undermassive in both TDE and QPE hosts does not arise from systematic differences in estimated from different methods and data. Specifically, the we estimate for TDE and QPE hosts is from the prospector software using Legacy Survey images, whereas the literature we use for the control sample is from the Mendel et al. (2014) catalog based on SDSS imaging. A systematic difference in the from these two approaches could, in turn, cause a systematic difference in the distributions, since our control galaxy sample is matched in to the QPE hosts. In other words, if our estimates for QPE hosts from prospector are systematically larger than the estimates for the control galaxies sample from Mendel et al. (2014), and our control sample is -matched to the QPE hosts, then the QPE hosts would naturally have undermassive relative to the control sample. To evaluate this possibility, we use the seven TDE and QPE hosts in our samples that also have from the Mendel et al. (2014) catalog, and directly compare their values. We find that our estimates from prospector are actually systematically 0.2 dex lower than the values listed in Mendel et al. (2014). This systematic difference is not only small, but carefully correcting for this effect would cause the distributions for QPE and TDE hosts in Figure 4 to become even more undermassive. Thus, our finding of undermassive for QPE and TDE hosts cannot owe to systematics stemming from the imaging data or estimates.
4 Conclusions
We tested for a possible link between QPEs and TDEs, based on their host galaxy morphological properties. Using archival Legacy Survey optical images of a sample of QPE and TDE host galaxies, we fitted their surface brightness profiles and measured key morphological parameters in a systematic analysis. We compared these QPE host galaxy parameters to those of TDEs, as well as a control sample of galaxies matched in redshift and stellar mass. Our main findings are:
-
1.
The morphological properties of QPE host galaxies are similar to those of TDE hosts, while being distinct from the control galaxy sample. Both QPE and TDE host galaxies not only have similar distributions in Sérsic , bulge-to-total light ratio , and stellar surface mass density , but these parameters are also systematically higher than in a mass- and redshift-matched control sample of galaxies. We also tentatively find that both QPE and TDE host galaxies have undermassive black holes compared to the control galaxy sample, which implies that they systematically lie below the relation for galaxies.
-
2.
Our results suggest that QPEs and TDEs are linked, and favor QPE models that also invoke TDEs. Specifically, the similarly high , , and of QPE and TDE host galaxies relative to the control sample suggests that both phenomena occur in galaxies with high central stellar concentrations, where the rate of close stellar encounters with the central MBH is higher. This scenario is consistent with QPE models such as repeated partial TDEs, or a stellar-mass secondary orbiting the central MBH that is interacting with a TDE accretion disk. Finally, the undermassive central black holes in both QPE and TDE host galaxies may owe to the upper limit on for TDEs to be observable. If QPEs and TDEs are different manifestations of the same underlying phenomenon, this would would naturally explain why MBHs in both QPE and TDE host galaxies are undermassive.
The link between QPE and TDEs suggested by our results has implications for multi-messenger observations of EMRI systems detected in gravitational waves. Although using EMRIs to trace orbits in the strong gravity around MBHs is a key science goal of future mHZ gravitational wave experiments such as LISA, it is unclear whether the electromagnetic counterparts to these systems will be detectable. If QPEs are signposts for EMRIs and occur in TDEs, wide-field imaging surveys such as the Legacy Survey of Space and Time (LSST; Ivezić et al., 2019) on the Rubin Observatory can be used to identify the TDE counterparts to EMRIs. These identifications will enable X-ray follow-up to search for QPEs, and perform multi-messenger science with these systems. Even before the LISA era, long-term X-ray follow-up of more TDEs can unveil additional insights into the exact physical processes that produce QPEs.
References
- Amaro-Seoane et al. (2017) Amaro-Seoane, P., Audley, H., Babak, S., et al. 2017, arXiv e-prints, arXiv:1702.00786, doi: 10.48550/arXiv.1702.00786
- Amaro-Seoane et al. (2022) Amaro-Seoane, P., Andrews, J., Arca Sedda, M., et al. 2022, arXiv e-prints, arXiv:2203.06016, doi: 10.48550/arXiv.2203.06016
- Arcavi et al. (2014) Arcavi, I., Gal-Yam, A., Sullivan, M., et al. 2014, ApJ, 793, 38, doi: 10.1088/0004-637X/793/1/38
- Arcodia et al. (2021) Arcodia, R., Merloni, A., Nandra, K., et al. 2021, Nature, 592, 704, doi: 10.1038/s41586-021-03394-6
- Arcodia et al. (2024) Arcodia, R., Liu, Z., Merloni, A., et al. 2024, A&A, 684, A64, doi: 10.1051/0004-6361/202348881
- Astropy Collaboration et al. (2018) Astropy Collaboration, Price-Whelan, A. M., Sipőcz, B. M., et al. 2018, AJ, 156, 123, doi: 10.3847/1538-3881/aabc4f
- Birrer & Amara (2018) Birrer, S., & Amara, A. 2018, Physics of the Dark Universe, 22, 189, doi: 10.1016/j.dark.2018.11.002
- Birrer et al. (2021) Birrer, S., Shajib, A. J., Gilman, D., et al. 2021, Journal of Open Source Software, 6, 3283, doi: 10.21105/joss.03283
- Blagorodnova et al. (2019) Blagorodnova, N., Cenko, S. B., Kulkarni, S. R., et al. 2019, ApJ, 873, 92, doi: 10.3847/1538-4357/ab04b0
- Bruzual A. (1983) Bruzual A., G. 1983, ApJ, 273, 105, doi: 10.1086/161352
- Chakraborty et al. (2021) Chakraborty, J., Kara, E., Masterson, M., et al. 2021, ApJ, 921, L40, doi: 10.3847/2041-8213/ac313b
- Dey et al. (2019) Dey, A., Schlegel, D. J., Lang, D., et al. 2019, AJ, 157, 168, doi: 10.3847/1538-3881/ab089d
- Ding et al. (2020) Ding, X., Silverman, J., Treu, T., et al. 2020, ApJ, 888, 37, doi: 10.3847/1538-4357/ab5b90
- Dong et al. (2018) Dong, S., Bose, S., Chen, P., et al. 2018, The Astronomer’s Telegram, 12198, 1
- Fitzpatrick (1999) Fitzpatrick, E. L. 1999, PASP, 111, 63, doi: 10.1086/316293
- Foreman-Mackey et al. (2013) Foreman-Mackey, D., Hogg, D. W., Lang, D., & Goodman, J. 2013, PASP, 125, 306, doi: 10.1086/670067
- Franchini et al. (2023) Franchini, A., Bonetti, M., Lupi, A., et al. 2023, A&A, 675, A100, doi: 10.1051/0004-6361/202346565
- French et al. (2016) French, K. D., Arcavi, I., & Zabludoff, A. 2016, ApJ, 818, L21, doi: 10.3847/2041-8205/818/1/L21
- French et al. (2020) French, K. D., Wevers, T., Law-Smith, J., Graur, O., & Zabludoff, A. I. 2020, Space Sci. Rev., 216, 32, doi: 10.1007/s11214-020-00657-y
- Giustini et al. (2020) Giustini, M., Miniutti, G., & Saxton, R. D. 2020, A&A, 636, L2, doi: 10.1051/0004-6361/202037610
- Graur et al. (2018) Graur, O., French, K. D., Zahid, H. J., et al. 2018, The Astrophysical Journal, 853, 39, doi: 10.3847/1538-4357/aaa3fd
- Hammerstein et al. (2021) Hammerstein, E., Gezari, S., van Velzen, S., et al. 2021, ApJ, 908, L20, doi: 10.3847/2041-8213/abdcb4
- Hills (1975) Hills, J. G. 1975, Nature, 254, 295, doi: 10.1038/254295a0
- Holoien et al. (2014) Holoien, T. W. S., Prieto, J. L., Bersier, D., et al. 2014, MNRAS, 445, 3263, doi: 10.1093/mnras/stu1922
- Huang et al. (2023) Huang, S., Jiang, N., Lin, Z., Zhu, J., & Wang, T. 2023, MNRAS, 525, 4057, doi: 10.1093/mnras/stad2541
- Ivezić et al. (2019) Ivezić, Ž., Kahn, S. M., Tyson, J. A., et al. 2019, ApJ, 873, 111, doi: 10.3847/1538-4357/ab042c
- Johnson et al. (2021) Johnson, B. D., Leja, J., Conroy, C., & Speagle, J. S. 2021, ApJS, 254, 22, doi: 10.3847/1538-4365/abef67
- Jorgensen et al. (1995) Jorgensen, I., Franx, M., & Kjaergaard, P. 1995, MNRAS, 276, 1341, doi: 10.1093/mnras/276.4.1341
- Jose et al. (2014) Jose, J., Guo, Z., Long, F., et al. 2014, The Astronomer’s Telegram, 6777, 1
- Kaur et al. (2023) Kaur, K., Stone, N. C., & Gilbaum, S. 2023, MNRAS, 524, 1269, doi: 10.1093/mnras/stad1894
- King (2020) King, A. 2020, MNRAS, 493, L120, doi: 10.1093/mnrasl/slaa020
- King (2022) —. 2022, MNRAS, 515, 4344, doi: 10.1093/mnras/stac1641
- Kormendy & Ho (2013) Kormendy, J., & Ho, L. C. 2013, ARA&A, 51, 511, doi: 10.1146/annurev-astro-082708-101811
- Krolik & Linial (2022) Krolik, J. H., & Linial, I. 2022, ApJ, 941, 24, doi: 10.3847/1538-4357/ac9eb6
- Law-Smith et al. (2017) Law-Smith, J., Ramirez-Ruiz, E., Ellison, S. L., & Foley, R. J. 2017, ApJ, 850, 22, doi: 10.3847/1538-4357/aa94c7
- Linial & Metzger (2023) Linial, I., & Metzger, B. D. 2023, ApJ, 957, 34, doi: 10.3847/1538-4357/acf65b
- Linial & Sari (2023) Linial, I., & Sari, R. 2023, ApJ, 945, 86, doi: 10.3847/1538-4357/acbd3d
- Lu & Quataert (2023) Lu, W., & Quataert, E. 2023, MNRAS, 524, 6247, doi: 10.1093/mnras/stad2203
- MacLeod et al. (2013) MacLeod, M., Ramirez-Ruiz, E., Grady, S., & Guillochon, J. 2013, ApJ, 777, 133, doi: 10.1088/0004-637X/777/2/133
- MacLeod et al. (2016) MacLeod, M., Trenti, M., & Ramirez-Ruiz, E. 2016, ApJ, 819, 70, doi: 10.3847/0004-637X/819/1/70
- Maksym et al. (2014) Maksym, W. P., Lin, D., & Irwin, J. A. 2014, ApJ, 792, L29, doi: 10.1088/2041-8205/792/2/L29
- Mendel et al. (2014) Mendel, J. T., Simard, L., Palmer, M., Ellison, S. L., & Patton, D. R. 2014, ApJS, 210, 3, doi: 10.1088/0067-0049/210/1/3
- Metzger & Stone (2017) Metzger, B. D., & Stone, N. C. 2017, ApJ, 844, 75, doi: 10.3847/1538-4357/aa7a16
- Metzger et al. (2022) Metzger, B. D., Stone, N. C., & Gilbaum, S. 2022, ApJ, 926, 101, doi: 10.3847/1538-4357/ac3ee1
- Miniutti et al. (2023a) Miniutti, G., Giustini, M., Arcodia, R., et al. 2023a, A&A, 674, L1, doi: 10.1051/0004-6361/202346653
- Miniutti et al. (2023b) —. 2023b, A&A, 670, A93, doi: 10.1051/0004-6361/202244512
- Miniutti et al. (2019) Miniutti, G., Saxton, R. D., Giustini, M., et al. 2019, Nature, 573, 381, doi: 10.1038/s41586-019-1556-x
- Nicholl et al. (2020) Nicholl, M., Wevers, T., Oates, S. R., et al. 2020, MNRAS, 499, 482, doi: 10.1093/mnras/staa2824
- Nicholl et al. (2024) Nicholl, M., Pasham, D. R., Mummery, A., et al. 2024, arXiv e-prints, arXiv:2409.02181. https://arxiv.org/abs/2409.02181
- Pan et al. (2023) Pan, X., Li, S.-L., & Cao, X. 2023, ApJ, 952, 32, doi: 10.3847/1538-4357/acd180
- Pan et al. (2022) Pan, X., Li, S.-L., Cao, X., Miniutti, G., & Gu, M. 2022, ApJ, 928, L18, doi: 10.3847/2041-8213/ac5faf
- Papovich et al. (2001) Papovich, C., Dickinson, M., & Ferguson, H. C. 2001, ApJ, 559, 620, doi: 10.1086/322412
- Pasham et al. (2024) Pasham, D. R., Coughlin, E. R., Zajaček, M., et al. 2024, ApJ, 963, L47, doi: 10.3847/2041-8213/ad2a5c
- Planck Collaboration (2016) Planck Collaboration. 2016, Astronomy & Astrophysics, 594, A13, doi: 10.1051/0004-6361/201525830
- Predehl et al. (2003) Predehl, P., Friedrich, P., & Hasinger, G. 2003, in Society of Photo-Optical Instrumentation Engineers (SPIE) Conference Series, Vol. 4851, X-Ray and Gamma-Ray Telescopes and Instruments for Astronomy., ed. J. E. Truemper & H. D. Tananbaum, 314–323, doi: 10.1117/12.461153
- Quintin et al. (2023) Quintin, E., Webb, N. A., Guillot, S., et al. 2023, A&A, 675, A152, doi: 10.1051/0004-6361/202346440
- Raj & Nixon (2021) Raj, A., & Nixon, C. J. 2021, ApJ, 909, 82, doi: 10.3847/1538-4357/abdc25
- Ramsden et al. (2022) Ramsden, P., Lanning, D., Nicholl, M., & McGee, S. L. 2022, MNRAS, 515, 1146, doi: 10.1093/mnras/stac1810
- Read et al. (2006) Read, A., Saxton, R., Esquej, P., Freyberg, M., & Altieri, B. 2006, Publications of the Astronomical Society of Japan, 58, L47, doi: 10.1093/pasj/58.6.L47
- Saxton et al. (2012) Saxton, R. D., Read, A. M., Esquej, P., et al. 2012, A&A, 541, A106, doi: 10.1051/0004-6361/201118367
- Schlafly & Finkbeiner (2011) Schlafly, E. F., & Finkbeiner, D. P. 2011, ApJ, 737, 103, doi: 10.1088/0004-637X/737/2/103
- Shen (2019) Shen, R.-F. 2019, ApJ, 871, L17, doi: 10.3847/2041-8213/aafc64
- Simard et al. (2011) Simard, L., Mendel, J. T., Patton, D. R., Ellison, S. L., & McConnachie, A. W. 2011, ApJS, 196, 11, doi: 10.1088/0067-0049/196/1/11
- Sniegowska et al. (2020) Sniegowska, M., Czerny, B., Bon, E., & Bon, N. 2020, A&A, 641, A167, doi: 10.1051/0004-6361/202038575
- Śniegowska et al. (2023) Śniegowska, M., Grzȩdzielski, M., Czerny, B., & Janiuk, A. 2023, A&A, 672, A19, doi: 10.1051/0004-6361/202243828
- Speagle (2020) Speagle, J. S. 2020, MNRAS, 493, 3132, doi: 10.1093/mnras/staa278
- Suková et al. (2021) Suková, P., Zajaček, M., Witzany, V., & Karas, V. 2021, ApJ, 917, 43, doi: 10.3847/1538-4357/ac05c6
- Tagawa & Haiman (2023) Tagawa, H., & Haiman, Z. 2023, MNRAS, 526, 69, doi: 10.1093/mnras/stad2616
- Wang (2024) Wang, D. 2024, A&A, 687, A295, doi: 10.1051/0004-6361/202449585
- Wang et al. (2022) Wang, M., Yin, J., Ma, Y., & Wu, Q. 2022, ApJ, 933, 225, doi: 10.3847/1538-4357/ac75e6
- Wang et al. (2012) Wang, T.-G., Zhou, H.-Y., Komossa, S., et al. 2012, ApJ, 749, 115, doi: 10.1088/0004-637X/749/2/115
- Wang et al. (2011) Wang, T.-G., Zhou, H.-Y., Wang, L.-F., Lu, H.-L., & Xu, D. 2011, ApJ, 740, 85, doi: 10.1088/0004-637X/740/2/85
- Wevers & French (2024) Wevers, T., & French, K. D. 2024, ApJ, 969, L17, doi: 10.3847/2041-8213/ad5725
- Wevers et al. (2022) Wevers, T., Pasham, D. R., Jalan, P., Rakshit, S., & Arcodia, R. 2022, A&A, 659, L2, doi: 10.1051/0004-6361/202243143
- Wevers et al. (2024) Wevers, T., French, K. D., Zabludoff, A. I., et al. 2024, arXiv e-prints, arXiv:2406.02678, doi: 10.48550/arXiv.2406.02678
- Xian et al. (2021) Xian, J., Zhang, F., Dou, L., He, J., & Shu, X. 2021, ApJ, 921, L32, doi: 10.3847/2041-8213/ac31aa
- Yao et al. (2024) Yao, P. Z., Quataert, E., Jiang, Y.-F., Lu, W., & White, C. J. 2024, arXiv e-prints, arXiv:2407.14578, doi: 10.48550/arXiv.2407.14578
- York et al. (2000) York, D. G., Adelman, J., Anderson, John E., J., et al. 2000, AJ, 120, 1579, doi: 10.1086/301513
- Zalamea et al. (2010) Zalamea, I., Menou, K., & Beloborodov, A. M. 2010, MNRAS, 409, L25, doi: 10.1111/j.1745-3933.2010.00930.x
- Zhao et al. (2022) Zhao, Z. Y., Wang, Y. Y., Zou, Y. C., Wang, F. Y., & Dai, Z. G. 2022, A&A, 661, A55, doi: 10.1051/0004-6361/202142519
- Zhou et al. (2024) Zhou, C., Huang, L., Guo, K., Li, Y.-P., & Pan, Z. 2024, Phys. Rev. D, 109, 103031, doi: 10.1103/PhysRevD.109.103031