Efficient Milling Quality Prediction with Explainable Machine Learning
Abstract
This paper presents an explainable machine learning (ML) approach for predicting surface roughness in milling. Utilizing a dataset from milling aluminum alloy 2017A, the study employs random forest regression models and feature importance techniques. The key contributions include developing ML models that accurately predict various roughness values and identifying redundant sensors, particularly those for measuring normal cutting force. Our experiments show that removing certain sensors can reduce costs without sacrificing predictive accuracy, highlighting the potential of explainable machine learning to improve cost-effectiveness in machining.
keywords:
Machine Learning, Milling, Sustainable Production, Explainable ML1 Introduction
Machine Learning (ML) significantly impacts the manufacturing industry (Jyeniskhan et al., 2023; Jiang, 2023). Applying ML to manufacturing offers improved efficiency (Panzer and Bender, 2022), predictive maintenance (Wang et al., 2023), and better control over manufacturing quality (Kim et al., 2023).
In general, ML uses algorithms to interpret data and make predictions. It involves creating models that learn from a training data set and can be used to make predictions over unseen data. Before deployment, the trained ML model is tested on a test data set (Jiang, 2023).
However, integrating trained ML models into industrial applications comes with challenges (Sampedro et al., 2022; Khuat et al., 2023). One of these challenges is the ”black box” nature of many ML models, making it difficult for human experts to trust the prediction results of trained ML models (Kwon et al., 2023). This is essential because, in manufacturing, the addition of sensors to a machine tool for generating data for the ML model can be costly, difficult to be implemented (necessity of trained staff), may interfere in the working area inside the machine, and even might modify machine’s behaviour (e.g. reducing machine rigidity with installation of a dynamometer). (Dornfeld and Lee, 2008; Hawkridge et al., 2021). The inclusion of a specific sensor value in the data collection phase for a prototype system does not necessarily imply its significance for the ML model’s predictive capabilities; hence, it might be reasonable to consider omitting this sensor feature in the real system if subsequent analysis shows it does not contribute meaningfully to the model’s performance. Explainable ML encompasses methods that render the outputs of ML models comprehensible to humans, allowing for the analysis of how various features contribute to the model’s predictions (Rasheed et al., 2022; Tiddi and Schlobach, 2022; Theissler et al., 2022).
In this paper, we showcase with explainable ML methods that it is possible to train explainable ML models and to identify and remove already mounted non-significant sensors for high-quality roughness predicting ML models in the context of a milling system. The dataset for this paper was generated at MSMP - ENSAM, encompassing a series of surface milling operations on aluminium alloy 2017A. These operations employed a 20 mm diameter milling cutter, specifically the R217.69-1020.RE-12-2AN model equipped with two XOEX120408FR-E06 H15 carbide inserts from SECO. The process utilized a synthetic emulsion comprising water and 5% Ecocool CS+ cutting fluid.
The rest of the paper is organized as follows: Section 2 covers existing works on using AI for manufacturing/machining problems; Section 3 presents our explainable ML methodology; Section 4 provides a comprehensive guide on harnessing explainable machine learning techniques for the milling data set. In Section 5 and Section 6, we delve into the advantages and limitations of employing explainability methods in machining. These sections also offer concluding remarks and insights regarding the future prospects of this research.
2 Related Work
The usage of ML in manufacturing/machining tasks has been recognized as an interesting lead for at least a decade (Kummar, 2017). For instance, ML has been used initially to optimize turning processes (Mokhtari Homami et al., 2014), predicting stability conditions in milling (Postel et al., 2020), estimating the quality of bores (Schorr et al., 2020), or classifying defects using ML-driven surface quality control (Chouhad et al., 2021).
However, it is only recently that Explainable AI (XAI) methods have been identified as an interesting approach for manufacturing processes (Yoo and Kang, 2021; Senoner et al., 2022). The ongoing European XMANAI project (Lampathaki et al., 2021) aims to evaluate the capabilities of XAI in different sectors of manufacturing through the development of several use cases. In particular, fault diagnosis seems to be an area where XAI can be successfully applied (Brusa et al., 2023). Also, there exists work that focuses on feature selection on the dataset without taking the ML model directly into account (Bins and Draper, 2001; Oreski et al., 2017; Venkatesh and Anuradha, 2019). Using a simple milling dataset, we initially showed in (Gross et al., 2024) that ML models such as decision tree regression, gradient boosting regression, and random forest lead to interesting performances for accurate roughness value prediction. In (Gross et al., 2024), we also compared different explainability methods and observed that unfortunately, different methods lead to different explanations. This result calls for more experiments and results on the potential interest and benefice of using XAI methods in machining. Our paper specifically focuses on developing ML models for predicting roughness in milling and identifying redundant sensors. In contrast, (Gross et al., 2024) broadly aims to enhance the performance of ML models in forecasting milling quality through explainable machine learning methods.
3 Methodolodgy
This study aims to develop an explainable ML model for predicting milling surface roughness. Our approach focuses on using random forest regression (see Section 3.1) and feature importance methods (see Section 3.2) to not only achieve accurate and explainable predictions but also identify and eliminate non-essential sensors, thus enhancing cost-effectiveness.
3.1 Random Forest Regression Models
Random Forest Regression models also employ an ensemble learning strategy, building multiple decision trees during the training phase and aggregating them for predictions. The final prediction for an input is the average prediction across all trees in the ensemble:
where is the total number of trees and is the prediction of the -th tree. This aggregation helps enhance the model’s generalization capabilities and mitigates the risk of overfitting (Prasad et al., 2006). Overfitting is an undesirable ML behaviour occurring when the model fits too precisely the dataset used for its training and reveals itself incapable of generalizing properly to unseen data.
3.2 Explainable ML Methods
A critical aspect of our approach is employing feature permutation importance as a significant explainability method. This technique operates by evaluating the importance of different features in the model. The general procedure involves the random permutation of a single feature, keeping others constant, and monitoring the change in the model’s performance, often measured through metrics like mean squared error (Huang et al., 2016; Gross et al., 2024).
Mathematically, the feature importance of a feature can be defined as the difference in the model’s performance before and after the permutation of the feature and can be formulated as:
where is the model’s performance with the original data and is the performance with the -th feature permuted.
By iterating this process across all features and comparing the changes in performance, we can rank the features by their importance, offering deeper insights into the model’s decision-making process and enabling the identification of areas for optimization and refinement.
4 Case Study
In this case study, we apply our explainable ML to a dataset generated at MSMP - ENSAM. The dataset consists of a series of surface milling operations that were performed on aluminium 2017A using a 20 mm diameter milling cutter R217.69-1020.RE-12-2AN with two carbide inserts XOEX120408FR-E06 H15 from SECO, and a synthetic emulsion of water and 5% of Ecocool CS+ ( 5%) cutting fluid.
Objective. The aim is to develop a predictive model for each quality metric associated with roughness amplitude parameters. This necessitates not only the training of accurate models but also an elucidation of the predictive rationales behind their outputs. Concurrently, there is a need to identify and eliminate superfluous features from the models. This is a strategic step to minimize both installation and maintenance expenses related to redundant sensors, thereby optimizing resource allocation and reducing overall costs.
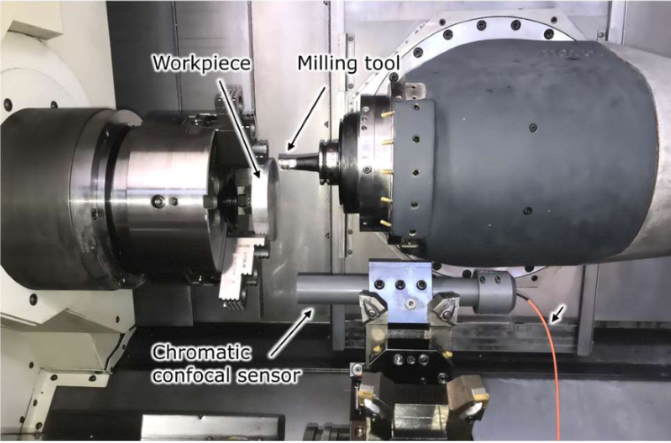
Dataset. In total, 200 experiments have been carried out varying the following process parameters: depth of cut, cutting speed, feed rate, and cutting mode (down and up milling). For each one of these experiments with different control parameters, cutting forces (normal force) and (active force), and surface profiles are measured on-machine using a Kistler 3-axis dynamometer 9257A and a STIL CL1-MG210 chormatic confocal sensor (non-contact) respectively. In the feature engineering step, the following surface roughness parameters are calculated using MountainsMap software. Some of the quality parameters are:
-
•
Ra (Average Roughness): Average value of the absolute distances from the mean line to the roughness profile within the evaluation length.
-
•
Rz (Average Maximum Height): Average value of the five highest peaks and the five deepest valleys within the evaluation length.
-
•
Rt (Total Roughness): Vertical distance between the highest peak and the deepest valley within the evaluation length.
-
•
Rq (Root Mean Square Roughness): Square root of the average of the squared distances from the mean line to the roughness profile within the evaluation length.
-
•
RSm (Mean Summit Height): Average height of the five highest peaks within the evaluation length.
-
•
RSk (Skewness): Measure of the asymmetry of the roughness profile around the mean line.
-
•
Rku (Kurtosis): Measure the peakedness or flatness of the roughness profile.
-
•
Rmr (Material Ratio): Ratio of the actual roughness profile area to the area within the evaluation length.
-
•
Rpk (Peak Height): Height of the highest peak within the evaluation length.
-
•
Rvk (Valley Depth): Depth of the deepest valley within the evaluation length.
-
•
Rdq: It is a hybrid parameter (height and length). It is the root mean square slope of the assessed profile, defined on the sampling length. Rdq is the first approach to surface complexity. A low value is found on smooth surfaces while higher values can be found on rough surfaces having microroughness.
Data Preprocessing. Since we are dealing with variable time series lengths, we calculate the box plot values for each time series in the time and frequency domain. Additionally, metadata within the dataset comprises experiment parameters with various focuses.
4.1 ML Model Training and Evaluation
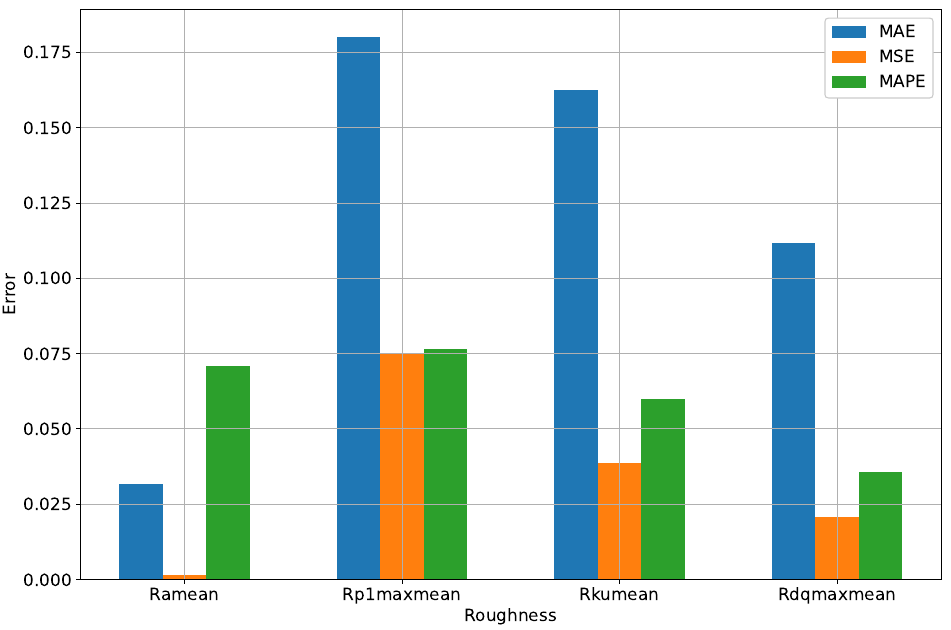
We trained random forest regression models on the preprocessed dataset to predict various surface roughness measures. The performance of the top four models is illustrated in Figure 3, evaluated using mean squared error (MSE) (Jin and Montúfar, 2023), mean absolute error (MAE) (Saha et al., 2022), and mean absolute percentage error (MAPE) (Maiseli, 2019). MSE quantifies the average of squared prediction errors, making it sensitive to outliers, whereas MAE represents the average absolute errors. MAPE, expressed as a percentage, measures the average absolute percent deviation from actual values, which is useful for comparing models across different scales.
Our models demonstrated proficiency in predicting Ramean, Rp1maxmean, Rkumean, and Rdqmaxmean surface roughness measures, achieving a MAPE under 8% (refer to Figure 3). Notably, the model predicting Rdqmaxmean reached a high-quality standard with a MAPE below 5%.
4.2 Assessing Gini Importance in Random Forest
Regression Models to reduce number of sensors
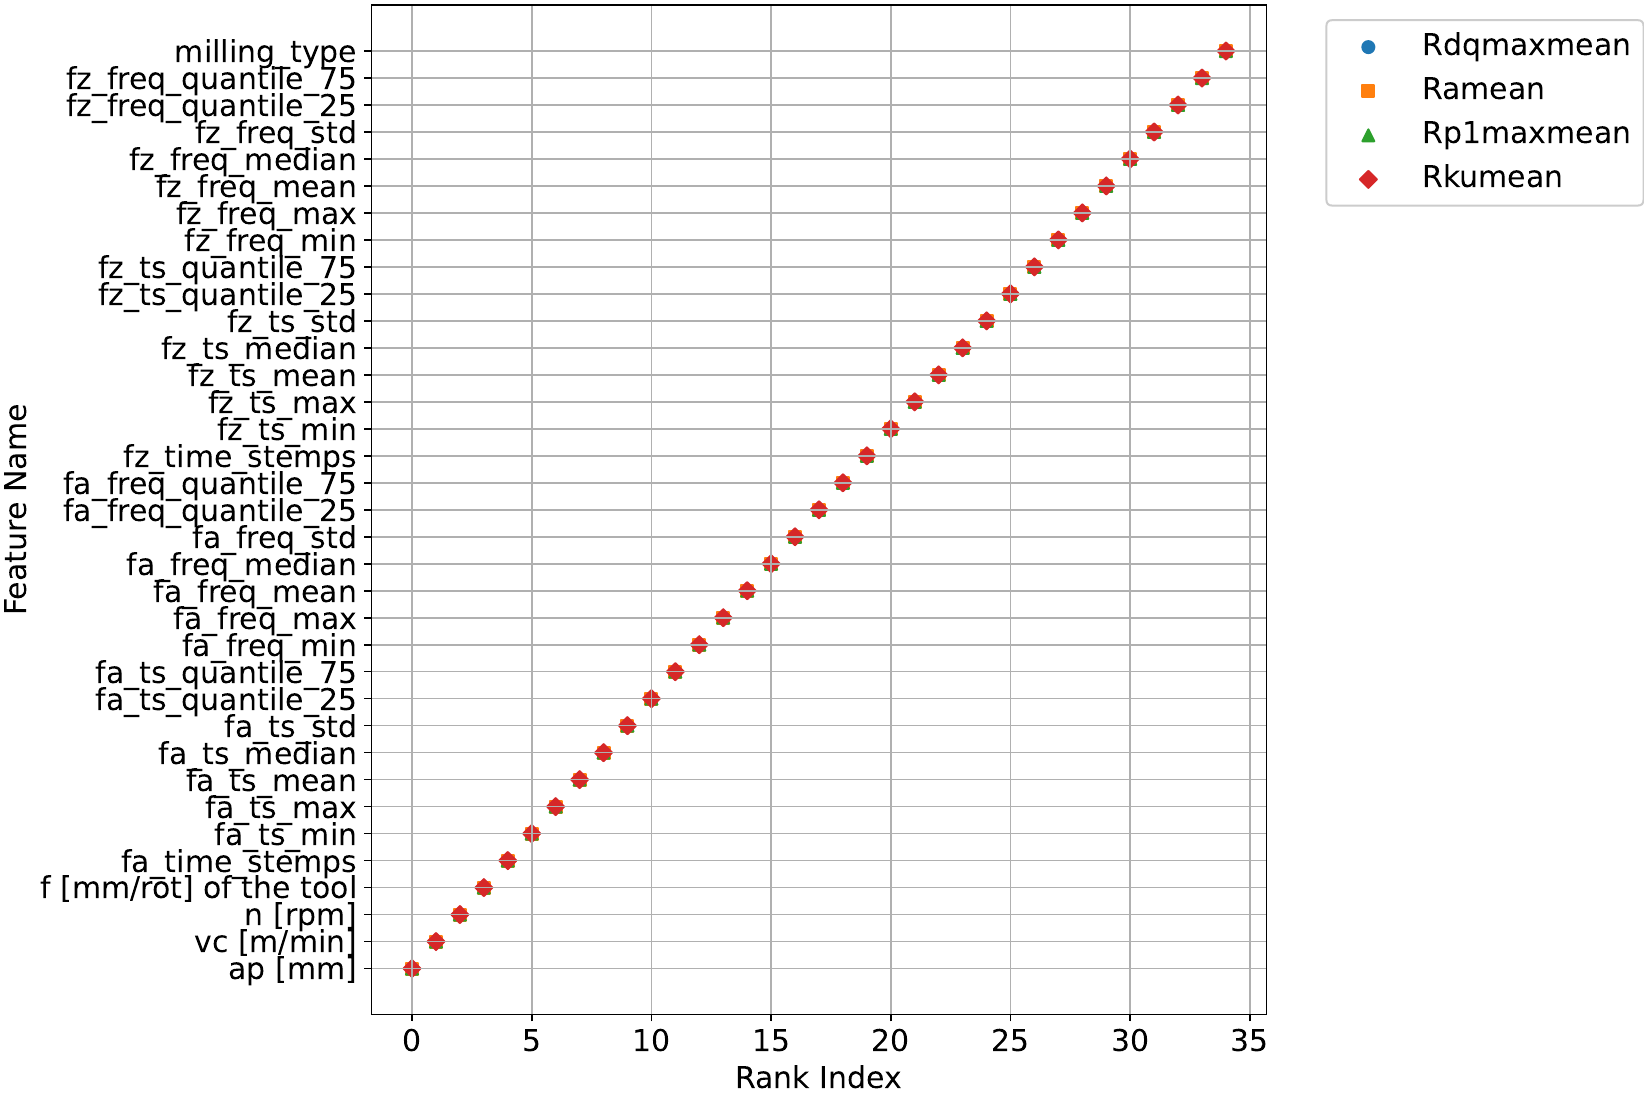
Given the trained random forest regression models from Section 4.1, we extract the gini importance for each feature (see Figure 4). We observe that even though the models tried to predict different roughness types, the importance of the feature is the same in every model. The most important features are the machine configuration parameters, followed by the box plot values of the active force (), then the normal cutting force (), and then the milling type (up milling/down milling).
Since all - and -related features are consistently ranked lower than the experiments’ machine configurations, these sensors seem less relevant to the trained model. We, therefore, remove all the - and -related features from our dataset and re-train the models.
The experimental results demonstrate that omitting the and sensors and concentrating solely on the machine configuration features leads to the development of more efficient predictive models. Specifically, the performance improved for Ramean, achieving a rate of compared to the previous . Similarly, the prediction accuracy for the surface roughness metric Rdqmaxmean enhanced, reducing from to . Additionally, this refined dataset enables us to predict the Rzmean surface roughness with a MAPE of . However, it is noteworthy that the performance metrics for both Rkumean and Rp1maxmean experienced a marginal decline of approximately .
4.3 Assessing the Significance of Feature Permutation Importance Across Various Data Subsets
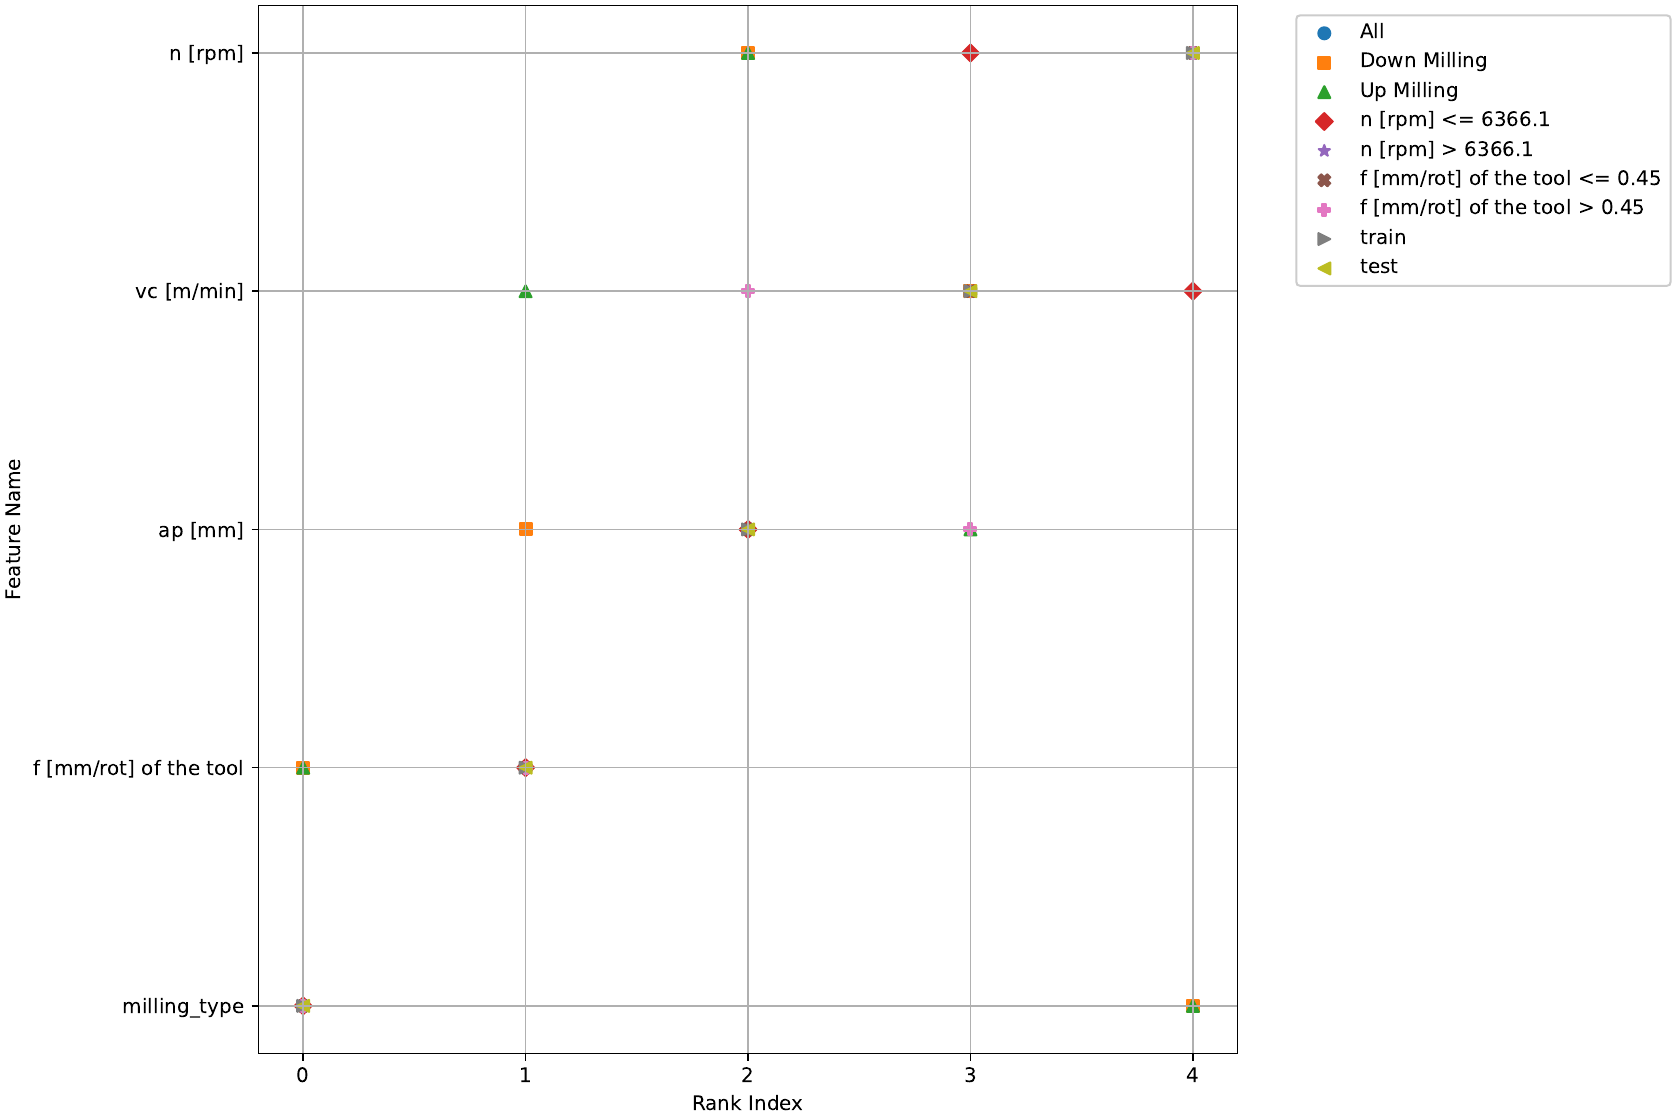
By analyzing the feature permutation importance of the trained random forest regression model for Rdqmaxmean from Section 4.2 across various data subsets, the experiment aims to understand how changes in individual features impact the model’s predictions across different segments of the dataset. A significant variation in feature permutation importance between the training and test sets could indicate that the models are overfitting. (Beltran-Royo et al., 2024).
Figure 5 suggests that the ML model exhibits relatively consistent behavior regarding how it values and responds to changes in each feature, regardless of the specific data subset being considered. Note, the experiment is based on the premise that different explanation methods (gini importance in Figure 4 vs. feature permutation importance in Figure 5) for ML models will result in varying interpretations, influenced by methodological differences, model complexity, and inherent biases in each approach (Lozano-Murcia et al., 2023). We observe that there can be a small change in the feature rank depending on the data split investigated, e.g. the order of vc and ap is reversed for the two splits of f of the tool . This shows that these features are relevant for the overall model and must be kept because they provide specific importance for the quality score prediction in certain subsets of the data.
5 Discussion
Our case study demonstrates the advantages of using explainable ML techniques in the context of surface roughness quality prediction models within the manufacturing sector. We can interpret the model predictions more effectively by utilizing explainability scores derived from feature importance analyses. This approach enables the identification and assessment of the significance of individual features in contributing to the overall predictive accuracy of the model. For economic reasons (Dornfeld and Lee, 2008), this allows us to remove sensors from the manufacturing machines while maintaining and even improving predictive accuracy for certain surface roughness values. Additionally, utilizing these ML models as digital twins (D’Amico et al., 2023) for the corresponding physical machinery opens new avenues for employing parameter optimization methods.
Nevertheless, it is important to acknowledge the risk of overfitting, a potential issue amplified by the limited size of the dataset used (Beltran-Royo et al., 2024). This concern suggests that definitive conclusions about overfitting can be ascertained through future research employing, for instance, larger datasets.
6 Conclusion
This study applies explainable machine learning to predict milling surface roughness, utilizing random forest regression and feature permutation importance. Key achievements include the creation of an accurate predictive model and the identification of non-essential sensors. Eliminating these redundant sensors, especially those measuring normal cutting force, enhances the model’s cost-effectiveness without sacrificing accuracy. This work exemplifies how explainable ML can optimize manufacturing processes, combining improved performance with economic efficiency.
For future work, we plan to apply our approach to a range of materials and milling processes to assess the robustness and adaptability of our model. This will include augmenting our dataset with synthetic data to improve ML training Rozanec et al. (2022). Additionally, we intend to apply our predictive models to different machines of the same type, evaluating their performance in these new contexts. Another particularly intriguing future work aspect of our research is leveraging these models within digital twins, facilitating advanced parameter optimization methods (Soori and Asmael, 2022).
References
- Beltran-Royo et al. (2024) Beltran-Royo, C., Llopis-Ibor, L., Pantrigo, J.J., and Ramírez, I. (2024). DC neural networks avoid overfitting in one-dimensional nonlinear regression. Knowl. Based Syst., 283, 111154.
- Bins and Draper (2001) Bins, J. and Draper, B.A. (2001). Feature selection from huge feature sets. In Proceedings Eighth IEEE International Conference on Computer Vision. ICCV 2001, volume 2, 159–165. IEEE.
- Brusa et al. (2023) Brusa, E., Cibrario, L., Delprete, C., and Di Maggio, L. (2023). Explainable ai for machine fault diagnosis: Understanding features’ contribution in machine learning models for industrial condition monitoring. Applied Sciences, 13(4), 20–38.
- Chouhad et al. (2021) Chouhad, H., Mansori, M.E., Knoblauch, R., and Corleto, C. (2021). Smart data driven defect detection method for surface quality control in manufacturing. Meas. Sci. Technol., 32(105403), 16pp.
- D’Amico et al. (2023) D’Amico, R.D., Addepalli, S., and Erkoyuncu, J.A. (2023). Industrial insights on digital twins in manufacturing: Application landscape, current practices, and future needs. Big Data Cogn. Comput., 7(3), 126.
- Dornfeld and Lee (2008) Dornfeld, D. and Lee, D.E. (2008). Sensors for precision manufacturing. Springer.
- Gross et al. (2024) Gross, D., Spieker, H., Gotlieb, A., and Knoblauch, R. (2024). Enhancing manufacturing quality prediction models through the integration of explainability methods. In ICAART. SCITEPRESS.
- Hawkridge et al. (2021) Hawkridge, G., Mukherjee, A., McFarlane, D.C., Tlegenov, Y., Parlikad, A.K., Reyner, N.J., and Thorne, A. (2021). Monitoring on a shoestring: Low cost solutions for digital manufacturing. Annu. Rev. Control., 51, 374–391.
- Huang et al. (2016) Huang, N., Lu, G., and Xu, D. (2016). A permutation importance-based feature selection method for short-term electricity load forecasting using random forest. Energies, 9(10), 767.
- Jiang (2023) Jiang, J. (2023). A survey of machine learning in additive manufacturing technologies. Int. J. Comput. Integr. Manuf., 36(9), 1258–1280.
- Jin and Montúfar (2023) Jin, H. and Montúfar, G. (2023). Implicit bias of gradient descent for mean squared error regression with two-layer wide neural networks. J. Mach. Learn. Res., 24, 137:1–137:97.
- Jyeniskhan et al. (2023) Jyeniskhan, N., Keutayeva, A., Kazbek, G., Ali, M.H., and Shehab, E. (2023). Integrating machine learning model and digital twin system for additive manufacturing. IEEE Access, 11, 71113–71126.
- Khuat et al. (2023) Khuat, T.T., Bassett, R., Otte, E., Grevis-James, A., and Gabrys, B. (2023). Applications of machine learning in biopharmaceutical process development and manufacturing: Current trends, challenges, and opportunities. CoRR, abs/2310.09991.
- Kim et al. (2023) Kim, G., Choi, J., Ku, M., and Lim, S. (2023). Developing a semi-supervised learning and ordinal classification framework for quality level prediction in manufacturing. Comput. Ind. Eng., 181, 109286.
- Kummar (2017) Kummar, S.L. (2017). State of the art-intense review on artificial intelligence systems application in process planning and manufacturing. Engineering Applications of Artificial Intelligence, 65, 294–329.
- Kwon et al. (2023) Kwon, H.J., Koo, H.I., and Cho, N.I. (2023). Understanding and explaining convolutional neural networks based on inverse approach. Cogn. Syst. Res., 77, 142–152.
- Lampathaki et al. (2021) Lampathaki, F., Agostinho, C., Glikman, Y., and Sesana, M. (2021). Moving from ‘black box’ to ‘glass box’ artificial intelligence in manufacturing with xmanai. In 2021 IEEE International Conference on Engineering, Technology and Innovation (ICE/ITMC). Cardiff, UK.
- Lozano-Murcia et al. (2023) Lozano-Murcia, C., Romero, F.P., Serrano-Guerrero, J., and Olivas, J.A. (2023). A comparison between explainable machine learning methods for classification and regression problems in the actuarial context. Mathematics, 11(14), 3088.
- Maiseli (2019) Maiseli, B.J. (2019). Optimum design of chamfer masks using symmetric mean absolute percentage error. EURASIP J. Image Video Process., 2019, 74.
- Menze et al. (2009) Menze, B.H., Kelm, B.M., Masuch, R., Himmelreich, U., Bachert, P., Petrich, W., and Hamprecht, F.A. (2009). A comparison of random forest and its gini importance with standard chemometric methods for the feature selection and classification of spectral data. BMC bioinformatics, 10, 1–16.
- Mokhtari Homami et al. (2014) Mokhtari Homami, R., Fadaei Tehrani, A., Mirzadeh, H., Movahedi, B., and Azimifar, F. (2014). Optimization of turning process using artificial intelligence technology. The International Journal of Advanced Manufacturing Technology, 70, 1205–1217.
- Oreski et al. (2017) Oreski, D., Oreski, S., and Klicek, B. (2017). Effects of dataset characteristics on the performance of feature selection techniques. Applied Soft Computing, 52, 109–119.
- Panzer and Bender (2022) Panzer, M. and Bender, B. (2022). Deep reinforcement learning in production systems: a systematic literature review. International Journal of Production Research, 60(13), 4316–4341.
- Pedregosa et al. (2011) Pedregosa, F., Varoquaux, G., Gramfort, A., Michel, V., Thirion, B., Grisel, O., Blondel, M., Prettenhofer, P., Weiss, R., Dubourg, V., Vanderplas, J., Passos, A., Cournapeau, D., Brucher, M., Perrot, M., and Duchesnay, E. (2011). Scikit-learn: Machine learning in Python. Journal of Machine Learning Research, 12, 2825–2830.
- Postel et al. (2020) Postel, M., Bugdayci, B., and Wegener, K. (2020). Ensemble transfer learning for refining stability predictions in milling using experimental stability states. The International Journal of Advanced Manufacturing Technology, 107, 4123–4139.
- Prasad et al. (2006) Prasad, A.M., Iverson, L.R., and Liaw, A. (2006). Newer classification and regression tree techniques: bagging and random forests for ecological prediction. Ecosystems, 9, 181–199.
- Rasheed et al. (2022) Rasheed, K., Qayyum, A., Ghaly, M., Al-Fuqaha, A.I., Razi, A., and Qadir, J. (2022). Explainable, trustworthy, and ethical machine learning for healthcare: A survey. Comput. Biol. Medicine, 149, 106043.
- Rozanec et al. (2022) Rozanec, J.M., Zajec, P., Theodoropoulos, S., Koehorst, E., Fortuna, B., and Mladenic, D. (2022). Synthetic data augmentation using GAN for improved automated visual inspection. CoRR, abs/2212.09317.
- Saha et al. (2022) Saha, S., Makkar, H.S., Sukumaran, V.B., and Murthy, C.R. (2022). On the relationship between mean absolute error and age of incorrect information in the estimation of a piecewise linear signal over noisy channels. IEEE Commun. Lett., 26(11), 2576–2580.
- Sampedro et al. (2022) Sampedro, G.A.R., Rachmawati, S.M., Kim, D., and Lee, J. (2022). Exploring machine learning-based fault monitoring for polymer-based additive manufacturing: Challenges and opportunities. Sensors, 22(23), 9446.
- Schorr et al. (2020) Schorr, S., Moller, M., Heib, J., Fang, S., and Bahre, D. (2020). Quality prediction of reamed bores based on process data and machine learning algorithm: A contribution to a more sustainable manufacturing. Procedia Manufacturing, 43, 519–526.
- Senoner et al. (2022) Senoner, J., Netland, T.H., and Feuerriegel, S. (2022). Using explainable artificial intelligence to improve process quality: Evidence from semiconductor manufacturing. Manag. Sci., 68(8), 5704–5723.
- Soori and Asmael (2022) Soori, M. and Asmael, M. (2022). A review of the recent development in machining parameter optimization. Jordan Journal of Mechanical and Industrial Engineering, 16(2), 205–223.
- Theissler et al. (2022) Theissler, A., Spinnato, F., Schlegel, U., and Guidotti, R. (2022). Explainable AI for time series classification: A review, taxonomy and research directions. IEEE Access, 10, 100700–100724.
- Tiddi and Schlobach (2022) Tiddi, I. and Schlobach, S. (2022). Knowledge graphs as tools for explainable machine learning: A survey. Artif. Intell., 302, 103627.
- Venkatesh and Anuradha (2019) Venkatesh, B. and Anuradha, J. (2019). A review of feature selection and its methods. Cybernetics and information technologies, 19(1), 3–26.
- Wang et al. (2023) Wang, X., Liu, M., Liu, C., Ling, L., and Zhang, X. (2023). Data-driven and knowledge-based predictive maintenance method for industrial robots for the production stability of intelligent manufacturing. Expert Syst. Appl., 234, 121136.
- Yoo and Kang (2021) Yoo, S. and Kang, N. (2021). Explainable artificial intelligence for manufacturing cost estimation and machining feature visualization. Expert Systems with Applications, 183.