A Data-Informed Analysis of Scalable Supervision for Safety in Autonomous Vehicle Fleets
Abstract
Autonomous driving is a highly anticipated approach toward eliminating roadway fatalities. At the same time, the bar for safety is both high and costly to verify. This work considers the role of remotely-located human operators supervising a fleet of autonomous vehicles (AVs) for safety. Such a ‘scalable supervision’ concept was previously proposed to bridge the gap between still-maturing autonomy technology and the pressure to begin commercial offerings of autonomous driving. The present article proposes DISCES, a framework for Data-Informed Safety-Critical Event Simulation, to investigate the practicality of this concept from a dynamic network loading standpoint. With a focus on the safety-critical context of AVs merging into mixed-autonomy traffic, vehicular arrival processes at 1,097 highway merge points are modeled using microscopic traffic reconstruction with historical data from interstates across three California counties. Combined with a queuing theoretic model, these results characterize the dynamic supervision requirements and thereby scalability of the teleoperation approach. Across all scenarios we find reductions in operator requirements greater than 99% as compared to in-vehicle supervisors for the time period analyzed. The work also demonstrates two methods for reducing these empirical supervision requirements: (i) the use of cooperative connected AVs — which are shown to produce an average 3.67 orders-of-magnitude system reliability improvement across the scenarios studied — and (ii) aggregation across larger regions.
I Introduction
Autonomous vehicle (AV) deployments in the real world face a number of obstacles, suggesting that ‘Level 5’ autonomy — in which AVs can drive safely and effectively at all times, in all places, and in all conditions — is further away than initially projected [1]. In the near- to medium-term, and longer if necessary, vehicles with some degree of autonomous capabilities still rely on human drivers for supervision and operation in various driving situations. Should a Level 5 AV be developed, the question of how to prove its safety likewise remains open, given the unpredictable and rare nature of many dangerous driving circumstances [2].
At the same time, AVs have the potential to significantly improve system-level roadway performance and reduce carbon emissions, even when they only represent a minority of vehicles in a traffic system [3].
In light of these realities, AV deployments today make use of remote operators: Cruise on average triggered one remote intervention every 2.5 to 5 miles in its San Francisco AV deployment [4]. A number of companies are directly targeting ‘teledriving’ as their primary approach to addressing autonomous technology’s shortcomings [5].
While previous research has considered how to scale online human supervision for a desired level of safety for merging AVs [6], it performs queueing-theoretic statistical analyses of various scenarios rather than considering real-world traffic data.
Focusing on the case of AVs merging into mixed-autonomy traffic, our work takes a data-informed dynamic network loading approach. By leveraging large-scale reconstructions of historical data, we simulate traffic across the course of a day on 1,097 freeway merge points in Los Angeles, San Bernardino, and Orange Counties to empirically assess the question: how many supervisors would we need for county-level human oversight of dangerous interstate merges over an entire day?
More specifically, the work makes three contributions:
-
1.
The introduction of DISCES: a framework for Data-Informed Safety-Critical Event Simulation. This combines large-scale data with traffic microsimulation to approximate the number and location of critical safety events in realistic settings.
-
2.
Empirical estimates for the number of human operators needed to supervise AV merges on county-scale interstate networks, as well as queuing theoretic estimates for long-term supervision needs in these settings.
-
3.
Demonstration of two methods for improving supervision scalability: cooperative connected AVs and supervision task aggregation across larger regions.
Our findings provide data-driven validation for the idea that human supervision may ease deployment of imperfect AVs in certain safety-critical roadway settings.
II Related Work
Data-informed analysis of traffic safety
Assessing safety in traffic systems historically has been driven by observational studies using historical datasets, including police-reported crash data [7]. As a result, works assessing transportation system safety have often leaned on implicit notions of safety as the absence of crashes, injuries, or deaths for analysis [8, 9], even when considering broader public health and risk management frameworks for addressing traffic safety issues [10]. Of course, drivers know anecdotally that many unsafe situations (‘close calls’) do not result in accidents, and even fewer may result in reported accidents. This is where traffic modeling is of use.
Traffic modeling is typically conducted at one of two levels: macroscopic (aggregated) and microscopic (agent-based). Macroscopic traffic system models generally do not account for safety incidents [11], although there is some discussion of safe velocities in traffic flows [12]. This is partially due to the fact that safety incidents are microscopic in nature (that is, partially dependent on local interactions) and macroscopic models do not capture such vehicle-level dynamics.
Traffic microsimulators such as the Simulation of Urban Mobility (SUMO) are therefore well-suited to safety analysis given their modeling of realistic vehicle-level traffic dynamics [13]. However, to the authors’ knowledge, such microsimulation tools have not been paired with real-world data for safety analysis on the scale of this work. Work combining observational data and microsimulation has been small-scale and focused on assessing various car-following models [14]. Larger-scale works leveraging traffic simulators focus on performance metrics like throughput or travel time, but ignore safety metrics in their analysis [15, 16]. The traffic safety survey in [17] only relies on historical data for safety assessments, whereas microsimulation models provide an opportunity to analyze counterfactuals.
Teleoperation for Connected Autonomous Vehicles (CAVs)
Teleoperation of roadway vehicles (also known as ‘teledriving,’ ‘tele-assistance,’ or remote operation) is growing in popularity alongside advances in cellular network infrastructure and vehicular connectivity and autonomy — one recent survey found 15 companies offering operations support or vehicle service for remote driving, assistance, or monitoring [5]. Some of these, such as Cruise, combine remote human operators with CAV technology [4]. Such deployments exhibit varying objectives including performance, customer satisfaction, and safety.
Academic literature on the subject tends to focus on human factors questions, such as teleoperation interface design [18, 19, 20]. A small but growing body of work applies queuing models to assess the scalability of teleoperation for connected vehicle fleets [6, 21].
To the authors’ knowledge, no work exists leveraging historical data to assess the scalability of such teleoperation, especially for AV safety.
Highway merging
This paper’s focus is merging, a known challenging situation for AVs [22, 23]. It often occurs at high speeds with the potential for collision with other vehicles or fixed infrastructure and it depends on the behavior of nearby vehicles, perhaps even necessitating jockeying or (for humans) hand signaling that evades easy explicit definition or even violates standard driving rules. Indeed, previous work modeling safety at freeway merges found lower speeds to be associated with more collisions on inbound lanes [24]. Due to the challenging and dangerous nature of merges, we focus on this maneuver, but future work could consider supervision events beyond merges (lane changes, handling construction zones, etc.) using the DISCES framework.
III Preliminaries
Reachability
Reachability analysis is a well-known tool for assessing and enforcing system safety in robotics. Increasingly it has been applied to AVs [25]. It has a straightforward application in our context: two vehicles may collide in some time horizon only if they can reach each other in that horizon. Thus, if the vehicles are beyond each other’s reachable zone, they cannot collide. And where vehicles cannot collide, from a merging vehicle’s perspective, the merge maneuver is akin to driving straight on an open lane. Previous work investigating the scalability of supervision in this context leveraged kinematics-based reachability to determine the scenarios which require human supervision [6].
This work adopts the same approach: a merging AV must be supervised if there is any possibility over some time horizon of collision with a vehicle on the lane to which it is merging. Such a method is an over-approximation of the reachable set, but it maintains conservatism and is computationally efficient. Additionally, by not supervising merges where an AV cannot collide into a vehicle on the lane to which it is merging, we can achieve better supervision scalability. Note that this assumes a baseline level of AV capabilities (e.g., lane-keeping).
Queuing theoretic model
Our simulation allows us to find the number of human supervisors that would have been necessary during the period simulated. Of course, given that this is a hindsight estimate, a reasonable question is: how can we size supervision teams appropriately, given uncertainty in traffic flows?
To address this, we leverage a result from previous work indicating the “fraction of AVs that require supervision but cannot immediately receive it (and thus go unsupervised)” [6] under independent arrival and service rate assumptions. This is given by
| (1) |
where the arrival of merges to supervise arise via a Poisson process , is the number of supervisors for whom the service time of each follows , and to have a steady state probability. This allows us to model the number of supervisors necessary to achieve an arbitrary reliability level (e.g., 99%, 99.99%) over time.
Since previous work did not have data-driven values for and , we generate these values via traffic reconstruction and leverage them to identify the empirical number of supervisors needed to achieve a given reliability level at the rates found for the given day, as well as to demonstrate the benefits of pooling supervision tasks.
IV Problem Formulation
We are interested in (i) the number of operators necessary to supervise all safety-critical events over the course of a day, and (ii) the minimum number of operators necessary to achieve a long-term desired level of supervision reliability such that based on the queuing theoretic model in Equation 1, for which we will determine and empirically.
Let indicate the event in which a merging AV can arrive at merge point within the near-future of time . Let be defined similarly, except for an on-highway vehicle — either human-driven or an AV — on the lane to which AV is about to merge.
We can thus let
| (2) |
indicate a potential near-term conflict between on-highway vehicle and merging AV at merge point and time , where is an indicator function. This is the safety-critical event that we require a human operator to supervise. Therefore, the number of AVs requiring supervision at a given time is , where is the number of AVs in the system at that time.
For the case in (i) above, we can find the number of supervisors needed over the course of the time period with a length of as
| (3) |
For the case in (ii) above, we seek to extract empirical values of and from the data-driven simulation and then leverage Equation 1 to find the number of supervisors to achieve an arbitrary desired reliability level such that .
V Methodology
We term the framework for our approach DISCES, for Data-Informed Safety-Critical Event Simulation. It consists of four parts:
-
1.
Large-scale, real-world traffic data
-
2.
Traffic reconstruction via microsimulation based on that data
-
3.
Extraction of safety-critical events
-
4.
Analysis of the extracted safety-related events
In short, data is used for dynamic network loading to calibrate a traffic reconstruction, which is in turn used to simulate the dynamics necessary to identify and extract safety-critical events at the level of individual vehicles. These events are then passed to the fourth module for handling and analysis.
Data-driven traffic reconstruction — (1) and (2) above
DISCES relates to the broader class of approaches to the dynamic network loading challenge — namely, determining time-varying traffic flows across a road network. Given that vehicle detection data from stationary sensors is not sufficient to fully determine specific routes and traffic volume, the first step is to reconstruct realistic, data-informed traffic flows.
As described in [26], a road network consists of edges (road segments) and vertices . We have real-world vehicle detection count data at corresponding edges over time . Our objective is to recover a set of routes and a flow function mapping a route of edges to the number of vehicles on each edge in at time . To do so, one must find and such that, , , where is the element of corresponding to . This can be accomplished via a variety of methods; we describe ours in the next section.
Vehicle inflows , where is the first edge along , are used to induce traffic system states in a traffic dynamics model (e.g., traffic microsimulator SUMO) which simulates the next state given the current state and control inputs . Traffic microsimulators are known as one approach towards dynamic network loading, particularly with the growing availability of vehicle detection data [27]. The output is thus a data-driven traffic reconstruction from which we can extract safety-critical events. It is important to note that — due to coarseness in data granularity, underspecification of routes, AV-induced trajectory shifts, etc. — we do not expect the simulation to be a perfect recreation. Fortunately, we are not interested in recreating specific safety-critical events (e.g., a particular crash on August 1st), but rather extracting system-level safety statistics (e.g., the number of supervisors that we would need on days like August 1st). Still, as the quality and quantity of traffic data grows — for example, from mobile devices or onboard navigation systems — so can the quality of the reconstruction.
Extraction and analysis of safety-critical events — (3) and (4) above
From the traffic dynamics model , at each time the number of safety-critical events can be extracted from the system state . This can be done via a function such that . Importantly, the DISCES framework is suitable for a range of safety assessment functions . Below we present a reachability-based safety event identification, but one could use any number of safety surrogates identifiable in simulation, whether based on time, deceleration, distance, kinetic energy, or some combination of these.
A conservative estimate of the reachable distance over time horizon for a vehicle can be written via kinematics as
| (4) |
where is the vehicle’s speed at current time and is the maximum acceleration. Indicating the distance between a vehicle and merge point at time as , we can rewrite Equation 2 using reachability principles as
This represents the event in which the merge point falls within the reachable distance of both a merging AV and at least one on-highway vehicle .
Thus we can find the value of and for case (i) as described above, for example using 86,400 in Equation 3 for a daylong simulation with seconds-level granularity. This provides the number of supervisors needed over the day.
For case (ii) recall we aim to extract empirical values of and for use in Equation 1. The number of supervision tasks for the th hour, , in a simulation with seconds-level time granularity is
where is the set of merge points encounters, such that a conflict event only registers once per merge point per AV (that is, per pair). Intuitively, once a remote operator begins supervising the merge, they continue to do so until the merge is complete or supervision is unnecessary for the remainder of the merge, so there is no need to re-engage each timestep. Note this formulation allows the possibility for an AV to encounter multiple merge points on its journey — indeed, in the simulation many do.
Thus, the average arrival rate of supervision tasks for the th hour with seconds-level granularity is
| (5) |
Similarly, the value parameterizing the service rates of the supervisors for the th hour in the same simulation is:
| (6) |
where
represents the cumulative supervision time required. In short, is the average time per supervision task in the th hour, again allowing for an AV to encounter multiple merge points.
VI Experimental Setup
Traffic microsimulation with realistic traffic data
For the first and second subcomponents of the DISCES framework, we adapted the traffic flow reconstruction and simulation outlined in [26], with two notable modifications. First, we use 1-second time discretization instead of 5-second time discretization for increased simulation granularity and to enable seconds-level reachability analysis. Second, we use Intelligent Driver Model (IDM) values to parameterize the driving behavior of the vehicles in the simulation [28]. These are drawn from German highway drivers; we found they provided similar qualitative behavior to values drawn from US highway drivers, but are more interpretable and were found to create fewer simulation artifacts than those in [26]. Most importantly, IDM values are significantly more common in assessments of safe driving behavior, and thus we focus our reporting and discussion on simulations based upon them.
This pipeline produces vehicle flows approximating historical traffic via SUMO’s in-built method for computing vehicle routes from vehicle detection data, based on a maximum flow algorithm suggested in [29]. For the road network , OpenStreetMaps data is used to build interstate networks at lane-level granularity, including on- and off-ramps [30]. California’s Caltrans Performance Measurement System (PeMS), which has vehicle detector data in 30-second increments from nearly 40,000 sensors across the state’s freeway system, is the source of vehicle count data [31].
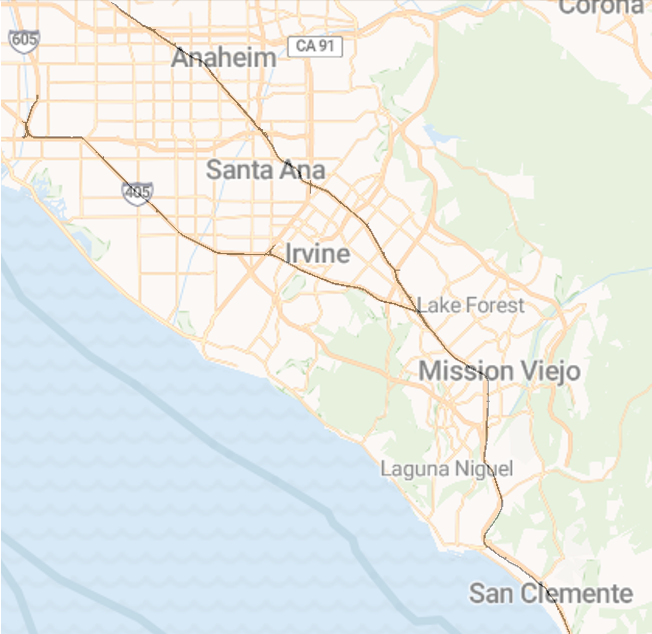
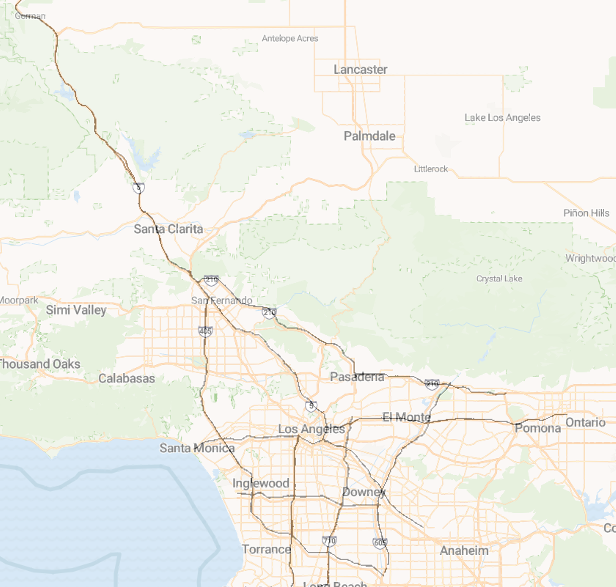
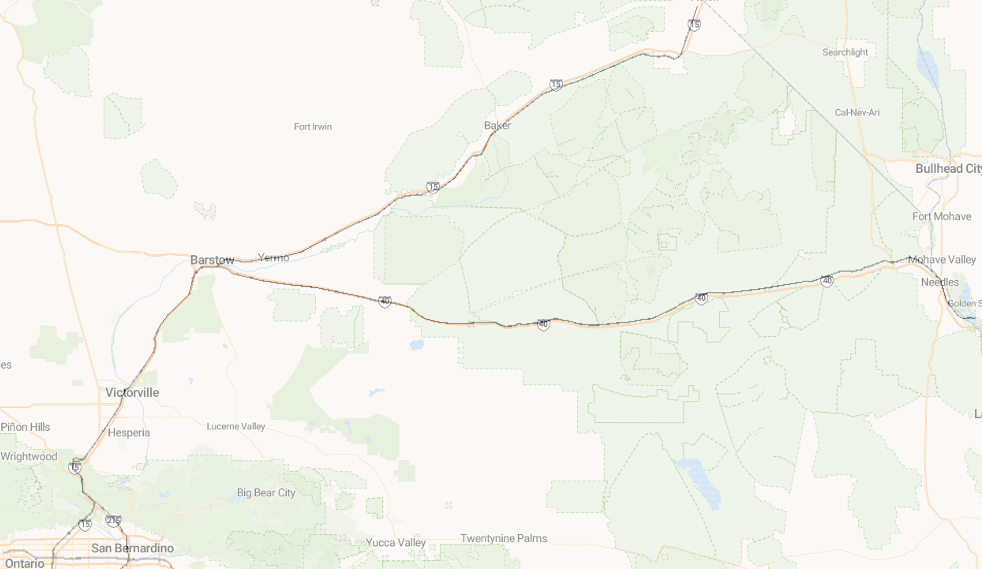
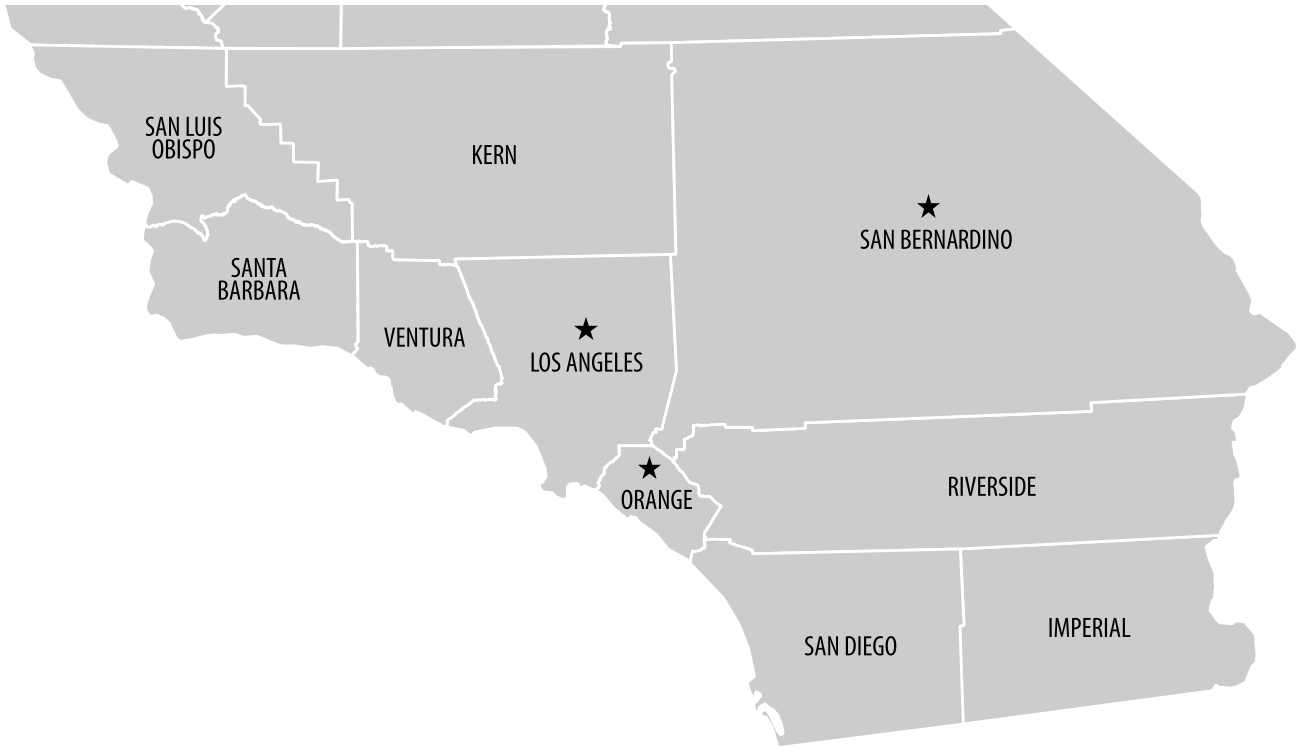
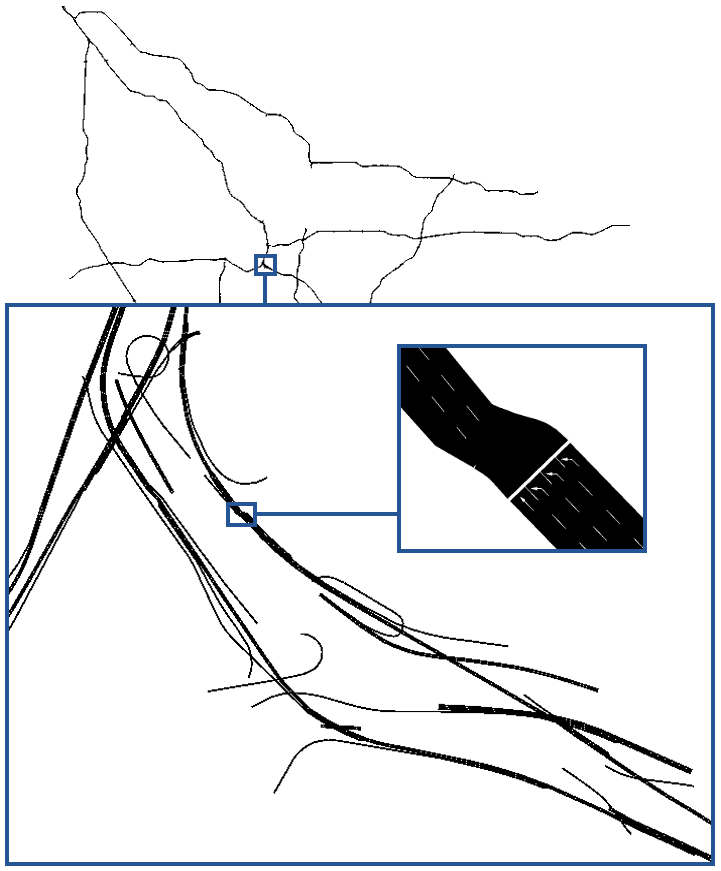
We simulate interstate traffic across three adjacent California counties (Los Angeles, Orange, and San Bernardino) based on the historical flows for the 24 hours of Wednesday, August 1st, 2018 in those counties. This was selected as one example of a standard weekday — future work could consider days with atypical travel demand. See Figures 1, 2, and 3. These were chosen for their significant traffic volumes, variety in density and geography, and because their proximity could allow for easier pooling of supervisors than non-adjacent counties (due to teleoperator location, system latency issues, consistency of local driving laws and norms, similarity of driving conditions, etc.). A merge is defined as any SUMO junction that has fewer outgoing lanes than incoming lanes. This includes on-ramps where a merge is necessary, as well as regular interstate portions where the number of lanes is reduced. This definition identified 192 merge points in the Orange County interstate system, 289 in San Bernardino County, and 616 in Los Angeles County.
This work considers three types of AVs: unconnected (UCAVs), noncooperative connected (NCAVs), and cooperative connected (CCAVs). The first difference is that UCAVs and NCAVs do not adjust their behavior to accommodate merging AVs, while CCAVs do. That is, all AVs are parameterized with the same driving models as the human vehicles (HVs), except the CCAVs, which have an additional simple cooperative driving policy whereby they seek to free a lane for a merging AV by shifting to an adjacent lane when space allows, similar to the altruistic behavior described in [32]. The second difference is that, unlike the UCAVs, to emulate the advantages of connectivity for reducing uncertainty, the NCAVs and CCAVs have truncated reachable zones as in [6]. That is, since the vehicles are autonomous and connected, they communicate their near-term trajectory to other connected AVs. This reduces the uncertainty inherent to the calculation of reachable sets and truncates the kinematics-based reachable distance in Equation 4 to the vehicle’s length.
This work takes seconds for our reachability time horizon. One meta-analysis of 129 studies found more than 80% of the 520 mean times for human takeover of vehicular control from an automated system were below five seconds, even while several of the included studies assessed distracted drivers [33]. Additional research including participants driving at highway speeds also exhibit takeover times below five seconds [34]. Recent AV deployments suggest this threshold may be an over-approximation: 98% of Cruise’s remote assistance sessions for its San Francisco deployment were answered within three seconds [35]. Finally, note that in practice, vehicles rarely drive their maximum acceleration, so the reachability horizon actually provides considerably more time for a supervisor to assume control of the AV before it reaches the merge point.
We simulate nine scenarios for each county, representing the possible combinations of three AV penetration rates (25%, 50%, and 75%) for our three AV types. In the case that a merging AV has on-and-off supervision requirements (e.g., needs a supervisor, then does not because the on-highway vehicle shifted lanes, then does when another on-highway vehicle approaches), we take the conservative approach by assigning a supervisor for the duration from the first moment of required oversight to the last.
VII Results
| 25% AV Pen. Rate | 50% AV Pen. Rate | 75% AV Pen. Rate | |||||
|---|---|---|---|---|---|---|---|
| County | AV Type | Mean (Std.) | Max. [Mean] | Mean (Std.) | Max. [Mean] | Mean (Std.) | Max. [Mean] |
| Speed (m/s) | # Suprvsrs. | Speed (m/s) | # Suprvsrs. | Speed (m/s) | # Suprvsrs. | ||
| UCAV | 18.83 (4.04) | 24 [7.2] | 18.83 (4.04) | 45 [14.4] | 18.83 (4.04) | 59 [21.5] | |
| Orange | NCAV | 18.83 (4.04) | 22 [6.3] | 18.83 (4.04) | 37 [10.5] | 18.83 (4.04) | 41 [12.4] |
| CCAV | 18.83 (4.03) | 24 [5.8] | 18.8 (4.03) | 30 [9.6] | 18.74 (4.05) | 37 [10.8] | |
| 3.1mn pop. | Baseline 1: all merges | - | 42 [12] | - | 75 [24] | - | 101 [36] |
| 800 mi2 area | Baseline 2: trip duration | - | 3,406 [1,861] | - | 6,785 [3,727] | - | 10,025 [5,571] |
| 192 merge points | CCAV-UCAV gain | 0.00% | 0.0% | -0.16% | 33.3% | -0.48% | 37.3% |
| CCAV-Baseline 1 gain | - | 42.9% | - | 60.0% | - | 63.4% | |
| CCAV-Baseline 2 gain | - | 99.3% | - | 99.6% | - | 99.6% | |
| UCAV | 23.98 (2.04) | 22 [5.7] | 23.98 (2.04) | 35 [11.4] | 23.98 (2.04) | 49 [17.0] | |
| San | NCAV | 23.98 (2.04) | 20 [4.8] | 23.98 (2.04) | 27 [7.3] | 23.98 (2.04) | 30 [7.5] |
| Bernardino | CCAV | 23.88 (2.09) | 20 [4.9] | 23.6 (2.24) | 33 [7.3] | 23.23 (2.36) | 30 [7.7] |
| Baseline 1: all merges | - | 46 [15] | - | 77 [28] | - | 111 [41] | |
| 2.1mn pop. | Baseline 2: trip duration | - | 3,400 [1,686] | - | 6,813 [3,387] | - | 10,171 [5,074] |
| 20,000 mi2 area | CCAV-UCAV gain | -0.42% | 9.1% | -1.58% | 5.7% | -3.13% | 38.8% |
| 289 merge points | CCAV-Baseline 1 gain | - | 56.5% | - | 57.1% | - | 73.0% |
| CCAV-Baseline 2 gain | - | 99.4% | - | 99.5% | - | 99.7% | |
| UCAV | 22.24 (2.53) | 32 [8.1] | 22.24 (2.53) | 48 [16.2] | 22.24 (2.53) | 67 [24.2] | |
| Los | NCAV | 22.24 (2.53) | 29 [7.0] | 22.24 (2.53) | 41 [11.5] | 22.24 (2.53) | 49 [13.0] |
| Angeles | CCAV | 22.22 (2.55) | 25 [7.0] | 22.19 (2.55) | 36 [11.3] | 22.13 (2.57) | 38 [12.0] |
| Baseline 1: all merges | - | 38 [10] | - | 60 [20] | - | 82 [30] | |
| 9.7mn pop. | Baseline 2: trip duration | - | 5,067 [2,653] | - | 10,181 [5,317] | - | 15,329 [7,953] |
| 4,000 mi2 area | CCAV-UCAV gain | -0.09% | 21.9% | -0.22% | 25.0% | -0.49% | 43.3% |
| 616 merge points | CCAV-Baseline 1 gain | - | 34.2% | - | 40.0% | - | 53.7% |
| CCAV-Baseline 2 gain | - | 99.5% | - | 99.6% | - | 99.8% | |
| UCAV/CCAV pen. rate | 25% | 50% | 75% |
| Cross-county ‘nines’ | |||
| (orders-of-magnitude) of | 1 | 4 | 6 |
| reliability gained via CCAVs | |||
| Avg. ‘nines’ gain across all settings | 3.67 | ||
Results for the empirical number of supervisors required over the course of a day are shown in Table I. For each of the 27 scenarios (a product of the three counties, three penetration rates, and three AV types), the table shows performance and safety values. Performance is assessed as the mean speed across vehicles averaged over the duration of the day. The associated standard deviation is shown in parentheses. Safety is measured as the maximum number of supervisors needed to monitor AV merges over the 24 hours. The mean value is included in brackets to provide a sense of how many supervisors would be active on average.
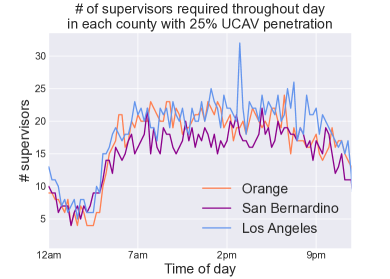
Note that the supervisor means are substantially lower than the maximums; this helps illustrate the variance in the supervision requirements (see Figure 4) and also provides some intuition on how busy the supervision team would be. Even as the present research leaves to future work questions related to accounting for broader human factors (buffer time between tasks, breaks, etc.), the maximum-mean gaps across the scenarios suggests that an appropriately-sized supervision team may not often operate at capacity, which could ease the task for the remote operators.
Given the range of possible AV deployment paradigms, we include two baselines. The first (‘Baseline 1’) represents a scenario in which the remote operators must supervise all AV merges. This highlights the benefit of reachability-based supervision, since an AV in Baseline 1 is supervised even when merging onto an empty highway. The second (‘Baseline 2’) represents a more demanding case in which all AVs are supervised for the duration of their trip in a 1:1 human:AV ratio. This approximates the case in which an in-vehicle human is supervising — as is common in many vehicles with advanced driver-assist technologies today — except we allow the number of operators to ‘teleport’ from a vehicle that left the system to a vehicle that just arrived. In reality, this baseline would require more supervisors (and the comparative gains of scalable supervision would be greater), since trips extend beyond the interstate system. This baseline emphasizes the benefit of remotely-located operators who are not tied to any single AV. Performance values do not change with the baselines and thus are excluded to avoid redundancy. The CCAVs’ cooperative behavior often results in narrow differences for baseline supervisor values between the UCAV/NCAV setting and the CCAV setting (since cooperation can slightly alter trajectories, thus perturbing lane selections and trip durations). Where this occurred, these were averaged to ease comparison.
The best performance for each of the nine county-penetration rate pairs (as assessed by the maximum number of supervisors needed throughout the day) is shown in bold. CCAVs performed best in seven of nine scenarios, with reductions up to 43% in the number of supervisors needed relative to the UCAV scenario. Importantly, they did so without similar reductions in system performance. The system’s average speed only dropped by a maximum of 3% across the scenarios. NCAVs performed well in San Bernardino. The authors hypothesize this may be due to the low population density relative to the other counties; cooperative behavior may be less necessary when highways are sparsely populated. One can observe how the UCAV-NCAV gap (which is due to NCAVs’ connectivity that results in reduced uncertainty about their location) compares to the NCAV-CCAV gap (which is due to CCAVs’ cooperative, merge-assisting driving policy) across scenarios.
The combined fourfold benefits of the (1) remote, (2) reachability-based supervision scheme with vehicles that are (3) connected, and (4) cooperative are more evident in the CCAVs’ improvements relative to the baselines. Compared to when all AV merges are supervised, the CCAV scenarios achieve 34-73% reductions in the number of required supervisors. Relative to the baseline with 1:1 human:AV supervision, we find that CCAVs reduce the supervision requirements by more than 99% across all scenarios.
CCAVs also provide safety benefits when considering the minimum number of operators to achieve a long-term desired level of supervision reliability. To illustrate this, we find the greatest hourly empirical arrival rate and the associated value for the UCAV setting in each county-penetration rate pair, as well as the corresponding values for each CCAV setting. We then compute and compare the reliability value (where ) across both settings, letting , the maximum number of supervisors required over the course of the day in the CCAV setting only. For example, in Los Angeles with a 50% penetration rate, we compare the reliability achieved with the separate and values found for UCAVs and CCAVs, but in both cases consider that only 36 supervisors total are available. Reliability is often assessed in orders-of-magnitude terms, where the emphasis is on how many ‘nines’ of reliability a system can provide: a 99.93% value corresponds to three nines of reliability, whereas a 99.9997% value corresponds to five nines of reliability, and so forth. Table II shows the orders-of-magnitude gains in reliability averaged across counties, and then averaged again across penetration rates. The experiments show CCAVs achieve an average of 3.67 more nines than UCAVs in the scenarios studied due to the CCAVs’ connectivity and cooperative behavior.
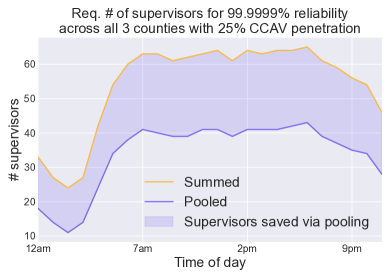
Finally, we assess the benefits of aggregating supervisors across the adjacent counties. Such pooling is a known tool in queue theory to improve operational performance in some settings [36]. In our case we compare the reliability levels achieved when a separate team of remote operators supervises each of the three counties (shown as ‘summed’ in Figure 5) to those achieved when supervision tasks are aggregated across all the counties and thus one team may supervise them (shown as ‘pooled’ in the figure). The plot demonstrates how such pooling can reduce supervision requirements.
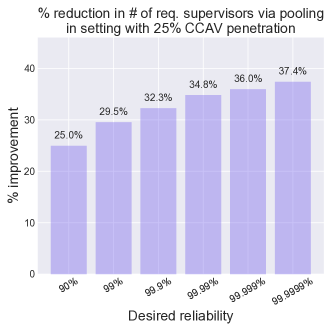
Interestingly, the benefits of pooling grow as reliability demands increase, as shown in Figure 6. Each bar is proportional to the shaded portion in Figure 5 for different desired reliability levels. Results in both figures are shown for the setting with a 25% penetration rate of CCAVs since that would occur prior to the higher rates, but the qualitative behavior is similar across all scenarios analyzed.
VIII Conclusion
This work outlined a framework DISCES for assessing safety and performance in data-informed, realistic traffic settings, and applied it to AV merges in mixed-autonomy traffic. Our findings suggest remote, event-based human supervision may be a viable avenue towards enhancing safety in near-term AV adoption, and that cooperative driving strategies can provide significant reductions in supervisory burdens — as well as related gains in system reliability — without proportional drops in traffic system performance. The work also indicates that scalability can improve by pooling supervision tasking across wider areas.
Future work could investigate more sophisticated CCAV driving strategies, consider data-driven alternatives to reachability-based supervision (such as predictive models), extend supervision to other challenging driving problems, or tackle the human factors questions involved. Additional research could also apply the DISCES framework to other safety-critical events in entirely new traffic settings.
References
- [1] P. Bansal and K. M. Kockelman, “Forecasting americans’ long-term adoption of connected and autonomous vehicle technologies,” Transportation Research Part A: Policy and Practice, vol. 95, pp. 49–63, 2017.
- [2] N. Kalra and S. M. Paddock, “Driving to safety: How many miles of driving would it take to demonstrate autonomous vehicle reliability?” Transportation Research Part A: Policy and Practice, vol. 94, pp. 182–193, 2016.
- [3] C. Wu, A. R. Kreidieh, K. Parvate, E. Vinitsky, and A. M. Bayen, “Flow: A modular learning framework for mixed autonomy traffic,” IEEE Transactions on Robotics, vol. 38, no. 2, pp. 1270–1286, 2021.
- [4] T. Mickle, C. Metz, and Y. Lu, “Gm’s cruise moved fast in the driverless race. it got ugly.” International New York Times, 2023.
- [5] O. Amador, M. Aramrattana, and A. Vinel, “A survey on remote operation of road vehicles,” IEEE Access, vol. 10, pp. 130 135–130 154, 2022.
- [6] C. Hickert, S. Li, and C. Wu, “Cooperation for scalable supervision of autonomy in mixed traffic,” IEEE Transactions on Robotics, 2023.
- [7] A. Arun, M. M. Haque, A. Bhaskar, S. Washington, and T. Sayed, “A systematic mapping review of surrogate safety assessment using traffic conflict techniques,” Accident Analysis & Prevention, vol. 153, p. 106016, 2021.
- [8] N. Duduta, C. Adriazola, D. Hidalgo, L. A. Lindau, and R. Jaffe, “Traffic safety in surface public transport systems: a synthesis of research,” Public Transport, vol. 7, no. 2, pp. 121–137, 2015.
- [9] R. Sakhapov and R. Nikolaeva, “Traffic safety system management,” Transportation research procedia, vol. 36, pp. 676–681, 2018.
- [10] D. J. Ederer, R. T. Panik, N. Botchwey, and K. Watkins, “The safe systems pyramid: a new framework for traffic safety,” Transportation research interdisciplinary perspectives, vol. 21, p. 100905, 2023.
- [11] M. Papageorgiou, “Some remarks on macroscopic traffic flow modelling,” Transportation Research Part A: Policy and Practice, vol. 32, no. 5, pp. 323–329, 1998.
- [12] Z. H. Khan, T. A. Gulliver, and W. Imran, “A macroscopic traffic model based on the safe velocity at transitions,” Civil Engineering Journal, vol. 7, no. 06, 2021.
- [13] P. A. Lopez, M. Behrisch, L. Bieker-Walz, J. Erdmann, Y.-P. Flötteröd, R. Hilbrich, L. Lücken, J. Rummel, P. Wagner, and E. Wießner, “Microscopic traffic simulation using sumo,” in 2018 21st international conference on intelligent transportation systems (ITSC). IEEE, 2018, pp. 2575–2582.
- [14] G. Guido, V. Astarita, V. Giofré, and A. Vitale, “Safety performance measures: a comparison between microsimulation and observational data,” Procedia-Social and Behavioral Sciences, vol. 20, pp. 217–225, 2011.
- [15] A. Kouvelas, K. Aboudolas, E. B. Kosmatopoulos, and M. Papageorgiou, “Adaptive performance optimization for large-scale traffic control systems,” IEEE Transactions on Intelligent Transportation Systems, vol. 12, no. 4, pp. 1434–1445, 2011.
- [16] M. Zlatkovic, S. Zlatkovic, T. Sullivan, J. Bjornstad, and S. K. F. Shahandashti, “Assessment of effects of street connectivity on traffic performance and sustainability within communities and neighborhoods through traffic simulation,” Sustainable Cities and Society, vol. 46, p. 101409, 2019.
- [17] W. Du, A. Dash, J. Li, H. Wei, and G. Wang, “Safety in traffic management systems: A comprehensive survey,” Designs, vol. 7, no. 4, p. 100, 2023.
- [18] K. Kuru, “Conceptualisation of human-on-the-loop haptic teleoperation with fully autonomous self-driving vehicles in the urban environment,” IEEE Open Journal of Intelligent Transportation Systems, vol. 2, pp. 448–469, 2021.
- [19] F. Tener and J. Lanir, “Driving from a distance: challenges and guidelines for autonomous vehicle teleoperation interfaces,” in Proceedings of the 2022 CHI conference on human factors in computing systems, 2022, pp. 1–13.
- [20] ——, “Toward the design of a tele-assistance user interface for autonomous vehicles.” in AutomationXP@ CHI, 2023.
- [21] S. Benjaafar, Z. Wang, and X. Yang, “Human in the loop automation: Ride-hailing with remote (tele-) drivers,” Available at SSRN 4130757, 2022.
- [22] H. Jula, E. B. Kosmatopoulos, and P. A. Ioannou, “Collision avoidance analysis for lane changing and merging,” IEEE Transactions on vehicular technology, vol. 49, no. 6, pp. 2295–2308, 2000.
- [23] M. Zhou, X. Qu, and S. Jin, “On the impact of cooperative autonomous vehicles in improving freeway merging: a modified intelligent driver model-based approach,” IEEE Transactions on Intelligent Transportation Systems, vol. 18, no. 6, pp. 1422–1428, 2016.
- [24] M. A. Ahammed, Y. Hassan, and T. A. Sayed, “Modeling driver behavior and safety on freeway merging areas,” Journal of Transportation Engineering, vol. 134, no. 9, pp. 370–377, 2008.
- [25] M. Althoff, “Reachability analysis and its application to the safety assessment of autonomous cars,” Ph.D. dissertation, Technische Universität München, 2010.
- [26] A. Qu and C. Wu, “Revisiting the correlation between simulated and field-observed conflicts using large-scale traffic reconstruction,” Available at SSRN 4687440.
- [27] N. Tsanakas, J. Ekström, D. Gundlegård, J. Olstam, and C. Rydergren, “Data-driven network loading,” Transportmetrica B: Transport Dynamics, vol. 9, no. 1, pp. 237–265, 2021.
- [28] M. Treiber and A. Kesting, “Traffic flow dynamics,” Traffic Flow Dynamics: Data, Models and Simulation, Springer-Verlag Berlin Heidelberg, pp. 983–1000, 2013.
- [29] M. Behrisch and J. Erdmann, “Route estimation based on network flow maximization,” EPiC Series in Engineering, vol. 2, 2018.
- [30] OpenStreetMap contributors, “Planet dump retrieved from https://planet.osm.org ,” https://www.openstreetmap.org, 2017.
- [31] Caltrans, “Pems data source.” [Online]. Available: https://dot.ca.gov/programs/traffic-operations/mpr/pems-source
- [32] R. Li, P. N. Brown, and R. Horowitz, “Employing altruistic vehicles at on-ramps to improve the social traffic conditions,” in 2021 American Control Conference (ACC). IEEE, 2021, pp. 4547–4552.
- [33] B. Zhang, J. De Winter, S. Varotto, R. Happee, and M. Martens, “Determinants of take-over time from automated driving: A meta-analysis of 129 studies,” Transportation research part F: traffic psychology and behaviour, vol. 64, pp. 285–307, 2019.
- [34] A. Eriksson and N. A. Stanton, “Takeover time in highly automated vehicles: noncritical transitions to and from manual control,” Human factors, vol. 59, no. 4, pp. 689–705, 2017.
- [35] L. Kolodny, “Cruise confirms robotaxis rely on human assistance every four to five miles,” CNBC.
- [36] K. Cattani and G. M. Schmidt, “The pooling principle,” INFORMS Transactions on Education, vol. 5, no. 2, pp. 17–24, 2005.