DELTA: Dual Consistency Delving with Topological Uncertainty for Active Graph Domain Adaptation
Abstract.
Graph domain adaptation has recently enabled knowledge transfer across different graphs. However, without the semantic information on target graphs, the performance on target graphs is still far from satisfactory. To address the issue, we study the problem of active graph domain adaptation, which selects a small quantitative of informative nodes on the target graph for extra annotation. This problem is highly challenging due to the complicated topological relationships and the distribution discrepancy across graphs. In this paper, we propose a novel approach named Dual Consistency Delving with Topological Uncertainty (DELTA) for active graph domain adaptation. Our DELTA consists of an edge-oriented graph subnetwork and a path-oriented graph subnetwork, which can explore topological semantics from complementary perspectives. In particular, our edge-oriented graph subnetwork utilizes the message passing mechanism to learn neighborhood information, while our path-oriented graph subnetwork explores high-order relationships from substructures. To jointly learn from two subnetworks, we roughly select informative candidate nodes with the consideration of consistency across two subnetworks. Then, we aggregate local semantics from its K-hop subgraph based on node degrees for topological uncertainty estimation. To overcome potential distribution shifts, we compare target nodes and their corresponding source nodes for discrepancy scores as an additional component for fine selection. Extensive experiments on benchmark datasets demonstrate that DELTA outperforms various state-of-the-art approaches.
1. Introduction
Graph data is widely applied in various real-world scenarios, for example in social networks (Myers et al., 2014; Guo and Wang, 2020; Zhang et al., 2022a), academic networks (Tang et al., 2008; West et al., 2016), transportation networks (Li et al., 2022; Jin et al., 2020), biological networks (Liu et al., 2024; Shen et al., 2021), compound networks (Sun et al., 2022; Cai et al., 2022), and drug discovery (Li et al., 2024; Wu et al., 2022a). In the collection of graph data, variations in the standards, timing, and costs often cause two graphs in the same domain to exhibit different node attributes and edge structures (Zhu et al., 2021; Pilancı and Vural, 2020a).
Towards this end, unsupervised graph domain adaptation has received ever-increasing attention in the field of data mining. Given a partially labeled source graph and a completely unlabeled target graph, graph domain adaptation narrows the distributional differences between the source and target graphs, enabling the model trained on the source domain to better adapt to graph data in the target domain, thereby improving task performance in the target domain (Hedegaard et al., 2021; Li et al., 2022; Cai et al., 2024). Current approaches to graph domain adaptation primarily usually involve adversarial learning (Qiao et al., 2023a) for domain alignment, minimizing the distance between node representations (Wu et al., 2024), or filtering out irrelevant information between the source and target graphs through the information bottleneck strategies (Qiao et al., 2024).
However, the performance on the target graph is still far from satisfactory for unsupervised domain adaptation methods due to the absence of labels in the target graph (Cai et al., 2024). Due to constraints such as labeling costs, it is not feasible to extensively label the nodes on the target graph. Although pseudo-labeling strategies have been developed to address label scarcity issues in target graphs, they still fail to provide accurate supervision signals for the target graph, resulting in potential error accumulation (Qiao et al., 2024; Guo et al., 2022a). To reduce the annotation cost, we study the problem of active graph domain adaptation (see Figure 1), which aims to acquire the most valuable true labels for the target graph under a limited labeling budget, thereby maximizing the performance improvement on the target graph in a cost-effective manner.
Despite significant advancements in graph domain adaptation research, several challenges still need to be considered when applying active learning to graph domain adaptation (Li et al., 2022; Wang et al., 2023a; Shen et al., 2023a). Firstly, though extensive active learning methods (Hsu and Lin, 2015) have been proposed for images and texts, they focus on independent and identically distributed (i.i.d.) data. In contrast, graph data exhibit complex and high-order topological relationships, such as the number and density of nodes and edges, the heterogeneity of node degree distribution, and topological structure. These complicated factors greatly enhance the difficulties of identifying informative nodes on the target graph. Secondly, the source and target graphs have huge distribution discrepancies, which could deteriorate domain adaptation and result in biases in uncertainty estimation as well (Li et al., 2022; Qiao et al., 2024, 2023a).
In this paper, we address the aforementioned challenges by introducing Dual Consistency Delving with Topological Uncertainty (DELTA) for active graph domain adaptation. The core of our DELTA is to explore graph topological data from complementary views for information-rich candidate nodes in the target graph. In particular, our DELTA consists of an edge-oriented graph subnetwork and a path-oriented graph subnetwork. Our edge-oriented subnetwork utilizes the message passing mechanism to learn topological semantics implicitly while our path-oriented subnetwork aggregates information from different paths explicitly. Then, we combine two subnetworks by measuring the inconsistency across these subnetworks of nodes on the target graph for coarse selection. Furthermore, we measure the uncertainty by combining node degrees with K-hop subgraphs to learn from local topological semantics for each node. To mitigate the distribution shifts, we also calculate the discrepancy scores by comparing target nodes and their corresponding source nodes. In the end, we combine both uncertainty scores and discrepancy scores for fine selections.
We validate the effectiveness of DELTA through extensive experiments on benchmark datasets, comparing it with state-of-the-art approaches. We also demonstrate our advantages qualitatively through t-SNE visualization. The main contributions of this study are as follows:
-
•
We study the problem of active graph domain adaptation and benchmark the performance of state-of-the-art graph active learning methods in transfer learning scenarios.
-
•
We propose DELTA, a novel and cost-effective active learning sampling strategy that explores topological semantics from complementary edge and path perspectives, incorporating subgraph-level uncertainty and degree-weighted attribute discrepancy between the source and target graphs.
-
•
We conduct extensive experiments on popular graph transfer learning benchmarks, demonstrating that the proposed DELTA performs better than state-of-the-art active learning approaches.
2. Related Work
Active Learning on Graphs. Active learning has been extensively studied in the field of computer vision (Hsu and Lin, 2015), but few studies have applied active learning to graph-oriented deep learning (Cai et al., 2017; Gao et al., 2018; Chen et al., 2019; Hu et al., 2020; Cui et al., 2022; Zhang et al., 2022b; Yu et al., 2024). Earlier research generally does not consider the topological structure features of graphs. Still, it effectively combines node uncertainty and representativeness (Cai et al., 2017; Hu et al., 2020), where uncertainty is measured by information entropy, and representativeness is measured by information density and graph centrality (Gao et al., 2018; Chen et al., 2019). Many of these methods employ multi-armed bandit mechanisms to adjust the weights of active learning strategies (Cai et al., 2017; Gao et al., 2018; Chen et al., 2019; Hu et al., 2020). More recent studies combine active learning strategies with reinforcement learning, formalizing active learning as a Markov decision process (Hu et al., 2020; Cui et al., 2022; Zhang et al., 2022b; Yu et al., 2024). They use measures such as PageRank centrality and predictive entropy to evaluate the informativeness and uncertainty of nodes (Zhang et al., 2022b) and combine metrics like KL divergence to assess the information value of nodes (Cui et al., 2022). However, although there are studies applying active learning to GNNs, most are based on a single graph. Few studies focus on applying this technique to graph transfer learning, which is more challenging compared to single-graph classification tasks (Shi et al., 2024). This study aims to fill this gap by conducting active learning across graphs and innovatively selecting nodes on the target graph that exhibit significant differences from the source graph. By leveraging active learning for labeling, we reduce information interference and distributional discrepancies in cross-graph learning, aligning with the specific characteristics of graph domain adaptation tasks.
Graph Domain Adaptation. Existing methods for graph domain adaptation can be categorized into three main streams (Shi et al., 2024): First, methods that enhance node embeddings on the source graph to improve performance on the target graph. This is achieved through adversarial loss functions (Yang et al., 2022; Yuan et al., 2023; Wu et al., 2022b; Yin et al., 2023; Qiao et al., 2023b; Zhang et al., 2021) or by modifying the message-passing mechanisms of GNNs (Wu et al., 2020a; Dai et al., 2022; Shen et al., 2023b). Second, methods that focus on better adapting the knowledge learned from the source graph domain to the target graph domain. This is achieved through data augmentation (Jiang et al., 2020; Qiao et al., 2024), spectral methods (Pilancı and Vural, 2020b; You et al., 2023), spatial methods (Guo et al., 2022b; Wu et al., 2023), or pseudo-label alignment (Yin et al., 2022; Song et al., 2020). Third, methods that directly utilize information from the target graph to build models (Wang et al., 2023a, b; Shen et al., 2023a), using the probability distribution of predicted labels on the target graph (Wu and Rostami, 2023; Wang et al., 2023a) and semantic information (Wang et al., 2023b; Wu et al., 2020b). However, there is still a lack of methods that explicitly utilize graph topological information, while existing approaches only explore semantic information from a single view, whether edge, path, or node. Current methods also rarely explicitly utilize the attribute distribution differences between the nodes in the source and target graphs, with most existing methods addressing this through distribution alignment loss functions (Sun et al., 2015; Cai et al., 2024). Furthermore, few methods directly address label sparsity in both the source and target graphs. Most existing studies assume a high proportion of labeled nodes in the source graph (Pilancı and Vural, 2020b; Zhang et al., 2021; Guo et al., 2022b; Wu et al., 2023; Sun et al., 2015; Cai et al., 2024). In comparison, our DELTA enriches the labels of the target graph through active learning and innovatively utilizes an edge-oriented graph subnetwork and a path-oriented graph subnetwork to explore topological semantics from complementary perspectives.
Active Learning for Domain Adaptation. Existing research has not fully explored the integration of active learning with domain adaptation (Zhan et al., 2021, 2022). ALDA uses the best classifier learned from the source domain as an initial hypothesis in the target domain and adjusts weights to query labels (Rai et al., 2010). Furthermore, the JO-TAL utilizes Maximum Mean Discrepancy (MMD) to measure marginal probability distribution differences between source and target domain samples, selecting instances from the unlabeled target domain dataset to minimize this discrepancy (Chattopadhyay et al., 2013). Additionally, AADA combines Domain-Adversarial Neural Networks (DANN) with a sample selection strategy based on Importance Weighted Empirical Risk Minimization (IWERM) to achieve domain-invariant feature learning (Su et al., 2020). CLUE builds upon AADA by further integrating predictive entropy to measure information content and using weighted k-means clustering to group similar target instances (Prabhu et al., 2021). Recent studies include EADA and ADCD. EADA selects and annotates the most informative unlabeled target samples by utilizing free energy, achieving a combination of inter-domain feature and instance uncertainty (Xie et al., 2022). ADCD improves active learning in domain adaptation by combining protocol scoring, domain discriminator scoring, and cosine difference scoring (Menke et al., 2024). In summary, there are currently no specialized studies based on active learning for graph domain adaptation. Given its significant practical implications, research in this direction is necessary (Shi et al., 2024; Redko et al., 2020). The proposed DELTA framework aims to fill this gap by comprehensively considering the complexity of graph topological structures and the distributional discrepancies in cross-graph learning.
3. Preliminaries
3.1. Problem Definition
Consider two graphs, one as the source graph and one as the target graph . Here, and represent the sets of nodes in the source and target graphs, respectively, and represent the sets of edges in the source and target graphs, respectively, and donate the feature matrix of nodes from the source and target graphs, and and represent the sets of node class labels in the source and target graphs, respectively. The source graph and target graph have a serious domain gap but share the same label space, with only a small portion of being labeled and being completely unlabeled (Wilson and Cook, 2020). The objective of active graph domain adaptation is to find the most valuable nodes for labeling in the target graph within a fixed budget of , assign them annotations , and perform graph domain adaptation using a graph neural network model shared between the source and target graphs (Hsu and Lin, 2015; Xie et al., 2022; Rai et al., 2010).
3.2. Graph Domain Adaptation
We briefly present the typical framework of graph domain adaptation, a semi-supervised learning framework that has been widely applied (Dai et al., 2022; Yin et al., 2023; Qiao et al., 2024). Graph domain adaptation aims to ensure that node embeddings output by the feature extractor have similar distributions across different domains and ultimately label the unlabeled target nodes. Therefore, a classifier on node embeddings would generate predictions from the shared conditional distributions across the two domains. In formulation, given the source and target embedding matrix and , respectively, we have:
| (1) |
where denotes the cross-entropy objective on the labeled source graph , and denotes the domain adaptation loss, such as the adversarial learning objective (Qiao et al., 2024):
| (2) |
denotes a domain discriminator that predicts whether the input embedding is from the source graph or the target graph. and denotes the node embeddings of node and , respectively. and denote the network parameters of the feature extractor and the classifier, respectively.
4. Methodology
4.1. Overview
In this work, we propose a new approach named DELTA for active graph domain adaption. DELTA consists of three main components as follows. (1) Dual Graph Subnetwork with Consistency Delving, which consists of an edge-oriented graph subnetwork and a path-oriented graph subnetwork trained on both the source and target graphs. Then we explore complementary neighborhood information and high-order relationships, resulting in informative candidate nodes denoted as . (2) Topological Uncertainty Measurement, which explores both node degrees and K-hop subgraphs to aggregate local entropy, thereby capturing the topological uncertainty of the target graph nodes. (3) Domain Discrepancy Measurement, which calculates the distance between target nodes and their corresponding source labeled nodes, thus overcoming potential distribution shifts. By aggregating topological uncertainty and domain discrepancy scores on , we one-shot select the top target graph nodes with the highest scores for annotation. The overview of the proposed method is illustrated in Figure 2.
4.2. Dual Graph Subnetwork for Consistency Delving
In our DELTA, we adopt a dual graph subnetwork framework to explore graph semantics from complementary edge-centric and path-centric views. By leveraging complementary topological information, DELTA is able to better identify candidate nodes with more complicated topological information on the target graph, which can then be used for active learning.
4.2.1. Edge-oriented Graph Subnetwork
Message passing neural networks have been adopted in a large number of graph machine learning tasks (Dai et al., 2022) based on neighborhood aggregation. Therefore, we first introduce an edge-oriented graph subnetwork, which aggregates information from the neighboring nodes of each node. The subnetwork can gradually expand the receptive field of the nodes at each layer of the network and thus capture more topological information (Kipf and Welling, 2016) in an implicit manner. The update rules of the subnetwork at layer can be expressed as follows:
| (3) |
| (4) |
where and represents the node embedding and neighborhood embeddings at the -th layer, respectively. The node representations at each layer are updated through a two-step process. First, the AGGREGATE function collects information from neighboring nodes. This step is typically achieved through matrix operations, such as the multiplication of the adjacency matrix with the node feature matrix, which generates new feature representations. Then, the UPDATE function applies a nonlinear transformation to the aggregated information, producing the node features for the current layer. After stacking layer, the final node embedding for each node is denoted as .
4.2.2. Path-oriented Graph Subnetwork
However, graph data contains high-order structure semantics, and our edge-oriented graph subnetwork is difficult to capture them (Ma et al., 2020; Ye et al., 2024). To solve this, we introduce a path-oriented graph subnetwork, which can explicitly capture the topological semantics of a graph from the perspective of path connections (Ma et al., 2020). In particular, we aggregate information by computing the weighted sum of all possible paths between nodes. These paths consider not only the direct connections between nodes but also the indirect connections and the overall structure of the paths. The path-oriented subnetwork can capture deeper relationships between nodes and the global topological features of the graph. The updated rule of the path-oriented subnetwork at layer can be expressed as follows:
| (5) |
where is the inverse square root of the normalization matrix. represents the path aggregation and weighted summation, where denotes the path length ranging from to (with set to 3). is the -th power of the adjacency matrix A, indicating the adjacency relationships of nodes at a distance of hops in the graph. represents the learnable path weight, determined by the path energy and the temperature coefficient , where the temperature controls the smoothness of the path weights. is the input feature matrix at layer , is the weight matrix at layer , and is the ReLU activation function. After stacking layers, the final node embedding for each node is denoted as .
4.2.3. Consistency Delving for Informative Candidate Nodes
The dual graph subnetwork framework, which is oriented respectively on edges and paths, allows for the complementary integration of information for the target graph nodes. Therefore, appropriate aggregation of this complementary information is crucial, as we need to select target graph nodes that are rich in complicated edge and path topological information. Typically, target nodes with high inconsistency across subnetworks should have high uncertainty and carry complicated semantics. In our DELTA, instead of simply using nodes with inconsistent predicted classes, we calculate the Euclidean distance between the logit scores and with two classifiers on the target graph and identify the set of coarse candidate nodes whose Euclidean distance exceeds a customizable consistency threshold as the coarse candidate set , as follows:
| (6) |
| (7) |
Compared to using two identical subnetworks with different parameters to select nodes with inconsistent predictions, the dual graph subnetwork architecture allows us to obtain information about target graph nodes from two different views. This complementary approach enables the capture of more comprehensive node information and identifies target graph nodes with richer information and inconsistent predictions.
4.3. Topological Uncertainty Measurement for Node Selection
In active learning, uncertainty refers to the degree to which the model’s predictions are less certain for different samples. By annotating nodes on the target graph where uncertainty is stronger, model performance can improve (Ma et al., 2024; Sharma and Bilgic, 2017; Fuchsgruber et al., 2024). Previous work mainly uses prediction entropy to measure uncertainty (Cai et al., 2017; Gao et al., 2018; Ren et al., 2022) for each node independently while they neglect that the information of each node is highly related to its neighborhood. To tackle this, we propose topological uncertainty scores based on local subgraphs and degrees to capture topological semantics.
In particular, for each central node from , we first extract its K-hop subgraph and the logits of each node within it. Instead of directly averaging the logits of the K-hop subgraph, we compute the degree of each node in the K-hop subgraph and take the reciprocal as the weight . The weighted K-hop logits for each node can be calculated as follows:
| (8) |
| (9) |
where is set to empirically (Azabou et al., 2023). The reason behind using the reciprocal of a node’s degree as the weight is that if a node has stronger connectivity (higher degree), its topological information can be inferred from the neighborhood with weaker importance (Fuchsgruber et al., 2024).
Then, we compute the topological uncertainty scores for each node in as follows:
| (10) |
| (11) |
where represents the probability that the weighted K-hop logits centered at node belong to category .
Finally, each node from can obtain the topological uncertainty score from the dual graph subnetwork:
| (12) |
By quantifying the topological uncertainty at the subgraph level, more comprehensive subgraph topological information can be obtained compared to node-based uncertainty. We also integrate the uncertainty scores from both the edge and path levels of the dual graph subnetwork, thereby aiding in the identification of more valuable nodes from different views.
4.4. Domain Discrepancy Measurement for Node Selection
Another obstacle in graph domain adaptation is the distribution differences between the source graph and the target graph (Yin et al., 2023; Yan et al., 2017). Even though several domain alignment approaches have been proposed to reduce the discrepancy, target nodes with high discrepancy with the source nodes would be more difficult for graph domain adaptation approaches (Qiao et al., 2024) to align and thus classify accurately. To this end, we propose domain discrepancy scores which measure the attribute distance between the labeled nodes in the source graph and the candidate node set in the target graph.
Specifically, given the attribute vector of a target graph node , and the attribute vectors of nodes in the set of labeled source graph nodes , we compute the weighted average Euclidean distance between each and all labeled nodes in the set . The weights are determined by the degree of nodes in . The domain discrepancy score for each target graph node is defined as follows:
| (13) |
The reason behind using the degree of nodes in as weights is that nodes with higher connectivity in the source graph are more influential in graph domain adaptation. In detail, they provide stronger supervision signals, thereby playing a more significant role in domain discrepancy scores. This design not only accounts for the differences in node attributes between the source and target graphs but also considers the topology of the source graph. Consequently, through the active learning process, our model focuses on target graph nodes less related to the source graph, ultimately enhancing the performance of graph domain adaptation.
4.5. Summarization
We combine the topological uncertainty scores and domain discrepancy scores of the target graph node to compute the composite score:
| (14) |
Given the labeling budget , we select the top nodes on with the highest composite scores for active learning in a one-shot manner. The newly partially labeled target graph, along with the source graph, is then re-trained using the backbone network of graph domain adaptation, and predictions for the target graph are obtained. The whole algorithm is summarized in Algorithm 1, and the computational complexity is provided in Appendix D.
In summary, the proposed DELTA framework provides a novel approach to active learning across graphs. It integrates complementary information from edge-oriented and path-oriented graph subnetworks and delves the inconsistency across two subnetworks for coarse candidate nodes. Then, it combines topological uncertainty scores with domain discrepancy scores for fine selection. This combination quantifies the uncertainty at the subgraph level within the target graph and the cross-domain distribution discrepancy between the target and source graphs, which significantly enhances the performance on the target graph with a minimal annotation budget.
| Methods | AC | AD | DC | DA | CA | CD | Average | ||||||||||||||
|---|---|---|---|---|---|---|---|---|---|---|---|---|---|---|---|---|---|---|---|---|---|
| Macro | Micro | Macro | Micro | Macro | Micro | Macro | Micro | Macro | Micro | Macro | Micro | Macro | Micro | ||||||||
| Random | 75.90.9 | 77.50.7 | 69.71.4 | 72.61.3 | 72.30.6 | 74.10.4 | 67.51.0 | 67.01.0 | 70.30.8 | 69.50.8 | 70.01.9 | 72.41.1 | 70.9 | 72.2 | |||||||
| GraphPart (Ma et al., 2023) | 76.00.7 | 77.60.6 | 71.70.5 | 74.00.5 | 71.50.9 | 73.50.4 | 68.00.6 | 67.30.4 | 71.00.7 | 70.00.5 | 72.10.8 | 74.00.7 | 71.7 | 72.7 | |||||||
| AGE (Cai et al., 2017) | 76.21.4 | 77.91.3 | 70.51.7 | 72.71.3 | 72.32.5 | 74.12.1 | 68.71.2 | 68.01.2 | 70.41.0 | 69.30.8 | 72.81.1 | 74.00.9 | 71.8 | 72.7 | |||||||
| ANRMAB (Gao et al., 2018) | 74.91.0 | 76.80.8 | 69.61.0 | 71.90.7 | 70.71.3 | 73.00.8 | 66.60.7 | 66.00.6 | 70.00.6 | 69.00.6 | 69.51.5 | 71.81.1 | 70.2 | 71.4 | |||||||
| Dissimilarity (Ren et al., 2022) | 76.31.4 | 77.91.3 | 70.02.3 | 72.61.9 | 73.31.9 | 75.11.6 | 68.10.7 | 67.50.6 | 69.70.8 | 68.80.5 | 71.02.3 | 72.81.5 | 71.4 | 72.4 | |||||||
| Degree (Cai et al., 2017) | 74.50.9 | 76.30.8 | 68.71.2 | 71.31.1 | 71.41.0 | 73.50.7 | 66.31.0 | 65.90.8 | 68.40.4 | 67.70.5 | 70.70.6 | 72.20.3 | 70.0 | 71.1 | |||||||
| Density (Ren et al., 2022) | 74.70.8 | 76.40.8 | 68.80.8 | 71.70.8 | 70.61.0 | 72.90.6 | 66.41.2 | 66.01.1 | 68.91.2 | 68.01.0 | 69.41.4 | 71.70.9 | 69.8 | 71.1 | |||||||
| Uncertainty (Settles and Craven, 2008) | 76.01.2 | 77.71.2 | 71.01.5 | 73.21.2 | 71.81.7 | 73.91.5 | 68.51.7 | 67.91.4 | 71.20.1 | 70.30.2 | 70.81.3 | 72.50.6 | 71.6 | 72.6 | |||||||
| Proposed | 77.31.3 | 78.91.1 | 70.42.6 | 72.82.1 | 74.51.1 | 76.20.9 | 70.90.9 | 70.00.7 | 72.50.8 | 71.50.7 | 73.52.0 | 75.01.4 | 73.2 | 74.1 | |||||||
5. Experiment
5.1. Experimental Settings
5.1.1. Datasets and Metrics
ArnetMiner is a system designed for extracting and mining academic social networks (Tang et al., 2008). We select three citation networks from ArnetMiner: ACMv9 (A), Citationv1 (C), and DBLPv7 (D). Each node stands for a paper, and each edge denotes a citation relationship between the two papers. The node attribute is generated from the title followed by a bag-of-words model. The selected citation networks, ACMv9, Citationv1, and DBLPv7, each consist of five node categories. More details of the selected datasets can be found in Appendix A.
5.1.2. Baseline Algorithms
To validate the effectiveness of our DELTA, we compare it with a range of graph-based active learning baselines including GraphPart (Ma et al., 2023), AGE (Cai et al., 2017), ANRMAB (Gao et al., 2018), Dissimilarity (Ren et al., 2022), Degree (Cai et al., 2017), Density (Ren et al., 2022), Uncertainty (Settles and Craven, 2008) and Random. Random refers to labeling randomly selected samples with the budget. More details can be found in Appendix B.
5.1.3. Implementation Details.
We use the GIFI model as the backbone model for graph domain adaption, which is currently the latest and most advanced graph domain adaptation model (Qiao et al., 2024). The hidden channels are set to 512, out channels are set to 256, training epochs are 200, dropout ratio is 0.1, and the Adam optimizer (Kingma and Ba, 2014) is utilized with a learning rate of 0.001, with a weight decay of 1e-4. We adopt GCN (Kipf and Welling, 2016) and PAN (Ma et al., 2020) to implement our two subnetworks, respectively. The experimental configuration features a Linux server powered by NVIDIA A100 GPUs (80GB) and an Intel Xeon Gold 6354 CPU. The software environment includes PyTorch 1.11.0 (Paszke et al., 2019), PyTorch-geometric 2.5.3 (Fey and Lenssen, 2019), and Python 3.9.16.
5.2. Main Experimental Results
To quantitatively demonstrate the performance of our proposed DELTA, we report the results of DELTA and other baseline algorithms across six data combinations in Table 1, where 125 target graph nodes are labeled for active learning. From the results, we can observe that: (1) The proposed DELTA consistently outperforms the random selection method for active learning node selection, with an average lead of over 2% across the six data combinations. (2) Except for AD, DELTA consistently outperforms other baseline algorithms, with the performance increasement range from 1.2% to 5% across the six data combinations. In DC, DA, and CA, DELTA shows the largest margin, with an average lead of over 2%. (3) Baseline algorithms based on uncertainty, or combining uncertainty with other structural metrics, such as Uncertainty, GraphPart, AGE, and Dissimilarity, significantly outperform baselines using only structural metrics such as Degree and Density. (4) On average, Micro-F1 is greater than Macro-F1, indicating better classification performance for the larger classes, which reflects the issue of data imbalance. These results demonstrate the superior performance of the proposed DELTA, highlighting its advantage in reducing the annotation cost on the target graph. Notably, DELTA operates in a one-shot manner for point selection on the target graph in active learning, while AGE, ANRMAB, and Dissimilarity involve iterative point selection, which indicates our DELTA achieves superior performance with lower computational costs.
| Methods | AC | AD | DC | DA | CA | CD | Average | ||||||||||||||
|---|---|---|---|---|---|---|---|---|---|---|---|---|---|---|---|---|---|---|---|---|---|
| Macro | Micro | Macro | Micro | Macro | Micro | Macro | Micro | Macro | Micro | Macro | Micro | Macro | Micro | ||||||||
| V1 | 75.01.1 | 76.91.0 | 69.11.4 | 71.80.9 | 72.31.1 | 74.01.2 | 67.50.9 | 67.00.8 | 70.50.4 | 69.70.5 | 69.51.4 | 71.80.8 | 70.7 | 71.8 | |||||||
| V2 | 68.38.8 | 72.28.9 | 66.80.9 | 72.51.3 | 70.21.1 | 74.81.6 | 63.65.9 | 65.13.2 | 68.31.6 | 67.61.5 | 63.05.2 | 68.63.0 | 66.7 | 70.1 | |||||||
| V3 | 75.20.4 | 77.10.3 | 69.20.6 | 71.80.3 | 71.71.1 | 73.50.6 | 66.40.9 | 66.00.9 | 69.50.4 | 68.80.5 | 69.71.4 | 71.71.1 | 70.3 | 71.5 | |||||||
| V4 | 75.51.2 | 77.31.1 | 69.30.8 | 72.30.3 | 70.71.5 | 73.21.4 | 66.61.3 | 66.31.2 | 70.11.3 | 69.31.1 | 70.21.6 | 72.31.0 | 70.4 | 71.8 | |||||||
| Proposed | 75.71.2 | 77.50.9 | 70.71.5 | 73.11.0 | 72.11.8 | 74.01.3 | 67.91.1 | 67.20.8 | 70.60.6 | 69.70.5 | 71.21.5 | 73.11.2 | 71.4 | 72.4 | |||||||
To investigate the performance of DELTA and baseline algorithms under varying numbers of nodes selected for active learning, we visualized the results in Figure 3, where the number of selected nodes ranges from 25 to 150. From the results, it can be observed that: (1) Regardless of the number of nodes selected for active learning, DELTA consistently outperforms all baseline algorithms. (2) As the node number increases, DELTA’s performance shows a continuous upward trend, and the performance gap between DELTA and other baseline algorithms tends to widen, which further proves the effectiveness of DELTA. For DELTA’s performance across the six data combinations with active learning node counts of 100, 125, 150, 175, and 200, please refer to Table A2 in the Appendix, where the conclusions remain consistent.
5.3. Ablation Study
In this section, we introduce several variants to evaluate the effectiveness of different components in DELTA: (1) V1 adopts two edge-oriented subnetworks with different parameters for inconsistency delving; (2) V2 adopts two path-oriented subnetworks with different parameters for inconsistency delving; (3) V3 removes domain discrepancy scores; (4) V4 removes topological uncertainty scores. Table 2 presents the results of the ablation study, from which we can observe the following: (1) In most cases, the performance of DELTA consistently surpasses that of any of its ablated variants, with DELTA outperforming its variants by approximately 1% on average. (2) V1 and V2 indicate the use of two edge-oriented subnetworks or the use of two path-oriented subnetworks in our dual architecture. These variants do not realize complementary graph information acquisition, leading to less informative nodes in the candidate node set compared to DELTA, thereby resulting in inferior performance in most cases. (3) V3 refers to the use of only topological uncertainty scores without domain discrepancy scores. This variant underperforms DELTA across all datasets due to the failure to account for attribute differences between the source and target graphs in cross-graph learning, thus neglecting nodes with higher confusion during active learning. (4) V4 represents the use of only domain discrepancy scores without topological uncertainty scores. This variant also shows inferior results compared to DELTA across all datasets because it fails to consider the uncertainty of the target graph nodes, which severely degrades the performance. Figure 4 further illustrates the ablation study results when varying the number of nodes used for active learning, and the conclusions are consistent with those in Table 2.
5.4. Parameter Sensitivity
In this part, we study the performance with respect to different consistency threshold and the value of . controls the consistency between the dual graph subnetworks, and is used to calculate topological uncertainty scores in -hop subgraphs. We first conduct experiments by varying within the parameter space {0.1, 0.3, 0.5, 0.7} while keeping other parameters fixed. Then, we conduct experiments by varying within the parameter space {1, 2, 3, 4, 5} while keeping other parameters fixed, as shown in Figure 6. We observe the following: (1) exhibits an upward trend from 0.1 to 0.5, reaching its peak at 0.5, and then decreases to its lowest value at 0.7. The possible reason for this is that when is too small, the consistency constraint on the dual graph subnetworks is too weak, leading to the inclusion of less informative nodes in . On the other hand, when is too large, the consistency constraint becomes too strong, reducing the diversity of . (2) When is above 2, there is a slight downward trend in performance as increases, which might be due to the increase in noise within the topological uncertainty scores. This results in the subgraph size becoming too large, thereby diminishing the importance of the central node’s logits, leading to decreased performance. Thus, we recommend setting to 0.3 and to 2. Figures A1 and A2 in the Appendix provide further information with similar conclusions.
5.5. Further Analysis
In this subsection, we primarily investigate the generalizability of DELTA from two perspectives. First, we analyze the performance of DELTA when different backbones are employed in the edge-oriented subnetworks. Second, we compare the runtime of DELTA with baseline algorithms to assess its efficiency. Third, we utilize t-SNE to visualize the differences in the diversity of selected node distributions between the proposed DELTA and two classic baseline methods, Uncertainty (Settles and Craven, 2008) and Degree (Cai et al., 2017).
5.5.1. Performance on Different Edge-oriented Subnetworks.
It is necessary to explore the generalizability of the edge-oriented graph subnetworks under different backbones. We replace the edge-oriented graph subnetworks with Graph Attention Networks (GAT) (Veličković et al., 2017), Simplifying Graph Convolutional Networks (SGConv) (Wu et al., 2019), and Topology adaptive graph convolutional networksrespectively (TAGConv) (Du et al., 2017), as shown in Figure 6. We observe the following: (1) The best results are obtained when TAGConv is used as the first edge-oriented subnetwork, while the results are relatively poorer when GAT or SGConv is used as the edge-oriented subnetwork. (2) Overall, even with different backbones for the edge-oriented graph subnetwork, the proposed DELTA still demonstrates superior performance, which validates DELTA’s strong generalizability and the effectiveness of achieving complementary information through different graph subnetworks. For more insights into the generalizability across additional datasets, please refer to Figure A3 in the Appendix, where the conclusions remain robust.
5.5.2. Performance vs Runtime.
Figure 7 illustrates the trade-off between runtime and performance for the proposed DELTA compared to baseline algorithms. From the results, it can be observed that the runtime of DELTA is significantly shorter than that of AGE, ANRMAB, Dissimilarity scores, and GraphPart, but slightly longer than that of Degree, Density, and other remaining baselines. However, DELTA achieves the best performance. The potential reason is that AGE, ANRMAB, and Dissimilarity scores are iterative active learning algorithms with high time costs for each iteration (Cai et al., 2017; Gao et al., 2018; Ren et al., 2022), while GraphPart involves community clustering (Ma et al., 2023), which also requires a considerable amount of time. In contrast, the proposed DELTA takes only one-fifth of the time of AGE, ANRMAB, and Dissimilarity scores yet outperforms these methods. Figure A4 in the Appendix reports the runtime analysis across more datasets, where the conclusions remain robust.
5.5.3. Visualization.
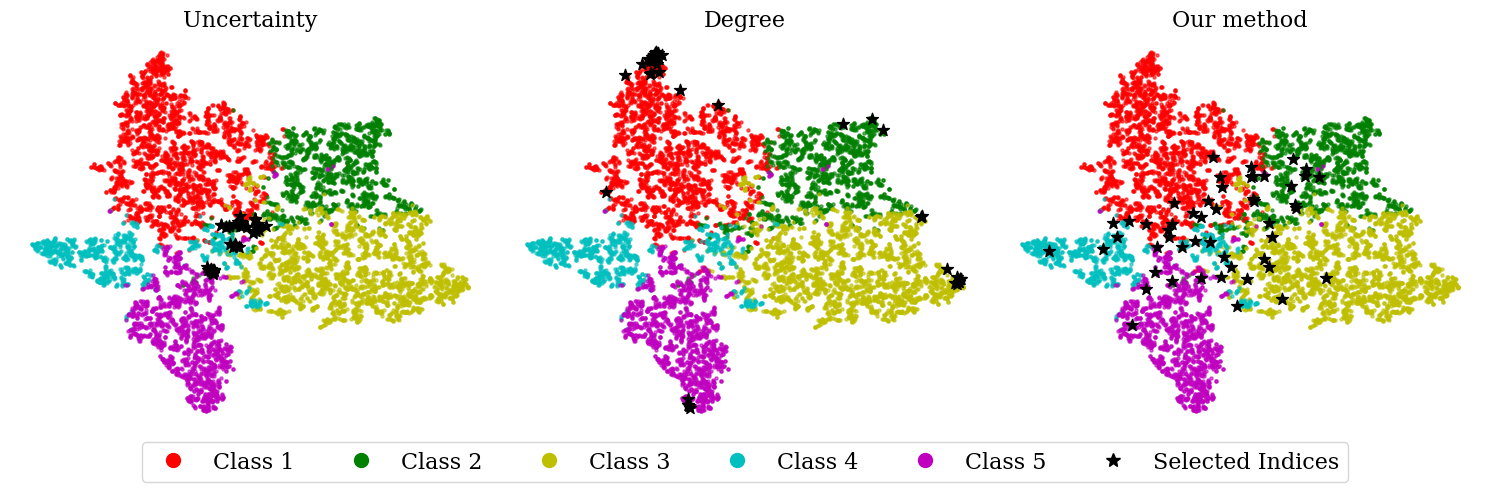
Figure 8 shows the t-SNE visualization of the differences between the proposed DELTA and two classic baseline algorithms, Uncertainty (Settles and Craven, 2008) and Degree (Cai et al., 2017) in the ACMv9DBLPv7 setting. From this, we can observe the following: (1) The nodes selected by the proposed DELTA cover each species category and are relatively evenly distributed across the target graph’s node categories, highlighting the strong diversity of the nodes selected by DELTA. (2) In contrast, the nodes selected by Uncertainty and Degree are concentrated in 1 to 3 categories, with a highly uneven distribution. This contrast visually emphasizes the effectiveness and diversity of DELTA, as the richer the true labels of the nodes selected for active learning in the target graph, the easier it is to optimize the semi-supervised loss function in the target graph during graph domain adaptation. The more informative the labeled nodes in the target graph, the greater the improvement in the performance of graph domain adaptation. Figures A5 and A6 in the Appendix show t-SNE visualizations on additional datasets, where the conclusions remain consistent with those in Figure 8.
6. Conclusion
In this paper, we investigate the problem of active graph domain adaptation and propose a new approach named DELTA for this problem. Our DELTA consists of an edge-oriented graph subnetwork and a path-oriented graph subnetwork to explore topological semantics from complementary perspectives, and then selects target nodes with high inconsistency as candidate nodes. Then, DELTA combines both node degree and K-hop subgraphs to explore topological uncertainty for each node. It also calculates degree-weighted discrepancy scores to focus on target nodes differently from source nodes for fine selection. Extensive experiments on various benchmark datasets demonstrate the effectiveness of our DELTA. In future work, we will extend our DELTA to more generalized problems such as open-set graph domain adaptation and utilize large language models to mitigate the annotation burden.
References
- (1)
- Azabou et al. (2023) Mehdi Azabou, Venkataramana Ganesh, Shantanu Thakoor, Chi-Heng Lin, Lakshmi Sathidevi, Ran Liu, Michal Valko, Petar Veličković, and Eva L Dyer. 2023. Half-Hop: A graph upsampling approach for slowing down message passing. In International Conference on Machine Learning. PMLR, 1341–1360.
- Cai et al. (2022) Hanxuan Cai, Huimin Zhang, Duancheng Zhao, Jingxing Wu, and Ling Wang. 2022. FP-GNN: a versatile deep learning architecture for enhanced molecular property prediction. Briefings in bioinformatics 23, 6 (2022), bbac408.
- Cai et al. (2017) Hongyun Cai, Vincent W Zheng, and Kevin Chen-Chuan Chang. 2017. Active learning for graph embedding. arXiv preprint arXiv:1705.05085 (2017).
- Cai et al. (2024) Ruichu Cai, Fengzhu Wu, Zijian Li, Pengfei Wei, Lingling Yi, and Kun Zhang. 2024. Graph domain adaptation: A generative view. ACM Transactions on Knowledge Discovery from Data 18, 3 (2024), 1–24.
- Chattopadhyay et al. (2013) Rita Chattopadhyay, Wei Fan, Ian Davidson, Sethuraman Panchanathan, and Jieping Ye. 2013. Joint transfer and batch-mode active learning. In International conference on machine learning. PMLR, 253–261.
- Chen et al. (2019) Xia Chen, Guoxian Yu, Jun Wang, Carlotta Domeniconi, Zhao Li, and Xiangliang Zhang. 2019. Activehne: Active heterogeneous network embedding. arXiv preprint arXiv:1905.05659 (2019).
- Cui et al. (2022) Limeng Cui, Xianfeng Tang, Sumeet Katariya, Nikhil Rao, Pallav Agrawal, Karthik Subbian, and Dongwon Lee. 2022. Allie: Active learning on large-scale imbalanced graphs. In Proceedings of the ACM Web Conference 2022. 690–698.
- Dai et al. (2022) Quanyu Dai, Xiao-Ming Wu, Jiaren Xiao, Xiao Shen, and Dan Wang. 2022. Graph transfer learning via adversarial domain adaptation with graph convolution. IEEE Transactions on Knowledge and Data Engineering 35, 5 (2022), 4908–4922.
- Du et al. (2017) Jian Du, Shanghang Zhang, Guanhang Wu, JM Moura, and Soummya Kar. 2017. Topology adaptive graph convolutional networks. arXiv 2017. arXiv preprint arXiv:1710.10370 (2017).
- Fey and Lenssen (2019) Matthias Fey and Jan E. Lenssen. 2019. Fast Graph Representation Learning with PyTorch Geometric. In ICLR Workshop on Representation Learning on Graphs and Manifolds.
- Fuchsgruber et al. (2024) Dominik Fuchsgruber, Tom Wollschläger, Bertrand Charpentier, Antonio Oroz, and Stephan Günnemann. 2024. Uncertainty for Active Learning on Graphs. arXiv preprint arXiv:2405.01462 (2024).
- Gao et al. (2018) Li Gao, Hong Yang, Chuan Zhou, Jia Wu, Shirui Pan, and Yue Hu. 2018. Active discriminative network representation learning. In IJCAI international joint conference on artificial intelligence.
- Guo et al. (2022a) Gaoyang Guo, Chaokun Wang, Bencheng Yan, Yunkai Lou, Hao Feng, Junchao Zhu, Jun Chen, Fei He, and S Yu Philip. 2022a. Learning adaptive node embeddings across graphs. IEEE Transactions on Knowledge and Data Engineering 35, 6 (2022), 6028–6042.
- Guo et al. (2022b) Gaoyang Guo, Chaokun Wang, Bencheng Yan, Yunkai Lou, Hao Feng, Junchao Zhu, Jun Chen, Fei He, and S Yu Philip. 2022b. Learning adaptive node embeddings across graphs. IEEE Transactions on Knowledge and Data Engineering 35, 6 (2022), 6028–6042.
- Guo and Wang (2020) Zhiwei Guo and Heng Wang. 2020. A deep graph neural network-based mechanism for social recommendations. IEEE Transactions on Industrial Informatics 17, 4 (2020), 2776–2783.
- Hastie et al. (2004) Trevor Hastie, Robert Tibshirani, and Jerome Friedman. 2004. The elements of statistical learning. 2001. Journal of the Royal Statistical Society 167, 1 (2004), 192–192.
- Hedegaard et al. (2021) Lukas Hedegaard, Omar Ali Sheikh-Omar, and Alexandros Iosifidis. 2021. Supervised domain adaptation: A graph embedding perspective and a rectified experimental protocol. IEEE Transactions on Image Processing 30 (2021), 8619–8631.
- Hsu and Lin (2015) Wei-Ning Hsu and Hsuan-Tien Lin. 2015. Active learning by learning. In Proceedings of the AAAI Conference on Artificial Intelligence, Vol. 29.
- Hu et al. (2020) Shengding Hu, Zheng Xiong, Meng Qu, Xingdi Yuan, Marc-Alexandre Côté, Zhiyuan Liu, and Jian Tang. 2020. Graph policy network for transferable active learning on graphs. Advances in Neural Information Processing Systems 33 (2020), 10174–10185.
- Jiang et al. (2020) Pin Jiang, Aming Wu, Yahong Han, Yunfeng Shao, Meiyu Qi, and Bingshuai Li. 2020. Bidirectional adversarial training for semi-supervised domain adaptation.. In IJCAI. 934–940.
- Jin et al. (2020) Yilun Jin, Guojie Song, and Chuan Shi. 2020. Gralsp: Graph neural networks with local structural patterns. In Proceedings of the AAAI Conference on Artificial Intelligence, Vol. 34. 4361–4368.
- Kingma and Ba (2014) Diederik Kingma and Jimmy Ba. 2014. Adam: A Method for Stochastic Optimization. Computer Science (2014).
- Kipf and Welling (2016) Thomas N Kipf and Max Welling. 2016. Semi-supervised classification with graph convolutional networks. arXiv preprint arXiv:1609.02907 (2016).
- Li et al. (2022) Haoran Li, Hanghang Tong, and Yang Weng. 2022. Domain adaptation in physical systems via graph kernel. In Proceedings of the 28th ACM SIGKDD conference on knowledge discovery and data mining. 868–876.
- Li et al. (2024) Wenjun Li, Wanjun Ma, Mengyun Yang, and Xiwei Tang. 2024. Drug repurposing based on the DTD-GNN graph neural network: revealing the relationships among drugs, targets and diseases. BMC genomics 25 (2024).
- Liu et al. (2024) Tianyu Liu, Yuge Wang, Rex Ying, and Hongyu Zhao. 2024. MuSe-GNN: Learning Unified Gene Representation From Multimodal Biological Graph Data. Advances in Neural Information Processing Systems 36 (2024).
- Ma et al. (2023) Jiaqi Ma, Ziqiao Ma, Joyce Chai, and Qiaozhu Mei. 2023. Partition-Based Active Learning for Graph Neural Networks. Transactions on Machine Learning Research (2023).
- Ma et al. (2024) Siteng Ma, Haochang Wu, Aonghus Lawlor, and Ruihai Dong. 2024. Breaking the Barrier: Selective Uncertainty-Based Active Learning for Medical Image Segmentation. In ICASSP 2024-2024 IEEE International Conference on Acoustics, Speech and Signal Processing (ICASSP). IEEE, 1531–1535.
- Ma et al. (2020) Zheng Ma, Junyu Xuan, Yu Guang Wang, Ming Li, and Pietro Liò. 2020. Path integral based convolution and pooling for graph neural networks. Advances in Neural Information Processing Systems 33 (2020), 16421–16433.
- Menke et al. (2024) Maximilian Menke, Thomas Wenzel, and Andreas Schwung. 2024. Bridging the gap: Active learning for efficient domain adaptation in object detection. Expert Systems with Applications (2024), 124403.
- Murphy (2012) Kevin P Murphy. 2012. Machine Learning: A Probabilistic Perspective. MIT Press (2012).
- Myers et al. (2014) Seth A Myers, Aneesh Sharma, Pankaj Gupta, and Jimmy Lin. 2014. Information network or social network? The structure of the Twitter follow graph. In Proceedings of the 23rd international conference on world wide web. 493–498.
- Paszke et al. (2019) Adam Paszke, Sam Gross, Francisco Massa, Adam Lerer, James Bradbury, Gregory Chanan, Trevor Killeen, Zeming Lin, Natalia Gimelshein, Luca Antiga, et al. 2019. Pytorch: An imperative style, high-performance deep learning library. Advances in neural information processing systems 32 (2019).
- Pilancı and Vural (2020a) Mehmet Pilancı and Elif Vural. 2020a. Domain adaptation on graphs by learning aligned graph bases. IEEE Transactions on Knowledge and Data Engineering 34, 2 (2020), 587–600.
- Pilancı and Vural (2020b) Mehmet Pilancı and Elif Vural. 2020b. Domain adaptation on graphs by learning aligned graph bases. IEEE Transactions on Knowledge and Data Engineering 34, 2 (2020), 587–600.
- Prabhu et al. (2021) Viraj Prabhu, Arjun Chandrasekaran, Kate Saenko, and Judy Hoffman. 2021. Active domain adaptation via clustering uncertainty-weighted embeddings. In Proceedings of the IEEE/CVF international conference on computer vision. 8505–8514.
- Qiao et al. (2023a) Ziyue Qiao, Xiao Luo, Meng Xiao, Hao Dong, Yuanchun Zhou, and Hui Xiong. 2023a. Semi-supervised domain adaptation in graph transfer learning. arXiv preprint arXiv:2309.10773 (2023).
- Qiao et al. (2023b) Ziyue Qiao, Xiao Luo, Meng Xiao, Hao Dong, Yuanchun Zhou, and Hui Xiong. 2023b. Semi-supervised domain adaptation in graph transfer learning. arXiv preprint arXiv:2309.10773 (2023).
- Qiao et al. (2024) Ziyue Qiao, Meng Xiao, Weiyu Guo, Xiao Luo, and Hui Xiong. 2024. Information filtering and interpolating for semi-supervised graph domain adaptation. Pattern Recognition 153 (2024), 110498.
- Rai et al. (2010) Piyush Rai, Avishek Saha, Hal Daumé III, and Suresh Venkatasubramanian. 2010. Domain adaptation meets active learning. In Proceedings of the NAACL HLT 2010 Workshop on Active Learning for Natural Language Processing. 27–32.
- Redko et al. (2020) Ievgen Redko, Emilie Morvant, Amaury Habrard, Marc Sebban, and Younès Bennani. 2020. A survey on domain adaptation theory: learning bounds and theoretical guarantees. arXiv preprint arXiv:2004.11829 (2020).
- Ren et al. (2022) Zhicheng Ren, Yifu Yuan, Yuxin Wu, Xiaxuan Gao, Yewen Wang, and Yizhou Sun. 2022. Dissimilar Nodes Improve Graph Active Learning. ArXiv abs/2212.01968 (2022).
- Settles and Craven (2008) Burr Settles and Mark W. Craven. 2008. An Analysis of Active Learning Strategies for Sequence Labeling Tasks. In Conference on Empirical Methods in Natural Language Processing.
- Sharma and Bilgic (2017) Manali Sharma and Mustafa Bilgic. 2017. Evidence-based uncertainty sampling for active learning. Data Mining and Knowledge Discovery 31 (2017), 164–202.
- Shen et al. (2023a) Xiao Shen, Shirui Pan, Kup-Sze Choi, and Xi Zhou. 2023a. Domain-adaptive message passing graph neural network. Neural Networks 164 (2023), 439–454.
- Shen et al. (2023b) Xiao Shen, Mengqiu Shao, Shirui Pan, Laurence T Yang, and Xi Zhou. 2023b. Domain-adaptive graph attention-supervised network for cross-network edge classification. IEEE Transactions on Neural Networks and Learning Systems (2023).
- Shen et al. (2021) Zi-Ang Shen, Tao Luo, Yuan-Ke Zhou, Han Yu, and Pu-Feng Du. 2021. NPI-GNN: predicting ncRNA–protein interactions with deep graph neural networks. Briefings in bioinformatics 22, 5 (2021), bbab051.
- Shi et al. (2024) Boshen Shi, Yongqing Wang, Fangda Guo, Bingbing Xu, Huawei Shen, and Xueqi Cheng. 2024. Graph Domain Adaptation: Challenges, Progress and Prospects. arXiv preprint arXiv:2402.00904 (2024).
- Song et al. (2020) Guojie Song, Yizhou Zhang, Lingjun Xu, and Haibing Lu. 2020. Domain adaptive network embedding. IEEE Transactions on Big Data 8, 5 (2020), 1220–1232.
- Su et al. (2020) Jong-Chyi Su, Yi-Hsuan Tsai, Kihyuk Sohn, Buyu Liu, Subhransu Maji, and Manmohan Chandraker. 2020. Active adversarial domain adaptation. In Proceedings of the IEEE/CVF Winter Conference on Applications of Computer Vision. 739–748.
- Sun et al. (2022) Ruoxi Sun, Hanjun Dai, and Adams Wei Yu. 2022. Does gnn pretraining help molecular representation? Advances in Neural Information Processing Systems 35 (2022), 12096–12109.
- Sun et al. (2015) Shiliang Sun, Honglei Shi, and Yuanbin Wu. 2015. A survey of multi-source domain adaptation. Information Fusion 24 (2015), 84–92.
- Tang et al. (2008) Jie Tang, Jing Zhang, Limin Yao, Juanzi Li, Li Zhang, and Zhong Su. 2008. Arnetminer: extraction and mining of academic social networks. In Proceedings of the 14th ACM SIGKDD international conference on Knowledge discovery and data mining. 990–998.
- Veličković et al. (2017) Petar Veličković, Guillem Cucurull, Arantxa Casanova, Adriana Romero, Pietro Lio, and Yoshua Bengio. 2017. Graph attention networks. arXiv preprint arXiv:1710.10903 (2017).
- Wang et al. (2023a) Huan Wang, Guoquan Liu, and Po Hu. 2023a. TDAN: transferable domain adversarial network for link prediction in heterogeneous social networks. ACM Transactions on Knowledge Discovery from Data 18, 1 (2023), 1–22.
- Wang et al. (2023b) Qizhou Wang, Guansong Pang, Mahsa Salehi, Wray Buntine, and Christopher Leckie. 2023b. Cross-domain graph anomaly detection via anomaly-aware contrastive alignment. In Proceedings of the AAAI Conference on Artificial Intelligence, Vol. 37. 4676–4684.
- West et al. (2016) Jevin D West, Ian Wesley-Smith, and Carl T Bergstrom. 2016. A recommendation system based on hierarchical clustering of an article-level citation network. IEEE Transactions on Big Data 2, 2 (2016), 113–123.
- Wilson and Cook (2020) Garrett Wilson and Diane J Cook. 2020. A survey of unsupervised deep domain adaptation. ACM Transactions on Intelligent Systems and Technology (TIST) 11, 5 (2020), 1–46.
- Wu et al. (2019) Felix Wu, Amauri Souza, Tianyi Zhang, Christopher Fifty, Tao Yu, and Kilian Weinberger. 2019. Simplifying graph convolutional networks. In International conference on machine learning. PMLR, 6861–6871.
- Wu et al. (2024) Hanrui Wu, Lei Tian, Yanxin Wu, Jia Zhang, Michael K Ng, and Jinyi Long. 2024. Transferable graph auto-encoders for cross-network node classification. Pattern Recognition 150 (2024), 110334.
- Wu et al. (2023) Jun Wu, Jingrui He, and Elizabeth Ainsworth. 2023. Non-iid transfer learning on graphs. In Proceedings of the AAAI Conference on Artificial Intelligence, Vol. 37. 10342–10350.
- Wu et al. (2020a) Man Wu, Shirui Pan, Chuan Zhou, Xiaojun Chang, and Xingquan Zhu. 2020a. Unsupervised domain adaptive graph convolutional networks. In Proceedings of The Web Conference 2020. 1457–1467.
- Wu et al. (2020b) Man Wu, Shirui Pan, Chuan Zhou, Xiaojun Chang, and Xingquan Zhu. 2020b. Unsupervised domain adaptive graph convolutional networks. In Proceedings of The Web Conference 2020. 1457–1467.
- Wu et al. (2022b) Man Wu, Shirui Pan, and Xingquan Zhu. 2022b. Attraction and repulsion: Unsupervised domain adaptive graph contrastive learning network. IEEE Transactions on Emerging Topics in Computational Intelligence 6, 5 (2022), 1079–1091.
- Wu and Rostami (2023) Mengxi Wu and Mohammad Rostami. 2023. Unsupervised domain adaptation for graph-structured data using class-conditional distribution alignment. arXiv preprint arXiv:2301.12361 6 (2023).
- Wu et al. (2022a) Yifan Wu, Min Gao, Min Zeng, Jie Zhang, and Min Li. 2022a. BridgeDPI: a novel graph neural network for predicting drug–protein interactions. Bioinformatics 38, 9 (2022), 2571–2578.
- Xie et al. (2022) Binhui Xie, Longhui Yuan, Shuang Li, Chi Harold Liu, Xinjing Cheng, and Guoren Wang. 2022. Active learning for domain adaptation: An energy-based approach. In Proceedings of the AAAI conference on artificial intelligence, Vol. 36. 8708–8716.
- Yan et al. (2017) Hongliang Yan, Yukang Ding, Peihua Li, Qilong Wang, Yong Xu, and Wangmeng Zuo. 2017. Mind the class weight bias: Weighted maximum mean discrepancy for unsupervised domain adaptation. In Proceedings of the IEEE conference on computer vision and pattern recognition. 2272–2281.
- Yang et al. (2022) Shuiqiao Yang, Borui Cai, Taotao Cai, Xiangyu Song, Jiaojiao Jiang, Bing Li, and Jianxin Li. 2022. Robust cross-network node classification via constrained graph mutual information. Knowledge-Based Systems 257 (2022), 109852.
- Ye et al. (2024) Yutong Ye, Xiang Lian, and Mingsong Chen. 2024. Efficient Exact Subgraph Matching via GNN-Based Path Dominance Embedding. Proceedings of the VLDB Endowment 17, 7 (2024), 1628–1641.
- Yin et al. (2022) Nan Yin, Li Shen, Baopu Li, Mengzhu Wang, Xiao Luo, Chong Chen, Zhigang Luo, and Xian-Sheng Hua. 2022. Deal: An unsupervised domain adaptive framework for graph-level classification. In Proceedings of the 30th ACM International Conference on Multimedia. 3470–3479.
- Yin et al. (2023) Nan Yin, Li Shen, Mengzhu Wang, Long Lan, Zeyu Ma, Chong Chen, Xian-Sheng Hua, and Xiao Luo. 2023. Coco: A coupled contrastive framework for unsupervised domain adaptive graph classification. In International Conference on Machine Learning. PMLR, 40040–40053.
- You et al. (2023) Yuning You, Tianlong Chen, Zhangyang Wang, and Yang Shen. 2023. Graph domain adaptation via theory-grounded spectral regularization. In The eleventh international conference on learning representations.
- Yu et al. (2024) Chengcheng Yu, Jiapeng Zhu, and Xiang Li. 2024. Class-Balanced and Reinforced Active Learning on Graphs. arXiv:2402.10074
- Yuan et al. (2023) Jingyang Yuan, Xiao Luo, Yifang Qin, Zhengyang Mao, Wei Ju, and Ming Zhang. 2023. Alex: Towards effective graph transfer learning with noisy labels. In Proceedings of the 31st ACM international conference on multimedia. 3647–3656.
- Zhan et al. (2021) Xueying Zhan, Huan Liu, Qing Li, and Antoni B Chan. 2021. A comparative survey: Benchmarking for pool-based active learning.. In IJCAI. 4679–4686.
- Zhan et al. (2022) Xueying Zhan, Qingzhong Wang, Kuan-hao Huang, Haoyi Xiong, Dejing Dou, and Antoni B Chan. 2022. A comparative survey of deep active learning. arXiv preprint arXiv:2203.13450 (2022).
- Zhang et al. (2021) Xiaowen Zhang, Yuntao Du, Rongbiao Xie, and Chongjun Wang. 2021. Adversarial separation network for cross-network node classification. In Proceedings of the 30th ACM international conference on information & knowledge management. 2618–2626.
- Zhang et al. (2022a) Yanfu Zhang, Shangqian Gao, Jian Pei, and Heng Huang. 2022a. Improving social network embedding via new second-order continuous graph neural networks. In Proceedings of the 28th ACM SIGKDD conference on knowledge discovery and data mining. 2515–2523.
- Zhang et al. (2022b) Yuheng Zhang, Hanghang Tong, Yinglong Xia, Yan Zhu, Yuejie Chi, and Lei Ying. 2022b. Batch active learning with graph neural networks via multi-agent deep reinforcement learning. In Proceedings of the AAAI conference on artificial intelligence, Vol. 36. 9118–9126.
- Zhu et al. (2021) Ronghang Zhu, Xiaodong Jiang, Jiasen Lu, and Sheng Li. 2021. Cross-domain graph convolutions for adversarial unsupervised domain adaptation. IEEE Transactions on Neural Networks and Learning Systems 34, 8 (2021), 3847–3858.
Appendix A Detailed Description of Datasets
Table A1 presents the descriptive statistics of acmv9, citationv1, and dblpv7. There are significant differences among the three graphs: acmv9 has the largest size (9,360 nodes and 15,602 edges), citationv1 has the highest average degree (1.691), and dblpv7 has the smallest graph size and the lowest average degree (5,484 nodes, 8,130 edges, average degree of 1.482). Regarding the node category ratios for the three graphs, the second category (Networking) is the most prevalent, while the fourth category (Information Security) is the least represented.
| Datasets | # Nodes | # Edges | # Classes | Avg. degree | |||
|---|---|---|---|---|---|---|---|
| ACMv9 | 9,360 | 15,602 | 5 | 1.667 | |||
| Citationv1 | 8,935 | 15,113 | 5 | 1.691 | |||
| DBLPv7 | 5,484 | 8,130 | 5 | 1.482 |
Appendix B Baseline Algorithms
GraphPart.
The GraphPart first parities the target graph into communities. Then, it runs the K-means algorithm on each community and selects the node closest to the cluster center for labeling (Ma et al., 2023).
AGE
AGE calculates the information entropy, information density, and graph centrality for each node in the target graph, linearly combines these metrics, and selects the node with the highest combined score for labeling (Cai et al., 2017).
ANRMAB
ANRMAB uses a multi-armed bandit algorithm to weigh and combine the three metrics of AGE and selects the node with the highest combined score for labeling (Gao et al., 2018).
Dissimilarity.
Dissimilarity scores build upon AGE by introducing the feature dissimilarity score (FDS) and structure dissimilarity score (SDS). These scores are linearly combined, and the nodes with the highest combined scores are selected for labeling (Ren et al., 2022).
Degree.
Density.
Uncertainty.
Calculates the entropy of each node and selects the node with the highest entropy for labeling (Settles and Craven, 2008).
Random.
Randomly selects nodes uniformly across the target graph for labeling.
Appendix C More experiments
In this section, we extend the experiments presented in the main text. First, we expand the comparison with baseline algorithms by using 100, 125, 150, 175, and 200 nodes for active learning to explore the effectiveness of the proposed DELTA. Then, we report the parameter sensitivity experiments, generalizability experiments, runtime vs performance analysis, and visualization analysis on the complete dataset combination.
C.1. Performance Comparison
In Table A2, we report the comparison between the proposed DELTA and baseline algorithms when the number of nodes selected for active learning is set to 100, 125, 150, 175, and 200. From the results, we can observe the following: (1) On average, DELTA consistently outperforms all baseline algorithms. This further highlights the effectiveness of the proposed DELTA. (2) As the number of nodes selected for active learning increases, the performance gap of DELTA widens, from an average of 1-4% with 100 nodes to an average of 2-6% with 200 nodes. This indicates that DELTA performs better in medium to large-scale active learning tasks. (3) As the number of selected nodes increases, baseline methods based on community partitioning, such as GraphPart, and combined metrics, such as AGE, ANRMAB, and Dissimilarity, gradually fall behind simpler baseline methods based on single metrics, such as Uncertainty. The underlying reason is that as the number of selected nodes increases, the internal clusters within these methods become smaller, leading to a loss of node representativeness.
| Methods | AC | AD | DC | DA | CA | CD | Average | ||||||||||||||
|---|---|---|---|---|---|---|---|---|---|---|---|---|---|---|---|---|---|---|---|---|---|
| Macro | Micro | Macro | Micro | Macro | Micro | Macro | Micro | Macro | Micro | Macro | Micro | Macro | Micro | ||||||||
| 100 nodes are selected for active learning | |||||||||||||||||||||
| GraphPart (Ma et al., 2023) | 76.00.3 | 77.80.2 | 72.10.8 | 74.40.8 | 71.40.9 | 73.30.9 | 67.80.3 | 67.20.1 | 70.30.5 | 69.40.5 | 71.40.8 | 73.70.5 | 71.5 | 72.6 | |||||||
| AGE (Cai et al., 2017) | 76.41.3 | 78.01.2 | 69.71.9 | 72.11.4 | 71.20.6 | 73.30.6 | 68.21.0 | 67.70.9 | 70.40.7 | 69.50.5 | 71.31.1 | 73.10.6 | 71.2 | 72.3 | |||||||
| ANRMAB (Gao et al., 2018) | 74.60.7 | 76.40.6 | 68.70.7 | 71.20.8 | 69.31.4 | 71.51.3 | 65.82.0 | 65.41.7 | 70.40.6 | 69.50.5 | 68.61.9 | 71.61.3 | 69.5 | 70.9 | |||||||
| Dissimilarity (Ren et al., 2022) | 75.81.4 | 77.51.3 | 70.02.6 | 72.52.1 | 71.12.4 | 73.12.0 | 65.71.6 | 65.51.3 | 70.20.8 | 69.10.8 | 71.72.7 | 73.52.0 | 70.8 | 71.8 | |||||||
| Degree (Cai et al., 2017) | 74.20.8 | 75.90.7 | 68.31.2 | 71.21.2 | 69.92.0 | 72.31.1 | 64.90.5 | 64.80.4 | 67.80.7 | 67.20.7 | 70.21.0 | 72.30.4 | 69.2 | 70.6 | |||||||
| Density (Ren et al., 2022) | 74.20.7 | 76.20.8 | 69.80.9 | 72.41.0 | 69.31.4 | 71.80.9 | 65.60.7 | 65.20.8 | 68.50.8 | 67.80.7 | 69.31.3 | 71.80.7 | 69.5 | 70.9 | |||||||
| Uncertainty (Settles and Craven, 2008) | 76.01.0 | 77.80.9 | 70.31.5 | 72.71.3 | 71.90.8 | 73.81.1 | 67.51.8 | 67.11.5 | 70.30.8 | 69.40.8 | 69.21.5 | 71.70.9 | 70.9 | 72.1 | |||||||
| Random | 75.30.7 | 77.00.7 | 69.61.6 | 72.51.4 | 71.30.8 | 73.20.7 | 67.10.6 | 66.60.5 | 70.41.1 | 69.41.0 | 68.91.2 | 71.60.5 | 70.4 | 71.7 | |||||||
| Proposed | 77.21.2 | 78.91.2 | 69.92.2 | 72.51.6 | 74.12.3 | 76.01.9 | 68.41.9 | 67.71.6 | 71.90.9 | 70.80.7 | 71.12.8 | 73.31.8 | 72.1 | 73.2 | |||||||
| 125 nodes are selected for active learning | |||||||||||||||||||||
| GraphPart (Ma et al., 2023) | 76.00.7 | 77.60.6 | 71.70.5 | 74.00.5 | 71.50.9 | 73.50.4 | 68.00.6 | 67.30.4 | 71.00.7 | 70.00.5 | 72.10.8 | 74.00.7 | 71.7 | 72.7 | |||||||
| AGE (Cai et al., 2017) | 76.21.4 | 77.91.3 | 70.51.7 | 72.71.3 | 72.32.5 | 74.12.1 | 68.71.2 | 68.01.2 | 70.41.0 | 69.30.8 | 72.81.1 | 74.00.9 | 71.8 | 72.7 | |||||||
| ANRMAB (Gao et al., 2018) | 74.91.0 | 76.80.8 | 69.61.0 | 71.90.7 | 70.71.3 | 73.00.8 | 66.60.7 | 66.00.6 | 70.00.6 | 69.00.6 | 69.51.5 | 71.81.1 | 70.2 | 71.4 | |||||||
| Dissimilarity (Ren et al., 2022) | 76.31.4 | 77.91.3 | 70.02.3 | 72.61.9 | 73.31.9 | 75.11.6 | 68.10.7 | 67.50.6 | 69.70.8 | 68.80.5 | 71.02.3 | 72.81.5 | 71.4 | 72.4 | |||||||
| Degree (Cai et al., 2017) | 74.50.9 | 76.30.8 | 68.71.2 | 71.31.1 | 71.41.0 | 73.50.7 | 66.31.0 | 65.90.8 | 68.40.4 | 67.70.5 | 70.70.6 | 72.20.3 | 70.0 | 71.1 | |||||||
| Density (Ren et al., 2022) | 74.70.8 | 76.40.8 | 68.80.8 | 71.70.8 | 70.61.0 | 72.90.6 | 66.41.2 | 66.01.1 | 68.91.2 | 68.01.0 | 69.41.4 | 71.70.9 | 69.8 | 71.1 | |||||||
| Uncertainty (Settles and Craven, 2008) | 76.01.2 | 77.71.2 | 71.01.5 | 73.21.2 | 71.81.7 | 73.91.5 | 68.51.7 | 67.91.4 | 71.20.1 | 70.30.2 | 70.81.3 | 72.50.6 | 71.6 | 72.6 | |||||||
| Random | 75.90.9 | 77.50.7 | 69.71.4 | 72.61.3 | 72.30.6 | 74.10.4 | 67.51.0 | 67.01.0 | 70.30.8 | 69.50.8 | 70.01.9 | 72.41.1 | 70.9 | 72.2 | |||||||
| Proposed | 77.31.3 | 78.91.1 | 70.42.6 | 72.82.1 | 74.51.1 | 76.20.9 | 70.90.9 | 70.00.7 | 72.50.8 | 71.50.7 | 73.52.0 | 75.01.4 | 73.2 | 74.1 | |||||||
| 150 nodes are selected for active learning | |||||||||||||||||||||
| GraphPart (Ma et al., 2023) | 76.50.6 | 77.90.5 | 71.91.3 | 74.31.2 | 72.00.5 | 73.70.6 | 68.30.5 | 67.80.4 | 70.10.5 | 69.10.5 | 71.70.9 | 74.30.3 | 71.7 | 72.8 | |||||||
| AGE (Cai et al., 2017) | 75.41.1 | 77.11.0 | 70.32.3 | 72.71.7 | 72.82.5 | 74.71.8 | 68.80.9 | 68.10.9 | 70.70.7 | 69.70.7 | 71.02.8 | 73.11.5 | 71.5 | 72.6 | |||||||
| ANRMAB (Gao et al., 2018) | 75.70.7 | 77.40.7 | 69.31.1 | 71.81.0 | 71.01.0 | 73.10.8 | 66.11.6 | 65.71.4 | 70.51.2 | 69.51.0 | 68.61.9 | 71.41.1 | 70.2 | 71.5 | |||||||
| Dissimilarity (Ren et al., 2022) | 76.51.4 | 78.11.2 | 70.21.9 | 72.71.7 | 73.51.3 | 75.40.8 | 67.11.8 | 66.71.7 | 70.70.7 | 69.80.7 | 69.12.3 | 71.61.4 | 71.2 | 72.4 | |||||||
| Degree (Cai et al., 2017) | 74.80.7 | 76.50.6 | 68.71.3 | 71.31.2 | 70.31.6 | 72.71.2 | 66.30.4 | 66.00.2 | 68.40.4 | 67.80.3 | 71.00.8 | 72.50.7 | 69.9 | 71.1 | |||||||
| Density (Ren et al., 2022) | 75.20.7 | 76.90.6 | 70.01.1 | 72.80.8 | 70.31.2 | 72.60.5 | 66.01.4 | 65.61.2 | 68.60.8 | 67.80.8 | 70.31.6 | 72.61.0 | 70.1 | 71.4 | |||||||
| Uncertainty (Settles and Craven, 2008) | 75.51.6 | 77.51.0 | 71.21.1 | 73.31.0 | 73.11.2 | 75.11.1 | 68.91.3 | 68.41.1 | 71.11.0 | 70.20.9 | 71.92.6 | 73.51.7 | 71.9 | 73.0 | |||||||
| Random | 76.20.8 | 77.80.6 | 70.51.5 | 73.41.5 | 72.11.1 | 74.00.7 | 67.80.8 | 67.20.7 | 70.11.2 | 69.21.2 | 70.41.9 | 72.81.2 | 71.2 | 72.4 | |||||||
| Proposed | 77.51.5 | 79.11.2 | 71.52.7 | 73.82.3 | 75.61.6 | 77.31.2 | 70.22.1 | 69.31.8 | 72.20.8 | 71.10.7 | 72.02.5 | 73.91.7 | 73.2 | 74.1 | |||||||
| 175 nodes are selected for active learning | |||||||||||||||||||||
| GraphPart (Ma et al., 2023) | 76.70.8 | 78.20.7 | 73.00.5 | 75.20.4 | 71.70.8 | 73.50.6 | 68.00.7 | 67.20.7 | 70.90.7 | 70.10.7 | 71.91.1 | 73.90.7 | 72.0 | 73.0 | |||||||
| AGE (Cai et al., 2017) | 76.21.6 | 77.91.4 | 70.52.6 | 72.92.0 | 73.12.5 | 74.82.2 | 66.42.1 | 66.11.8 | 70.51.0 | 69.50.9 | 73.60.8 | 74.70.7 | 71.7 | 72.6 | |||||||
| ANRMAB (Gao et al., 2018) | 75.61.2 | 77.41.1 | 69.51.5 | 71.91.4 | 72.40.7 | 74.10.6 | 68.01.0 | 67.20.9 | 70.81.0 | 69.80.9 | 70.22.2 | 72.31.8 | 71.1 | 72.1 | |||||||
| Dissimilarity (Ren et al., 2022) | 75.92.0 | 77.71.7 | 69.82.4 | 72.41.8 | 74.80.7 | 76.20.7 | 67.83.0 | 67.32.7 | 70.60.9 | 69.60.6 | 70.23.5 | 72.72.3 | 71.5 | 72.6 | |||||||
| Degree (Cai et al., 2017) | 74.60.8 | 76.40.7 | 69.51.5 | 72.01.3 | 71.20.9 | 73.40.5 | 65.90.5 | 65.60.4 | 68.60.6 | 67.90.6 | 69.50.8 | 72.00.5 | 69.9 | 71.2 | |||||||
| Density (Ren et al., 2022) | 75.00.9 | 76.70.8 | 69.72.0 | 72.41.7 | 69.61.3 | 72.20.8 | 65.81.0 | 65.50.9 | 68.80.5 | 68.10.5 | 70.12.0 | 72.41.4 | 69.8 | 71.2 | |||||||
| Uncertainty (Settles and Craven, 2008) | 77.41.5 | 78.91.2 | 70.42.8 | 72.72.0 | 73.91.5 | 75.61.4 | 68.32.4 | 67.72.1 | 72.00.8 | 71.00.8 | 73.21.7 | 74.31.3 | 72.5 | 73.4 | |||||||
| Random | 76.31.2 | 78.01.1 | 69.82.3 | 72.81.9 | 72.21.6 | 74.11.4 | 67.01.0 | 66.60.9 | 71.10.6 | 70.10.4 | 70.71.2 | 73.20.7 | 71.2 | 72.4 | |||||||
| Proposed | 77.41.6 | 79.11.4 | 72.22.9 | 74.12.5 | 74.21.9 | 76.21.5 | 70.41.7 | 69.51.5 | 73.50.6 | 72.40.5 | 72.82.1 | 74.41.7 | 73.4 | 74.3 | |||||||
| 200 nodes are selected for active learning | |||||||||||||||||||||
| GraphPart (Ma et al., 2023) | 76.70.5 | 78.30.4 | 72.51.4 | 74.71.0 | 71.81.4 | 73.81.1 | 68.20.9 | 67.40.8 | 71.30.8 | 70.20.7 | 72.41.1 | 74.20.9 | 72.2 | 73.1 | |||||||
| AGE (Cai et al., 2017) | 75.91.7 | 77.61.6 | 71.02.0 | 73.21.6 | 72.81.7 | 74.41.6 | 68.30.8 | 67.60.8 | 70.21.2 | 69.21.1 | 71.52.6 | 73.21.7 | 71.6 | 72.5 | |||||||
| ANRMAB (Gao et al., 2018) | 75.70.8 | 77.50.7 | 69.91.6 | 72.51.3 | 71.52.2 | 73.51.5 | 67.21.3 | 66.61.2 | 71.30.5 | 70.20.6 | 70.21.9 | 72.31.4 | 71.0 | 72.1 | |||||||
| Dissimilarity (Ren et al., 2022) | 76.51.2 | 78.21.1 | 70.32.4 | 72.91.8 | 73.21.5 | 74.81.4 | 68.50.8 | 67.90.7 | 71.21.1 | 70.20.8 | 73.11.1 | 74.30.7 | 72.1 | 73.1 | |||||||
| Degree (Cai et al., 2017) | 74.60.7 | 76.40.7 | 69.21.8 | 71.61.5 | 71.50.9 | 73.50.6 | 66.00.4 | 65.70.4 | 68.50.8 | 67.90.7 | 70.20.9 | 72.20.7 | 70.0 | 71.2 | |||||||
| Density (Ren et al., 2022) | 74.70.7 | 76.60.6 | 69.61.6 | 72.41.3 | 69.12.1 | 71.80.9 | 65.51.2 | 65.31.0 | 69.10.4 | 68.30.5 | 71.10.8 | 73.10.6 | 69.9 | 71.3 | |||||||
| Uncertainty (Settles and Craven, 2008) | 75.92.1 | 77.81.6 | 70.73.1 | 72.92.0 | 74.81.0 | 76.30.8 | 69.40.6 | 68.80.6 | 72.40.1 | 71.40.2 | 71.42.6 | 73.21.8 | 72.4 | 73.4 | |||||||
| Random | 76.50.9 | 78.10.9 | 71.61.2 | 74.00.8 | 72.51.0 | 74.31.1 | 68.20.9 | 67.50.8 | 70.81.4 | 69.91.0 | 70.02.0 | 72.61.5 | 71.6 | 72.7 | |||||||
| Proposed | 78.70.6 | 80.20.6 | 74.41.9 | 75.91.5 | 73.61.3 | 75.41.3 | 70.51.6 | 69.71.5 | 73.50.5 | 72.50.4 | 73.83.0 | 75.42.4 | 74.1 | 74.9 | |||||||
C.2. Parameter Sensitivity
Figure A1 and Figure A2 report the results on the complete set of six dataset combinations for different values of in the parameter space {0.1, 0.3, 0.5, 0.7} and in the parameter space {1, 2, 3, 4, 5}, respectively. From Figure A1, we can observe that the overall performance significantly declines when exceeds 0.5, while the results are relatively better when is between 0.3 and 0.5. This further validates our recommendation in the main text, suggesting that be set between 0.3 and 0.5 to achieve a balance between the richness of topological complementary information and node diversity. From Figure A2, we can observe that DELTA achieves optimal performance when is set to 2, which is consistent with our suggestion in the main text. We recommend setting between 1 and 2 to balance the richness of subgraph information while preserving the contribution of the central node in the K-hop subgraph to topological uncertainty.
C.3. Further Analysis
Figure A3 and Figure A4 respectively report the results of DELTA when varying GNN encoders on the complete set of six dataset combinations and the performance vs. runtime results on ACMv9Citationv1, DBLPv7ACMv9, and Citationv1DBLPv7. The results in Figure A3 are consistent with the observations in the main text, where TAGConv performs the best when replacing the edge-oriented graph subnetwork. Overall, although the performance when changing edge-oriented encoders remains strong, outperforming most baseline algorithms. This further demonstrates the effectiveness of the proposed DELTA framework. From Figure A4, we can also observe the same conclusions as in the main text: the proposed DELTA’s time cost is only one-fifth to one-sixth that of AGE, ANRMAB, and Dissimilarity, while it only takes about 10 to 20 seconds more than other baseline algorithms. Nevertheless, DELTA achieves the best performance.
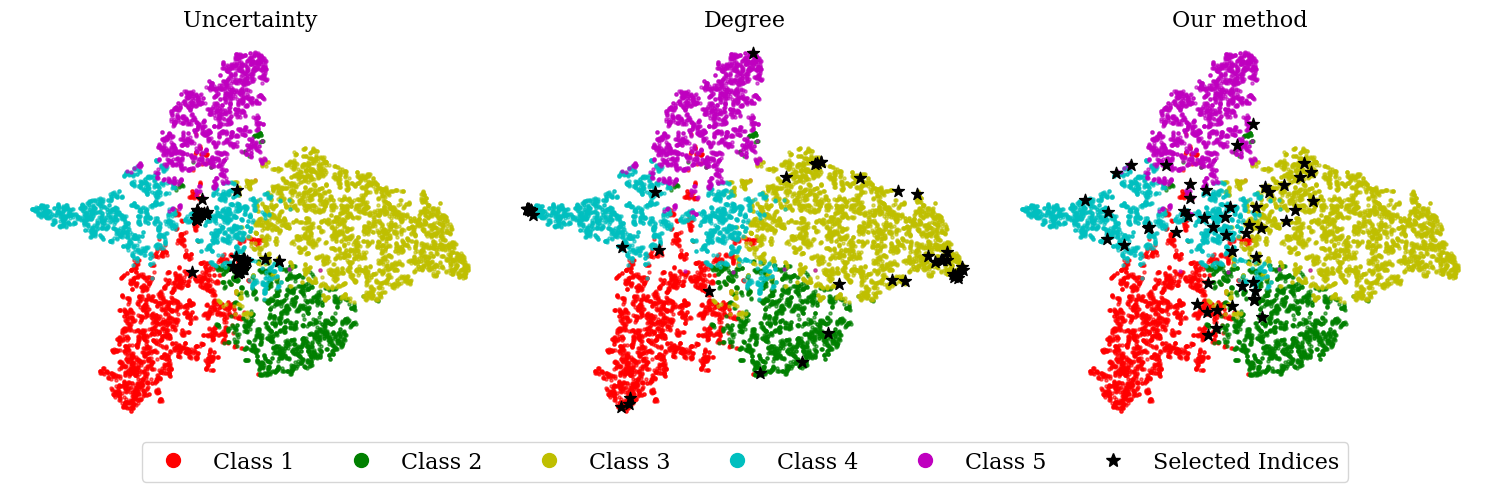
Figure A5 and Figure A6 respectively report the t-SNE visualization results of the proposed DELTA compared with Uncertainty and Degree centrality on ACMv9Citationv1 and DBLPv7ACMv9. From Figure A5 and Figure A6, we can observe the same conclusions as in the main text: DELTA achieves a more balanced and diverse selection of target graph nodes. In contrast, the nodes selected by Uncertainty and Degree centrality are concentrated in 1-2 categories, and this imbalanced node distribution significantly reduces the effectiveness of active learning. In comparison, DELTA’s more uniform selection qualitatively provides evidence for the superior performance achieved by the proposed DELTA.
Appendix D Computational complexity analysis
Assume denotes the average node number in the input graph, denotes the average edge number in the input graph, and is the hidden dimension. Calculating the K-hop subgraph has a time complexity of . Computing the K-hop subgraph for each node results in a total time complexity of . Averaging the logits for each subgraph node has a time complexity of . Calculating the softmax for logits and subgraph logits has a time complexity of .
Considering the above steps, the overall time complexity for the uncertainty computation process can be expressed as: