figure \cftpagenumbersofftable
Development of a Compton Imager Setup
Abstract
Hard X-ray photons with energies in the range of hundreds of keV typically undergo Compton scattering when they are incident on a detector. In this process, an incident photon deposits a fraction of its energy at the point of incidence and continues onward with a change in direction that depends on the amount of energy deposited. By using a pair of detectors to detect the point of incidence and the direction of the scattered photon, we can calculate the scattering direction and angle. The position of a source in the sky can be reconstructed using many Compton photon pairs from a source. We demonstrate this principle in the laboratory by using a pair of Cadmium Zinc Telluride detectors sensitive in the energy range of 20–200 keV. The laboratory setup consists of the two detectors placed perpendicular to each other in a lead-lined box. The detectors are read out by a custom-programmed Xilinx PYNQ FPGA board, and data is then transferred to a PC. The detectors are first calibrated using lines from , and sources. We irradiated the detectors with a collimated source and identified Compton scattering events for the 356 keV line. We run a Compton reconstruction algorithm and correctly infer the location of the source in the detector frame. This comprises a successful technology demonstration for a Compton imaging camera in the Hard X-ray regime. We present the details of our setup, the data acquisition process, and software algorithms, and showcase our results.
keywords:
X-ray imaging, Hard X-rays, CZT detectors, X-ray telescopes* Anuraag Arya, \linkablearya.a@iitb.ac.in
1 Introduction
High Energy photons in the energy range from hundreds of keV to tens of MeV typically undergo Compton Scattering in a detector — depositing a fraction of their energy at the interaction site, and creating a secondary photon, which may in turn be detected by the same or another detector [1, 2]. The scattered photon has a lower energy, and typically deposits its full energy in the detector via photoelectric interactions. The locations of the first and second interactions, and the energy deposits at both places, can be used to constrain the direction of the photon source. This concept is utilized for “Compton Imaging” [3, 4]. This technique forms the core of astrophysical missions starting with COMPTEL [5] to the upcoming COSI (Compton Spectrometer and Imager) [6]. However, past missions have typically focussed on the Gamma-ray band, and operated in the MeV range [7]. In this work, we demonstrate a hard X-ray Compton Imaging setup that operated in the hard X-ray energy range of hundreds of keV. We develop a setup using 5 mm thick Cadmium Zinc Telluride detectors in an orthogonal configuration. We irradiate the setup with radioactive sources and can successfully reconstruct the source position using observed data.
2 Experimental setup
Our experimental setup consists of three main components: the detectors (§2.1), power and readout electronics (§2.2), and the enclosure (§2.3).
2.1 Detectors
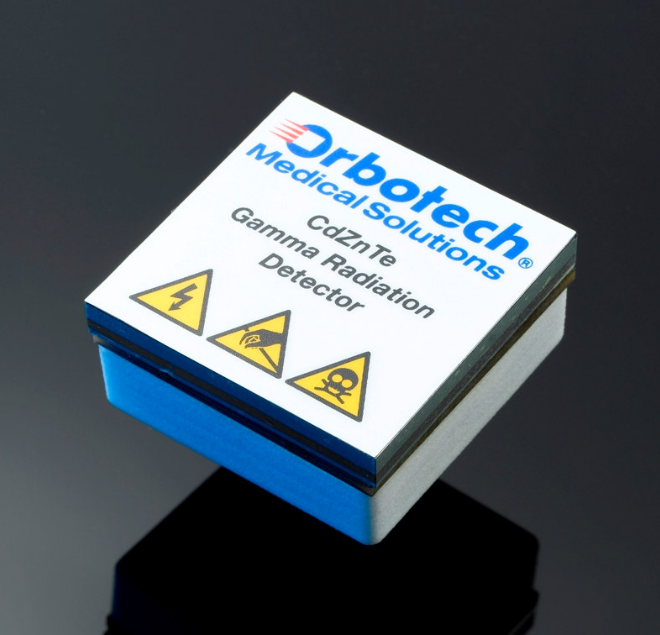
Our setup is based on 5 mm thick CZT detectors (Figure 1) manufactured by GE Medical (formerly Orbotech Medical Solutions). The detectors consist of a 1616 grid of square pixels with a total size of 39 mm on a side. The average detector composition is Cd0.9Zn0.1Te1.0. They operate in a nominal energy range of 20—200 keV, with an energy resolution of 10–12% at 60 keV. The typical band gap for room temperature for this composition is 1.57 eV [8], and as per the vendor data sheet, the average electron-hole pair creation energy for these detectors is 4.43 eV.
The connections to these detectors are low voltage power, a high voltage negative bias (we use V), and communication lines. The detector module includes circuitry to detect on-board triggers, amplify them with a charge-sensitive pre-amplifier, and digitize the output. The digital output is communicated via Low Voltage Differential Signaling (LVDS) format on Serial Peripheral Interface (SPI) lines.
Such detectors have been used in the Cadmium Zinc Telluride Imager on board AstroSat, and further details can be found in Bhalerao et al. (2017) [9].
2.2 Electronics
The electronics have three parts: a detector board, the PYNQ board, and standard laboratory equipment like power supplies and a PC (Figure 2).
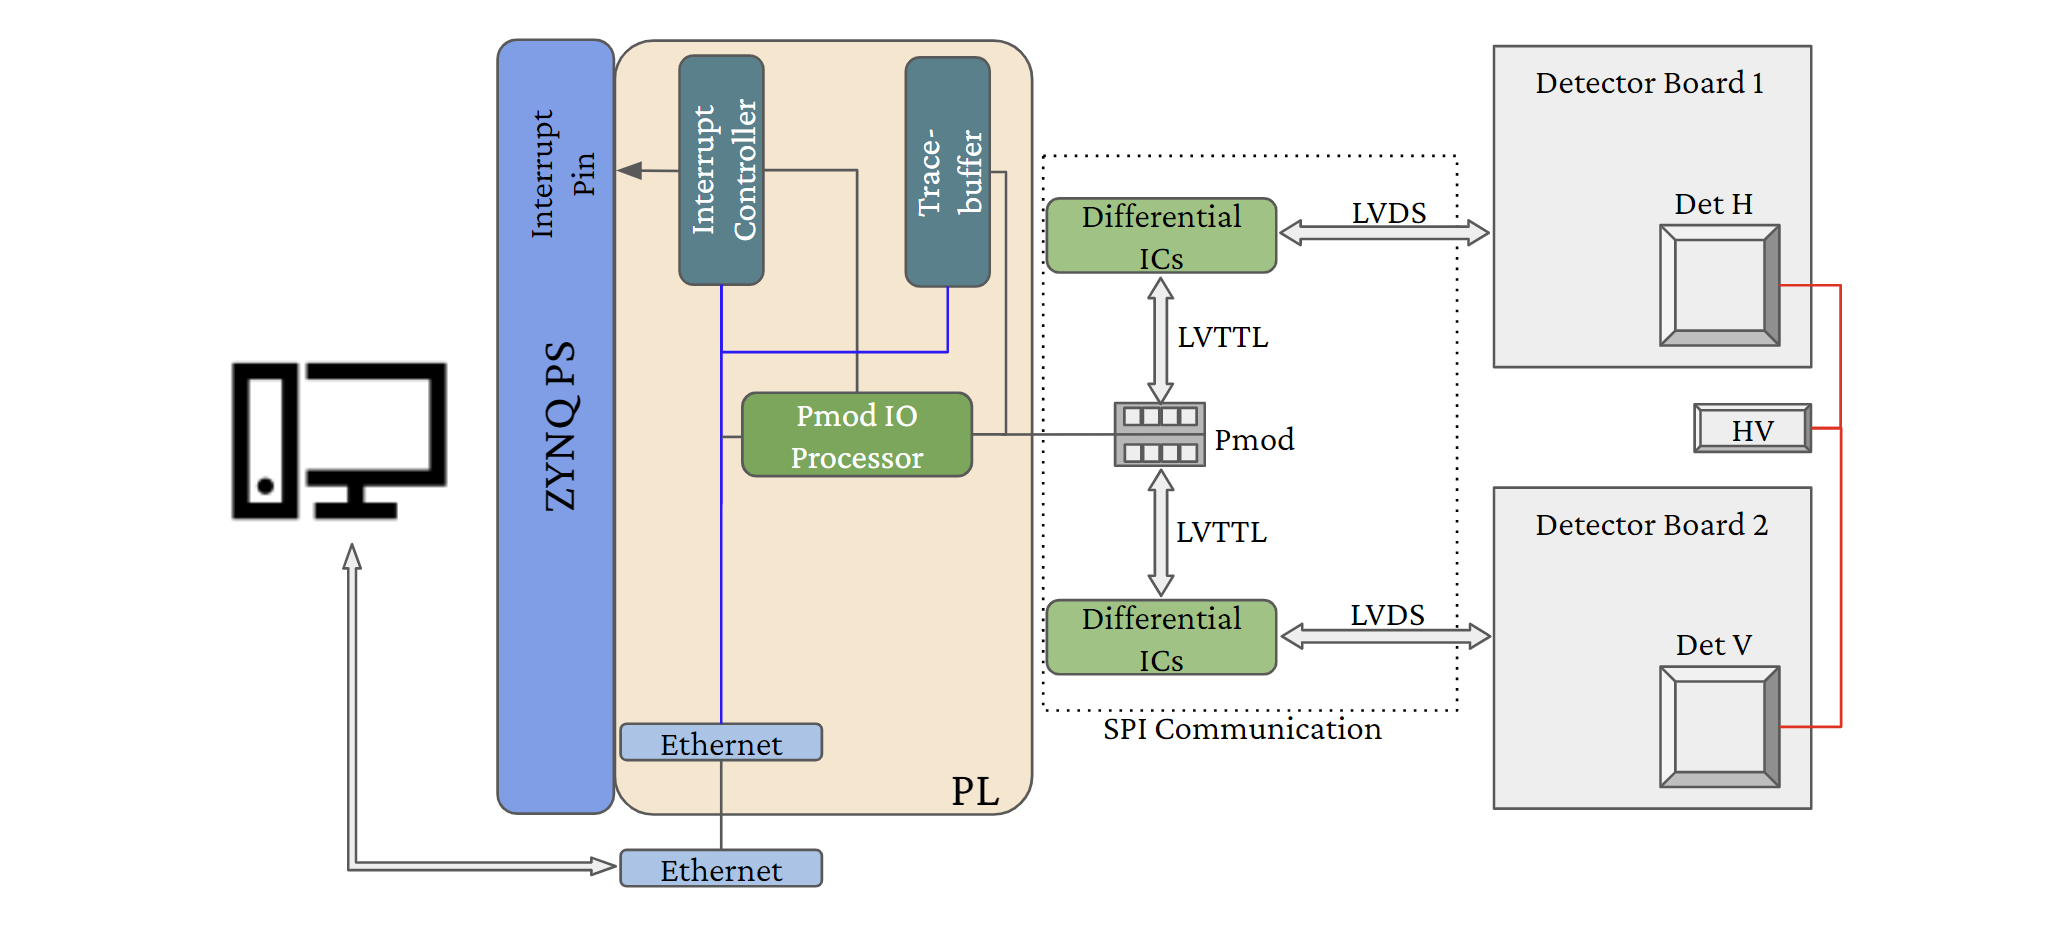


The detectors are mounted on the detector board, which the appropriate mounting pins for the high voltage (HV) and low voltage (LV) contacts of the detector, and connects these to appropriate external lines. The board also accepts 5 V input power, and converts it to the required 3.3 V and 1.8 V levels for the detector module.
Data acquisition is handled by a Xilinx FPGA PYNQ-Z2 board111https://www.amd.com/en/corporate/university-program/aup-boards/pynq-z2.html.. It is a Zynq 7000 development board with ZYNQ XC7Z020-1CLG400C SoC (System on Chip). It has dual core ARM Cortex-A9 processors clocked at 650 MHz connected to various peripherals such as Ethernet, SDIO, UART, etc, as well as an Artix-7 equivalent FPGA. The SoC thus has two distinct hardware parts: the Processing System (PS) consisting of the ARM processors and its peripherals, and the Programmable Logic (PL). All the codes (C/C++ in standalone mode, or the Embedded Linux) run on the PS, while all the Custom IPs are created on the PL. The board also has 512 MB DDR3 memory with a 16-bit bus operating at 1050 Megabits per second. This is the main lower-speed buffer for all the data. Embedded Linux is installed on an SD card which accesses the RAM via the AXI–DMA (Advanced Extensible Interface, Direct Memory Access) python code.
We use small add-on circuits that convert the LVDS signal from the detector board into the Low Voltage Transistor-Transistor Logic (LVTTL) levels used by the PYNQ board. A 10 MHz clock signal generated on the PYNQ board is supplied to the detector board for clocking the detector. Detector data are read in the native 26-bit format as shown in Figure 3 (top), which requires 7.5 s time for each event. This is the native time resolution of our setup in the low event rate case (count rate 13,000 events/sec). We add a 32-bit integer timestamp that counts the number of clock ticks that have elapsed since power-on. Our experiment does not require accurate absolute time, hence this suffices our requirements. This clock loops over in about 7 minutes, but this is fixed in post-processing of data by detecting the wrap-around and adding an appropriate offset.
We split and pad the detector data and add the timestamp to save it in a 64-bit data format (Figure 3, bottom) for storing relevant photon information: the detector PHA222PHA or Pulse Height Amplitude is the digital output corresponding to the signal measured by the circuit within the detector. PHA is measured in “channels”, and is linearly related to the energy deposited in the pixel (§3.2)., pixel number (PixID), detector number (DetID), and timestamp (number of clock cycles).
We run Python Jupyter notebooks in the Embedded Linux on the SoC PS, and process the data with our custom codes (§3.1). For archival and further processing, data are read out from the PYNQ board over ethernet by a laboratory computer. The PYNQ board can be powered via a USB cable from the computer, or from a table–top power supply. Lastly, the high voltage required by the detectors was supplied from a laboratory power supply.
2.3 Enclosure
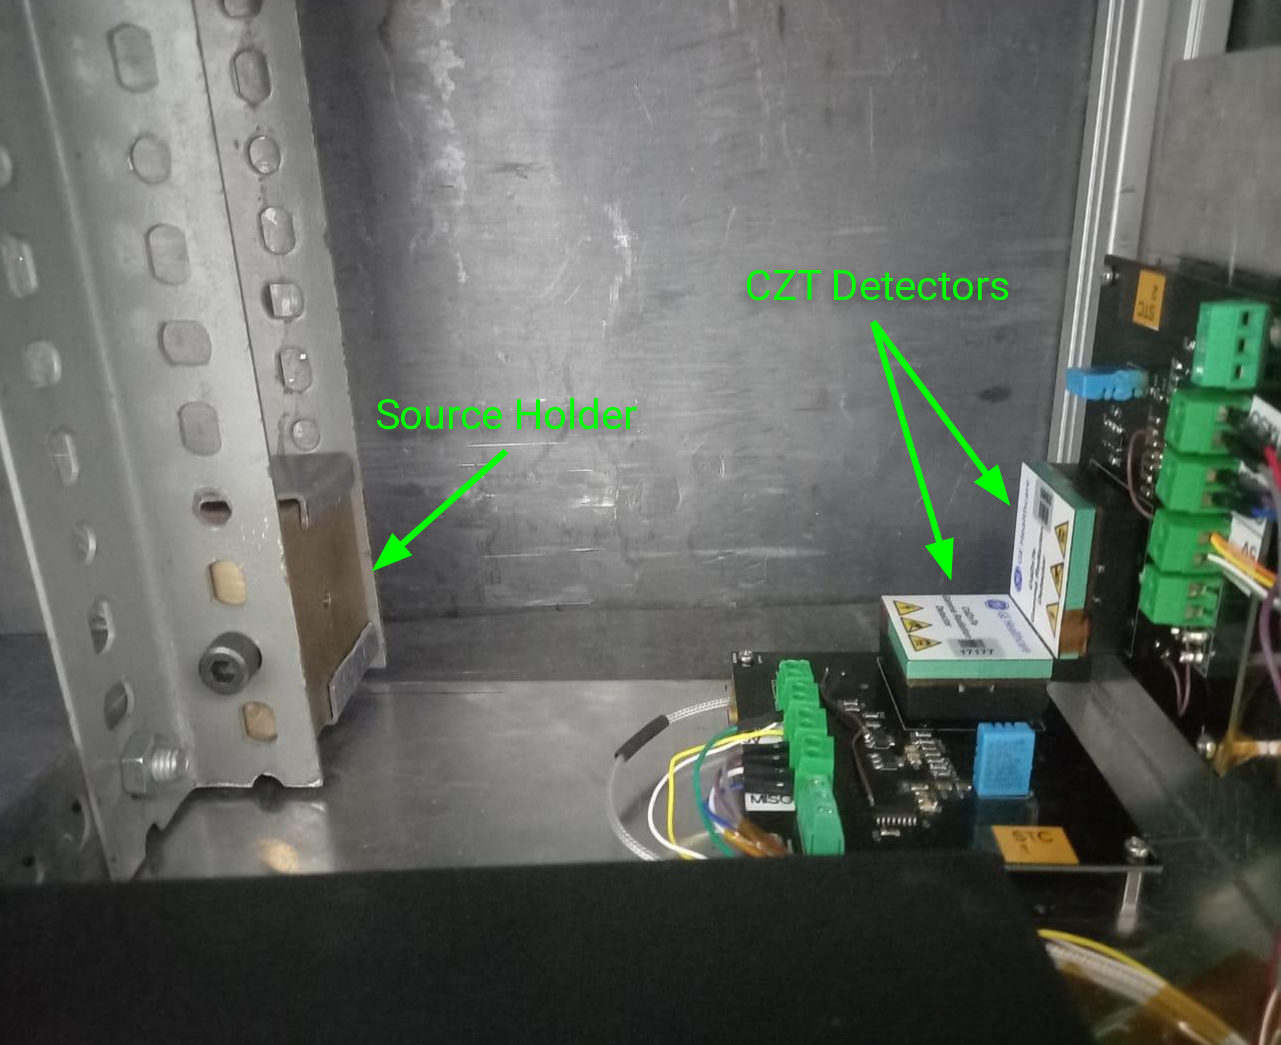
The detectors are sensitive to optical photons which can create noise events in edge pixels of the detector by creating electron-hole pairs in CZT, hence the entire setup has to be light-tight. As a first step, we do not put any indicator LEDs on any of the circuit boards. Next, we mount the detectors and the radioactive source in a 30 cm 30 cm 60 cm aluminium box, which is further covered with a black cloth. The box is lined with 5 mm lead sheets for safety of the operator. The detectors are mounted at right angles to each other, with a vertical detector (“Det V”, detector ID 21065) serving as the scatterer and a horizontal detector (“Det H”, detector ID 17177) serving as the absorber of scattered radiation (Figure 4).
Radioactive sources are enclosed in a thick brass shield with a cylindrical hole of 5 mm diameter and mm depth for collimating the radiation. The source holder can be mounted at different heights so that photons are incident on Det V at varied angles. The collimation is sufficient to ensure that direct incidence of photons on Det H is small. Exact source location is measured mechanically to validate the source positions reconstructed from data.
3 Data Acquisition
3.1 Detector Initialisation
Like most electronic detectors, CZT detectors have lower noise when cooled. However, since it was not practical for us to cool the entire setup including the enclosure, we conducted our experiments at room temperature. This meant that we had more noise at low energies, and a higher number of noisy pixels in the detectors. As will be discussed in §3.2, we needed the ability to detect 31 keV photons. Hence, we set the Lower Level Discriminator (LLD, also known as threshold) for both detectors to 20 keV. This resulted in an acceptable level of noise in the detector even at room temperature.
Next, we disabled the noisy pixels in each detector. This was done iteratively by taking short acquisitions of background data and disabling noisiest pixels till a small subset of pixels no longer dominated the count rate. In most data acquisition “runs”, typically less than ten pixels were disabled. The typical background count rate in each detector was finally around 8–10 . If the detectors are cooled, this rate can drop down further.
The highest PHA channel for the detector is used to denote any events with energy greater than or equal to the upper energy scale limit for the detector. Since exact energy information is not available for such events, we ignore them from our analysis.
3.2 Gain-offset calibration
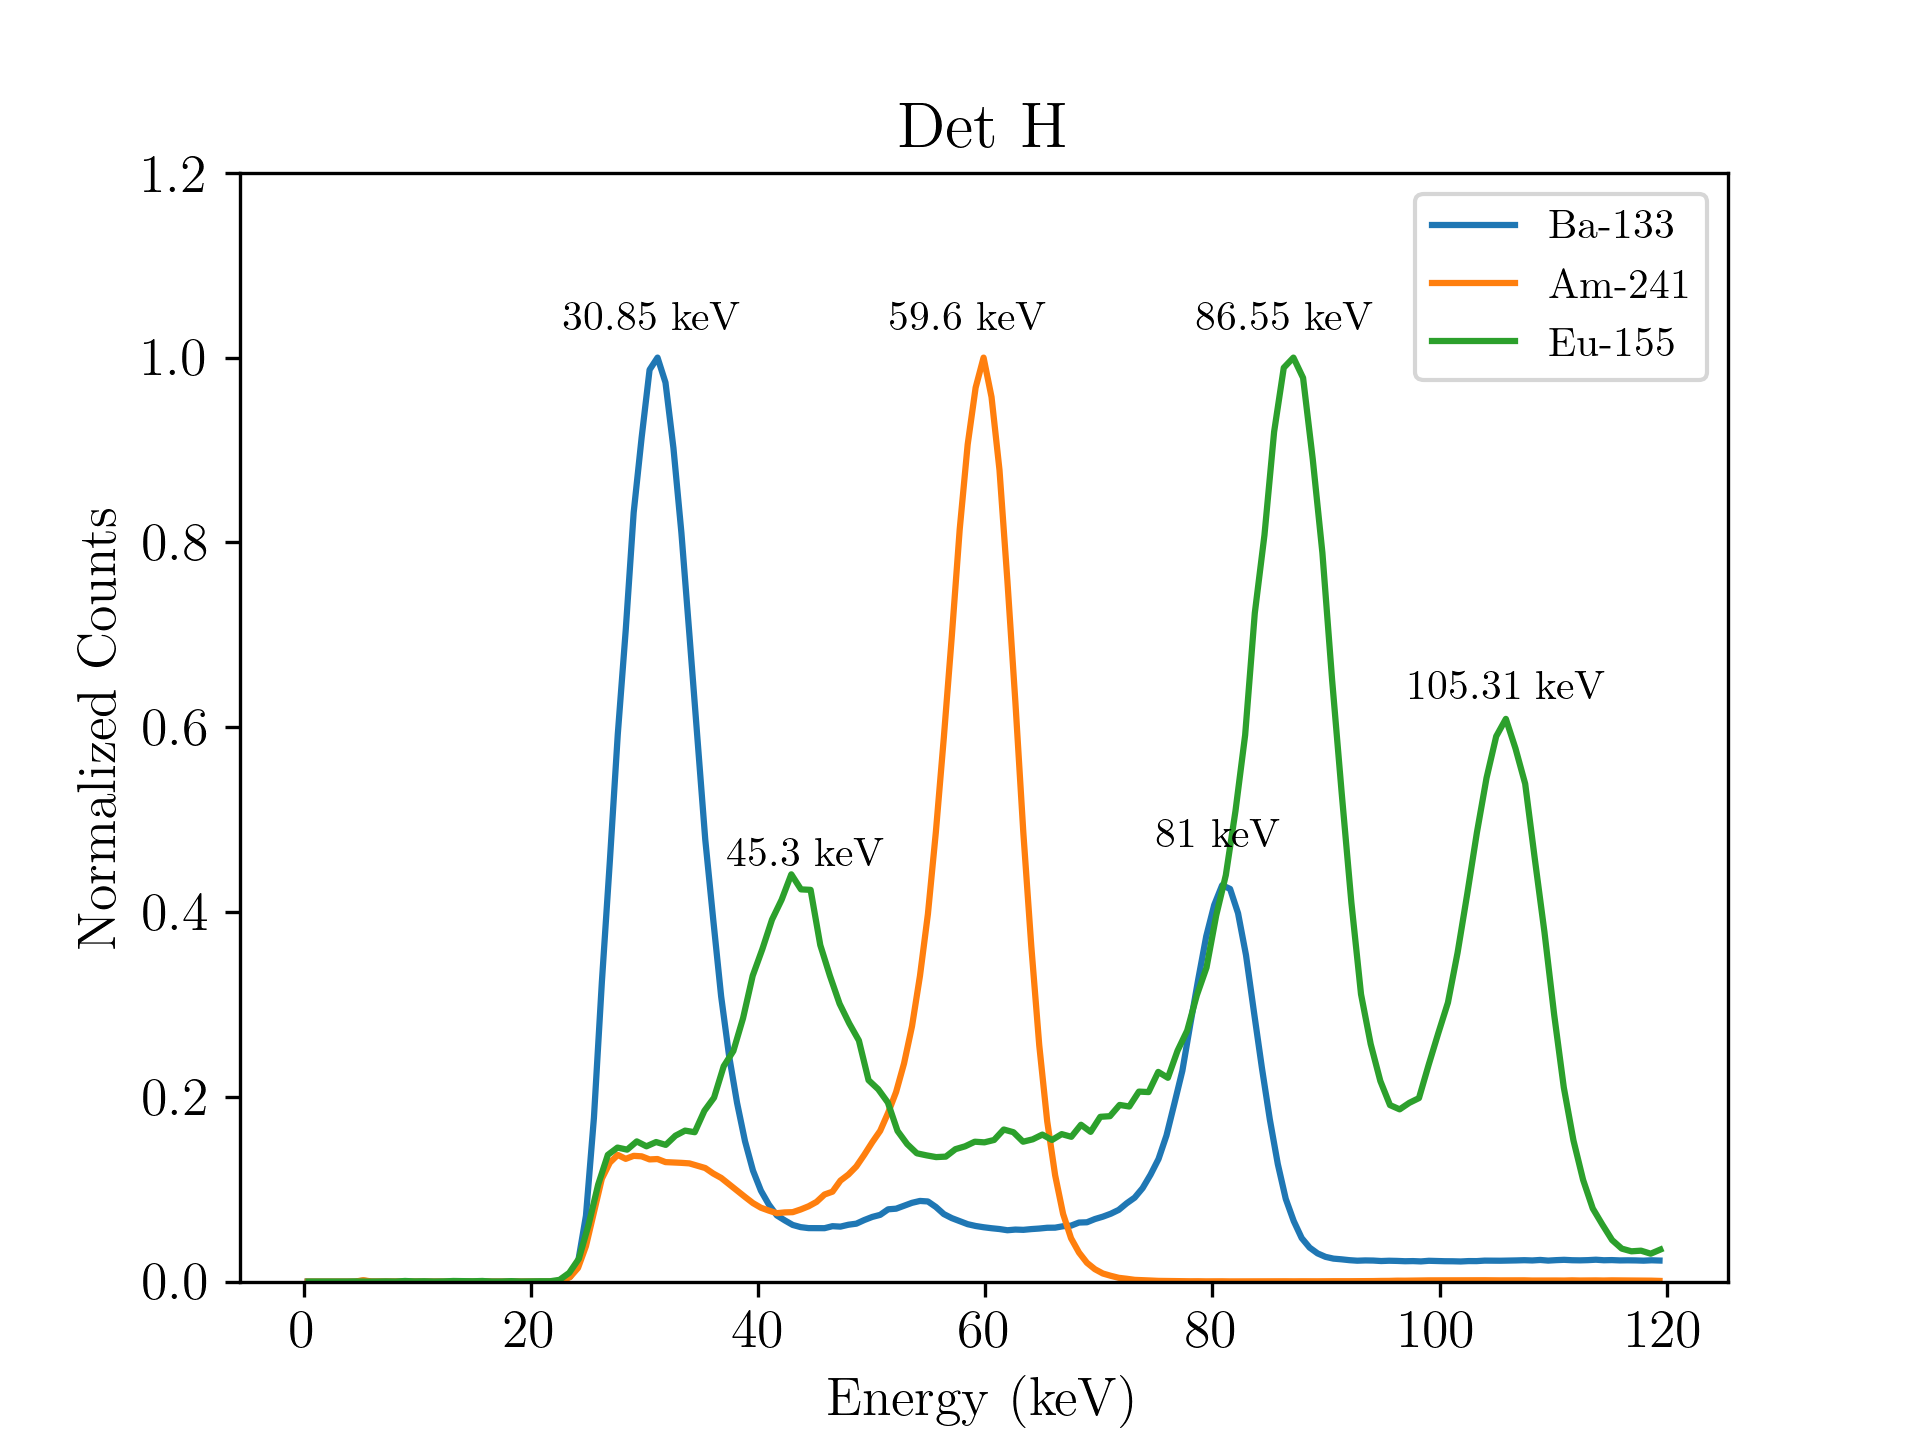
Lab measurements show that the PHA measured by the detector is linearly related to the energy () of the incident photon for these detectors. We model this as where is the detector gain, and is the offset in units of energy. The values of and depend on operating temperature, high voltage, and vary from pixel to pixel, and need to be determined experimentally. We irradiate the individual detectors sequentially with , , , which have multiple lines in the 20–200 keV range of interest (Figure 5). The reference information about line energies was obtained from Kinsey et al. (1996)[11] via the online interface333Available isotope–wise at https://www.nndc.bnl.gov/nudat3/decaysearchdirect.jsp?nuc=133Ba&unc=NDS. Despite setting low values of the LLD, we find that the 31 keV line complex is contaminated by a sharp cut as well as electronic noise at low energies. Hence, we exclude this line from gain-offset calculations. We use pixel–wise spectra for each source, measure the PHA of the peak, and then calculate gain and offset values. These values are then tabulated and used in all subsequent analyses. To calculate the energy resolution of the detectors, we irradiate the detectors with source on them, and create an average detector spectrum (Figure 5) by correcting each pixel data with its own gain and offset. We measure an energy resolution of at 59.6 keV at room temperature for both detectors, on par with values obtained in AstroSat CZTI [9].
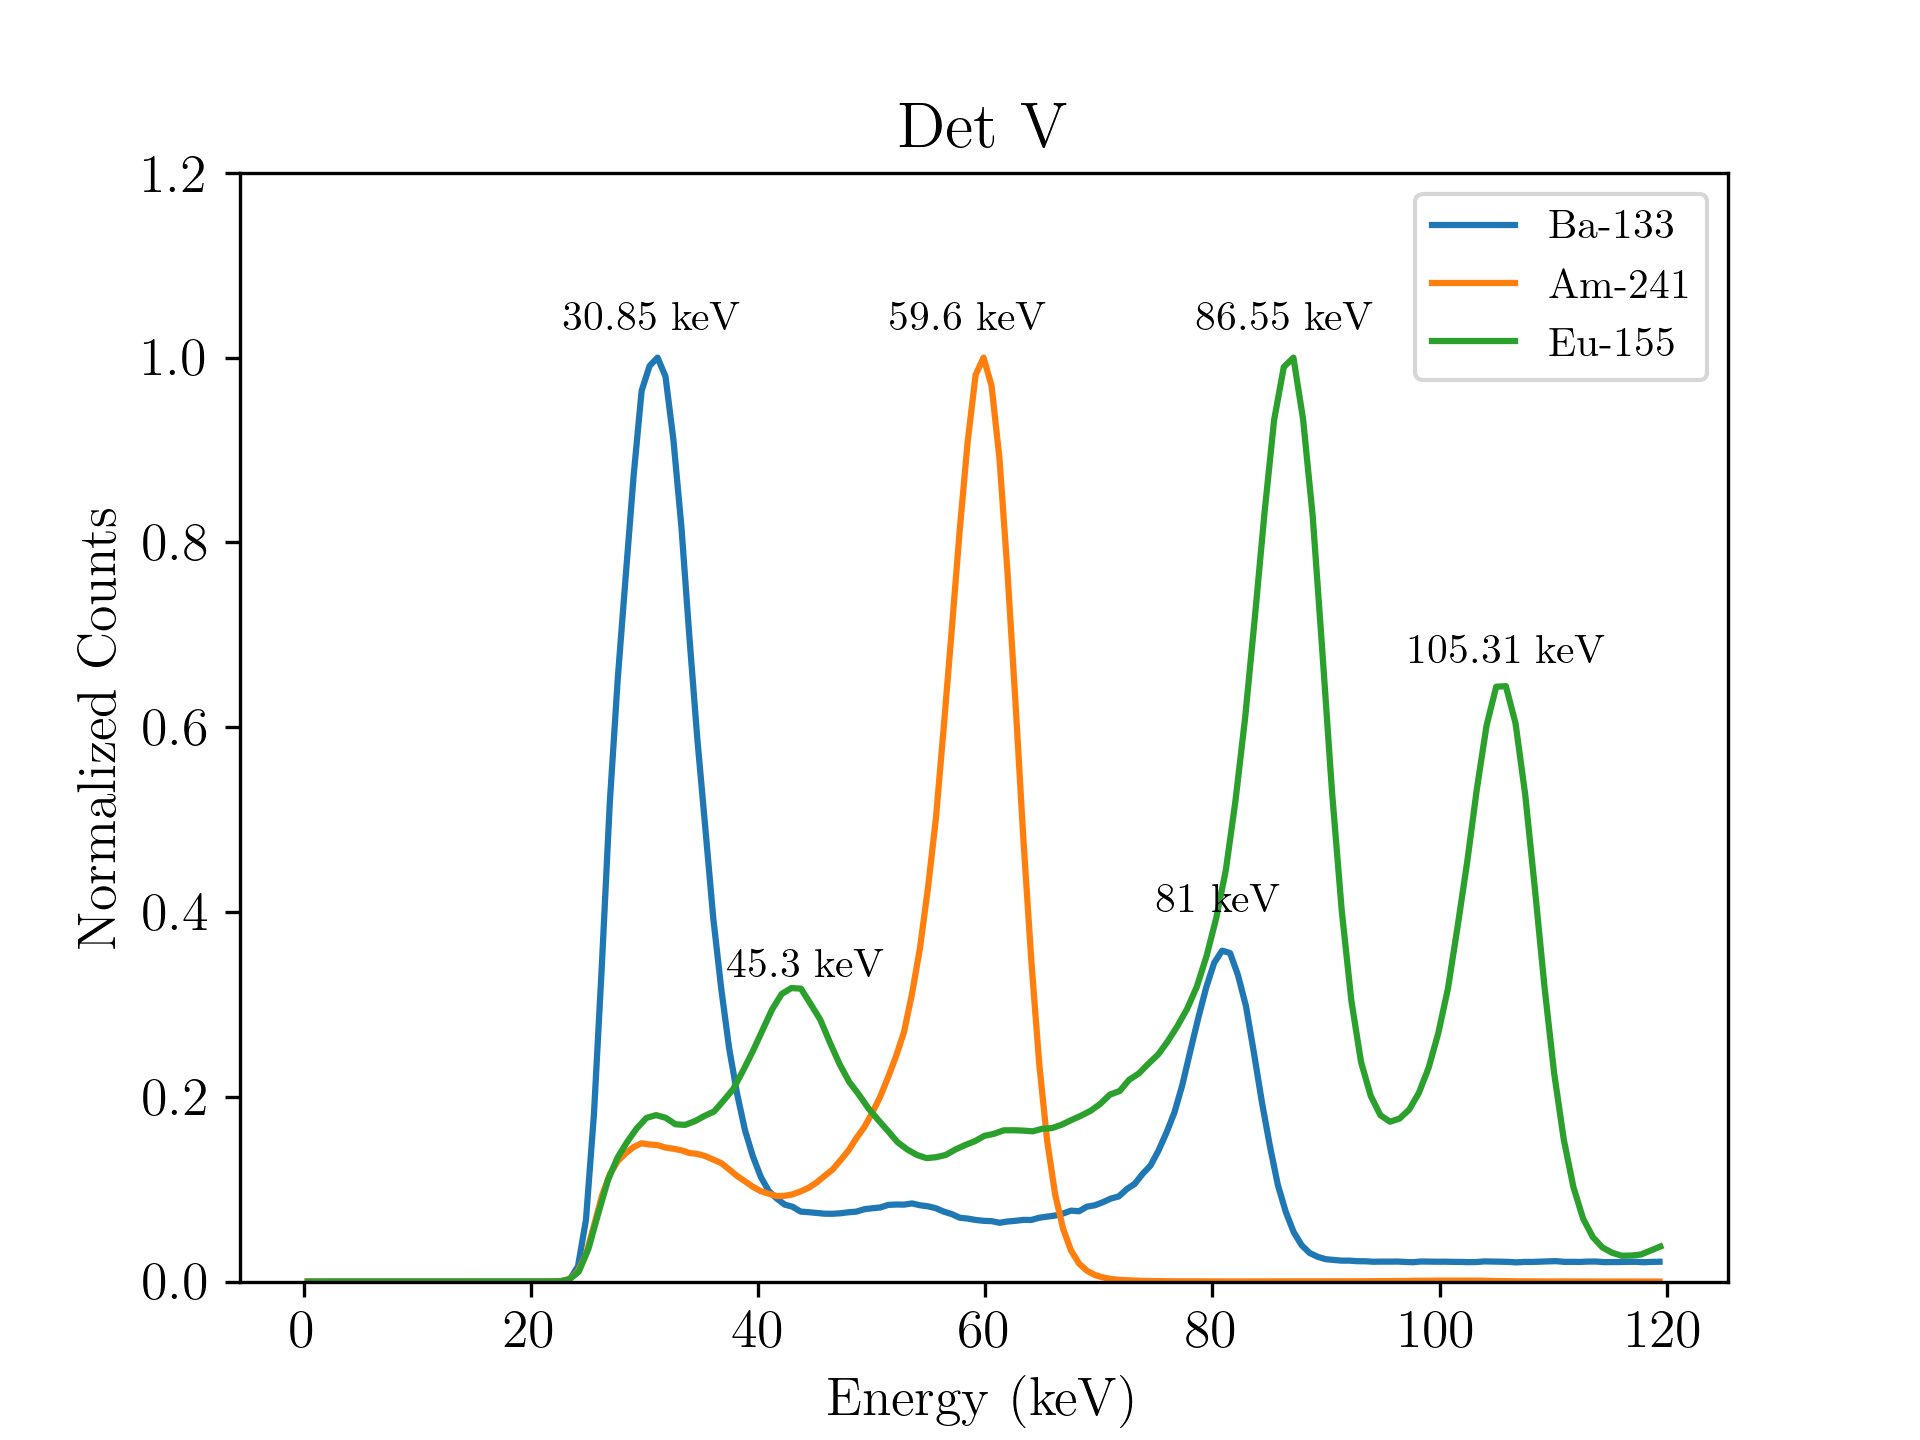
3.3 Data collection at various source positions
Final experimental data sets were obtained by placing the source at four different locations in the enclosure. has a prominent radioactive decay lines at 356 keV and 81 keV, with decay yields of 62% and 34% respectively. The source also has weaker lines at 276 keV, 303 keV, 384 keV, etc. Of all these, the 356 keV is most suitable for our analysis due its high yield, relatively high probability of Compton scattering as compared to photoelectric absorption, and because the energy deposited in both the scatterer and absorber is likely to be within our detector energy range. The 2.5 Ci source strength corresponds to about 9.25 disintegrations per second, of which a much smaller fraction exits through the collimator. We typically detect 35–65 on our detector. Note that there are several factors to consider in this number. It includes the 31 and 81 keV lines from Ba. Photons of 356 keV which are directly absorbed in the detector get discarded as discussed in §3.1. However, if these photons are Compton scattered by the detector and the energy deposit is in the 20–200 keV range, such events will be registered in the scatterer (Det V). The scattered photons head in random directions, and a fraction of them are incident on the absorber (Det H). If the energy of the scattered photon is also in the 20- 200 keV range, then these register as events in Det H.
The final count rates were typically around 35–65 in Det V depending on the source position, and around 15 in Det H respectively. This includes background rates of 8–10 in each detector. We find that a few detector pixels occasionally become noisy during the observations, increasing the count rates to as much as few hundred counts per second. These events are stored along with the data, but discard all data from such pixels in post-processing. In our test runs, we typically acquired data for 4–5 hours to get sufficient statistics for analysis.
4 Compton Event Reconstruction
There are various methods to infer the source position and other characteristics in a Compton camera starting from Simple Back–Projection of event circles onto the sky to iterative imaging reconstruction approaches like list-mode likelihood image reconstruction algorithm (LM-ML-EM) and the Maximum Entropy Method (MEM) [12, 13]. Our focus in this work is the demonstration of a Compton camera in sub–MeV range, hence in our analysis we stick to the straight forward back–projection method, which we discuss in this section. We discuss some of the limitations for this in §4.4.
4.1 Event circles and source position
Consider a photon incident on Det V at a position , where it undergoes Compton scattering in Det V, depositing energy at the point of incidence (Figure 6, top). The scattered photon lands on Det H at position and is fully absorbed, depositing its entire energy at that position. One can calculate the scattering angle by applying energy and momentum conservation, leading to the well-known Compton equation:
| (1) |
Combining this with the scattering positions and , we can constrain the source location to a cone (Figure 6, top). The intersection of this cone with a large spherical surface (the “sky”) centred on the detector gives a circle known as the Event Circle. The intersection of circles created by multiple events gives us the location of the source in the sky (Figure 6, lower left).
In practice, the event circles have finite widths, due to uncertainties in measurements. We account for these by modeling the event circle as a Gaussian band on the sky.
The first key factor is the “energy uncertainty” () stemming from the finite energy resolution of the detector, given by the following equation [12]:
| (2) |
The second key factor is the positional uncertainty () which arises from the 2.46 mm pixel size, which is not negligible as compared to the few cm length that the scattered photon travels: resulting in an uncertainty in the cone axis . For this calculation, we use the average uncertainty corresponding to a pair of pixels near the center of the horizontal and vertical detectors, (one-sigma). For each photon, we calculate the net uncertainty () by adding these terms in quadrature. The event circle is then constructed as a gaussian with standard deviation equal to , and truncated at .


4.2 Compton Event Selection
Our detector timing resolution is 0.1 s, while the light travel time for a scattered photon between the two detectors is sub-nanosecond. Hence the simple criterion for selecting Compton events is that photons should have the same timestamp in both the detectors. We note that our codes on the PYNQ board PL run in parallel acquiring data from both detectors simultaneously, thereby ensuring that such photon pairs would indeed get the same timestamp.
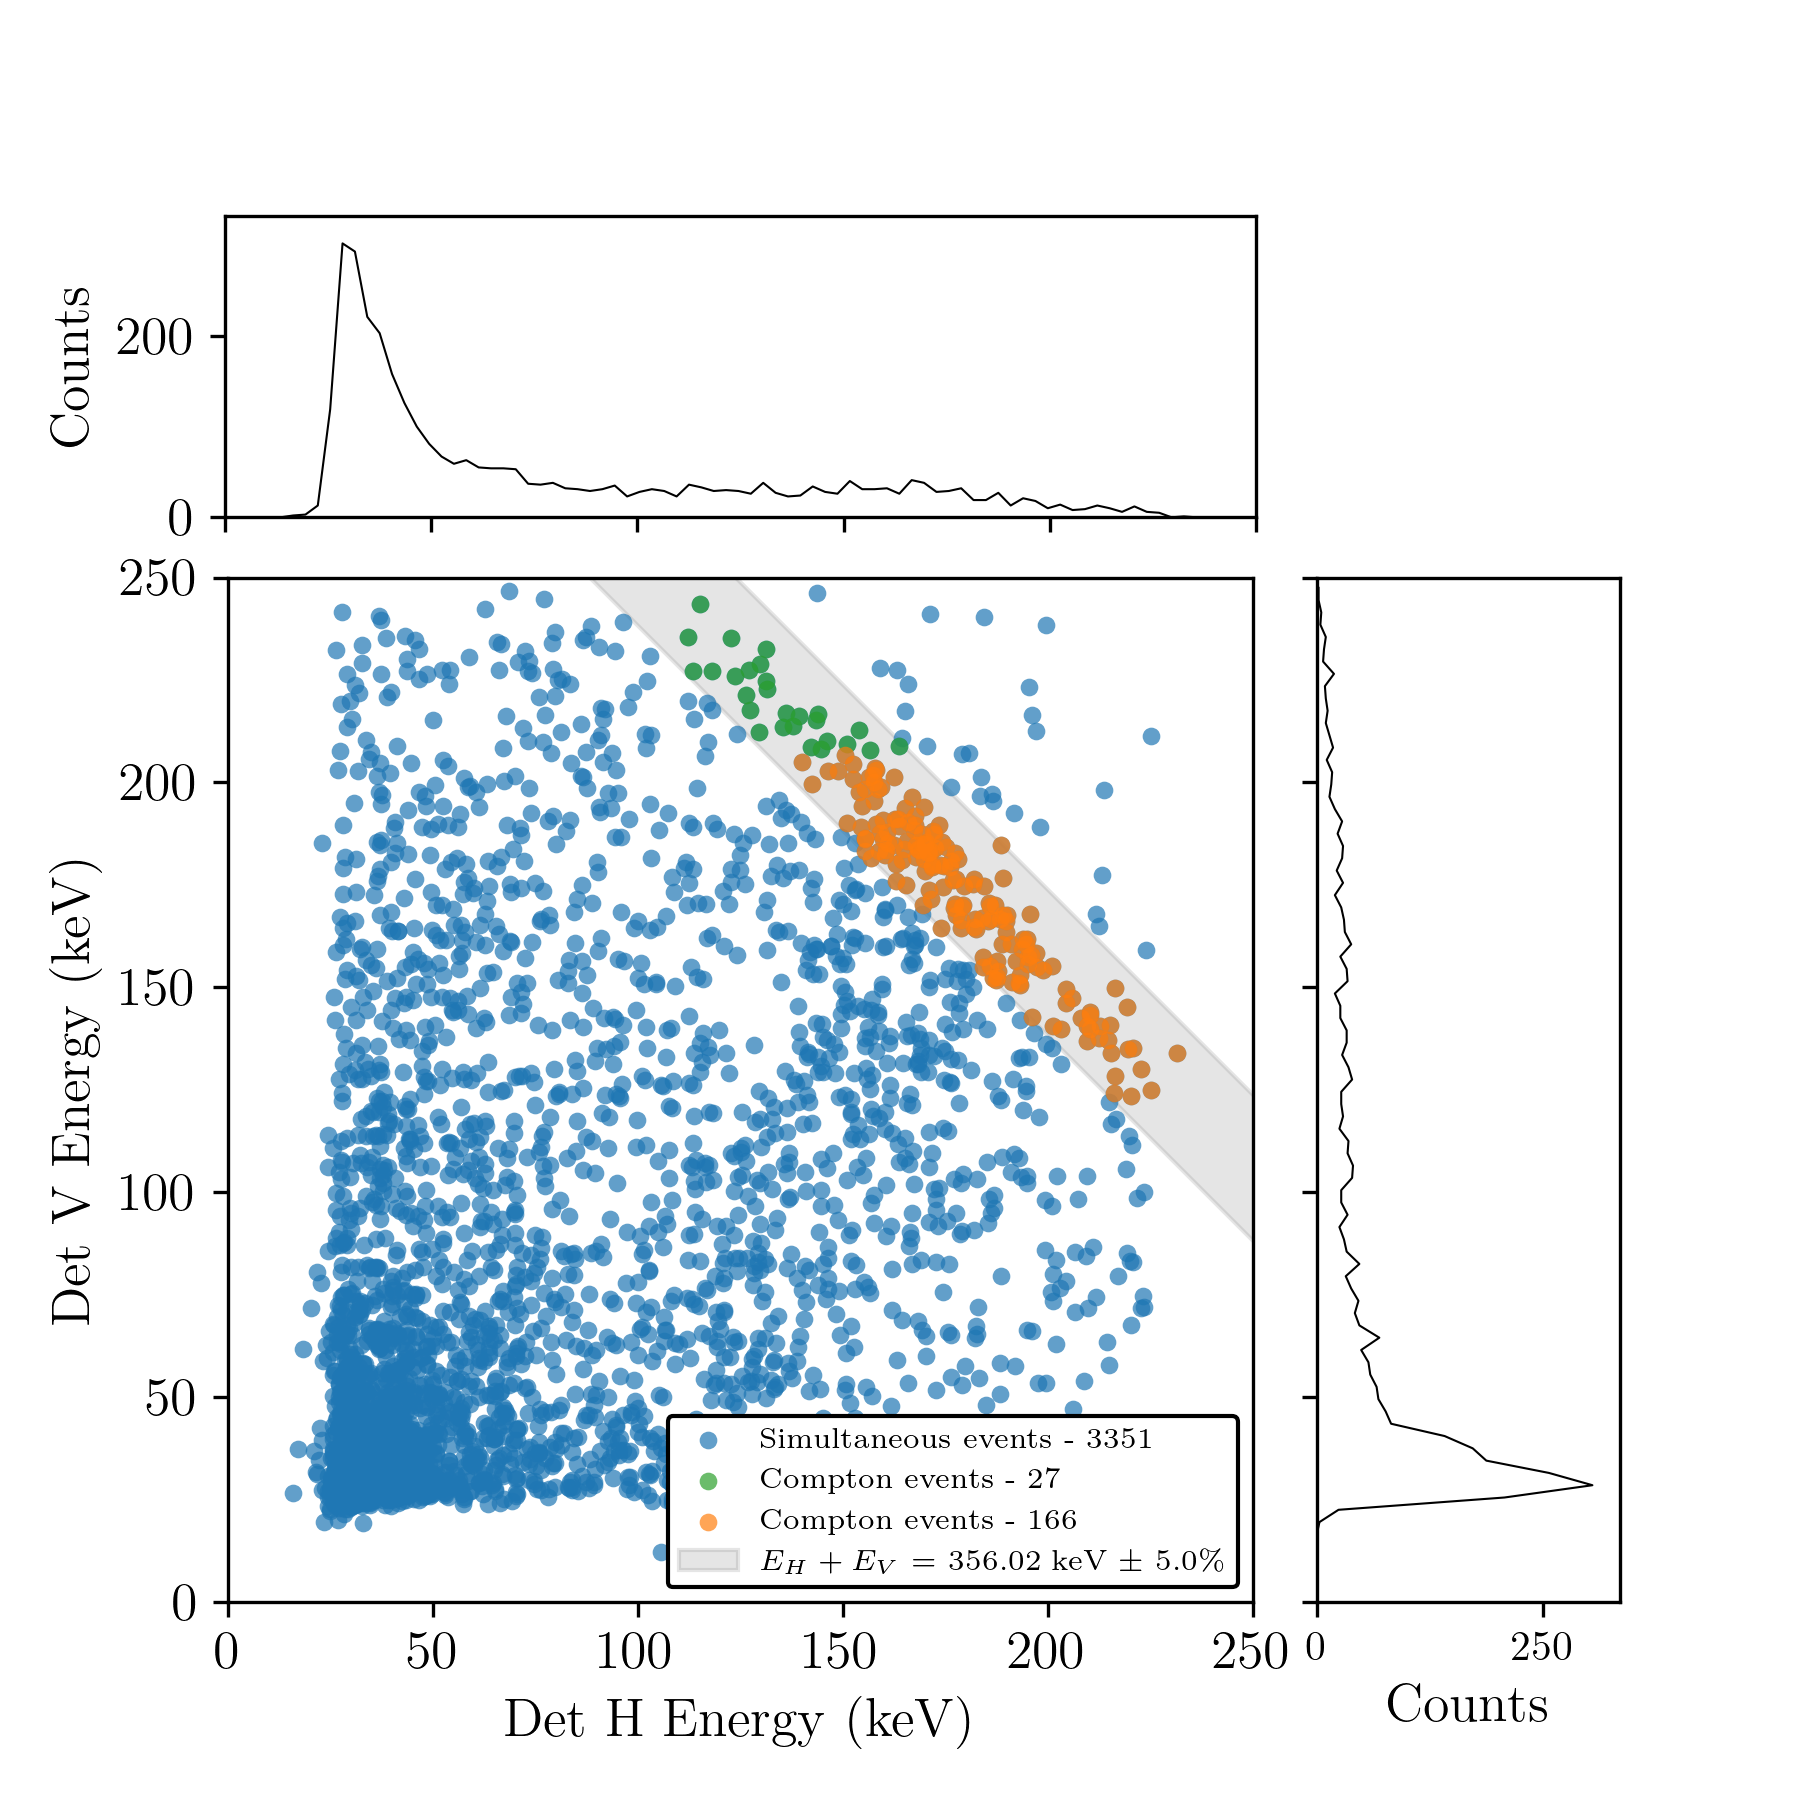
All such event pairs from one of our data sets are shown in Figure 7. The histograms on the sides show the spectra for such events in the individual detectors. We see that the individual detector spectra show a peak at low energies, consistent with being dominated by electronic noise.
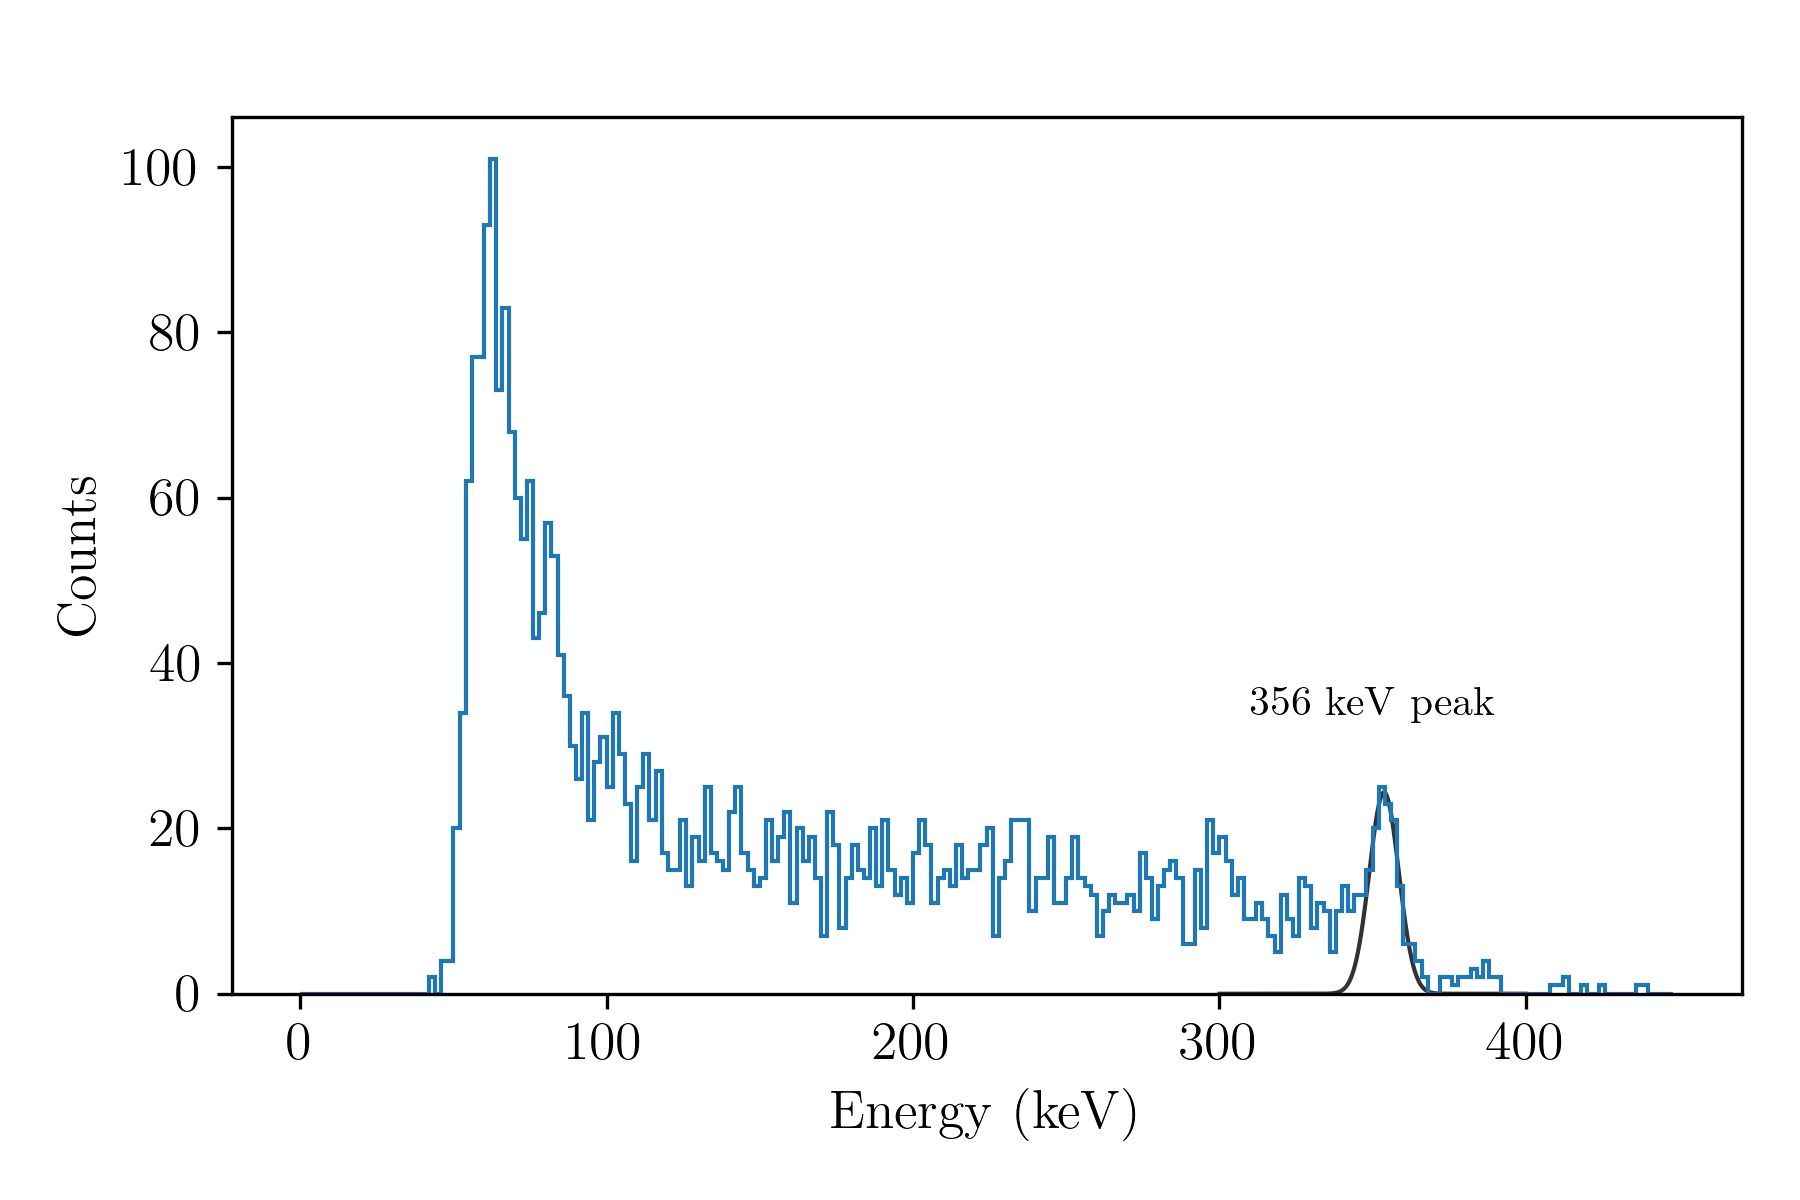
Since our background noise is relatively higher, we need another filter to limit our data to true Compton event pairs. We expect that the source photons undergoing Compton scattering must all be from the 356 keV decay line. By constructing a spectrum of the total deposited energy (), we can detect the 356 keV line (Figure 8). We see a prominent drop on the high energy side of the line, indicating an absence of higher energy photons from the source. Fitting the line profile with a Gaussian, we measure an energy resolution of 3.2% (FWHM). As a cross-check, we divided the event data into two halves, and measured the line energy from both. We find that the measurements agree to better than 0.1 keV. To select photons from this line for our analysis, we apply a conservative filter, selecting all photon pairs where the total energy is within of the line energy: keV.
The source is collimated such that photons should be incident on Det V. However the collimation is not perfect and some photons may be incident on Det H. There is no fool–proof way to determine the scatterer and absorber for a given Compton photon pair at our time resolution. Instead, we use the concept of the Compton edge: the maximum energy that can be deposited in a scatterer for a source photon of a given energy [14, Equation 20]. For 356 keV photons from , this corresponds to 206 keV. Hence, if we find a Compton photon pair where keV, we conclude that the photon must have been scattered from Det H and absorbed in Det V. Such events are shown as green dots in Figure 8, while orange dots show events where we have considered Det V to be the scatterer.
4.3 Results
| Serial no. | Polar Angle (, deg) | Azimuthal Angle (, deg) |
|---|---|---|
| 1 | ∘ | 173∘ |
| 2 | 20∘ | 184∘ |
| 3 | 38∘ | 184∘ |
| 4 | 24∘ | 190∘ |
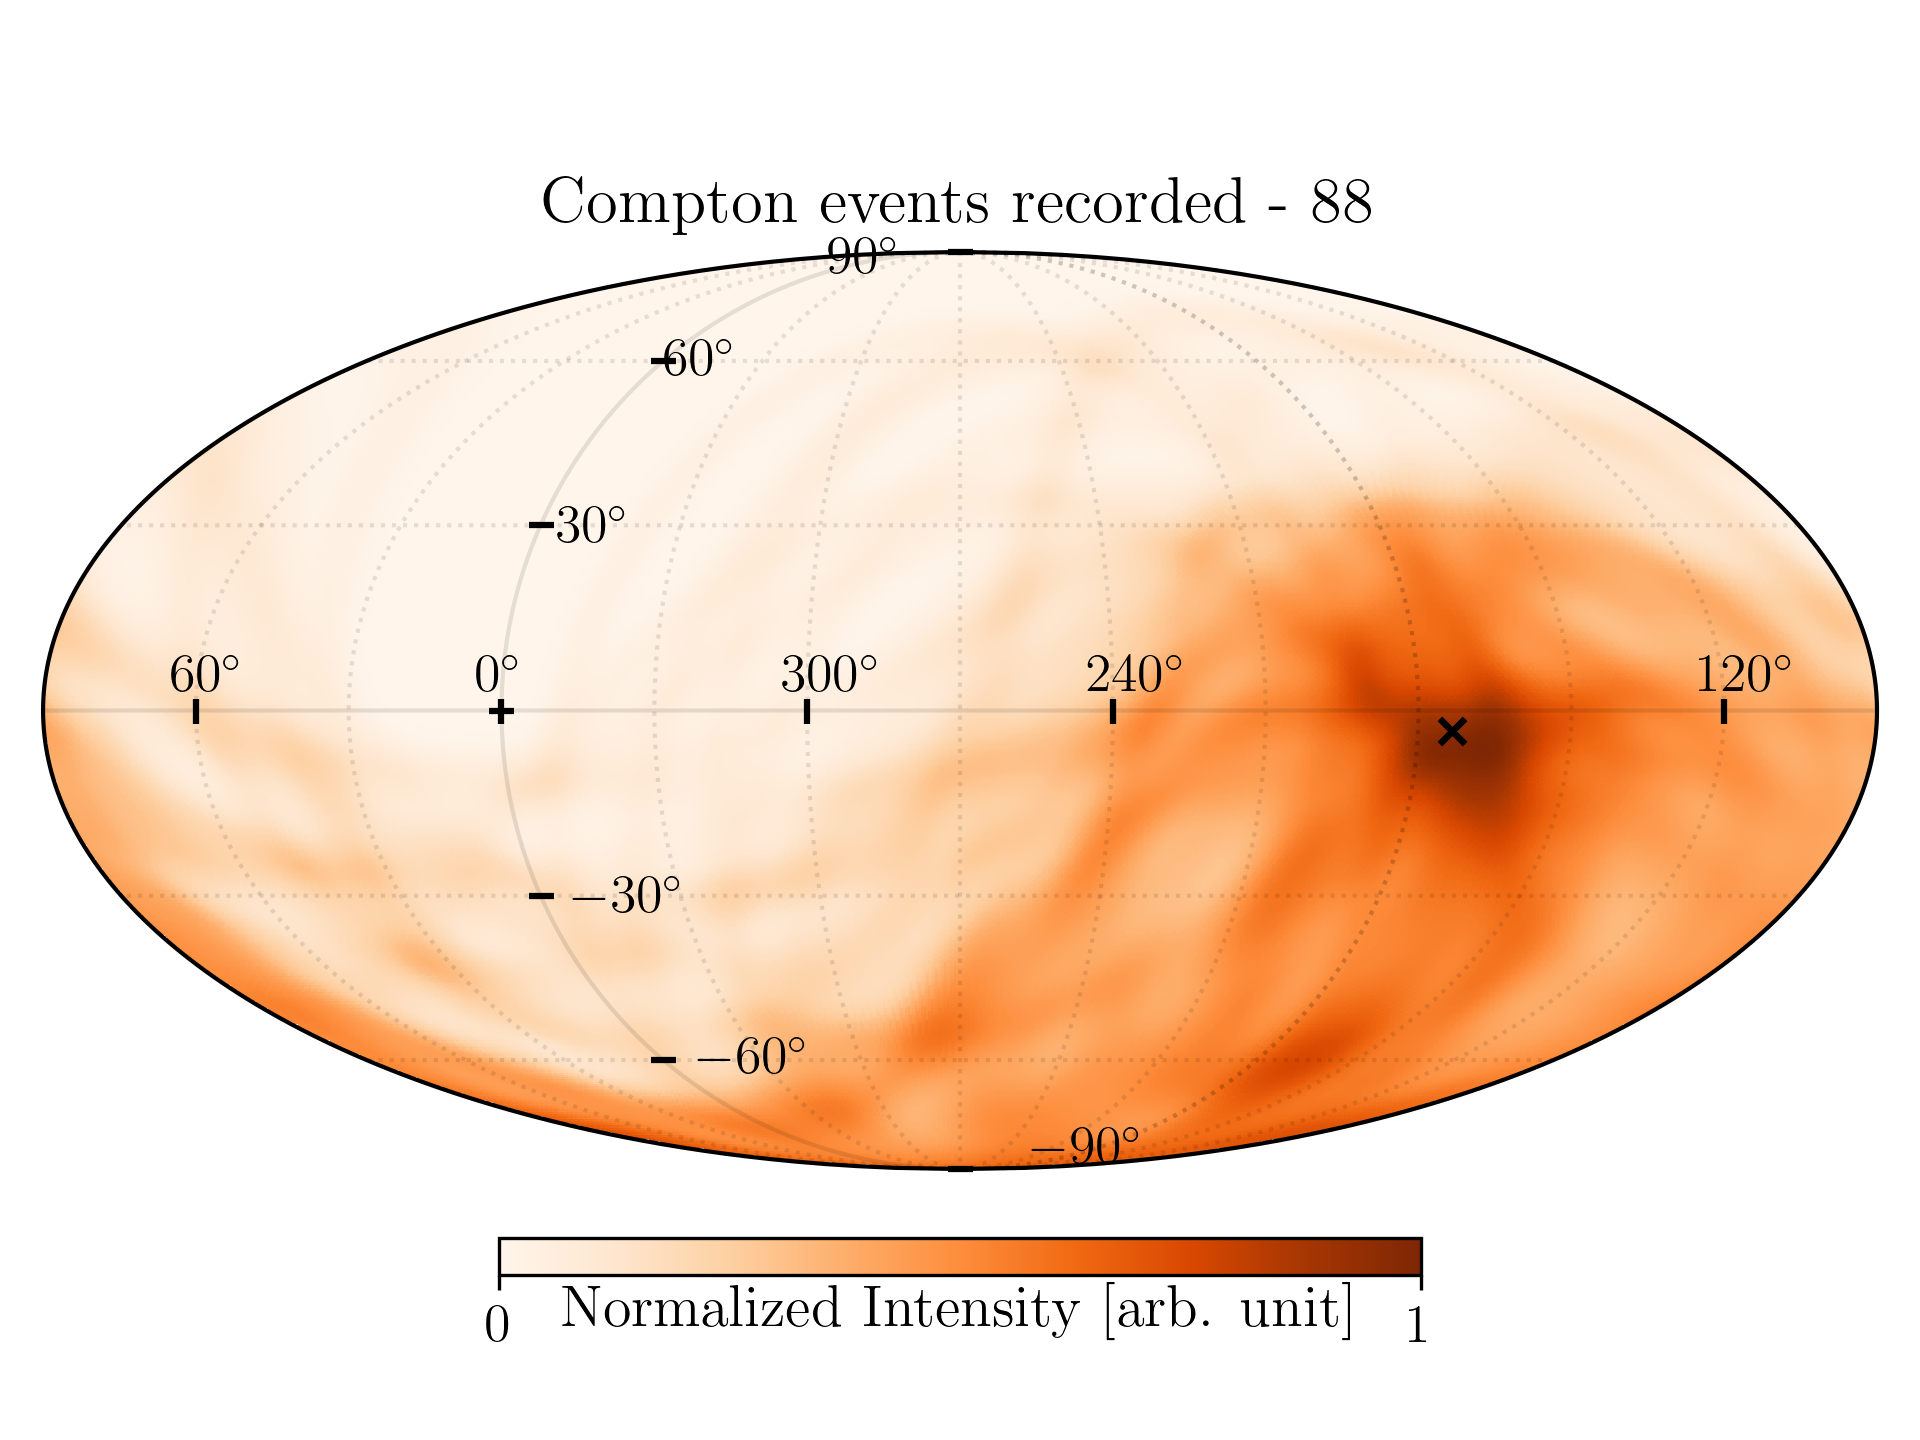
The results were obtained using four different coordinates of the source, as listed in observation Table 1. We then use the back-projection algorithm and map each event to a ring on the sky as discussed in §4.1. The final sky maps are created by adding all event rings from the selected 356 keV events. The source location corresponds to the high probability region resulting from this process (Figure 9). We can see that in all four cases, our reconstructed position is consistent with the true source position (marked with a bold cross).
Given the knowledge of the true source position, we can now evaluate the angular resolution of our setup. The best-fit position deviates from the true position due to various factors like the native angular resolution of the setup, geometric measurement uncertainties, and simplifying assumptions made in our analysis. We now evaluate the Angular Resolution Measure of our setup, and discuss some of the other limitations in §4.4.
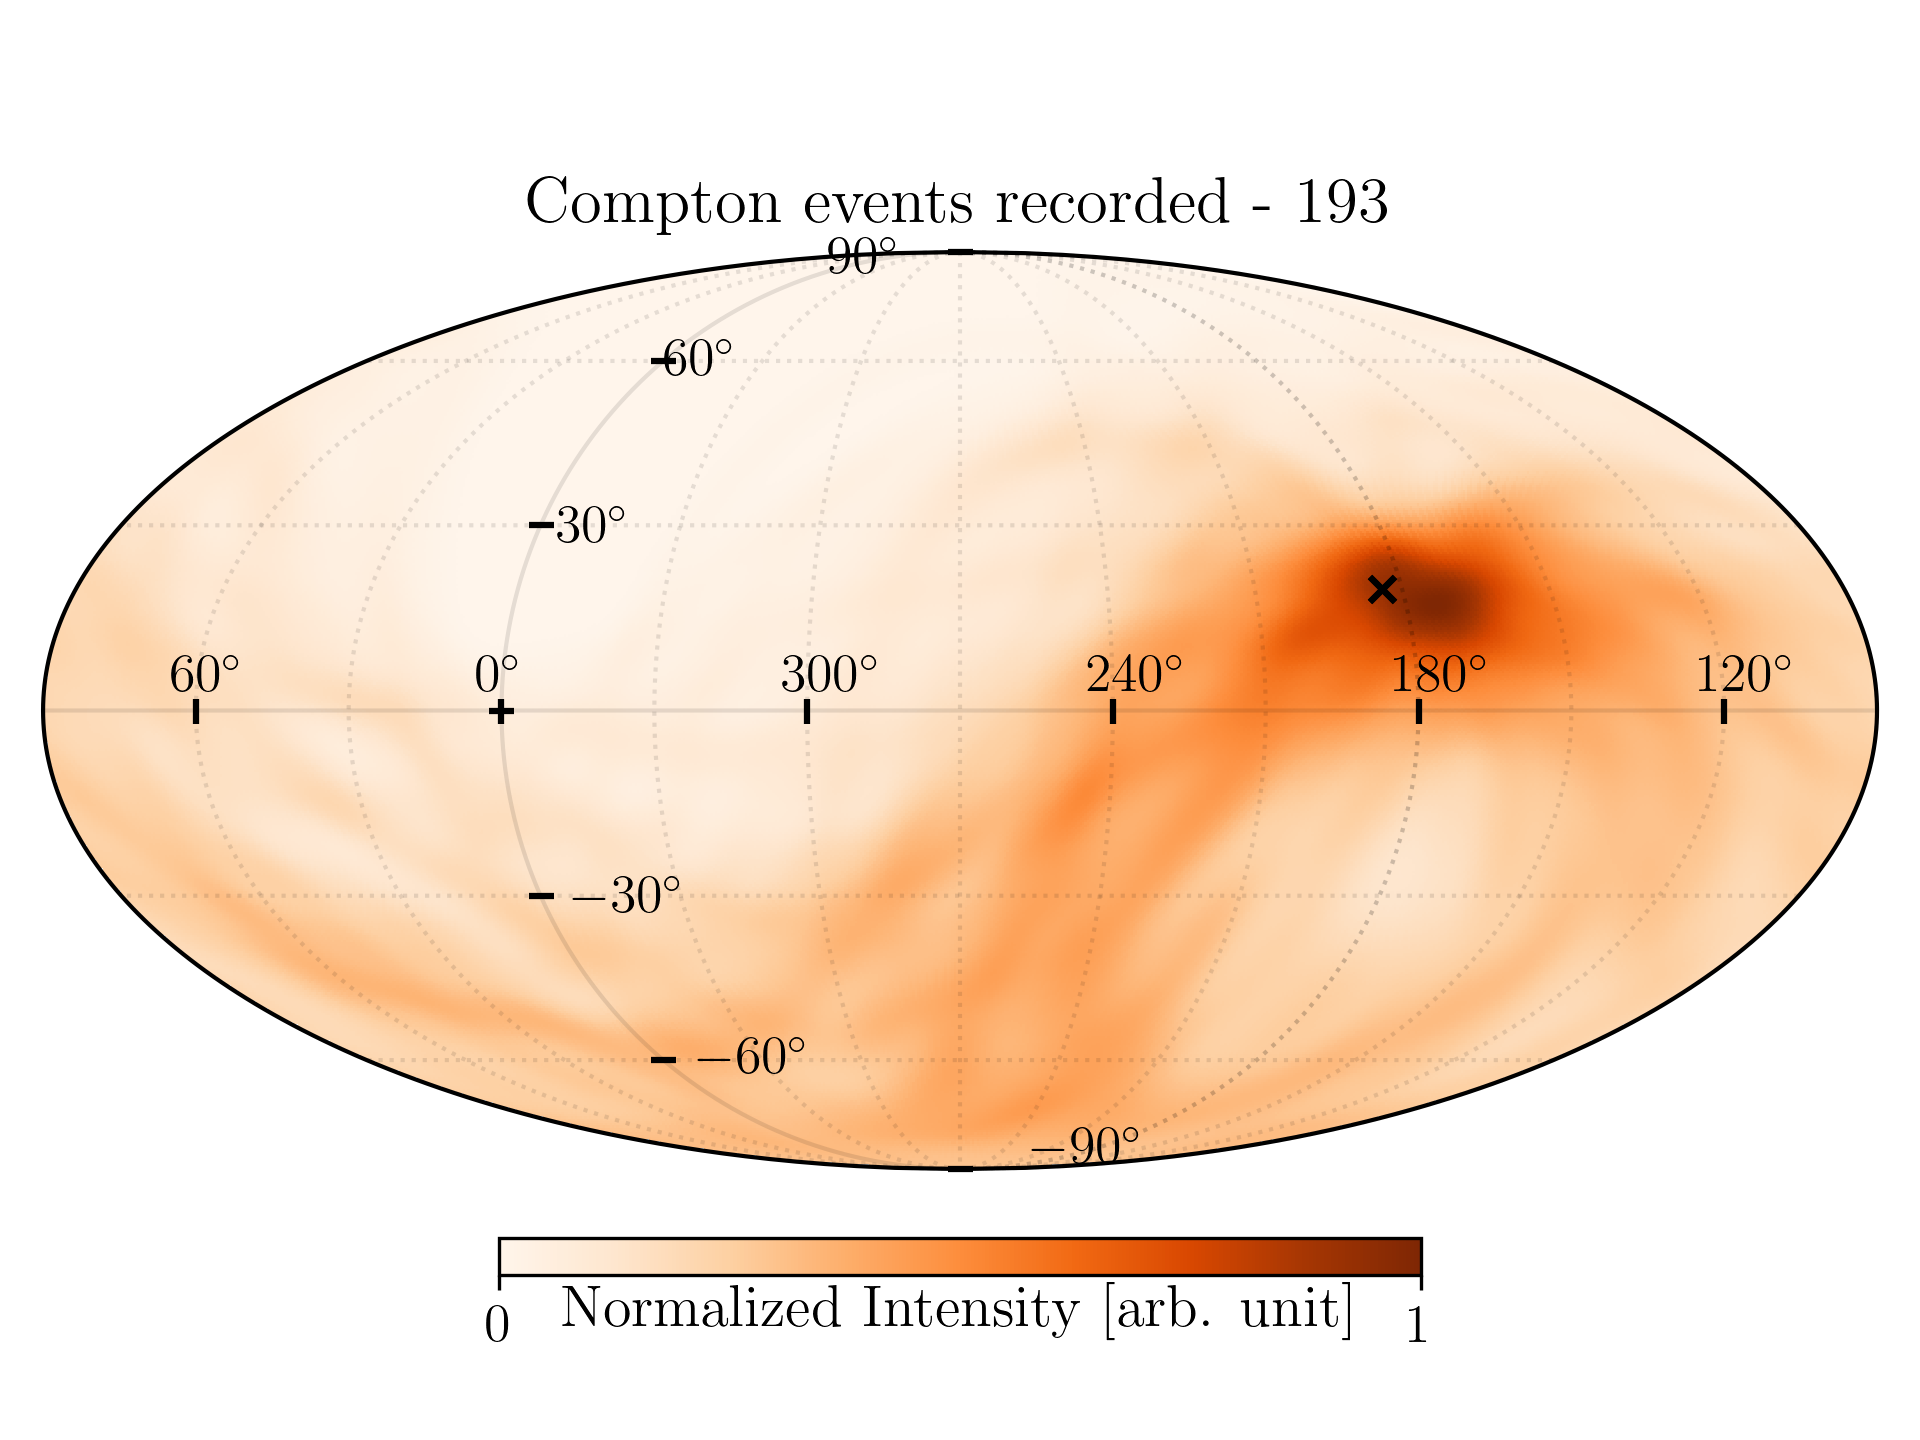
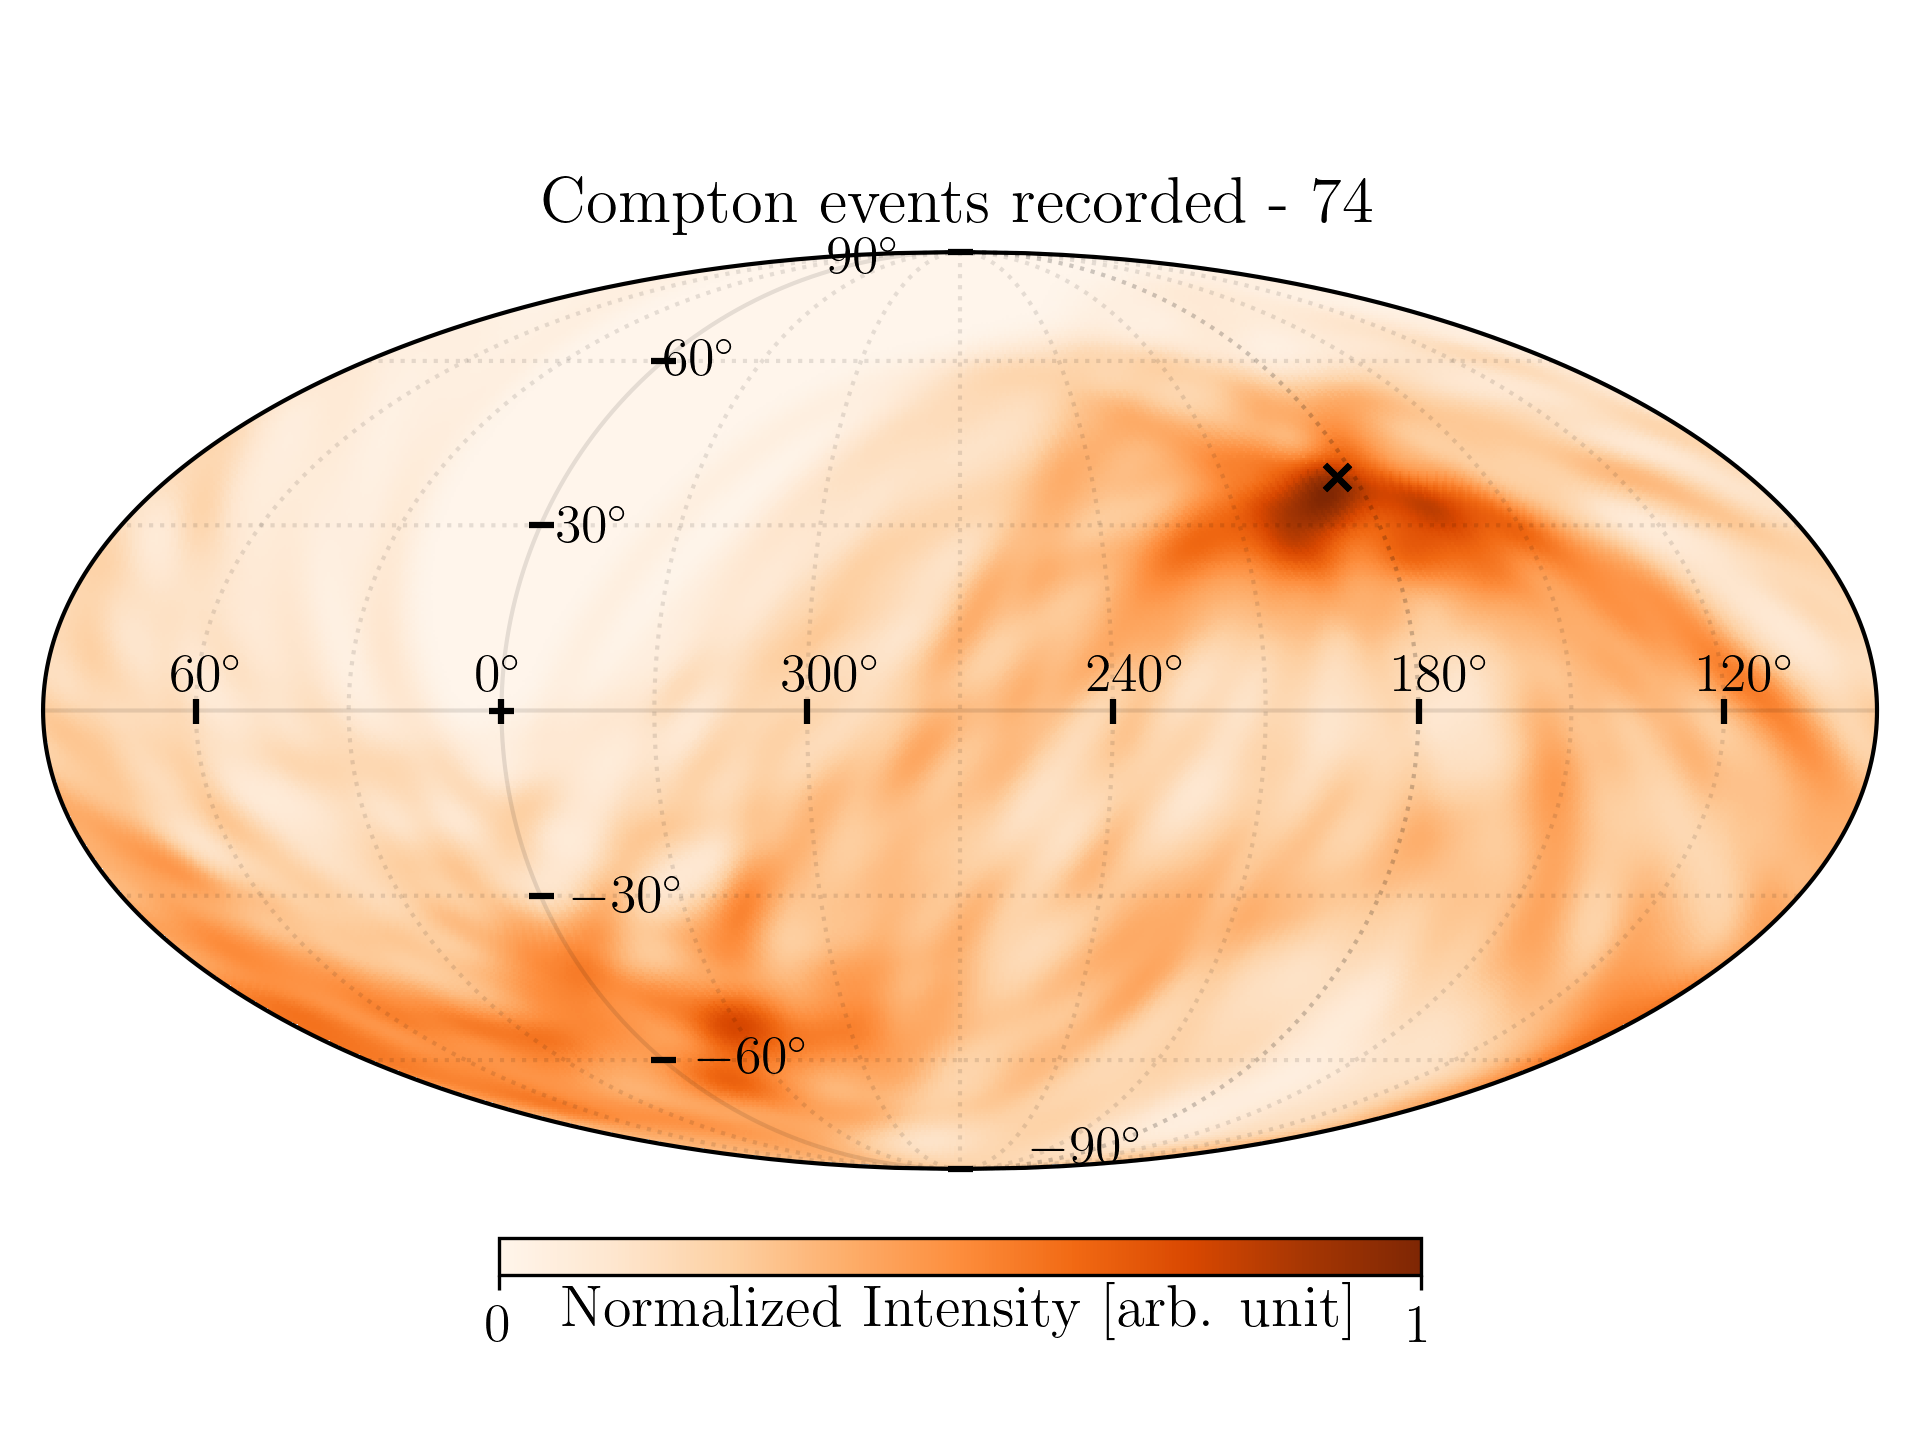
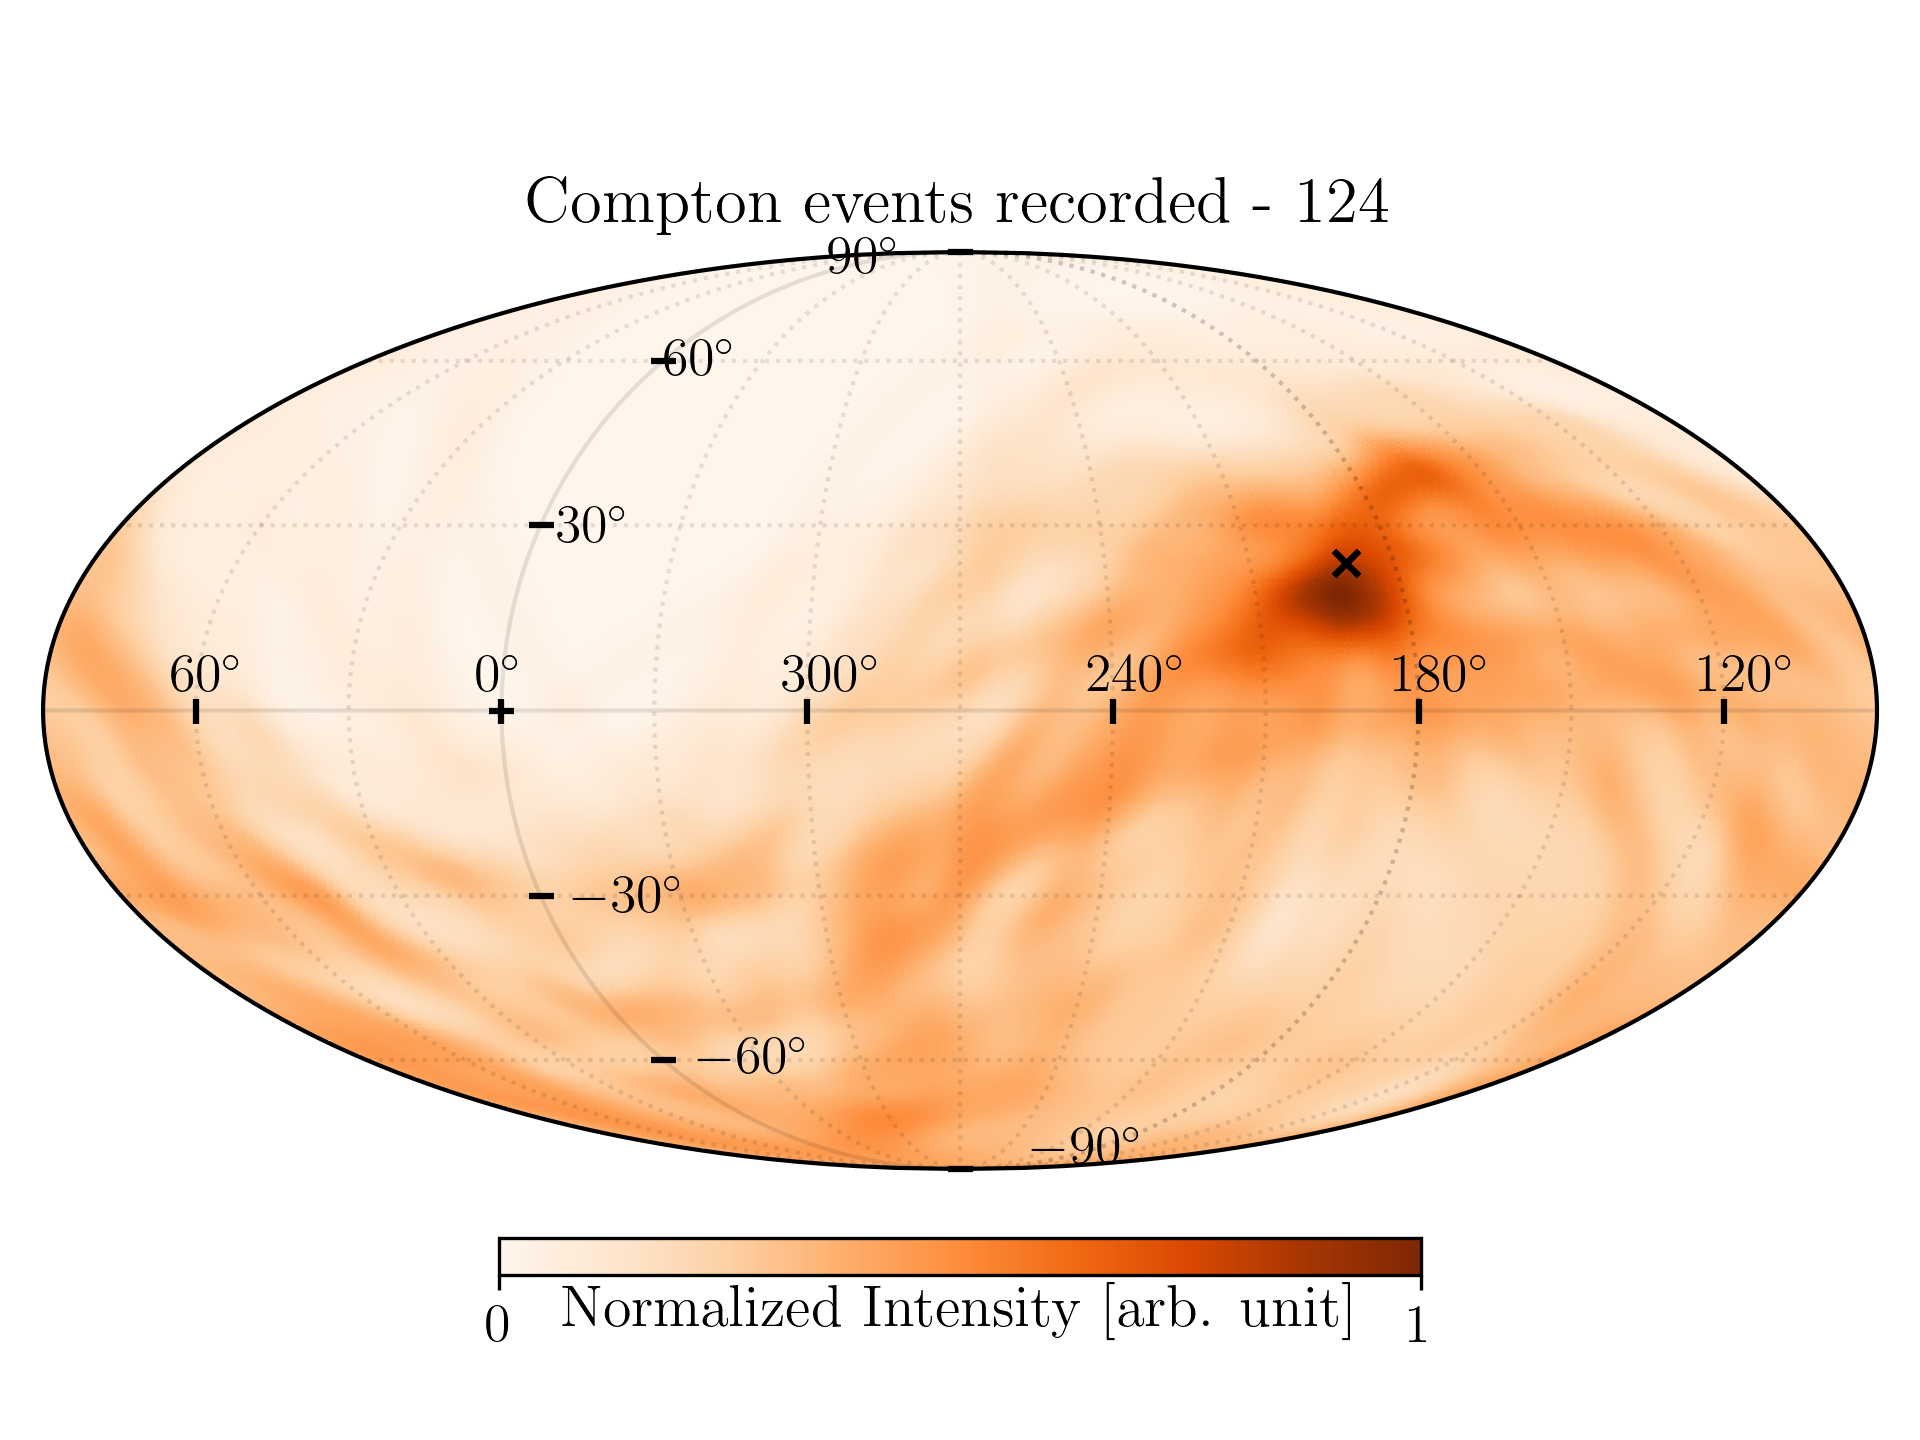
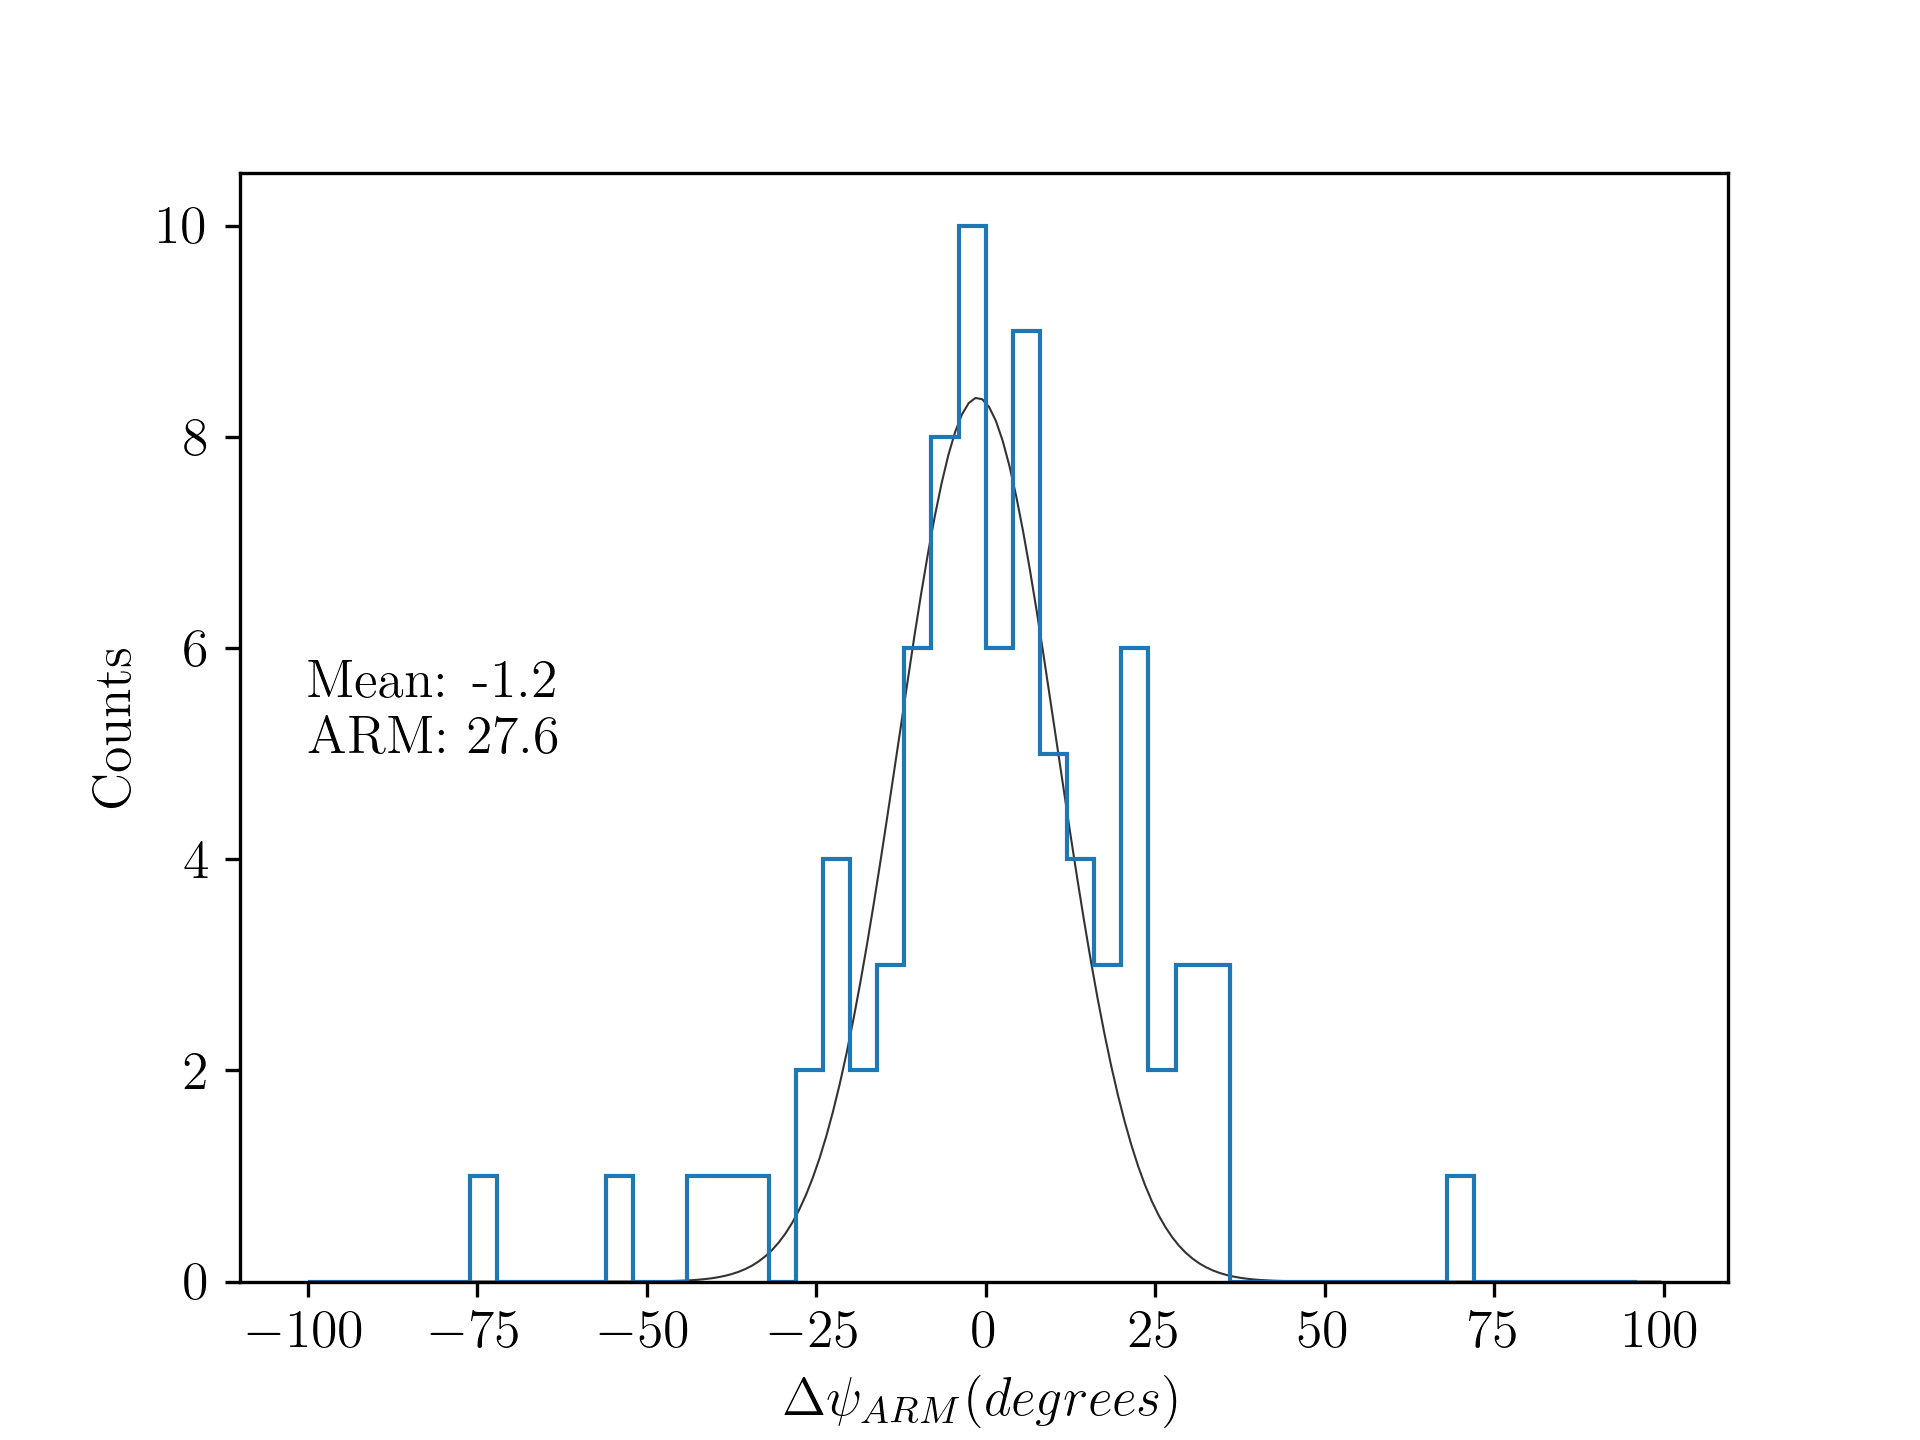
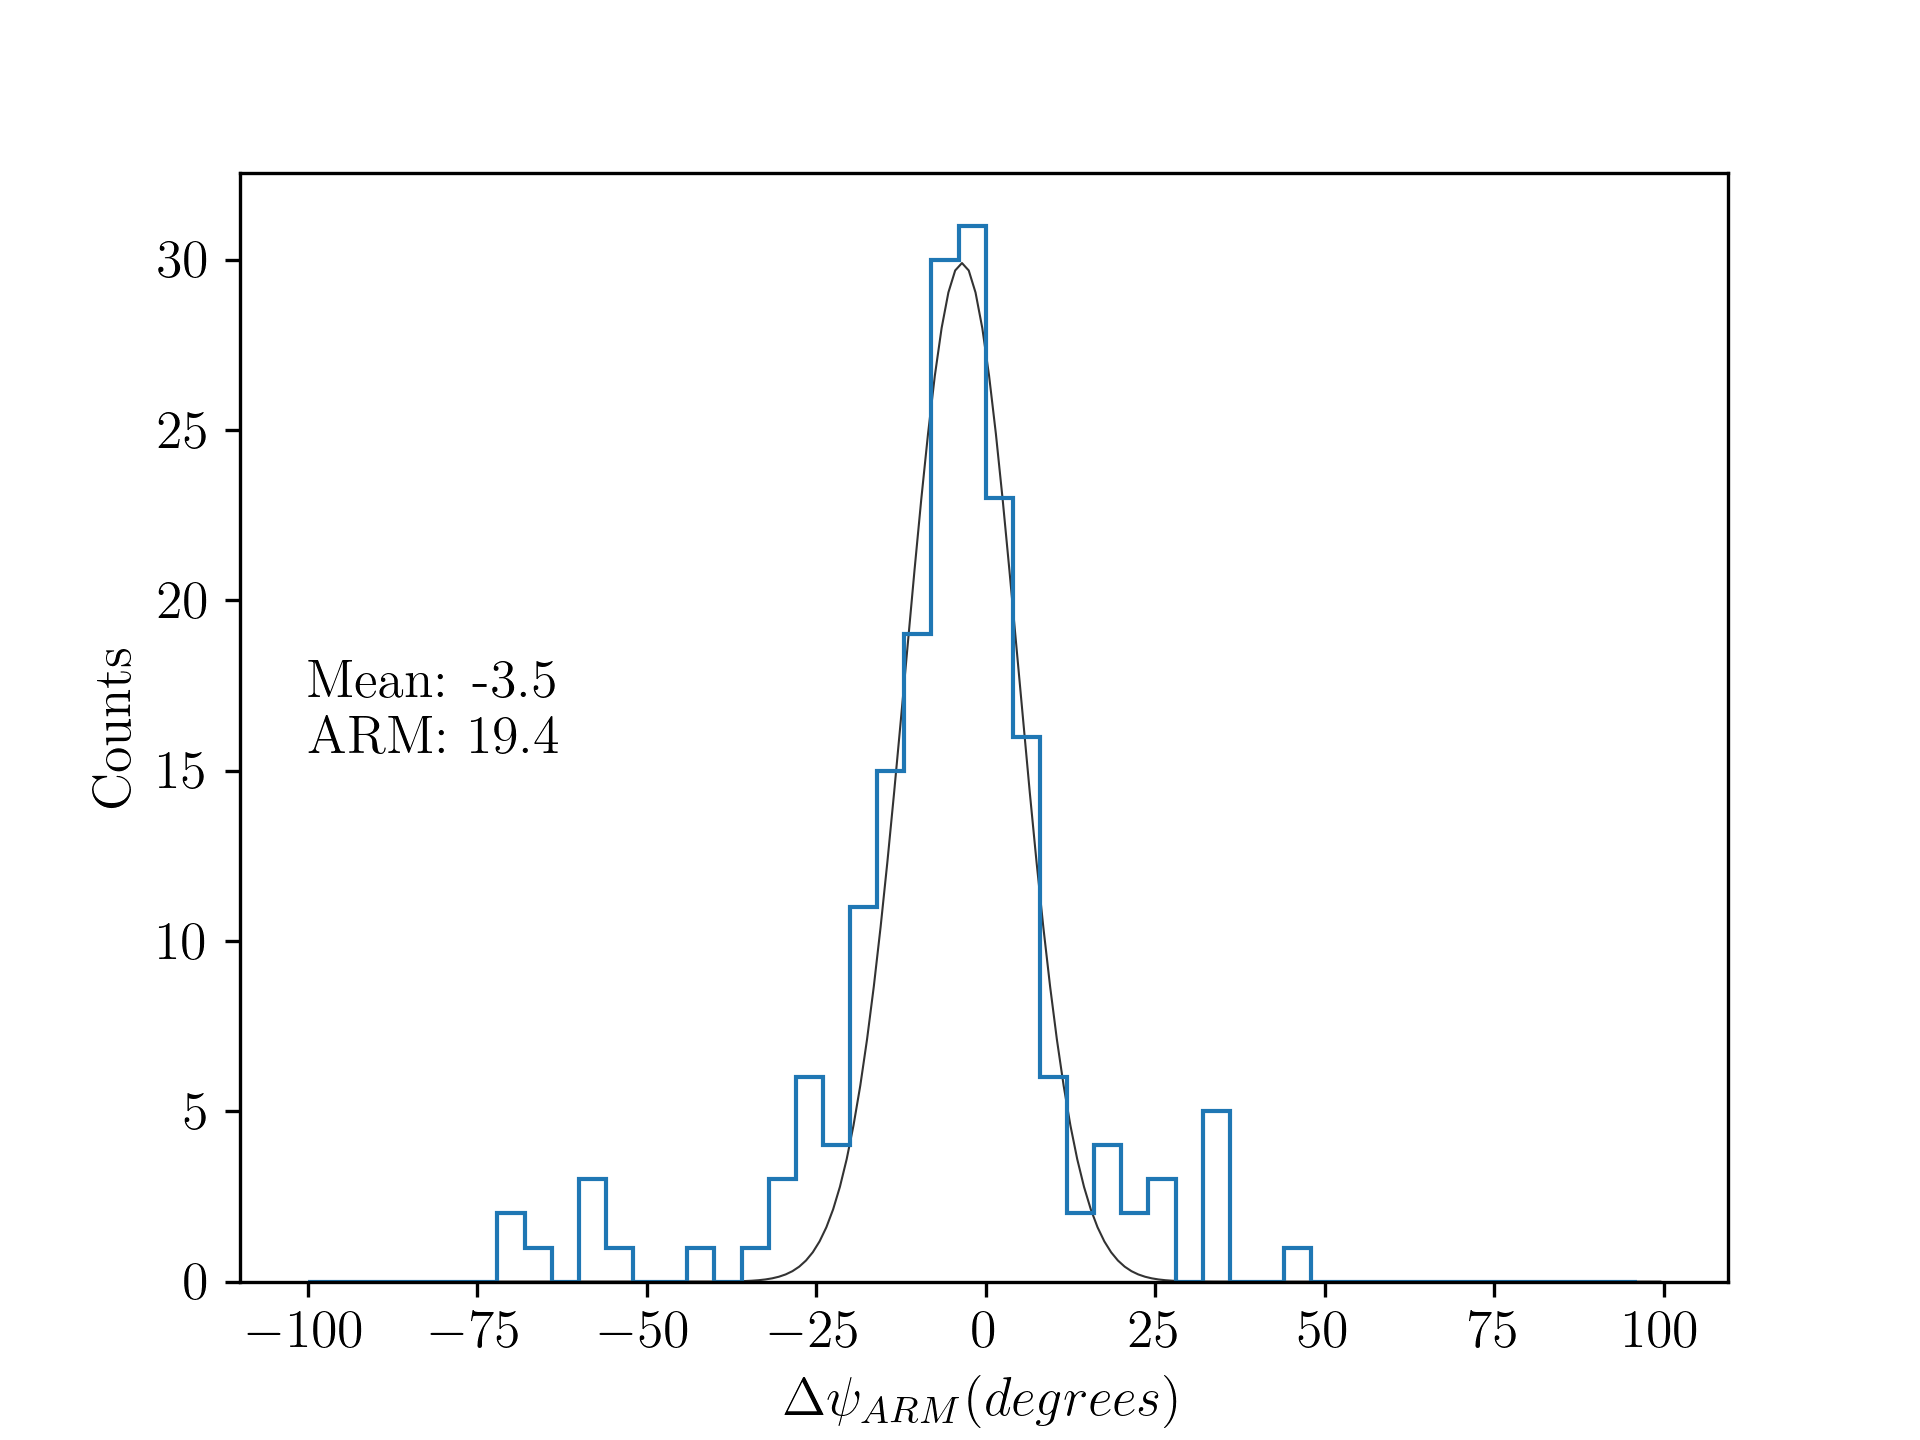
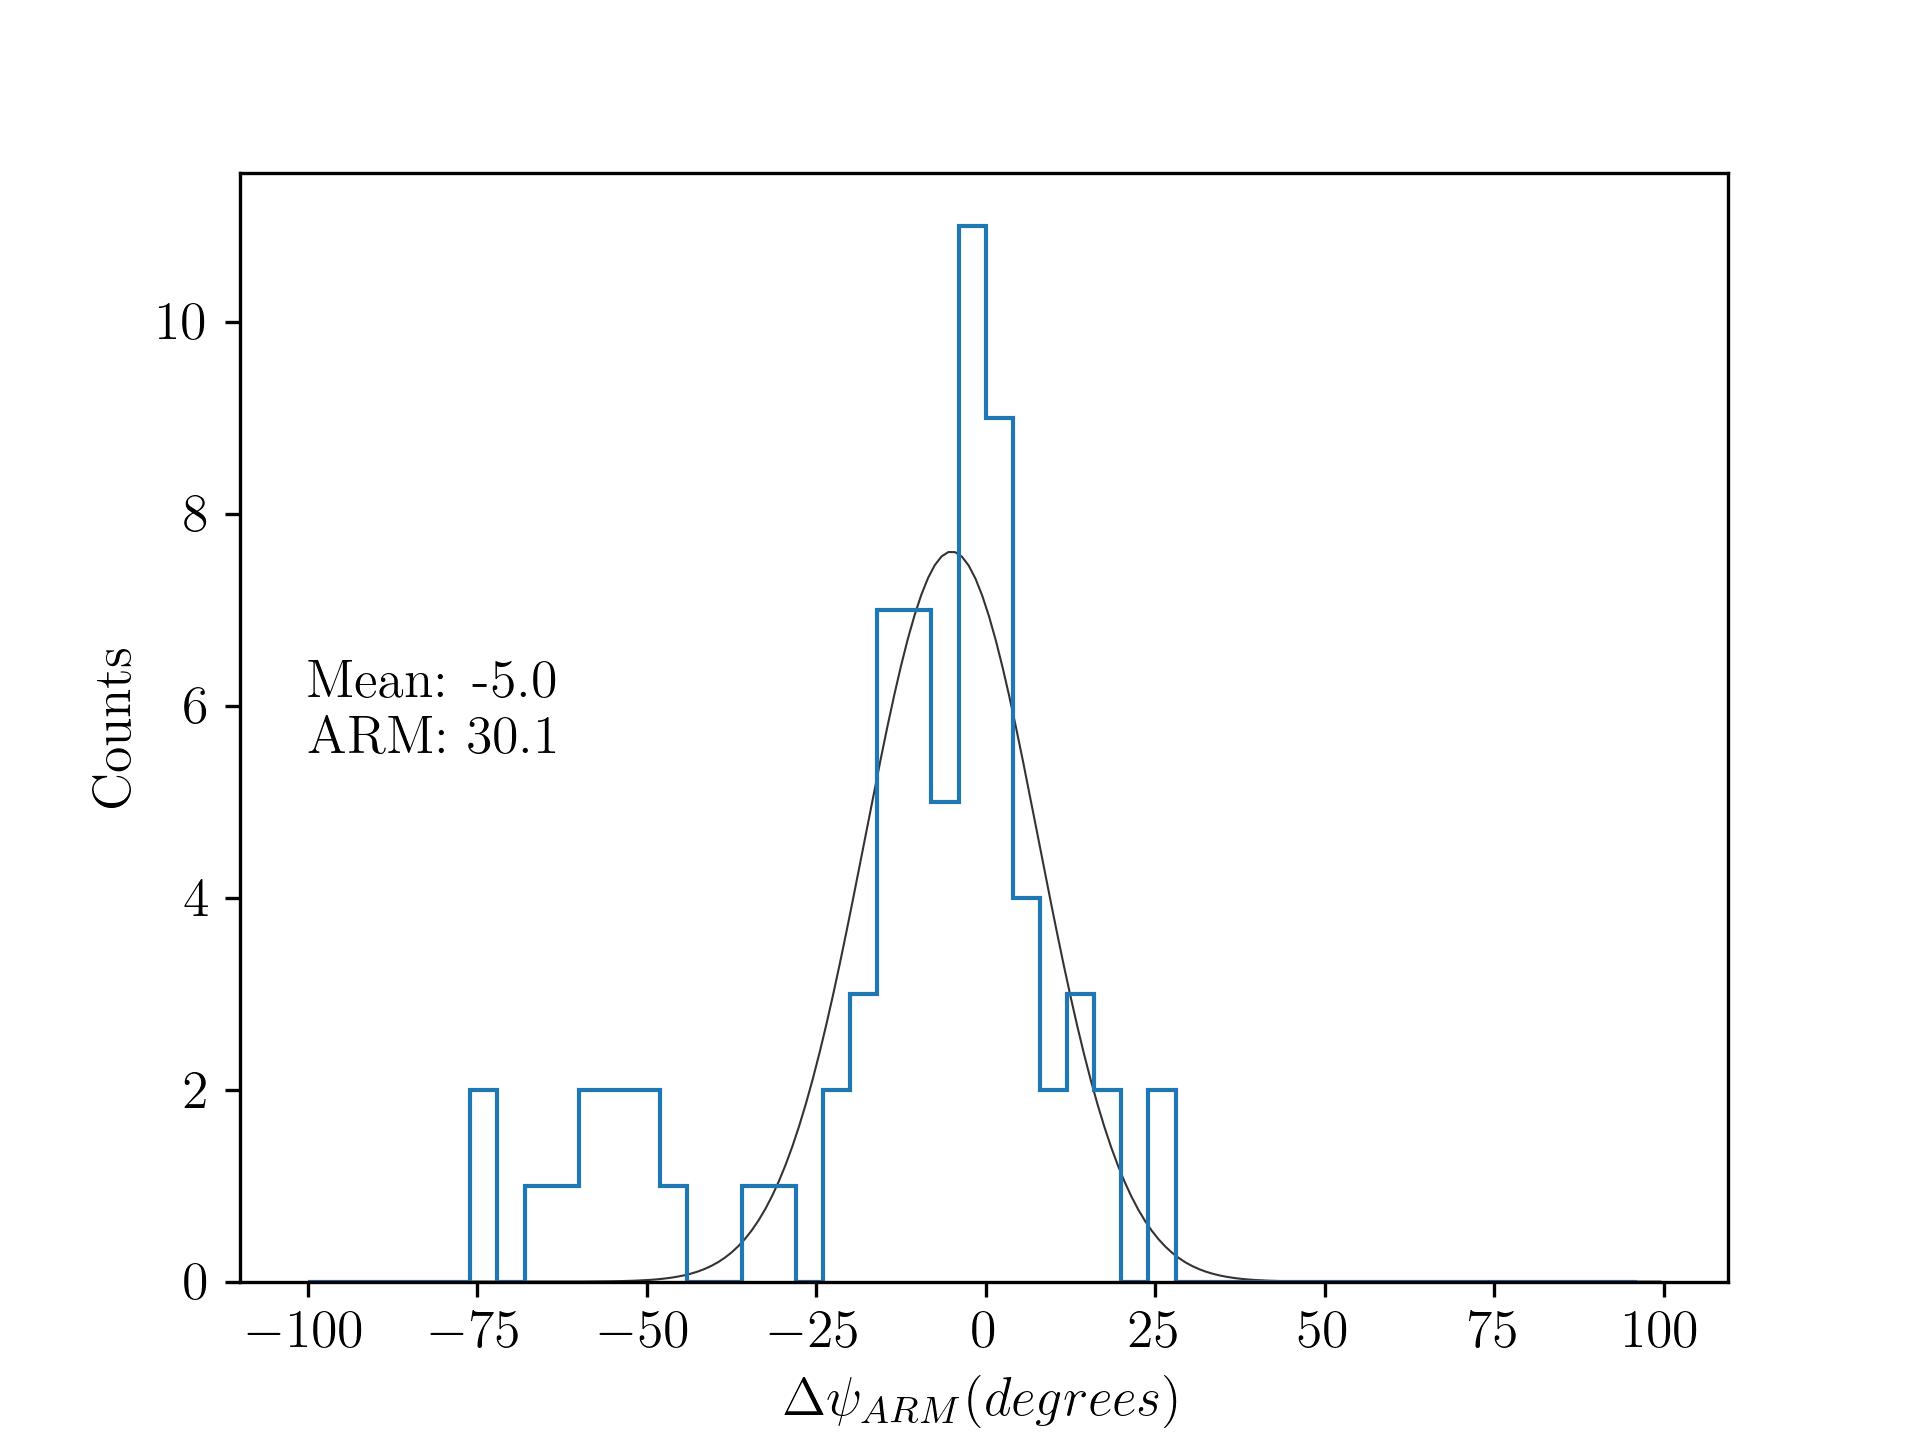
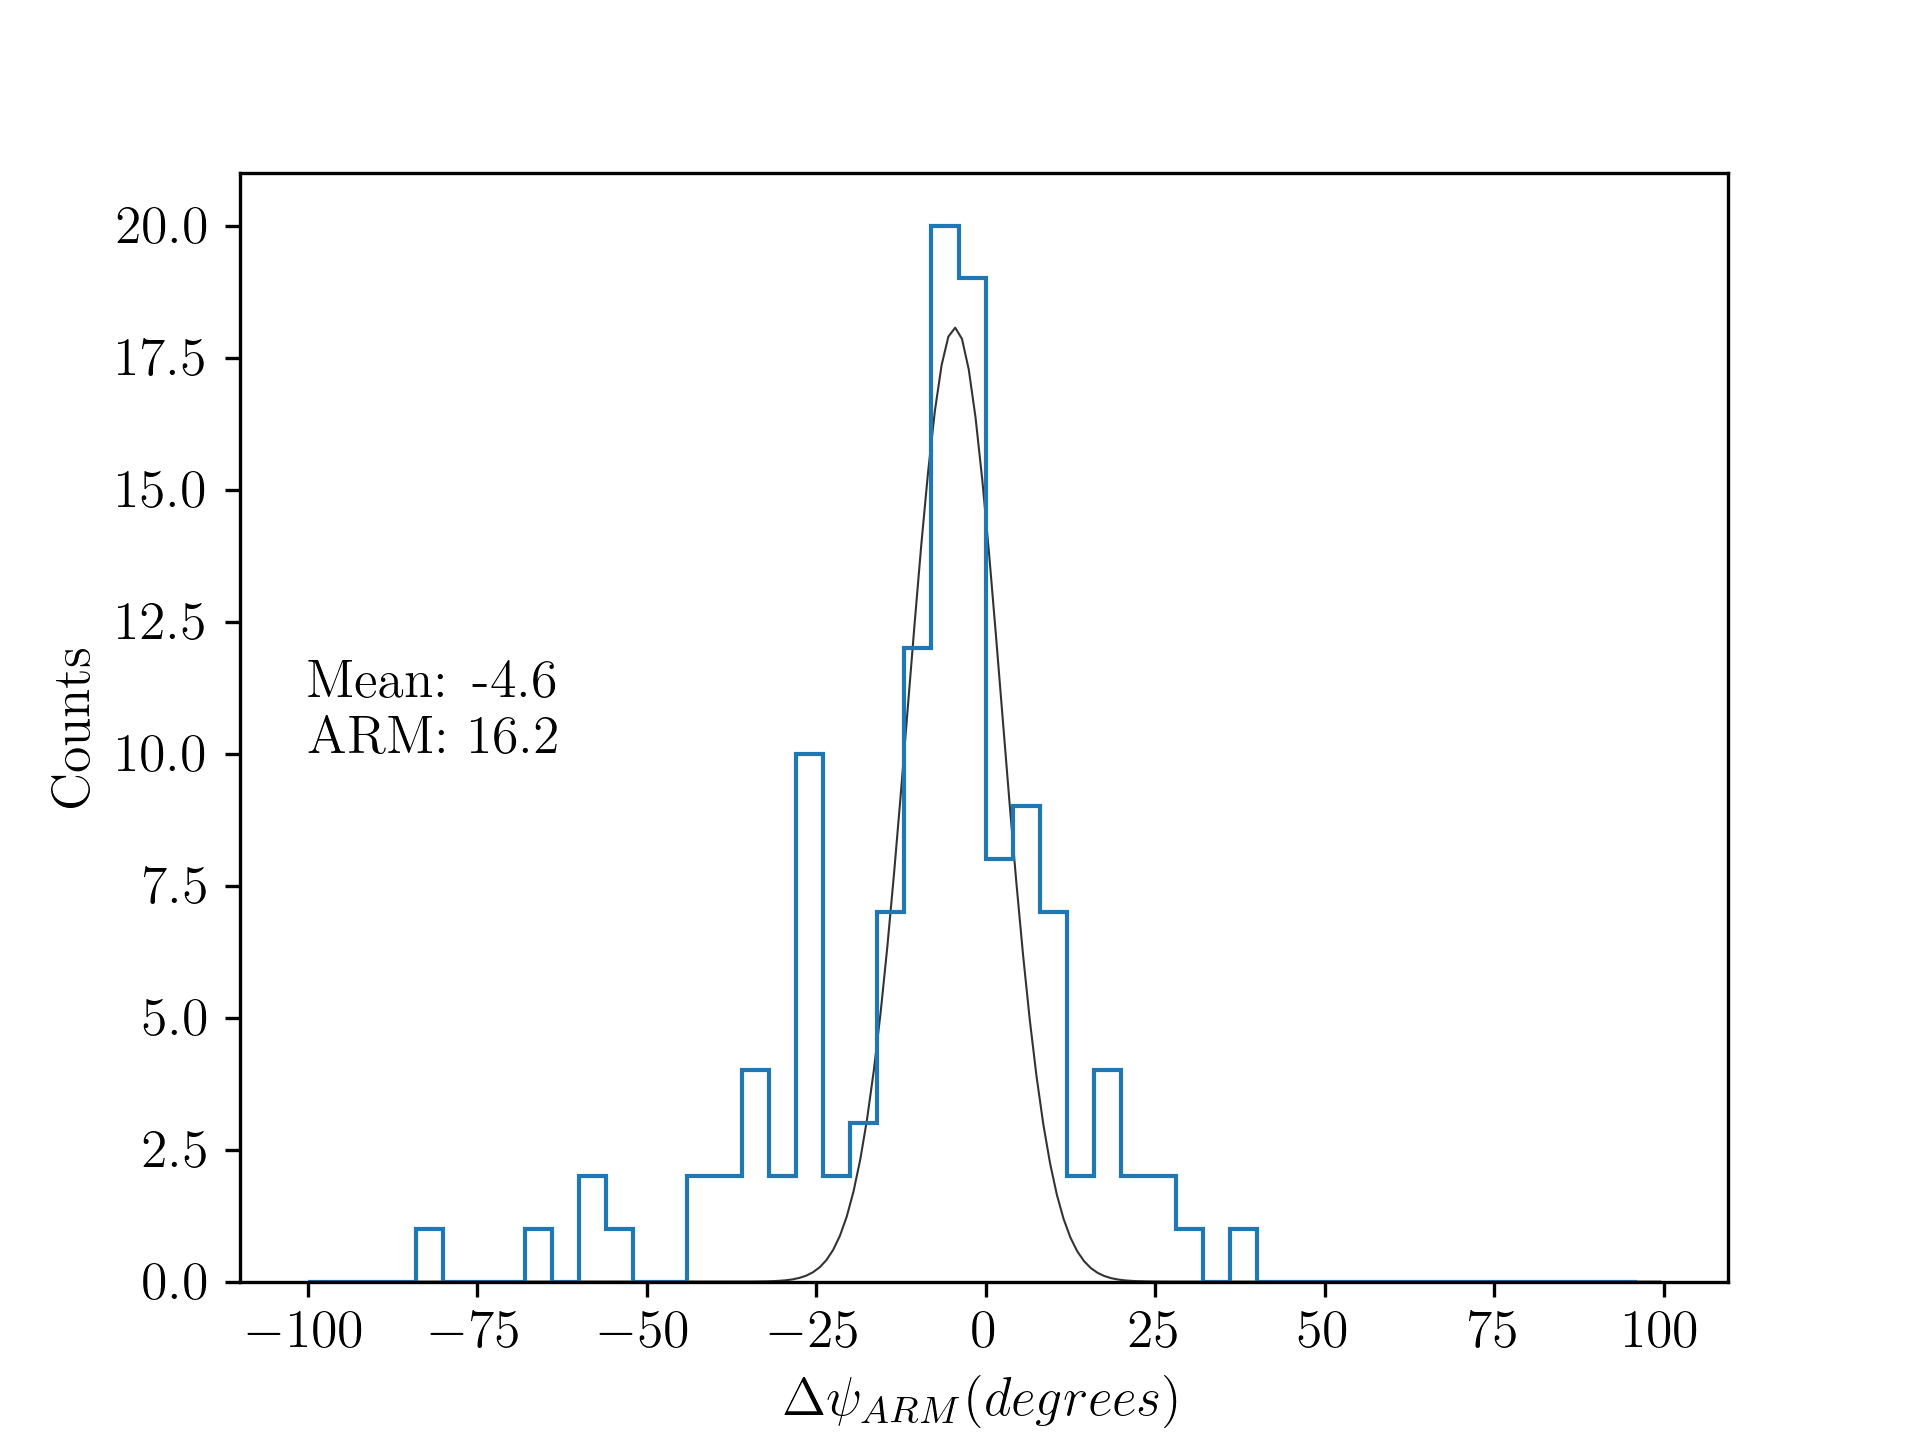
The angular resolution of a Compton camera is defined as the full width at half maximum (FWHM) of the Angular Resolution Measure (ARM) distribution [14]. For each Compton pair, we can calculate the Compton scatter angle in two ways. The geometric Compton scatter angle is calculated from the actual positions of the source, scattering pixel, and absorbing pixel (Figure 6) as a dot product of the initial photon direction and the measured scattered gamma-ray direction . The kinematic Compton scatter angle () is determined from the measured energy deposits using equation 1, and gives us a ring on the sky. The ARM for each event is defined as the minimum distance between the ring and the geometrically calculated source direction (Figure 6, lower right):
| (3) |
The histogram of values is shown in Figure 10 for our four experiments. For an ideal detector, we expect a sharp peak at , with a very narrow width. In practice, we expect to see a distribution centered close to zero. The FWHM of this distribution is the angular resolution of the Compton Imager. We see that our setup has a direction–dependent energy resolution, ranging from to .
4.4 Limitations
Our setup can satisfactorily recover the position of a source. However, there are certain limitations which impact the overall performance of the system, which we discuss below.
4.4.1 Limited absorber coverage
Source photons incident on Det V can be scattered in any direction. Only a fraction of these photons will hit Det H, while those traveling in other directions will not be detected. This leads to the measured Compton rate being lower than the actual rate of Compton scattering. To mitigate the problem, one can add more detectors to the system.
The addition of more detectors can also allow a more diverse range of scatterer–absorber vectors (, Figure 6). A simple interpretation of this is an increased spread in the centers of the event rings, thereby improving source localization.
4.4.2 Geometrical Error
The individual pixels of our CZT detectors are in size. We cannot infer the exact position of the photon interaction in this volume. Coupled with the relatively small (tens of mm) distance between the scattering and absorbing pixels, this leads to a few-degree uncertainty in the scattering angle.
This error can be reduced within the current setup by increasing the separation between the detectors. But in that scenario the absorber subtends a smaller solid angle from the scatterer compounding the problem in §4.4.1.
4.4.3 Chance Coincidences
As discussed in §4.2, the energies most of the temporally coincident photon pairs do not add up to any line emitted by the source. Some of these may arise from Compton scattering of lower energy lines of , but most are likely to be chance coincident photons rather than being true Compton event pairs. In our four tests, only about 4–7% of the temporally coincident photons came from the 356 keV line. A consequence of this is the need to select photons of a known source energy, which might not always be feasible.
There are two methods to mitigate this: decreasing the background rate, and decreasing the chance coincidence probability. The spectra for individual detectors (Figure 7) are consistent with being dominated by background noise near the LLD. This can be mitigated by cooling the detectors to a lower temperature. The detectors were operated with a 10 MHz clock speed in our tests, but they support higher operations speeds upto 30 MHz. Tripling the readout rate will decrease the chance coincidence probability by a factor of three, further improving the fraction of real Compton events. These two are the most important steps in converting our setup into a broad application Compton Imager where we can relax the source energy assumption.
4.4.4 Energy Resolution
Our detectors operating at room temperature have a resolution of 12% at 59.6 keV, and about 3% at 356 keV. Poorer energy resolution increases the width of the event rings through Equation 2, thereby limiting angular resolution. For the 356 keV line in our configuration, this value is about 2∘, comparable to the geometrical error discussed §4.1 and §4.4.2. This can be improved upon by either cooling the detectors, or by switching to other detectors. For instance, NuSTAR detectors have a resolution of 1% at 59.6 keV [15] and would give a much lower error. However, they are thinner (2 mm) and would not be sensitive to the higher energy photons used in this experiment.
4.4.5 Source Position
In our experiment, the source was placed at distances of 22–28 cm from the 4 cm–wide scatterer. This causes a divergence of in the source beam. However, our reconstruction algorithms assume incoming photons are parallel to each other. This “near field source error” is likely the largest contributor to the high ARM seen in Figure 10. Taking the source further away decreases the source count rate, and was not feasible within the practical constraints of a laboratory setup.
4.4.6 Doppler broadening
Equation 1 was derived based on the assumption that the target electron is at rest. However, in the detector the electrons are bound to a nucleus and have finite momentum. This introduces another uncertainty in the calculated energies which fundamentally limits the achievable angular resolution. This effect, called as Doppler broadening, is highly dependent on detector atomic number and incident photon energy. For our case, it constitutes a fundamental limit of around 2∘ to 4∘ for the angular resolution [12].
5 Conclusion and Future Work
We have successfully demonstrated a laboratory setup of a Compton imager in the hard X-ray energy range.
We developed a new system based on simple custom PCBs and an off–shelf PYNQ board to operate the detectors and read out data into an FPGA or a PC. With this setup, we achieved detector performance on par with those of AstroSat CZTI. Our system operates the detectors at a time resolution of s, significantly faster than the s resolution of CZTI. We demonstrated the ability to concurrently read out two detectors with this setup, eliminating the need to serially poll them.
We tested the imager by irradiating it with from four different positions. In each case, we could successfully recover the source position from the recorded event data. In our tests, we obtain a direction–dependent angular resolution in the range of to . The resolution is primarily limited by the “near field” location of the source, which is not factored into the reconstruction algorithms. The overall angular resolution and reconstruction performance can also be improved by using more advanced position reconstruction algorithms.
We have discussed a few limitations of this system in §4.4, and are now working towards resolving some of them. In the future, we will try to operate the setup at a cooler temperature, and at a higher clock speed. The system can also be expanded to include more detectors in tandem, increasing the absorber coverage as well as increasing the overall effective area of the imager.
This successful technology development paves the way for the development of future complex CZT detector systems. The experience gained and lessons learnt from this experiment have aided the development of the Medium Energy Detector Package for the proposed Daksha space telescope [16].
Code and Data Availability
Data and relevant codes pertaining to this project will be made available on request.
Acknowledgements
This work was supported by the joint IIT Bombay – Indian Space Research Organisation (ISRO) Space Technology Cell (STC). We thank the staff of IIT Bombay and the Tata Institute of Fundamental Research (TIFR) for their help in setting up and running the experiments. We thank Ayush Nema for useful discussions.
References
- [1] A. H. Compton, “The spectrum of scattered x-rays,” Phys. Rev. 22, 409–413 (1923).
- [2] G. F. Knoll, Radiation detection and measurement (2000).
- [3] P. von Ballmoos, R. Diehl, and V. Schoenfelder, “Imaging the gamma-ray sky with Compton telescopes.,” A&A 221, 396–406 (1989).
- [4] S. E. Boggs and P. Jean, “Event reconstruction in high resolution Compton telescopes,” A&AS 145, 311–321 (2000).
- [5] V. Schoenfelder, H. Aarts, K. Bennett, et al., “Instrument Description and Performance of the Imaging Gamma-Ray Telescope COMPTEL aboard the Compton Gamma-Ray Observatory,” ApJS 86, 657 (1993).
- [6] J. Tomsick, A. Zoglauer, C. Sleator, et al., “The Compton Spectrometer and Imager,” in Bulletin of the American Astronomical Society, 51, 98 (2019).
- [7] C. Kierans, Detection of the 511 keV positron annihilation line with the Compton Spectrometer and Imager. PhD thesis, University of California, Berkeley (2018).
- [8] Z. Li, J. Cheng, F. Liu, et al., “Research on the technological progress of czt array detectors,” Sensors 24(3) (2024).
- [9] V. Bhalerao, D. Bhattacharya, A. Vibhute, et al., “The Cadmium Zinc Telluride Imager on AstroSat,” Journal of Astrophysics and Astronomy 38, 31 (2017).
- [10] S. Ramagond, S. Yellampalli, and C. Kanagasabapathi, “A review and analysis of communication logic between pl and ps in zynq ap soc,” in 2017 International Conference On Smart Technologies For Smart Nation (SmartTechCon), 946–951 (2017).
- [11] R. R. Kinsey et al., “The nudat/pcnudat program for nuclear data.” Paper submitted to the 9th International Symposium of Capture Gamma-Ray Spectroscopy and Related Topics, Budapest, Hungary, October 1996. Data extracted from the NUDAT database, version (Aug 2024) (1996).
- [12] A. C. Zoglauer, First light for the next generation of Compton and pair telescopes. PhD thesis, Munich University of Technology, Germany (2005).
- [13] M. Frandes, B. Timar, and D. Lungeanu, “Image reconstruction techniques for Compton scattering based imaging: An overview,” Current Medical Imaging 12(2), 95–105 (2016).
- [14] C. Kierans, T. Takahashi, and G. Kanbach, “Compton Telescopes for Gamma-Ray Astrophysics,” in Handbook of X-ray and Gamma-ray Astrophysics, 18 (2022).
- [15] T. Kitaguchi, B. W. Grefenstette, F. A. Harrison, et al., “Spectral calibration and modeling of the NuSTAR CdZnTe pixel detectors,” in Society of Photo-Optical Instrumentation Engineers (SPIE) Conference Series, Society of Photo-Optical Instrumentation Engineers (SPIE) Conference Series 8145, 814507 (2011).
- [16] V. Bhalerao, S. Vadawale, S. Tendulkar, et al., “Daksha: on alert for high energy transients,” Experimental Astronomy 57, 24 (2024).