Dark Energy Survey: 2.1% measurement of the Baryon Acoustic Oscillation scale from the final dataset
Abstract
Here, we present the angular diameter distance measurement obtained from the measurement of the Baryonic Acoustic Oscillation (BAO) feature using the completed Dark Energy Survey (DES) data, summarizing the main results of [1] and [2]. We use a galaxy sample optimized for BAO science in the redshift range , with an effective redshift of . Our consensus measurement constrains the ratio of the angular distance to the sound horizon scale to . This measurement is found to be below the angular BAO scale predicted by Planck-2018. To date, it represents the most precise measurement from purely photometric data, and the most precise from any Stage-III experiment at such high redshift. The analysis was performed blinded to the BAO position and is shown to be robust against analysis choices, data removal, redshift calibrations and observational systematics.
1 Introduction
The Dark Energy Survey111https://www.darkenergysurvey.org/ (DES) is a Stage-III photometric galaxy survey designed to constrain the properties of dark energy and other cosmological parameters from multiple probes. DES has performed state-of-the-art analyses of weak gravitational lensing, galaxy clustering and galaxy cluster counts. These probes have also been combined with external cosmic microwave background data. The DES Supernova (SN) program has also broken new grounds in constraining cosmology from 1,500 type Ia SN [3]. In addition to that, the large data sets and catalogs produced by DES represent a unique source for other cosmological and astronomical analyses.
In this work, we use the complete DES data set, which includes 6 years of observations (2013-2019), to constrain the angular BAO distance scale, summarizing the main outcomes of [1]. We follow a similar methodology to previous DES analyses, with three main changes. First, in [2] we re-optimize the galaxy sample and extend it up to redshift 1.2. Second, we reinforce the redshift validation, considering several independent calibrations and quantifying its possible impact on the BAO measurement. Third, we provide BAO measurements from three types of two-point clustering statistics: angular correlation function (ACF), angular power spectrum (APS) and projected correlation function (PCF). Our reported consensus result comes from the statistical combination of those three measurements, following a strict blinding policy.
2 The BAO-Optimized Sample
The galaxy sample used to measure the BAO signal is a subset of the DES data set selected using the bands and a photometric redshift estimate, . The selection cuts applied are
| (1) | |||||
| (2) | |||||
| (3) | |||||
| (4) |
The sample has 15.93 million galaxies, its angular mask covers 4,273 deg2, it is divided into 6 redshift bins with and its effective redshift is . The cut specified by Eq. (2) was optimized using a Fisher forecast algorithm, as detailed in [2].
3 Methodology
3.1 Simulations
We created a set of 1,952 mock catalogs based on ICE-COLA fast simulations [4]. They reproduce with high accuracy the main properties of the data: observational volume, abundance of galaxies, redshift distributions, photo- errors and clustering as a function of redshift. Mock catalogs are key to validating the modeling and quantifying how likely some features we find in the data are.
3.2 The BAO Fit
Our approach to measuring the BAO distance scale is based on a template fitting method. We start from the linear power spectrum generated using CAMB, , and then isolate the no-wiggle component, , as
| (5) |
where is the linear galaxy bias, accounts for redshift-space distortions, and models the broadening of the BAO peak due to non-linearities. From this , we compute the theoretical template, , for our three estimators (ACF, APS and PCF). For the template, we use Planck-2018 [5] as the reference cosmology and assume CDM. The model fitted to the data is given by
| (6) |
where the position of the BAO feature is given in terms of the BAO-scaling parameter, . is given by , and for ACF, APS and PCF, respectively. By definition,
| (7) |
where is the comoving angular diameter distance and is the sound horizon scale at recombination. “ref” refers to quantities evaluated at the reference cosmology (Planck-2018).
3.3 Systematics
3.4 Pre-Unblinding Tests
The analysis and most of the paper writing were performed blind. Before unblinding, we require our data to pass a battery of tests. Some of these include whether we have a detection of the BAO feature in the combined fit and each redshift bin individually or not, if our measurement is robust against analysis choices, and if our three estimators give consistent results. All these tests pointed to the robustness of our measurement, so we unblinded (see [1] for more details).
4 Results
In Fig. 1, we show the clustering measurements for our different estimators and the best-fit model.
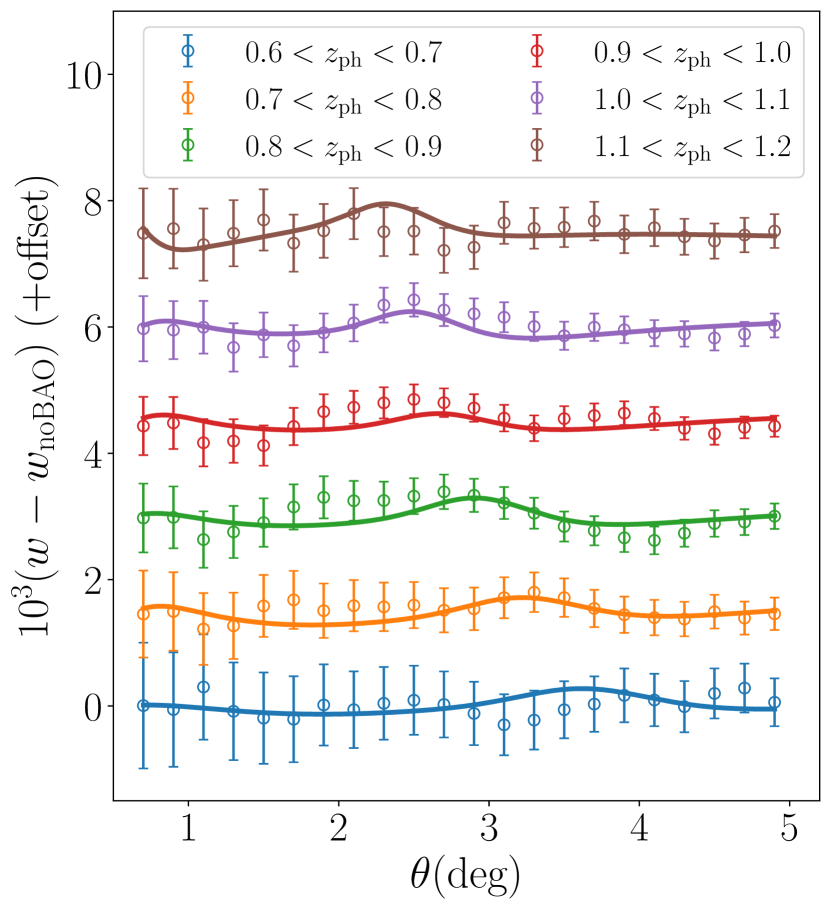
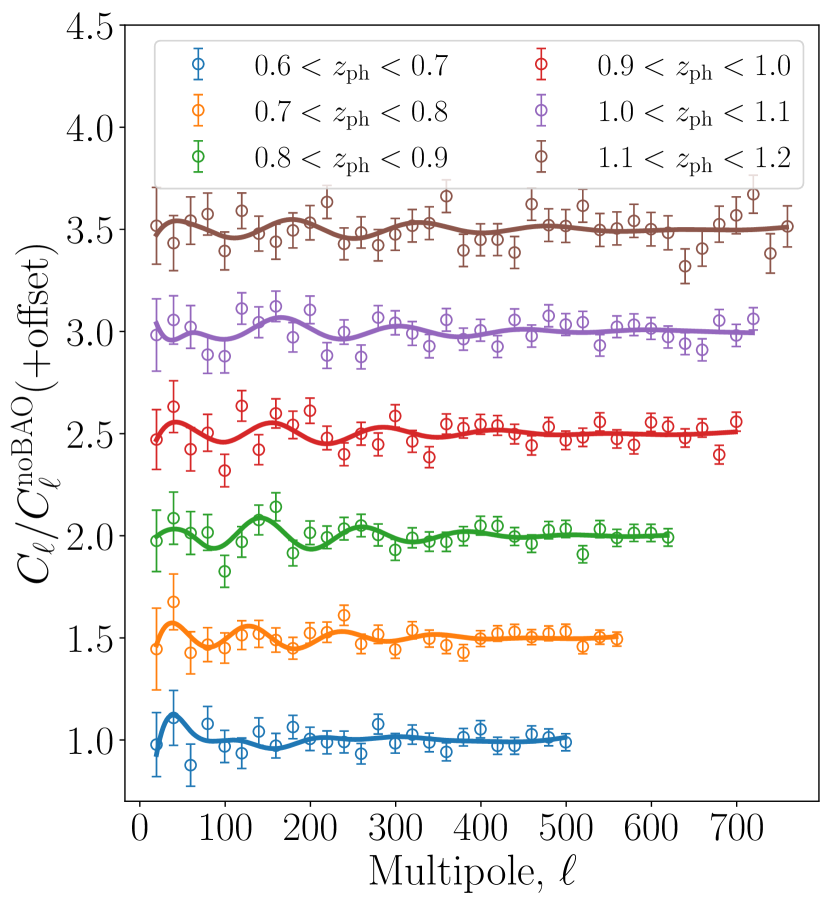
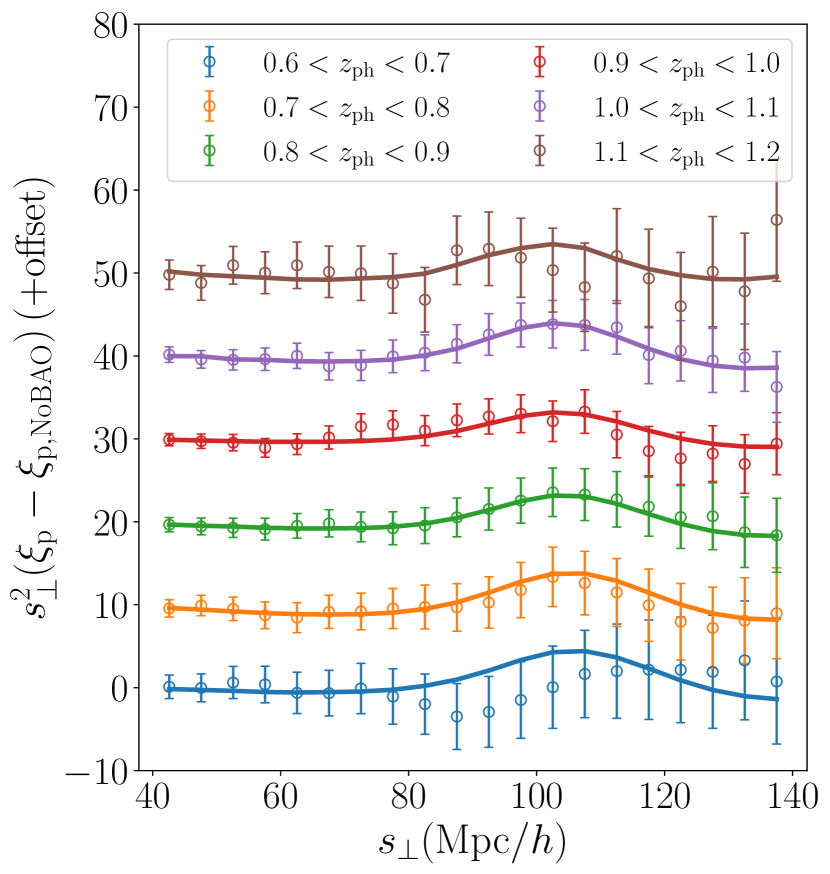
Our fiducial results are , and for ACF, APS and PCF, respectively. Our consensus measurement (combination of the three) is
| (8) | |||||
| (9) | |||||
| (10) |
where the [sys.] contribution comes from modeling and redshift calibration, see [1]. This result has a fractional error of 2.1% (the smallest for a photometric survey ever), and is consistent with Planck-2018 () at 2.13. It can also be expressed as .
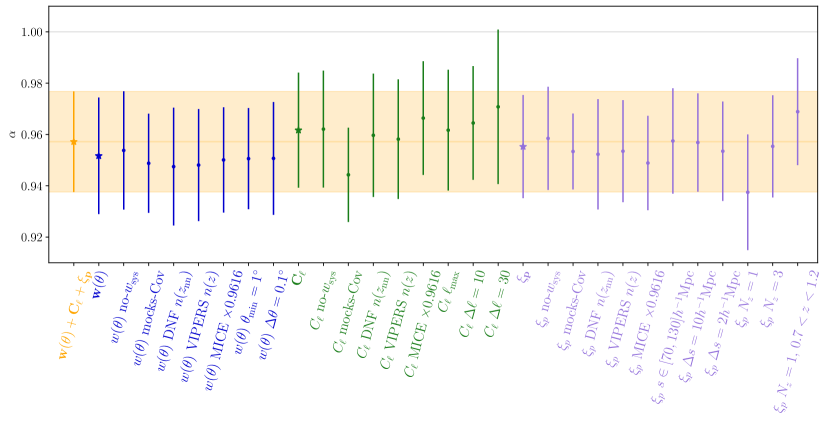
In Fig. 2, we show our main measurement, together with the results obtained with several variations of the analysis. We find that it is robust against variations in the fiducial settings, different clustering estimators and data calibration (systematics).
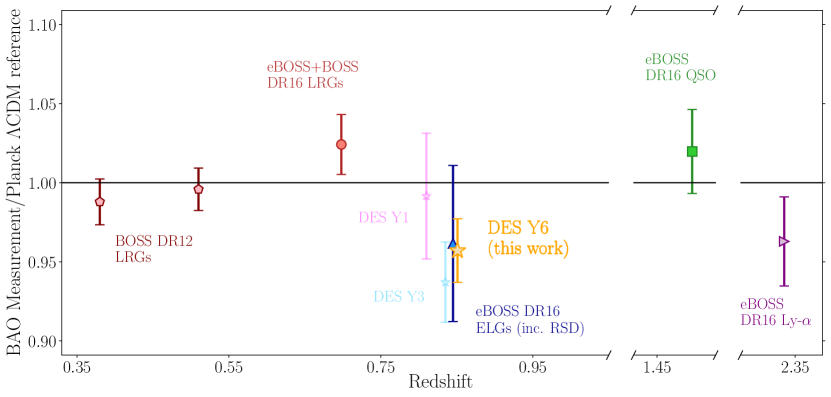
Finally, in Fig. 3 we show the angular BAO distance ladder at the end of Stage III. We find that our measurement is competitive with the results from the Sloan Digital Sky Survey (SDSS), and is the most precise one at at the end of Stage III.
References
References
- [1] Dark Energy Survey Collaboration. Phys. Rev. D, 110:063515, Sep 2024.
- [2] J. Mena-Fernández et al. Phys. Rev. D, 110:063514, Sep 2024.
- [3] Dark Energy Survey Collaboration. arXiv preprint arXiv:2401.02929, 2024.
- [4] I. Ferrero et al. Astronomy & Astrophysics, 656:A106, 2021.
- [5] Planck Collaboration. A&A, 641:A6, September 2020.
- [6] M. Rodríguez-Monroy et al. MNRAS, 511(2):2665–2687, April 2022.