Personalized Weight Loss Management through Wearable Devices and Artificial Intelligence
Abstract
Early detection of chronic and Non-Communicable Diseases (NCDs) is crucial for effective treatment during the initial stages. This study explores the application of wearable devices and Artificial Intelligence (AI) in order to predict weight loss changes in overweight and obese individuals. Using wearable data from a 1-month trial involving around 100 subjects from the AI4FoodDB database, including biomarkers, vital signs, and behavioral data, we identify key differences between those achieving weight loss ( 2% of their initial weight) and those who do not. Feature selection techniques and classification algorithms reveal promising results, with the Gradient Boosting classifier achieving 84.44% Area Under the Curve (AUC). The integration of multiple data sources (e.g., vital signs, physical and sleep activity, etc.) enhances performance, suggesting the potential of wearable devices and AI in personalized healthcare.
Index Terms:
Wearable Devices, Personalized Healthcare, Weight Loss, Nutrition, Artificial Intelligence, AI4FoodDBI Introduction
Non-Communicable Diseases (NCDs) represent 74% of all deaths globally, and traditional healthcare methods fail to curb the increase of NCDs in current society [1]. Most NCDs are influenced by highly modifiable factors, such as nutrition, Physical Activity (PA), Sleep Activity (SA), and medication, as well as unmodifiable factors like age, gender, genetics, and socio-cultural influences [2]. In 2022, according to the World Health Organization (WHO), 81% of adolescents and 27.5% of adults fail to meet the minimum PA guidelines, which recommend at least 150 minutes of moderate-intensity PA or 75 minutes of vigorous-intensity PA per week [3, 4]. The COVID-19 pandemic has further aggravated the reduction in PA, contributing to increased rates of obesity and related NCDs, such as heart diseases and type 2 diabetes [5]. To put some figures, in 2022 approximately 2.5 billion adults were overweight, and over 890 million suffered from obesity [6].
Promoting a healthy lifestyle and behaviors can significantly reduce potential risk factors associated with NCDs. However, the increasing global population, healthcare costs, and limited access to individualized medical attention present major challenges to effective healthcare delivery [8]. In this context, personalized healthcare, which integrates digital and non-digital data, is becoming very important in order to alleviate the financial and personnel burdens on the healthcare system. Advances in digital technologies, such as the Internet of Things (IoT), have led to the development of new sensors and wearable devices that enable Human-Computer Interactions (HCI). Initially, these devices focused on recording exercise and Heart Rate (HR), but current sensors also measure various physiological parameters not only for detecting any pathological issue but also for monitoring the lifestyle and behavior of individuals [9]. These technologies facilitate the creation of digital twins, which allow for continuous monitoring and rapid communication between patients and healthcare professionals, consequently, reducing the healthcare system workloads [10, 11].
Artificial Intelligence (AI), particularly approaches based on Machine Learning (ML) and Deep Learning (DL), are essential for processing the vast amounts of continuous data generated by wearable devices. These techniques can detect minor physiological changes from baseline values, enabling the development of personalized models that outperform traditional population-level models [12].
Furthermore, the use of wearable devices and smartphones has grown exponentially over the past decade, generating significant social and economic impacts [13]. These devices facilitate rapid data transfer, automatic self-monitoring, and the generation of digital health information that promotes behavioral changes and health improvements. Therefore, society is increasingly adopting self-monitoring practices for tracking lifestyle, PA, SA, nutrition, and overall health status [14, 15]. However, several challenges remain in leveraging these technologies effectively. Different companies develop sensors that track similar physiological parameters, leading to a need for standardization in both sensor specifications and data processing. Additionally, data accessibility and privacy face several challenges [16]. First, most consumer-based wearable devices are designed for emerging adults and are often unaffordable for low-income and minority populations. Also, there is skepticism about the use of invasive devices [17].
Digital transformation promises to enhance the patient-doctor relationship, even in the absence of apparent disease. While time is still needed to develop the precise technology that integrates all acquired data from wearable devices, progress has been made in promoting health through wearable devices that encourage PA and mental wellness by sending notifications and reports about self-monitoring [14, 18].
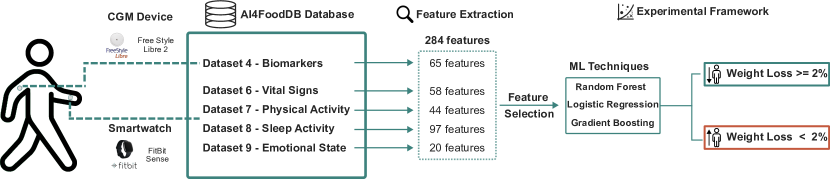
The main problem addressed in the present study is whether it is possible to predict weight loss or gain solely based on data acquired from wearable devices (smartwatches and glucose sensors). Fig. 1 provides a graphical representation of the application scenario and ML methods proposed in the present study. By analyzing extensive data collected from these devices, and using ML techniques through the proposal of a novel set of 284 features related to biomarkers, vital signs, PA, SA, and emotional state, this study aims to identify weight change patterns and predictors, enhancing weight loss management and improving the effectiveness of self-monitoring.
The remainder of the article is organized as follows. State-of-the-art studies related to the use of wearable devices and AI in predicting health outcomes are presented in Sec. II. Sec. III describes the AIFoodDB database, considered in the experimental framework of the study. Sec. IV explains the proposed methods to predict weight loss whereas Sec. V describes the experimental results. Finally, conclusions and future studies are drawn up in Sec. VI.
II Related Works
Numerous studies have demonstrated the benefits of wearable technologies and adherence to digital self-monitoring in weight loss interventions [19]. For instance, Mao et al. proved that PA interventions effectively promote weight loss in overweight and obese individuals using mobile phones as trackers [20]. In [21], they examined weight loss and maintenance by analyzing PA via accelerometer and self-report in breast cancer survivors, highlighting the importance of using wearable devices. However, most of these studies considered only a few general features derived from wearables to analyze behavioral changes related to weight loss [22, 23].
Contrarily, many other studies have considered newly implemented features extracted from wearable devices and they employ ML techniques to predict clinical outcomes using clinical data (i.e., anthropometric measurements and laboratory values) and digital data (e.g., wearable devices and digital health) [24, 25]. Table I presents some key studies found in the literature on topics related to the present study (i.e., PA and SA, emotional state, etc.).
| Authors | Study Goal | Comments | Results Achieved | |||||||||
|---|---|---|---|---|---|---|---|---|---|---|---|---|
|
|
|
Cohen’s Kappa = 0.52 | |||||||||
|
|
|
|
|||||||||
|
|
|
AUC Score = 76% | |||||||||
|
|
|
Accuracy = 87% | |||||||||
|
|
|
|
|||||||||
|
|
|
RMSE = 8.01% | |||||||||
|
|
|
|
|||||||||
|
Diseases detection |
|
Accuracy = 99.4% |
Many studies have focused on analyzing PA through wearable devices, showing their effectiveness in promoting PA and reducing sedentary lifestyles [14, 34, 35]. For example, a study by Cadmus et al. [36] involving FitBit trackers demonstrated high adherence levels to self-monitoring interventions. In glycemic health, wearable devices have been used for Blood Glucose Levels (BGL) prediction. Approaches using invasive and non-invasive CGM devices have shown promising results in predicting hyper- or hypoglycemic events [37, 38]. For instance, Duckworth et al. utilized CGM devices for hypo- and hyper-glycemia predictions using explainable machine learning algorithms [39]. Bogue-Jimenez et al. [31] estimated BGL from wristband-like devices that collected physiological measurements, and data from Electrodermal Activity (EDA) and Photoplethysmography (PPG) sensors to feed 8 different ML algorithms in the BGL detection. In [29], Bent et al. utilized 69 features from distinct sources such as smartwatches, diet, and other physiological and biological parameters to predict interstitial glucose, demonstrating the feasibility of non-invasive methods.
Heart-related monitoring using wearable devices has also been extensively studied. However, this monitoring is typically measured in controlled scenarios (i.e., hospitals) and requires a follow-up intervention. Dunn et al. [40] predicted clinical laboratory test results using data from wearable devices and feeding them into ML algorithms, showing more consistent and precise data than clinical measurements. Similarly, Kim et al. [30] developed an ML model for cardiovascular disease detection using smartwatch data. Concretely, these devices provided HR and oxygen saturation data, as well as stress markers obtained from breathing and body temperature. Meng et al. [28] utilized activity tracker data to detect health status over time in ischemic heart disease patients by using different ML algorithms. Finally, 14 distinct features were selected from activity tracker data, including physical parameters such as steps, distance, active minutes, light minutes, or sedentary minutes.
Wearable devices also effectively monitor and influence behavioral changes in SA, which can directly impact health outcomes and improve physical and mental disorders. Automatic sleep stage classification in non-controlled interventions was challenging before the AI era. Nevertheless, the spread of DL techniques has led to improvements in sleep-related tasks [41, 42]. For instance, Zhang et al. [27] used Recurrent Neural Networks (RNNs) for sleep staging with wearable devices, while Beattie et al. [26] considered automated classifiers for sleep stage classification using data from wrist-worn devices. In this last study, they captured sleep-related data from a 3D accelerometer and an optical pulse PPG to extract 180 distinct features.
Other studies have explored the use of wearables in mental health and global health issues. For example, Sadeghi et al. [32] developed a method to detect hyperarousal events in post-traumatic stress disorder individuals using wearable device data. Specifically, they acquired physiological data (i.e., HR and body acceleration) and self-reported hyperarousal events to finally feed them to ML algorithms such as Random Forest (RF), Support Vector Machine (SVM), and Logistic Regression (LR). During the COVID-19 pandemic, studies analyzed heart-related and PA data from fitness trackers, finding associations between abnormal resting HR and the illness [43, 44]. Himi et al. [33] finally presented a health mobile application that predicts multiple diseases using an RF algorithm. Data were collected from multiple sources, including anthropometric measurements, BGLs, and heart- and sleep-related data.
To summarize, studies in the literature have integrated clinical data with information extracted from wearable devices to predict various health outcomes. These studies often rely on simple external features extracted from these devices, which are sufficient to achieve their specific goals. However, to the best of our knowledge, there are no studies in the literature that have focused on the prediction of weight loss based on the information extracted from wearable devices, and the application of AI methods. This is the main motivation of the present study, which is a more specific and novel objective compared to the broader health outcomes examined in the existing literature.
III AI4FoodDB Database
The AI4Food database (AI4FoodDB) was developed from a 1-month Randomized Controlled Trial (RCT) involving 100 overweight and obese subjects who were monitored during a nutritional intervention. AI4FoodDB comprises 10 distinct datasets (DS), ranging from biological samples to continuous digital measurements, obtained from three different types of data acquisition (i.e., manual, clinical, and digital). For detailed information about the AI4FoodDB database and the RCT, please refer to [7].
In the present study, we consider digital data from datasets DS4 (Biomarkers), DS6 (Vital Signs), DS7 (Physical Activity), DS8 (Sleep Activity), and DS9 (Emotional State). Subjects wore a Freestyle Libre 2 Continuous Glucose Monitor (CGM) device to track their BGL (in mg/dL) every 15 minutes during the intervention. In addition, they wore a FitBit Sense smartwatch to track their physiological data and lifestyle habits such as PA, SA, and stress.
| Dataset | Feature |
|
|
|
P-value |
|
||||||||
|---|---|---|---|---|---|---|---|---|---|---|---|---|---|---|
| Age | 50 13 | 52 12 | 45 13 | 0.05 | 0.12 | |||||||||
| Sex (% women) | 70 % | 73 % | 65 % | 0.4 | 0.789 | |||||||||
| Anthropometric | Body Mass Index (kg) | 30.73 3.36 | 30.90 3.35 | 30.80 3.41 | 0.5 | 0.789 | ||||||||
| and | Waist-Hip Ratio | 0.88 0.10 | 0.89 0.10 | 0.88 0.10 | 0.6 | 0.789 | ||||||||
| Biochemical | Systolic Blood Pressure (mmHg) | 124 17 | 125 19 | 123 15 | 0.6 | 0.789 | ||||||||
| Statistics | Diastolic Blood Pressure (mmHg) | 78 10 | 78 10 | 78 9 | 0.4 | 0.789 | ||||||||
| High-Density Lipoprotein (mg/dL) | 59 14 | 58 13 | 61 15 | 0.2 | 0.615 | |||||||||
| Triglycerides (mg/dL) | 107 46 | 111 53 | 100 35 | 0.5 | 0.789 | |||||||||
| DS4 (Biomarkers) | Glucose in mg/dL | 100.05 7.25 | 100.87 8.06 | 98.85 5.76 | 0.188 | 0.615 | ||||||||
| HB1Ac | 5.11 0.25 | 5.14 0.28 | 5.07 0.20 | 0.188 | 0.615 | |||||||||
| Glucose variability (coefficient of variation) | 15.85 3.71 | 16.64 3.97 | 14.68 2.96 | 0.011 | 0.137 | |||||||||
| % time in target values (70-180 mg/dL) | 98.01 3.6 | 97.72 4.1 | 98.44 2.8 | 0.347 | 0.789 | |||||||||
| DS6 (Vital Signs) | Heart rate in b.p.m. | 75.74 6.42 | 75.81 6.49 | 75.63 6.42 | 0.896 | 0.946 | ||||||||
| Resting heart rate | 62.84 7.45 | 62.78 7.34 | 62.93 7.72 | 0.922 | 0.946 | |||||||||
| Heart rate during physical activity | 101.23 9.52 | 100.81 9.22 | 101.84 10.03 | 0.612 | 0.789 | |||||||||
| Heart rate during non-REM sleep | 60.03 7.94 | 59.56 8.01 | 60.72 7.89 | 0.494 | 0.789 | |||||||||
| Heart rate during Electrocardiogram session | 69.93 9.16 | 69.76 9.28 | 70.22 9.09 | 0.828 | 0.920 | |||||||||
| DS7 (Physical Activity) | Calories | 2,983 459 | 3,019 389 | 2,932 432 | 0.371 | 0.838 | ||||||||
| Steps | 11,051 3,760 | 11,356 3,800 | 10,601 4,145 | 0.342 | 0.789 | |||||||||
| Nº physical activities performed | 14.89 10 | 14.20 10 | 15.92 10 | 0.429 | 0.789 | |||||||||
| Duration of physical activities in minutes | 37.73 17.07 | 38.78 19.39 | 36.19 12.99 | 0.472 | 0.789 | |||||||||
| Sedentary minutes | 12h 00min 1h 39min | 11h 57min 1h 35min | 12h 04min 1h 45min | 0.725 | 0.853 | |||||||||
| % days with 10 lightly active minutes | 99.75 2.38 | 99.59 3.08 | 100.00 0.00 | 0.413 | 0.789 | |||||||||
| % days with 10 moderately active minutes | 68.27 21.45 | 68.95 23.25 | 67.28 18.74 | 0.866 | 0.853 | |||||||||
| % days with 10 very active minutes | 65.52 25.65 | 65.98 27.31 | 64.86 23.34 | 0.912 | 0.946 | |||||||||
| MVPA minutes | 66.11 42.27 | 68.18 49.41 | 63.05 29.08 | 0.566 | 0.789 | |||||||||
| DS8 (Sleep Activity) | Oxygen saturation during sleep | 94.08 1.25 | 94.00 1.30 | 94.20 1.18 | 0.456 | 0.789 | ||||||||
| Sleep duration | 7h 01min 0h 52min | 6h 54min 0h 54min | 7h 11min 0h 46min | 0.109 | 0.483 | |||||||||
| Awake duration | 0h 54min 0h 12min | 0h 55min 0h 12min | 0h 53min 0h 11min | 0.658 | 0.822 | |||||||||
| Light sleep duration | 3h 49min 0h 37min | 3h 47min 0h 34min | 3h 52min 0h 40min | 0.565 | 0.789 | |||||||||
| Deep sleep duration | 1h 01min 0h 14min | 0h 58min 0h 15min | 1h 04min 0h 12min | 0.059 | 0.295 | |||||||||
| REM sleep duration | 1h 17min 0h 19min | 1h 14min 0h 19min | 1h 22min 0h 18min | 0.034 | 0.260 | |||||||||
| Sleep score | 74.82 4.27 | 74.10 4.78 | 75.80 3.15 | 0.046 | 0.260 | |||||||||
| Weekdays sleep score | 74.68 4.45 | 73.91 4.92 | 75.89 3.42 | 0.042 | 0.260 | |||||||||
| Weekend days sleep score | 75.10 4.83 | 74.86 4.87 | 75.47 4.81 | 0.552 | 0.789 | |||||||||
| DS9 (Emotional State) | Stress score | 77.29 4.54 | 75.70 4.64 | 79.84 3.04 | 0.05 | 0.12 | ||||||||
| Responsiveness points | 22.64 2.51 | 21.87 2.21 | 23.87 2.54 | 0.782 | 0.894 | |||||||||
| Exertion points | 23.59 2.47 | 23.50 2.79 | 23.73 1.93 | 0.156 | 0.615 | |||||||||
| Sleep points | 31.06 4.05 | 30.33 4.56 | 32.24 2.84 | 0.05 | 0.137 |
Table II provides descriptive statistics of AI4FoodDB’s subjects, showing the mean and standard deviation values of anthropometric and biochemical statistics, and some of the most important features from each dataset. We report the statistics for the total population (93 subjects), subjects who lost 2% of their initial weight (55 subjects), and subjects who did not (38 subjects). P-values are also presented to indicate the statistical significance of differences between both groups.
Overall, the primary differences between both groups were observed in glucose variability and emotional state metrics (stress and sleep points). However, many of these differences did not retain statistical significance. These findings indicate that, despite some observable trends, there are no robust, statistically significant differences between the groups across the evaluated features.
IV Proposed Method
This section describes the method proposed to predict weight loss using information extracted from wearable devices and the application of ML models. In particular, Sec. IV-A describes the novel set of features proposed in the present study. Sec. IV-B provides a statistical analysis of these features whereas Sec. IV-C details the feature selection algorithms studied. Finally, Sec. IV-C provides a description of the ML classifiers analyzed.
IV-A Proposed Features
The data used for feature extraction were obtained from the AI4FoodDB during the digital intervention, i.e., when subjects wore wearable devices. Specifically, each individual’s device tracked approximately 14 days of behavioral information, including continuous data (e.g., heart rate and blood glucose levels) and discrete data (e.g., hours of sleep and minutes of light active). For additional details about the data acquisition process, please refer to [7]. Once the raw data are extracted from each subject’s device, a preprocessing step is carried out. This includes a standardization process, where the raw data are filtered and formatted consistently, and the removal of unnecessary information. After preprocessing, feature extraction is performed on the processed data, proposing a novel set of 284 features from five datasets. We briefly describe the features extracted for each dataset below (for more details, we refer the reader to Tables VA and VB in Appendix A):
-
•
Dataset 4 - Biomarkers: The first 65 features are directly related to glucose levels and include five different subfeatures corresponding to five parts of the day: all day, morning (6h-12h), afternoon (12h-18h), evening (18h-24h), and night (0h-6h). These features are either directly extracted from blood sugar levels or derived from equations (e.g., HB1Ac average and glucose variability). Descriptive statistical features (e.g., average, standard deviation, variance, maximum, minimum, and range) are included from features 1 to 30. Features 31 to 65 represent the percentage of glucose levels in different ranges: very high values ( 250 mg/dL), high values (181-250 mg/dL), target values (70-180 mg/dL), low values (54-69 mg/dL), and very low values ( 54 mg/dL).
-
•
Dataset 6 - Vital Signs: Features from 66 to 123 (58 features) describe HR and Electrocardiogram (ECG) sessions. Similar to Dataset 4, the first 30 features provide descriptive statistical information about HR, divided into five parts of the day. Eight features correspond to the average and standard deviation of HR-related measurements during various times of the day (e.g., resting, during PA, during non-REM sleep, and the root mean square of successive differences (RMSSD) during sleep). The remaining 20 features include information about HR from EDA sessions and the ECG session waveform slopes.
-
•
Dataset 7 - Physical Activity: Features from 124 to 167 (44 features) are related to the PA during the intervention. Key features include calories, steps, and minutes in different HR zones (fat burn, cardio, and peak) and PA levels (sedentary, lightly, moderately, and very active). Additional features include the percentage of days with 10+ minutes of various activity levels, Moderate to Vigorous Physical Activity (MVPA) minutes, and similar features related to PA.
-
•
Dataset 8 - Sleep Activity: A total of 97 sleep-related features are extracted. General features include information about oxygen saturation, temperature, breathing rate across sleep stages, and detailed sleep scores from FitBit (composition, revitalization, and duration subscores). Specific features cover sleep efficiency, sleep start and end time, night awakenings, regular wake-up and bedtime, and the individuals’ restlessness.
-
•
Dataset 9 - Emotional State: This dataset includes 20 features related to mental health. The first eight features provide information about the FitBit stress score, comprising sleep, responsiveness, and exertion points. The remaining features include descriptive statistics of Skin Conductance Levels (SCL) from EDA sessions.
IV-B Features Analysis
Multimodal data from different sources and types are often noisy and not always comparable. Feature extraction, which transforms general into specific information, yields a better data representation. Additionally, normalized and similarly scaled data can reveal correlations among different datasets. In this study, we use the Pearson’s Correlation Coefficient (PCC) [45], a widely used correlation measure to assess the linear correlation between features, as shown in Eq. 1:
| (1) |
Given two features and , the covariance between them is divided by the product of their standard deviations ( and ). The resulting ranges from to , indicating the correlation degree. A negative PPC () indicates a negative linear correlation between and , whereas a positive PPC () implies a positive linear correlation. A value of 0 means no correlation. Absolute values greater than 0.6 indicate a strong correlation whereas higher than 0.8 indicate an extremely strong correlation.
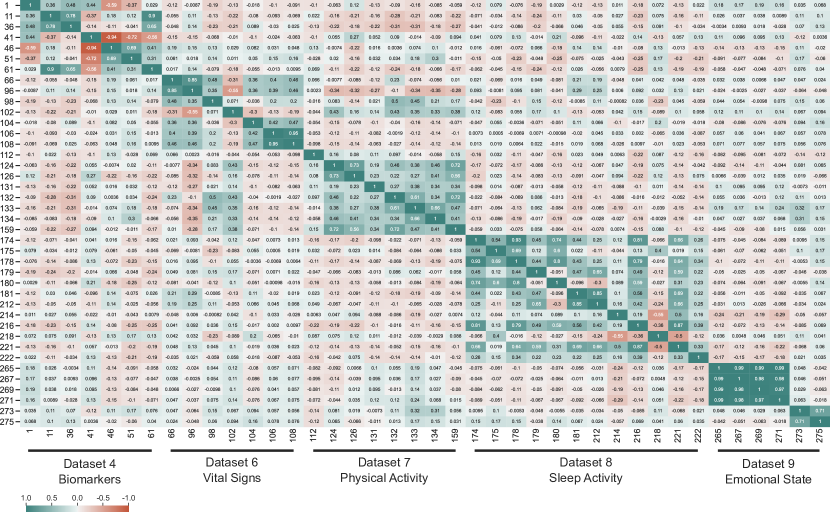
In this study, we compute the PPC of all the proposed 284 features. Fig. 2 shows the Pearson’s correlation matrix for the most representative features (the feature numbers correspond to those in Tables VA and VB in Appendix A). Positive and negative PPCs are marked in gradients of turquoise and red, respectively. We observe numerous strong correlations among features within the same dataset, indicating linear relationships. For instance, positive correlations are seen between the variance of glucose and times in high values (features 11 and 36 from DS4), HR and resting HR (features 66 and 96 from DS6), calories and MVPA minutes (features 124 and 159 from DS7), asleep minutes and duration score (features 174 and 216 from DS8), and stress scores and related points (features 265, 267, 269, and 271 from DS9). Conversely, a strong negative correlation is found between times in target values and the times in low and very low values (features 41, 46, and 51, respectively, from DS4), showing an inverse proportionality.
However, there is no evidence of strong correlations between features from different datasets, which could be due to several factors. Relationships between these features might be weak and non-linear, while features from the same dataset present strong linear correlations. Different data acquisition devices could introduce variability and noise. Additionally, individual differences in physiological responses and lifestyle factors might result in inter-subject variability, complicating the detection of correlations.
IV-C Feature Selection
This section describes the feature selection techniques used to identify the most discriminative features for the prediction of weight loss [46, 47]. Many of the initial 284 features may not contribute to distinguishing between subjects who lost weight and those who did not, leading to noise in the data. Therefore, feature selection is necessary to choose those features that minimize the intra-class variability and maximize the inter-class distance.
-
•
Sequential Forward Floating Search (SFFS) is one of the most used feature selection techniques, starting with an empty set of features and adding one feature at a time if the current feature improves the model’s performance [48]. The estimator uses a cross-validation score to choose the best set of features.
-
•
Boruta Selection (BS) is an algorithm designed to identify all relevant features by leveraging RF as its classifier. Additionally, this algorithm incorporates feature correlations to add the most discriminative ones [49].
-
•
Genetic Algorithm (GA) is inspired by the natural process of evolution. Concretely, GA utilizes stochastic processes mimicking genetic variation, recombination, and selection to iteratively optimize solutions through evolutionary mechanisms [50].
IV-D Classification Algorithms
-
•
Random Forest (RF) is an ensemble method using multiple decision trees, called estimators, to predict outcomes by combining their decisions.
-
•
Logistic Regression (LR) is a statistical method analyzing datasets with one or more independent variables to determine an outcome measured. LR estimates the probability that a given input point belongs to a certain class.
-
•
Gradient Boosting (GB) is an ensemble learning technique used for regression and classification tasks. It builds the model using decision trees and combines them to create a strong predictive model, with each new tree correcting errors made by previous trees.
V Experimental Framework
V-A Protocol
The current study aims to predict whether a person has lost more than 2% of their initial weight using only digital data acquired from wearable devices. This value was selected following nutrition guidelines for the specific duration of our intervention (1 month). From the total 93 final subjects, 55 (59.14%) lost more than the target percentage, whereas the remaining 38 subjects (40.86%) lost less than 2% of the weight or even gained weight. Due to the size of the database, we follow the popular leave-one-out cross-validation method in the experiments. Specifically, one subject per class is evaluated during each split, and every subject is evaluated at least once. To ensure the robustness and reliability of our experimental protocol, we conduct five runs of the experiments using optimal hyperparameters for all models and different random seeds. Then, we compute the mean of the five runs within the same experiment, obtaining a more stable estimation of the model’s performance metrics.
| SFFS |
|
|
|
|||||||
| DS4: Biomarkers | ||||||||||
| RF | 64.45 | 72.37 | 60.82 | 59.46 | ||||||
| LR | 69.86 | 74.69 | 62.00 | 67.45 | ||||||
| GB | 66.11 | 72.93 | 54.88 | 55.42 | ||||||
| DS6: Vital Signs | ||||||||||
| RF | 68.20 | 75.83 | 55.93 | 59.39 | ||||||
| LR | 52.39 | 58.33 | 52.46 | 51.84 | ||||||
| GB | 71.61 | 76.86 | 64.09 | 63.57 | ||||||
| DS7: Physical Activity | ||||||||||
| RF | 67.88 | 69.31 | 62.54 | 63.78 | ||||||
| LR | 55.41 | 61.24 | 57.86 | 55.02 | ||||||
| GB | 67.06 | 63.52 | 75.65 | 65.49 | ||||||
| DS8: Sleep Activity | ||||||||||
| RF | 63.88 | 71.72 | 61.46 | 62.22 | ||||||
| LR | 54.36 | 60.77 | 56.26 | 54.83 | ||||||
| GB | 62.34 | 66.97 | 54.33 | 52.61 | ||||||
| DS9: Emotional State | ||||||||||
| RF | 52.54 | 51.89 | 42.88 | 47.71 | ||||||
| LR | 48.72 | 52.86 | 50.13 | 48.18 | ||||||
| GB | 57.51 | 53.73 | 55.32 | 57.83 | ||||||
| Combined Datasets | ||||||||||
| RF | 79.22 | 79.15 | 72.12 | 69.12 | ||||||
| LR | 65.88 | 72.06 | 71.05 | 67.72 | ||||||
| GB | 84.44 | 82.96 | 70.80 | 56.33 | ||||||
The experimental protocol is divided into six different scenarios regarding the dataset utilized in each one. Therefore, there are five scenarios corresponding to DS4 (Biomarkers), DS6 (Vital Signs), DS7 (Physical Activity), DS8 (Sleep Activity), and DS9 (Emotional State). The remaining scenario is the combination of all datasets. This analysis allows to measure the contribution of each independent source of information, and the combination of all of them.
| Dataset | Feature (#) | ||
|---|---|---|---|
| std of glucose in the afternoon (8) | |||
| std of glucose in the evening (9) | |||
| % time in high values all day (36) | |||
|
|||
| HB1Ac avg all day (56) | |||
| HB1Ac avg in the afternoon (58) | |||
| glucose variability in the morning (62) | |||
| DS4 | glucose variability in the afternoon (63) | ||
| DS6 | avg RMSSD during sleep (102) | ||
| std of calories (125) | |||
| std of steps (127) | |||
| std of distance (129) | |||
| avg sedentary minutes last week (138) | |||
| avg minutes below default zone 1 (146) | |||
| DS7 | avg MVPA minutes last week (167) | ||
| std of oxygen saturation during sleep (168) | |||
|
|||
| avg asleep duration (174) | |||
| std of std of REM sleep breathing rate (201) | |||
| avg revitalization score (214) | |||
| std of revitalization score (215) | |||
| avg total overall sleep score (220) | |||
| avg weekdays overall sleep score (221) | |||
| avg total sleep end time (232) | |||
| DS8 | avg weekdays sleep end time (233) |
V-B Results
Table III provides the results achieved considering different state-of-the-art feature selection techniques and classifiers. An additional table with detailed experimental results can be found in Table VI in Appendix A, where additional ML algorithms are used to compare various classifiers and feature selectors, including Support Vector Machine (SVM), Multilayer Perceptron (MLP), and K-Nearest Neighbors (KNN). The metric used is the Area Under the Curve (AUC) for all models (%). We highlight the best performance for each scenario and feature selection technique in bold. As can be seen in Table III, the best results are achieved when we combine all sources of information (i.e., the combined datasets scenario) with results over 80% AUC for the GB classifier and SFFS (84.44% AUC) and Boruta Selection (82.96% AUC) techniques.
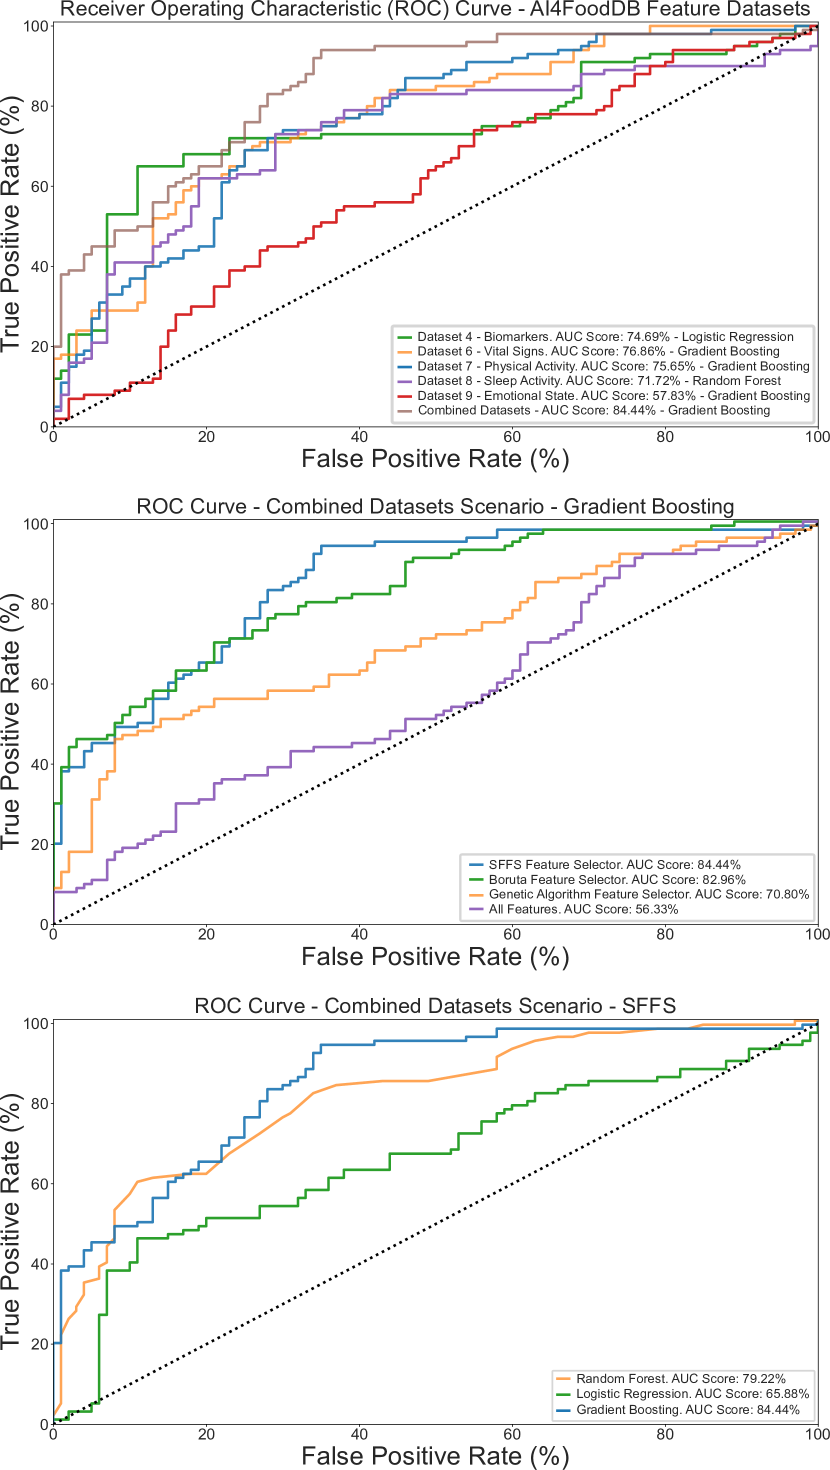
To visually represent the performance of each scenario, Fig. 3 shows the Receiver Operating Characteristic (ROC) curves with the bests configurations involving various feature selectors and classifiers. The curves plot the True Positive Rate (TPR, Sensitivity) against the False Positive Rate (FPR, 100-Specificity) for multiple classification thresholds. In the first figure (top), the ROC curve in the combined datasets scenario demonstrates again the best performance in general (84.44% AUC), with a TPR that remains linear up to reaching 92% for a 36% FPR. Beyond this point, the curve increases slowly until reaching a TPR of around 98% for a FPR of 60%. Conversely, the ROC curve for DS9 (i.e., Emotional State) shows the lowest performance, characterized by instability from the beginning to the end. The second figure (middle) focuses on the GB models, comparing their performance across different feature selectors in the combined datasets scenario. The third figure (bottom) illustrates the models for the combined datasets scenario using the SFFS feature selector, where the LR achieves an AUC score of 65.88%, and the RF model achieves an AUC score of 79.22%.
V-C Best Configuration Analysis
In the best configuration achieved (i.e., combined datasets scenario, using GB classifier and SFFS feature selector), from the original 284 features extracted, a total of 25 features were finally selected. These features, derived from multiple datasets, play a crucial role in differentiating between individuals who achieved a weight loss of at least 2% and those who did not. Specifically, 8 features are derived from glucose levels (DS4), 1 from HR-related data (DS6), 6 from PA parameters (DS7), and the 10 remaining from sleep features (DS8). Table IV describes the final 25 features and their respective datasets. Features from all datasets have been selected for this configuration, apart from the Emotional State dataset (DS9), highlighting the importance of combining multiple sources of information for the final decision.
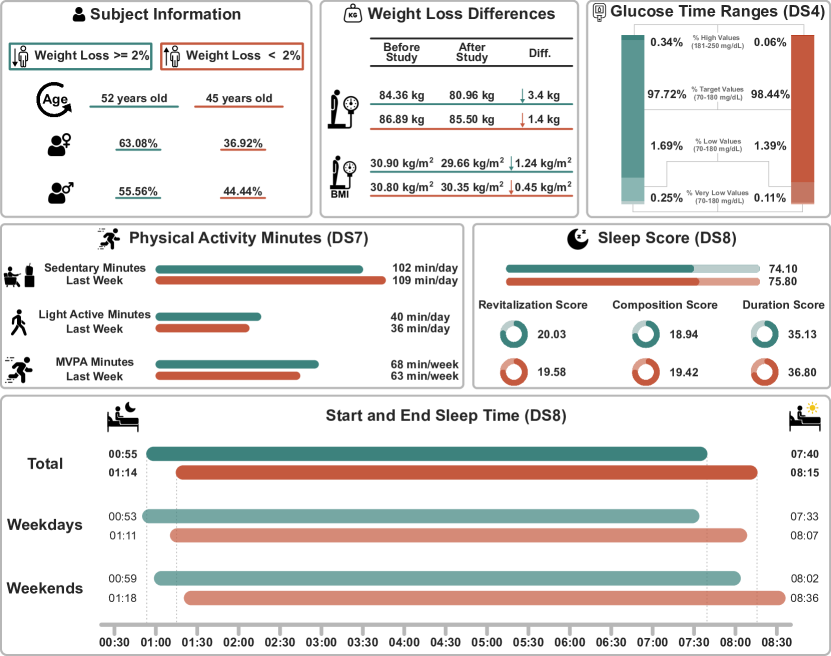
For completeness, we show in Fig. 4 a comparative analysis of various health metrics between both groups. Although the statistical differences between the two groups for each feature are minimal, they still contribute significantly to the model’s decision-making process. Concretely, some of the 25 selected features reflect differences between both groups. For instance, the ”% time in high values all day” feature in DS4 is almost 6 times higher in people who lost weight (0.34 vs 0.06%). Features like ”avg sedentary minutes last week” and ”avg MVPA minutes last week” in DS7 also show slight differences. People who lost more weight engaged in more MVPA minutes in the last seven days (68 vs 63 minutes per week) and had fewer sedentary minutes (102 vs 109 minutes per day). PA, primarily aerobic and resistance training, is part of the first-line treatments in weight loss interventions and has proven benefits beyond weight loss, contributing to a decreased risk of NCDs [51]. In general, both groups had similar SA patterns in terms of scores. However, those who did not lose weight tended to go to bed and wake up later, by about 20 and 35 minutes, respectively (feature ”avg total sleep end time” in DS8). Being awake when circadian rhythms promote sleep, a phenomenon called circadian misalignment, has adverse effects on metabolic health and can contribute to obesity, even with small misalignments such as those caused by staying up late [52]. Finally, demographic differences also play a significant role in this intervention. Individuals who lost weight were older (52 vs 45 years old), and a higher percentage of women lost weight compared to men (63.08% vs 55.56%). Furthermore, those who lost weight had a higher initial BMI compared to those who did not (30.90 vs 30.80 kg/).
V-D Case Study
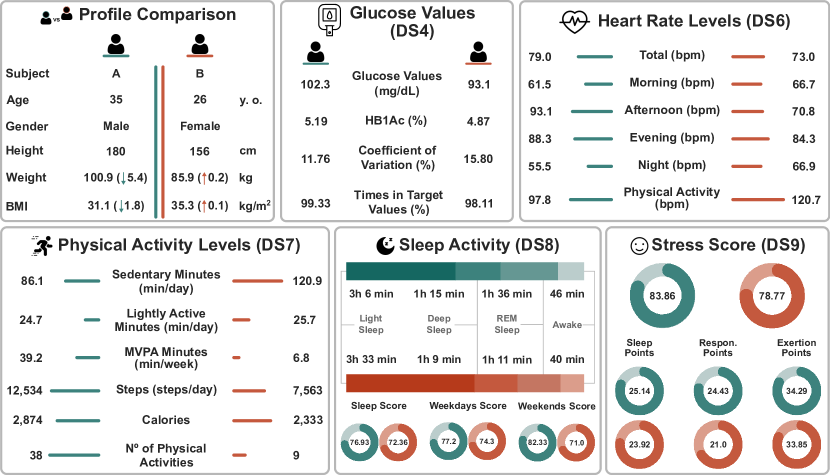
We finally analyze a case study of 2 different subjects in Fig. 5. Subject A was a 35-year-old male with an initial weight of 106.3 kg and a final weight of 100.9 kg. In contrast, subject B, who was a 26-year-old female, gained 0.2 kg (from 85.7 to 85.9 kg). In general, subject A had a higher average glucose value than subject B, but exhibited a more stable coefficient of variation (11.76% vs 15.80 %). Glucose variability can be used to assess glucose homeostasis, being in fact increased in prediabetic subjects [53, 54]. Regarding heart-related data, subject A shows a higher average HR level, but these values are much lower during the morning and night. Additionally, the pulse rate during PA was significantly lower (97.8 vs 120.7 bpm.). In terms of PA levels, subject A led a more active lifestyle: fewer sedentary minutes (86.1 vs 120.9 minutes per day), more MVPA minutes (39.2 vs 6.8 minutes per week), more steps (12,534 vs 7,563 steps), and more physical activities performed. In addition, although both subjects had similar SA levels, subject A had an average better performance in deep and REM sleep (approximately 6 and 25 minutes more in these sleep stages, respectively). Sleep scores were higher for the subject who lost more weight (76.93 vs 72.36 points): subject A slept worse during the weekdays than on weekends (77.2 vs 82.33 points), whereas subject B showed the opposite pattern (74.3 vs 71 points). Lastly, the stress score for subject A was also higher than for subject B (83.86 vs 78.77 points), indicating a less stressed lifestyle in the subject who lost weight.
These findings underscore the potential of integrating wearable device data and AI to predict weight loss outcomes in overweight and obese individuals. The collective contribution of features related to glucose variability, PA, and SA forms a comprehensive profile that effectively distinguishes between those likely to achieve significant weight loss and those who are not. While individual feature differences may be minor, their collective contribution enables the model to effectively predict weight loss outcomes.
VI Conclusion and Future Work
NCDs present a substantial challenge to contemporary society, impacting global health and economies. The exponential increase in wearable device usage and the integration of digital data are guiding us toward a future where continuous tracking of biomarkers can detect NCDs and other health-related conditions. Furthermore, recent advancements in AI enable personalized healthcare by detecting subtle changes from vast datasets for each individual. In this study, we have made an initial step towards detecting weight loss solely through data captured by wearable devices. Our results suggest that it is possible to differentiate between certain population groups with high performance, achieving over 80% AUC in several scenarios using different ML models. The best results obtained indicate that using all datasets (combined datasets scenario) from the digital database is essential to better performance. Therefore, each subject’s lifestyle markers must be considered to accurately identify those who lose weight, as these markers play a crucial role in the differentiation process. Numerous factors influence an individual’s ability to lose weight, and digital data play a crucial role in identifying societal patterns related to various lifestyles. However, digital data alone cannot clearly distinguish individuals who lose weight solely through these lifestyle changes. Further investigations including factors like genetics and diet warrant will be carried out for a comprehensive understanding of weight loss [55, 56].
Incorporating these factors, alongside biological, environmental, and lifestyle data can enhance the performance of classifiers and provide a more comprehensive understanding of the problem from a personalized perspective. In this study, most features had a global character, and local features were not explored in depth. Additionally, the unavailability of datasets that include real databases like ours limits the generalizability of the findings, and the use of synthetic data could be a potential solution [57, 58]. Future work should also focus on investigating these local features more thoroughly, as they may hold greater relevance, as shown in other tasks such as the prediction of atrial fibrillation [59]. Additionally, studies should examine the correlations between variables from different domains, such as glucose levels before and after meals, sleep patterns, HR, and stress levels before and after work or physical exercise. This would provide deeper insights into the interplay of various factors affecting weight loss and overall health.
Acknowledgments
This study has been supported by projects: AI4FOOD-CM (Y2020/TCS6654), FACINGLCOVID-CM (PD2022-004-REACT-EU), INTER-ACTION (PID2021-126521OB-I00 MICINN/FEDER), and HumanCAIC (TED2021-131787BI00 MICINN).
References
- [1] W. H. Organization, “Noncommunicable Diseases,” https://www.who.int/en/news-room/fact-sheets/detail/noncommunicable-diseases, 2023, accesed on 16 April 2024.
- [2] M. Michel and A. Burbidge, “Nutrition in the Digital Age-how Digital Tools Can Help to Solve the Personalized Nutrition Conundrum,” Trends in Food Science & Technology, vol. 90, pp. 194–200, 2019.
- [3] W. H. Organization et al., Global Status Report on Physical Activity 2022, 2022.
- [4] J. E. Donnelly, S. N. Blair, J. M. Jakicic, M. M. Manore, J. W. Rankin, B. K. Smith et al., “American College of Sports Medicine Position Stand. Appropriate Physical Activity Intervention Strategies for Weight Loss and Prevention of Weight Regain for Adults,” Medicine and science in sports and exercise, vol. 41, no. 2, pp. 459–471, 2009.
- [5] V. Natalucci, F. Marmondi, M. Biraghi et al., “The Effectiveness of Wearable Devices in Non-Communicable Diseases to Manage Physical Activity and Nutrition: Where We Are?” Nutrients, vol. 15, no. 4, p. 913, 2023.
- [6] W. H. O. M. Center, “Obesity and Overweight: Fact Sheet,” Jun. 2021.
- [7] S. Romero-Tapiador, B. Lacruz-Pleguezuelos, R. Tolosana et al., “AI4FoodDB: A Database for Personalized e-Health Nutrition and Lifestyle through Wearable Devices and Artificial Intelligence,” Database, vol. 2023, p. baad049, 2023.
- [8] F. Subhan, A. Mirza, M. B. M. Su’ud et al., “AI-enabled Wearable Medical Internet of Things in Healthcare System: A Survey,” Applied Sciences, vol. 13, no. 3, p. 1394, 2023.
- [9] D. Xu and Z. Xu, “Machine Learning Applications in Preventive Healthcare: A Systematic Literature Review on Predictive Analytics of Disease Comorbidity from Multiple Perspectives,” Artificial Intelligence in Medicine, vol. 156, p. 102950, 2024.
- [10] G. J. Williams, A. Al-Baraikan, F. E. Rademakers et al., “Wearable Technology and the Cardiovascular System: The Future of Patient Assessment,” The Lancet Digital Health, vol. 5, no. 7, pp. e467–e476, 2023.
- [11] Y. Ge, G. Zhang, M. N. Meqdad, and S. Chen, “A Systematic and Comprehensive Review and Investigation of Intelligent IoT-based Healthcare Systems in Rural Societies and Governments,” Artificial Intelligence in Medicine, vol. 146, p. 102702, 2023.
- [12] U. Pale, T. Teijeiro, S. Rheims, P. Ryvlin, and D. Atienza, “Combining General and Personal Models for Epilepsy Detection with Hyperdimensional Computing,” Artificial Intelligence in Medicine, vol. 148, p. 102754, 2024.
- [13] Z. Xie, A. Jo, and Y.-R. Hong, “Electronic Wearable Device and Physical Activity Among US Adults: An Analysis of 2019 HINTS Data,” International Journal of Medical Informatics, vol. 144, p. 104297, 2020.
- [14] T. Ferguson, T. Olds, R. Curtis et al., “Effectiveness of Wearable Activity Trackers to Increase Physical Activity and Improve Health: A Systematic Review of Systematic Reviews and Meta-analyses,” The Lancet Digital Health, vol. 4, no. 8, pp. e615–e626, 2022.
- [15] F. Patlar Akbulut, B. Ikitimur, and A. Akan, “Wearable Sensor-based Evaluation of Psychosocial Stress in Patients with Metabolic Syndrome,” Artificial Intelligence in Medicine, vol. 104, p. 101824, 2020.
- [16] P. Melzi, C. Rathgeb, R. Tolosana et al., “An Overview of Privacy-Enhancing Technologies in Biometric Recognition,” ACM Computing Surveys, 2024.
- [17] A. Zinzuwadia and J. P. Singh, “Wearable Devices—addressing Bias and Inequity,” The Lancet Digital Health, vol. 4, no. 12, pp. e856–e857, 2022.
- [18] O. H. Zahrt, K. Evans, E. Murnane et al., “Effects of Wearable Fitness Trackers and Activity Adequacy Mindsets on Affect, Behavior, and Health: Longitudinal Randomized Controlled Trial,” Journal of Medical Internet Research, vol. 25, p. e40529, 2023.
- [19] R. Berry, A. Kassavou, and S. Sutton, “Does Self-monitoring Diet and Physical Activity Behaviors Using Digital Technology Support Adults with Obesity or Overweight to Lose Weight? A Systematic Literature Review with Meta-analysis,” Obesity Reviews, vol. 22, no. 10, p. e13306, 2021.
- [20] A. Y. Mao, C. Chen, C. Magana et al., “A Mobile Phone-based Health Coaching Intervention for Weight Loss and Blood Pressure Reduction in a National Payer Population: A Retrospective Study,” JMIR mHealth and uHealth, vol. 5, no. 6, p. e7591, 2017.
- [21] T. L. Fazzino, C. Fabian, and C. A. Befort, “Change in Physical Activity During a Weight Management Intervention for Breast Cancer Survivors: Association with Weight Outcomes,” Obesity, vol. 25, no. S2, pp. S109–S115, 2017.
- [22] M. J. Hutchesson, R. Callister, P. J. Morgan et al., “A Targeted and Tailored eHealth Weight Loss Program for Young Women: The Be Positive Be Health e Randomized Controlled Trial,” in Healthcare, vol. 6, no. 2, 2018, p. 39.
- [23] K. A. Aschbrenner, J. A. Naslund, A. A. Gorin et al., “Peer Support and Mobile Health Technology Targeting Obesity-related Cardiovascular Risk in Young Adults with Serious Mental Illness: Protocol for a Randomized Controlled Trial,” Contemporary clinical trials, vol. 74, pp. 97–106, 2018.
- [24] H.-Y. Yen and H.-L. Chiu, “The Effectiveness of Wearable Technologies as Physical Activity Interventions in Weight Control: A Systematic Review and Meta-analysis of Randomized Controlled Trials,” Obesity Reviews, vol. 20, no. 10, pp. 1485–1493, 2019.
- [25] N. F. Passos, P. D. Freitas, R. M. Carvalho-Pinto, A. Cukier, and C. R. Carvalho, “Increased Physical Activity Reduces Sleep Disturbances in Asthma: A Randomized Controlled Trial,” Respirology, vol. 28, no. 1, pp. 20–28, 2023.
- [26] Z. Beattie, Y. Oyang, A. Statan et al., “Estimation of Sleep Stages in a Healthy Adult Population from Optical Plethysmography and Accelerometer Signals,” Physiological measurement, vol. 38, no. 11, p. 1968, 2017.
- [27] X. Zhang, W. Kou, I. Eric et al., “Sleep Stage Classification Based on Multi-level Feature Learning and Recurrent Neural Networks Via Wearable Device,” Computers in biology and medicine, vol. 103, pp. 71–81, 2018.
- [28] Y. Meng, W. Speier, C. Shufelt et al., “A Machine Learning Approach to Classifying Self-reported Health Status in a Cohort of Patients with Heart Disease Using Activity Tracker Data,” IEEE Journal of Biomedical and Health Informatics, vol. 24, no. 3, pp. 878–884, 2019.
- [29] B. Bent, P. J. Cho, M. Henriquez et al., “Engineering Digital Biomarkers of Interstitial Glucose from Noninvasive Smartwatches,” npj Digital Medicine, vol. 4, no. 1, p. 89, 2021.
- [30] M.-J. Kim, “Building a Cardiovascular Disease Prediction Model for Smartwatch Users Using Machine Learning: Based on the Korea National Health and Nutrition Examination Survey,” Biosensors, vol. 11, no. 7, p. 228, 2021.
- [31] B. Bogue-Jimenez, X. Huang, D. Powell et al., “Selection of Noninvasive Features in Wrist-Based Wearable Sensors to Predict Blood Glucose Concentrations Using Machine Learning Algorithms,” Sensors, vol. 22, no. 9, p. 3534, 2022.
- [32] M. Sadeghi, A. D. McDonald, and F. Sasangohar, “Posttraumatic Stress Disorder Hyperarousal Event Detection Using Smartwatch Physiological and Activity Data,” Plos one, vol. 17, no. 5, p. e0267749, 2022.
- [33] S. T. Himi, N. T. Monalisa, M. Whaiduzzaman et al., “MedAi: A Smartwatch-Based Application Framework for the Prediction of Common Diseases Using Machine Learning,” IEEE Access, vol. 11, pp. 12 342–12 359, 2023.
- [34] H.-Y. Yen, Y. Liao, and H.-Y. Huang, “Smart Wearable Device Users’ Behavior Is Essential for Physical Activity Improvement,” International Journal of Behavioral Medicine, vol. 29, no. 3, pp. 278–285, 2022.
- [35] J.-W. Kim, B. Ryu, S. Cho et al., “Impact of Personal Health Records and Wearables on Health Outcomes and Patient Response: Three-arm Randomized Controlled Trial,” JMIR mHealth and uHealth, vol. 7, no. 1, p. e12070, 2019.
- [36] L. Cadmus-Bertram, B. H. Marcus, R. E. Patterson et al., “Use of the Fitbit to Measure Adherence to a Physical Activity Intervention Among Overweight or Obese, Postmenopausal Women: Self-monitoring Trajectory During 16 Weeks,” JMIR mHealth and uHealth, vol. 3, no. 4, p. e4229, 2015.
- [37] A. Z. Woldaregay, E. Årsand, S. Walderhaug et al., “Data-driven Modeling and Prediction of Blood Glucose Dynamics: Machine Learning Applications in Type 1 Diabetes,” Artificial intelligence in medicine, vol. 98, pp. 109–134, 2019.
- [38] Y. Deng, L. Lu, L. Aponte et al., “Deep Transfer Learning and Data Augmentation Improve Glucose Levels Prediction in Type 2 Diabetes Patients,” NPJ Digital Medicine, vol. 4, no. 1, p. 109, 2021.
- [39] C. Duckworth, M. J. Guy, A. Kumaran et al., “Explainable Machine Learning for Real-time Hypoglycemia and Hyperglycemia Prediction and Personalized Control Recommendations,” Journal of Diabetes Science and Technology, vol. 18, no. 1, pp. 113–123, 2024.
- [40] J. Dunn, L. Kidzinski, R. Runge et al., “Wearable Sensors Enable Personalized Predictions of Clinical Laboratory Measurements,” Nature medicine, vol. 27, no. 6, pp. 1105–1112, 2021.
- [41] A. Mahmood, H. Kim, S. Kedia et al., “Wearable Activity Tracker Use and Physical Activity Among Informal Caregivers in the United States: Quantitative Study,” JMIR mHealth and uHealth, vol. 10, p. e40391, 2022.
- [42] M. L. Cheung, K. Y. Chau, M. H. S. Lam et al., “Examining Consumers’ Adoption of Wearable Healthcare Technology: the Role of Health Attributes,” International Journal of Environmental Research and Public Health, vol. 16, p. 2257, 2019.
- [43] H. Lukas, C. Xu, Y. Yu et al., “Emerging Telemedicine Tools for Remote COVID-19 Diagnosis, Monitoring, and Management,” ACS nano, vol. 14, no. 12, pp. 16 180–16 193, 2020.
- [44] T. Mishra, M. Wang, A. A. Metwally et al., “Pre-symptomatic Detection of COVID-19 from Smartwatch Data,” Nature biomedical engineering, vol. 4, no. 12, pp. 1208–1220, 2020.
- [45] Y. Liu, Y. Mu, K. Chen, Y. Li, and J. Guo, “Daily Activity Feature Selection in Smart Homes Based on Pearson Correlation Coefficient,” Neural Processing Letters, vol. 51, pp. 1771–1787, 2020.
- [46] R. Tolosana, R. Vera-Rodriguez, J. Ortega-Garcia et al., “Preprocessing and Feature Selection for Improved Sensor Interoperability in Online Biometric Signature Verification,” IEEE Access, vol. 3, pp. 478–489, 2015.
- [47] J. C. Ruiz-Garcia, R. Tolosana, R. Vera-Rodriguez et al., “ChildCI Framework: Analysis of Motor and Cognitive Development in Children-computer Interaction for Age Detection,” Cognitive Systems Research, vol. 86, p. 101230, 2024.
- [48] F. J. Ferri, P. Pudil, M. Hatef, and J. Kittler, “Comparative Study of Techniques for Large-scale Feature Selection,” in Machine intelligence and pattern recognition. Elsevier, 1994, vol. 16, pp. 403–413.
- [49] M. B. Kursa and W. R. Rudnicki, “Feature Selection with the Boruta Package,” Journal of statistical software, vol. 36, pp. 1–13, 2010.
- [50] O. Babatunde, L. Armstrong, J. Leng, and D. Diepeveen, “A Genetic Algorithm-Based Feature Selection,” International Journal of Electronics Communication and Computer Engineering, vol. 5, pp. 889–905, 2014.
- [51] D. E. Warburton, C. W. Nicol, and S. S. Bredin, “Health Benefits of Physical Activity: The Evidence,” CMAJ, vol. 174, no. 6, pp. 801–809, 2006.
- [52] J.-P. Chaput, A. W. McHill, R. C. Cox et al., “The Role of Insufficient Sleep and Circadian Misalignment in Obesity,” Nature Reviews Endocrinology, vol. 19, no. 2, pp. 82–97, 2023.
- [53] B. P. Kovatchev, “Metrics for Glycaemic Control - From HbA1c to Continuous Glucose Monitoring,” Nature Reviews Endocrinology, vol. 13, no. 7, pp. 425–436, 2017.
- [54] N. Chakarova, R. Dimova, G. Grozeva et al., “Assessment of Glucose Variability in Subjects with Prediabetes,” Diabetes research and clinical practice, vol. 151, pp. 56–64, 2019.
- [55] S. Romero-Tapiador, R. Tolosana, A. Morales et al., “AI4Food-NutritionFW: A Novel Framework for the Automatic Synthesis and Analysis of Eating Behaviours,” IEEE Access, 2023.
- [56] ——, “Leveraging Automatic Personalised Nutrition: Food Image Recognition Benchmark and Dataset Based on Nutrition Taxonomy,” Multimedia Tools and Applications, pp. 1–22, 2024.
- [57] P. Melzi, C. Rathgeb, R. Tolosana et al., “Gandiffface: Controllable generation of synthetic datasets for face recognition with realistic variations,” in Proc. IEEE/CVF International Conference on Computer Vision, 2023, pp. 3086–3095.
- [58] P. Melzi, R. Tolosana, R. Vera-Rodriguez et al., “FRCSyn-onGoing: Benchmarking and Comprehensive Evaluation of Real and Synthetic Data to Improve Face Recognition Systems,” Information Fusion, vol. 107, p. 102322, 2024.
- [59] P. Melzi, R. Vera-Rodriguez, R. Tolosana et al., “Prediction of Atrial Fibrillation from Sinus-Rhythm Electrocardiograms Based on Deep Neural Networks: Analysis of Time Intervals and Longitudinal Study,” IRBM, vol. 44, no. 6, p. 100811, 2023.
Appendix A
The appendix includes three tables. Tables VA and VB provide a comprehensive description of the digital data features proposed in the study. Table VI presents the results of evaluating the AI4FoodDB database using six state-of-the-art classifiers and feature selection methods, highlighting in bold the performance metrics for each approach.
| # | DS | Features | # | DS | Features | |||||
|---|---|---|---|---|---|---|---|---|---|---|
| 1-5 | 4 | average (avg) glucose | 115 | 6 | max of w.s. from ECG sessions | |||||
| 6-10 | 4 | standard deviation (std) of glucose | 116 | 6 | min of w.s. from ECG sessions | |||||
| 11-15 | 4 | glucose variance | 117 | 6 | min-max difference of w.s. from ECG sessions | |||||
| 16-20 | 4 | maximum (max) of glucose | 118 | 6 | avg std of w.s. from ECG sessions | |||||
| 21-25 | 4 | minimum (min) of glucose | 119 | 6 | std of std of w.s. from ECG sessions | |||||
| 26-30 | 4 | min-max difference of glucose | 120 | 6 | std of w.s. from ECG sessions variance | |||||
| 31-35 | 4 | % time in very high values ( 250 mg/dL) | 121 | 6 | max of std of w.s. from ECG sessions | |||||
| 36-40 | 4 | % time in high values (181-250 mg/dL) | 122 | 6 | min of std of w.s. from ECG sessions | |||||
| 41-45 | 4 | % time in target values (70-180 mg/dL) | 123 | 6 |
|
|||||
| 46-50 | 4 | % time in low values (54-69 mg/dL) | 124 | 7 | avg calories | |||||
| 51-55 | 4 | % time in very low values ( 54 mg/dL) | 125 | 7 | std of calories | |||||
| 56-60 | 4 | HB1Ac avg | 126 | 7 | avg steps | |||||
| 61-65 | 4 | glucose variability (coefficient of variation) | 127 | 7 | std of steps | |||||
| 66-70 | 6 | avg heart rate (HR) | 128 | 7 | avg distance | |||||
| 71-75 | 6 | std of HR | 129 | 7 | std of distance | |||||
| 76-80 | 6 | HR variance | 130 | 7 |
|
|||||
| 81-85 | 6 | max of HR | 131 | 7 |
|
|||||
| 86-90 | 6 | min of HR | 132-134 | 7 | avg {fat burn, cardio, peak} minutes | |||||
| 91-95 | 6 | min-max difference of HR | 135-137 | 7 | std of {fat burn, cardio, peak} minutes | |||||
| 96 | 6 | avg resting HR | 138 | 7 | avg sedentary minutes | |||||
| 97 | 6 | std of resting HR | 139 | 7 | std of sedentary minutes | |||||
| 98 | 6 | avg HR during physical activity | 140-142 | 7 |
|
|||||
| 99 | 6 | std of HR during physical activity | 143-145 | 7 |
|
|||||
| 100 | 6 | avg HR during non-REM sleep | 146 | 7 | avg minutes below default zone 1 | |||||
| 101 | 6 | std of HR during non-REM sleep | 147 | 7 | std of minutes below default zone 1 | |||||
| 102 | 6 |
|
148-150 | 7 | avg minutes in default zone {1, 2, 3} | |||||
| 103 | 6 | std of RMSSD during sleep | 151-153 | 7 | std of minutes in default zone {1, 2, 3} | |||||
| 104 | 6 |
|
154 | 7 | avg demographic VO2 max | |||||
| 105 | 6 | std of HR during EDA sessions | 155 | 7 | std of demographic VO2 max | |||||
| 106 | 6 | avg HR at the beginning of EDA sessions | 156-158 | 7 |
|
|||||
| 107 | 6 | std of HR at the beginning of EDA sessions | 159 | 7 |
|
|||||
| 108 | 6 | avg HR at the end of EDA sessions | 160 | 7 | avg sedentary minutes last week | |||||
| 109 | 6 | std of HR at the end of EDA sessions | 161-163 | 7 |
|
|||||
| 110 | 6 |
|
164-166 | 7 |
|
|||||
| 111 | 6 | std of HRV baseline during EDA sessions | 167 | 7 | avg MVPA minutes last week | |||||
| 112 | 6 | avg waveform slope (w.s.) from ECG sessions | 168 | 8 | avg oxygen saturation during sleep | |||||
| 113 | 6 | std of w.s. from ECG sessions | 169 | 8 | std of oxygen saturation during sleep | |||||
| 114 | 6 | variance of w.s. from ECG sessions | 170 | 8 |
|
| # | DS | Features | # | DS | Features | ||||
|---|---|---|---|---|---|---|---|---|---|
| 171 | 8 |
|
238-240 | 8 |
|
||||
| 172 | 8 |
|
241-243 | 8 |
|
||||
| 173 | 8 |
|
244-246 | 8 |
|
||||
| 174-175 | 8 | avg {asleep, awake} duration (minutes) | 247-249 | 8 |
|
||||
| 176-177 | 8 | std {asleep, awake} duration (minutes) | 250-252 | 8 |
|
||||
| 178-181 | 8 |
|
253-255 | 8 |
|
||||
| 182-185 | 8 |
|
256-258 | 8 |
|
||||
| 186-189 | 8 |
|
259-261 | 8 |
|
||||
| 190-193 | 8 |
|
262-264 | 8 |
|
||||
| 194-197 | 8 |
|
265 | 9 | avg stress score | ||||
| 198-201 | 8 |
|
266 | 9 | std of stress score | ||||
| 202-205 | 8 |
|
267 | 9 | avg sleep points | ||||
| 206-209 | 8 |
|
268 | 9 | std of sleep points | ||||
| 210 | 8 | avg nightly temperature | 269 | 9 | avg responsiveness points | ||||
| 211 | 8 | std of nightly temperature | 270 | 9 | std of responsiveness points | ||||
| 212 | 8 | avg composition score | 271 | 9 | avg exertion points | ||||
| 213 | 8 | std of composition score | 272 | 9 | std of exertion points | ||||
| 214 | 8 | avg revitalization score | 273 | 9 | avg skin conductance levels (SCL) | ||||
| 215 | 8 | std of revitalization score | 274 | 9 | std of SCL | ||||
| 216 | 8 | avg duration score | 275 | 9 | SCL variance | ||||
| 217 | 8 | std of duration score | 276 | 9 | max SCL | ||||
| 218 | 8 | avg restlessness | 277 | 9 | min SCL | ||||
| 219 | 8 | std of restlessness | 278 | 9 |
|
||||
| 220-222 | 8 |
|
279 | 9 | avg std of SCL | ||||
| 223 | 8 | std of overall sleep score | 280 | 9 | std of std of SCL | ||||
| 224-226 | 8 |
|
281 | 9 | std of SCL variance | ||||
| 227-228 | 8 |
|
282 | 9 | max std of SCL | ||||
| 229-231 | 8 |
|
283 | 9 | min std of SCL | ||||
| 232-234 | 8 |
|
284 | 9 |
|
||||
| 235-237 | 8 |
|
| SFFS | Boruta Selection | Genetic Algorithm | All Features | SFFS | Boruta Selection | Genetic Algorithm | All Features | |
|---|---|---|---|---|---|---|---|---|
| Dataset 4: Biomarkers | Dataset 6: Vital Signs | |||||||
| SVM | 47.96 | 64.24 | 47.00 | 48.24 | 42.82 | 45.32 | 44.02 | 43.66 |
| RF | 64.45 | 72.37 | 60.82 | 59.46 | 68.20 | 75.83 | 55.93 | 59.39 |
| LR | 69.86 | 74.69 | 62.00 | 67.45 | 52.39 | 58.33 | 52.46 | 51.84 |
| MLP | 50.70 | 74.15 | 61.93 | 51.87 | 52.00 | 63.31 | 53.15 | 45.24 |
| GB | 66.11 | 72.93 | 54.88 | 55.42 | 71.61 | 76.86 | 64.09 | 63.57 |
| KNN | 58.08 | 68.63 | 61.76 | 54.86 | 60.96 | 62.64 | 56.29 | 48.03 |
| Dataset 7: Physical Activity | Dataset 8: Sleep Activity | |||||||
| SVM | 43.71 | 50.71 | 45.65 | 46.07 | 47.61 | 58.51 | 42.84 | 42.21 |
| RF | 67.88 | 69.31 | 62.54 | 63.78 | 63.88 | 71.72 | 61.46 | 62.22 |
| LR | 55.41 | 61.24 | 57.86 | 55.02 | 54.36 | 60.77 | 56.26 | 54.83 |
| MLP | 48.70 | 51.95 | 55.85 | 45.63 | 52.06 | 72.00 | 47.53 | 48.18 |
| GB | 67.06 | 63.52 | 75.65 | 65.49 | 62.34 | 66.97 | 54.33 | 52.61 |
| KNN | 59.58 | 56.19 | 54.21 | 64.66 | 46.40 | 61.32 | 44.40 | 42.21 |
| Dataset 9: Emotional State | Combined Datasets | |||||||
| SVM | 49.39 | 51.64 | 47.34 | 47.36 | 54.48 | 66.47 | 57.48 | 52.92 |
| RF | 52.54 | 51.89 | 42.88 | 47.71 | 79.22 | 79.15 | 72.12 | 69.12 |
| LR | 48.72 | 52.86 | 50.13 | 48.18 | 65.88 | 72.06 | 71.05 | 67.72 |
| MLP | 49.32 | 54.28 | 32.61 | 51.12 | 62.72 | 69.48 | 63.68 | 57.60 |
| GB | 58.05 | 53.73 | 55.32 | 57.83 | 84.44 | 82.96 | 70.80 | 56.33 |
| KNN | 47.95 | 51.35 | 42.61 | 52.49 | 57.95 | 65.61 | 61.58 | 63.64 |