GRE2-MDCL: Graph Representation Embedding Enhanced via Multidimensional Contrastive Learning
*Corresponding author
††thanks: Identify applicable funding agency here. If none, delete this.
Abstract
Graph representation learning aims to preserve graph topology when mapping nodes to vector representations, enabling downstream tasks like node classification and community detection. However, most graph neural network models require extensive labelled data, limiting their practical applicability. To address this, researchers have explored Graph Contrastive Learning (GCL), which uses enhanced graph data and contrastive learning to better capture graph structure and features, providing new avenues for solving real-world problems with limited labelled data. Building on this, this work proposes Graph Representation Embedding Enhanced via Multidimensional Contrastive Learning (GRE2-MDCL). GRE2-MDCL first globally and locally augments the input graph using SVD and LAGNN. The enhanced data is then fed into a triple network with a multi-head attention GNN as the core model. Finally, GRE2-MDCL constructs a multidimensional contrastive loss, incorporating cross-network, cross-view, and neighbor contrast, to optimize the model. Evaluated on Cora, Citeseer, and PubMed, GRE2-MDCL achieves average accuracies of 82.5%, 72.5%, and 81.6%, outperforming baseline GCL models. Visualizations also show tighter intra-cluster aggregation and clearer inter-cluster boundaries, demonstrating the framework’s effectiveness in improving upon the baseline.
Index Terms:
Graph representation, Triple neural network, Multi-Dimensional comparative learning, Node classifiacitonI Introduction
In recent years, graph representation learning, an emerging machine learning approach, has become increasingly prevalent in fields such as social networks, knowledge graphs, and recommender systems, garnering substantial attention and research from both academia and industry. Unlike traditional classification methods, graph representation learning can effectively process graph-structured data. Its primary goal is to preserve the topological information of the graph as accurately as possible when mapping the graph structure to a low-dimensional vector space, enabling more effective data processing.
In a typical graph contrastive learning (GCL) framework, the first step is to generate differential graph-enhanced views through various graph augmentation techniques. For example, DGI [19] enhances the original graph by blending node attributes, GRACE [8] destroys the graph by uniformly removing edges and masking attributes, and MVGRL [14] enhances the input graph through graph diffusion to generate local and global structural views. GraphCL [20] involves four types of graph augmentation: node discarding, edge perturbation, attribute masking, and subgraph extraction. However, due to the diverse nature of graphs, these manual augmentations have been shown to be sensitive to different graph datasets, limiting the efficiency and generalizability of GCL methods. To address this, researchers have conducted in-depth studies on adaptive graph augmentation. Building upon GRACE, GCA [15] adaptively adjusts edge probabilities and attribute masking based on centrality heuristics. G-Mixup [21] performs data augmentation by inserting a generator with different graph classes, while AutoGCL [22] employs a set of learnable graph view generators with an automatic enhancement strategy. NCLA [18] generates a comprehensive learnable graph using a multi-head graph attention mechanism. Additionally, Bernstein polynomial approximations have been used to design and learn arbitrary graph filters [2]. In terms of spatial methods, the core operation of graph convolution is to propagate or aggregate neighborhood information directly along the edges to the central node. GAT [7] introduced a novel neural network architecture that utilizes a masked self-attentive layer to address the limitations of previous graph convolution-based methods. Inspired by GAT, Graph Converter [1] uses explicit relational encoding to allow direct communication between distant nodes, providing a more efficient approach for modeling global graph structures. Geom-GCN [3] argues that graph aggregation can benefit from the continuous space underlying the graph, proposing a replacement-invariant aggregation scheme. To address the limitations of current graph neural networks, Zhu et al. [15] emphasized the need for separating self-embedding and neighbor-embedding, combining higher-order neighborhoods, and combining intermediate representations to increase embedding capability on anisotropic graphs. Ranjan et al. [5] defined local neighbor nodes within a fixed receptive field as clusters and used the attention mechanism to compute fitness scores based on local extreme value information. BING [23] proposed a simplified heterogeneous graph structure learning model for multi-view contrast enhancement, using meta-paths to maintain semantic information and a similarity graph to optimize the graph structure without supervised signals.
Two common comparison learning objectives in graph contrastive learning (GCL) are node-graph and node-node comparison approaches. Node-graph comparison approaches compare node-level representations with graph-level representations. For example, DGI [19] compares the node representation of the original and corrupted graph with the original graph representation, while MVGRL [14] compares the nodal representation of one view with the graphical representation of other views. On the other hand, node-node comparison methods compare node-level representations between positive and negative node pairs. The GMI model [4]) compares the input neighborhood features and hidden representations of each node, while SUGRL [16] devises a multiple comparison loss to guide positive pairs to be close and negative pairs to be far apart. Many state-of-the-art node-node GCL methods use the NT-Xent loss, which has been argued to be unsuitable for GCL because connected nodes in graph data may share the same labels and should not be forced to be far apart. To address this, NCLA [18] proposes a new neighbor comparison loss that allows multiple positives for each anchor and defines positives and negatives using the network topology as a supervisory signal.
In summary, the current GCL research paradigm has explored three main aspects in depth. For graph augmentation, researchers have proposed methods such as node attribute blending, edge removal, and graph diffusion to enhance graph disparity. To address the limitations of manual augmentation, adaptive approaches have been developed, such as adjusting edge probabilities and attribute masking based on centrality heuristics. In terms of model architecture, researchers have proposed various encoder models, such as GAT, Geom-GCN, and Graph Converter. Regarding comparison learning objectives, the focus has been on node-graph and node-node comparisons, with the latter facing issues with the suitability of the NT-Xent loss for graph data.
Building upon this prior research, this work comprehensively improves the model by introducing a triple-twin network architecture, combining local-global graph augmentation, and applying multi-dimensional comparison learning to address the problems in the related fields.
II GRE2-MDCL Model Construction
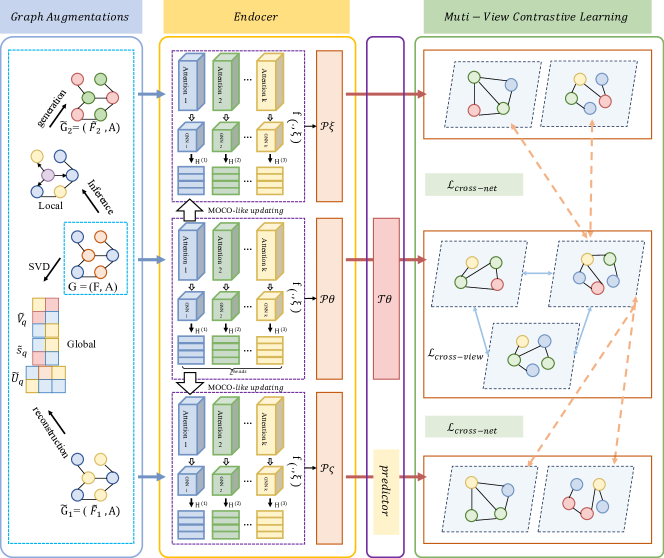
In this paper, we propose a new algorithm, GRE2-MDCL, to learn node representations through the framework of triple graph neural networks and multidimensional graph contrast learning. As shown in Fig. 1, the model in this paper mainly consists of three parts: graph enhancement, triple graph neural network and multi-dimensional graph comparison learning. When performing model training, this paper first generates two augmented graph views, denoted as and , based on the original view , and then inputs them into a triple graph neural network, the main model of each network of the triple graph neural network is a multi-head attention graph neural network, and in addition, the online network adds an extra predictor compared with the target network to satisfy the heterogeneity of the model. Afterwards, the three views are processed by the online network and the two target networks thus obtaining node representations for different views and different networks. And then, different graph comparison methods are constructed in multiple dimensions in the potential space, and the loss obtained from comparison learning is used to continuously guide the model to update the parameters and apply the trained embedded representations to the downstream tasks.
Graph data enhancement is a key component of self-supervised visual representation learning. In GRE2-MDCL, this paper firstly selects the LAGNN approach and the retrograde local graph enhancement to solve the problem of insufficient graph neural network expressive ability when the number of nodes is small in graph comparison learning. Secondly, in order to make the graph comparison learning have the ability of global structure learning and avoid destroying the global structure or important topological features of the graph, the SVD scheme is chosen for global graph data enhancement.
II-A LAGNN
In this paper, we draw on the local graph enhancement approach in the LAGNN model to enhance the original data, which generates more features in the local neighbourhood, especially for nodes with few neighbours to enhance the expressive power of various GNNs. In order to generate more features in the neighbourhood , of node , the distribution of features of its neighbouring nodes needs to be known. Since this distribution is associated with the central node , the LAGNN learns by generating models based on the features of the central node.
LAGNN uses conditional variational autoencoders to learn the conditional distribution of the node features of the connected neighbour nodes of a given central node . In CVAE, is used as a condition since the distribution of is related to . The latent variable is generated by the prior distribution and is generated by the generative distribution , where . Let denote the variational parameter and denote the generating parameter. is shown in Equation (1) as follows:
| (1) | ||||
And the evidence lower bound (ELBO) can be expressed as shown in Equation (2):
| (2) | ||||
In the training phase, the goal of LAGNN is to use neighbour pairs as inputs to maximise the ELBO, i.e., Equation (2). In the generation phase, LAGNN uses node features as conditions and samples a latent variable from a standard normal distribution as input to the decoder, and then obtains a vector of generated features associated with node to generate a locally enhanced graph .
This approach not only reduces the computational cost by generating a model that learns the conditional distribution of all nodes on the graph compared to training a generative model for each node. Also the feature vector of a specific node can be applied as an input during the generation process and the feature vectors associated with that node can be generated, which has better scalability and generalisation ability.
II-B SVD Graph Enhancement
Singular value decomposition is a method to decompose a matrix into singular vectors and singular values. Specifically, in this paper, the SVD operation is first performed on the feature matrix , i.e., . Where, , are column orthogonal matrix and row orthogonal matrix are the diagonal matrices storing the singular values of the feature matrix , respectively. The singular values indicate the importance of the matrix in different directions, the singular vectors corresponding to the first ranked singular values usually contain the most important information the largest singular values, associated with the principal components of the matrix. Retaining the largest singular values and the corresponding singular vectors achieves data enhancement by retaining the most important information, i.e., the most dominant features of the data and ignoring the minor features that have less impact on the overall data. Therefore, in this paper, the list of singular values is truncated to keep the larger singular values and the truncated reconstructed normalised adjacency matrix is used to obtain the globally enhanced view .
II-C Multi-Dimensional Contrastive Learning
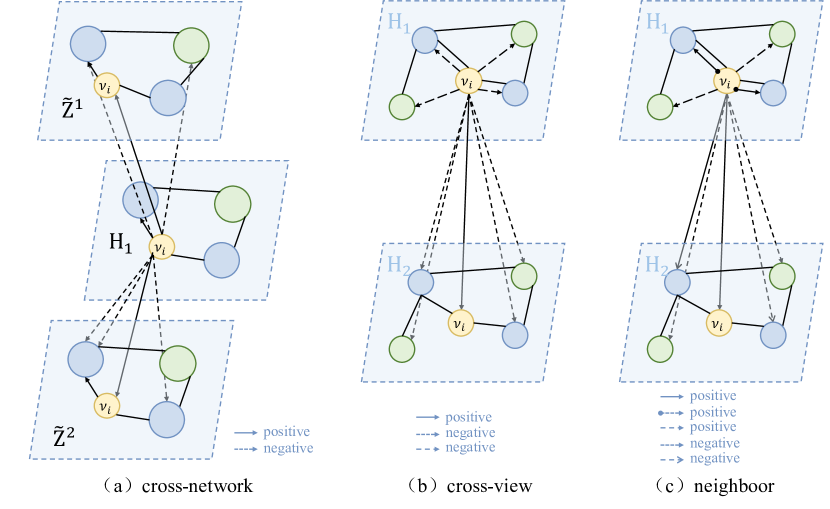
Contrastive learning, a widely used unsupervised data augmentation method, has demonstrated excellent performance across various domains. By constructing pairs of positive and negative samples and training a model to make the positive samples as close to each other as possible and the negative samples as far apart as possible, contrastive learning enables the model to extract more accurate and informative representations. In this work, three modes of comparison are integrated to construct sample pairs at the node level: cross-network comparison, cross-view comparison, and neighbor comparison. The schematic diagrams of these comparison modes are shown in Fig. 2. (See the appendix for details of the specific proof of derivation.)
II-C1 Cross-network Contrastiveness
In this paper, cosine similarity (sim) is chosen to measure the degree of similarity between two nodes, and by adopting the logarithmic form in order to facilitate the calculation of entropy for similarity. Meanwhile, the hyperparameter is introduced to measure the rate of information transfer between networks due to the emphasis on the guiding role of the online network to the target network. Therefore, the crossnetwork comparison loss function of is shown in Equation (3) as follows:
| (3) | ||||
Similarly, the cross-network comparison loss for is as follows Equation (4):
| (4) | ||||
After obtaining the inter-network loss functions, they are combined by taking the arithmetic mean to obtain the final cross-network comparison loss ; as shown in Equation (5):
| (5) |
II-C2 Cross-view Contrastiveness
Cross-view comparison works by bringing the representations of the same nodes in the two augmented views closer together while pushing the other nodes out of the way, similar to the objective function used in the previous section, and the loss of inter-view comparison for view 1 can be expressed as shown in Equation (6):
| (6) |
Similarly, the of view 2 can be obtained in the same way. On the other hand, as shown by the dashed line in Fig. 3(b), the intra-view comparison treats all nodes except the anchor node as negative numbers within a particular view. Thus, it shares the same positive pair with our inter-view contrast loss, and the intra-view contrast loss for view 1 can be constructed as shown in Equation (7):
| (7) | |||
By combining the inter-view and intra-view comparability of the two views, the two different view comparison objective functions are shown in Equation (8):
| (8) |
In summary, the cross-view comparison objective function proposed in this paper is shown in Equation (9):
| (9) |
II-C3 Neighbourhood Contrastiveness
This paper draws on the concept of neighbour comparison learning, unlike InfoNCE and NT-Xent where only a single positive pair is formed for each anchor in the two comparison loss functions, neighbour comparison learning allows for multiple positives for each anchor, i.e., not only are the same nodes of the anchors in different views considered as positives, but also neighbours of the anchors within a view and neighbours of the anchors across different views are considered as additional positives, and the non-neighbours of the anchors in the view and the non-neighbours across different views will be considered as both intra- and inter-view negations. Considering that multiple views, i.e. , are also generated after the original graph data is input to the multi-head GAT, in this paper, the neighbour contrast loss is also computed for the views generated by multiple heads, and the computation formula is shown in Equation (10) as follows:
| (10) |
where is calculated as shown in Equation (11):
| (11) |
In summary, in this paper, the cross-network, cross-view and neighbour comparison losses are combined to obtain the final comparison loss function, specifically as shown in Equation (12):
| (12) |
where are balancing factors by minimising the for the purpose of model training.
III Experiments
III-A Datasets
In order to demonstrate the effectiveness of the proposed GRE2-MDCL, extensive experiments are conducted on five benchmark datasets for semi-supervised node classification, including three widely used citation networks, i.e., Cora, Citeseer, and Pubmed, where Cora is a dataset of citation networks of academic papers on machine learning; Citeseer is a dataset of citation networks of academic papers on computer science; Pubmed is a dataset of citation networks of academic papers on medical literature. Cora is a citation network dataset of academic papers in the field of machine learning; Citeseer is a citation network dataset of academic papers in the field of computer science; Pubmed is a citation network dataset of medical literature. The statistics of the datasets are shown in Table I.
| Dataset | Node | Edge | Feature | Label |
|---|---|---|---|---|
| Cora | 2708 | 10556 | 1433 | 7 |
| CiteSeer | 3327 | 9228 | 3703 | 6 |
| PubMed | 19717 | 88651 | 500 | 3 |
III-B Evaluation Metrics
For Cora, Citeseer and Pubmed this paper follows the experience of previous research, i.e. for each class of the dataset 20 nodes were randomly selected for training, 500 nodes were used for validation and the remaining nodes were used for testing. For the self-supervised GCL base model and GRE2-MDCL, which learns embeddings from unlabelled data, the validation set is used only to tune the hyperparameters of the LR classifier. For each dataset, this paper performs 20 random splits of training/validation/testing and calculates the average accuracy for each dataset.
III-C Experimental Results and Analysis
III-C1 Comparative experiment
In this paper, three datasets, Cora, Citeseer, and PubMed, are used to evaluate the performance of the proposed model, and 10 recent node classification methods with good performance are selected as the baseline model:including two semi-supervised GNNs, i.e., GCN and GAT, two semi-supervised graph comparison learning methods, i.e., CGPN and CG3, and five types of self-supervised graph comparison learning methods, i.e. GRACE, MVGRL, GCA, SUGRL, and AF-GRLNCLA.The model training results are shown in Table II, where the best and second best results are highlighted in bold and underlined, respectively.
Based on the node classification accuracy of each model on the three baseline graph datasets shown in Table II, the following observations can be made:
-
1.
GRE2-MDCL outperforms other baseline models on both the Cora and Citeseer datasets, and is a competitive model on the PubMed dataset. This indicates that GRE2-MDCL has a superior classification performance across different datasets compared to the other models.
-
2.
GRE2-MDCL outperforms NCLA on the Cora and Citeseer datasets, and is slightly inferior to NCLA on the PubMed dataset, but the difference is not significant. This suggests that by incorporating the multi-head GAT of NCLA into the triple graph neural network and using multi-dimensional contrastive loss for learning, GRE2-MDCL is able to provide a more effective graph encoder through the mutual regularization between the online network and the target network, thus improving model performance.
-
3.
The contrastive learning model proposed in this work can not only fully capture the diverse information within the same network, but also enrich the shared information across different networks, achieving a balance between the two. Compared to the baseline models, the introduction of contrastive learning enables the model to achieve higher classification accuracy through data augmentation, once again demonstrating the importance of mining multi-scale relationships in graphs.
| Method | Model | Dataset | ||
| Cora | CiteSeer | PubMed | ||
| Semi GNN | GCN [10] | 79.61.8 | 66.01.2 | 79.02.5 |
| GAT [7] | 81.21.6 | 68.91.8 | 78.51.8 | |
| Semi GCL | CGPN [11] | 74.01.7 | 63.71.6 | 73.32.5 |
| CG3 [12] | 80.61.6 | 70.91.5 | 78.92.6 | |
| Self GCL | GRACE [8] | 79.61.4 | 67.01.7 | 74.63.5 |
| MVGRL [14] | 82.41.5 | 71.11.4 | 79.52.2 | |
| GCA [15] | 79.01.4 | 65.62.4 | 81.52.5 | |
| SUGRL[16] | 81.31.2 | 71.01.8 | 80.51.6 | |
| AF-GRL [16] | 78.61.3 | 70.82.1 | 76.42.5 | |
| NCLA [18] | 81.91.6 | 71.70.9 | 82.01.4 | |
| GRE2-MDCL | 83.11.8 | 72.61.5 | 81.81.4 | |
-
•
Note: Semi: semi-supervised; Self: self-supervised.
In summary, the proposed GRE2-MDCL model outperforms or matches the state-of-the-art models on the tested graph datasets, showcasing its superior ability to learn effective graph representations through the integration of multi-dimensional contrastive learning.
III-C2 Ablation Experiment
This paper conduct ablation experiments by gradually removing the local graph enhancement strategy, global graph enhancement strategy, and multi-dimensional comparative learning method from the GRE2-MDCL model, and then comparing the performance difference between the ablated models and the original model. This allows us to gain a clearer understanding of the contribution of each component and optimize the model design. The results of the ablation experiments are presented in Table III.
| Model | Cora | CiteSeer | Pubmed |
|---|---|---|---|
| MGCA | 83.11.8 | 72.61.5 | 81.81.4 |
| w/o LA | 80.61.7 | 72.31.6 | 76.72.1 |
| w/o SVD | 82.11.6 | 71.61.2 | 77.22.9 |
| w/o GRE2-MDCL | 74.32.6 | 69.61.6 | 72.12.7 |
Based on the results of the ablation experiments reported in Table 3, the following key insights can be drawn:
-
1.
Prior to the ablation experiments, the model performed well on the literature classification task across the three datasets of Cora, Citeseer, and PubMed, achieving average accuracies of 82.5%, 72.5%, and 77.8%, respectively.
-
2.
After removing the global-local graph augmentation, the average accuracy of the model using SVD alone decreased by 2.5, 0.3, and 5.1 percentage points on the Cora, Citeseer, and PubMed datasets, respectively. The model using LAGNN alone saw decreases of 1.0, 1.0, and 4.6 percentage points on the same datasets.
When the multi-dimensional comparison learning was removed, and the model was trained using a traditional comparison loss function, the average accuracy decreased by 8.8, 3.0, and 9.7 percentage points on the Cora, Citeseer, and PubMed datasets, respectively.
Based on these experimental results, the following conclusions can be drawn:
-
1.
The global-local graph enhancement method used in the proposed approach significantly improves model performance compared to methods that enhance only one aspect of the data. This suggests that the globally-locally processed graph data not only captures detailed node-level information, but also maintains the overall graph topology, enhancing the graph neural network’s ability to effectively model graphs with small node degrees.
-
2.
The multi-dimensional contrastive learning approach, which includes cross-view, cross-network, and neighbor contrasts, enhances neighborhood interactions and aggregation between nodes, leading to improved model performance. The different contrastive learning modules in the GRE2-MDCL model collaborate to enhance the graph neural network’s capabilities.
In summary, the ablation study demonstrates the critical importance of both the global-local graph augmentation and the multi-dimensional contrastive learning components in the proposed GRE2-MDCL model, highlighting their indispensable roles in achieving the superior performance on the literature classification tasks.
III-C3 Hyperparametric analysis
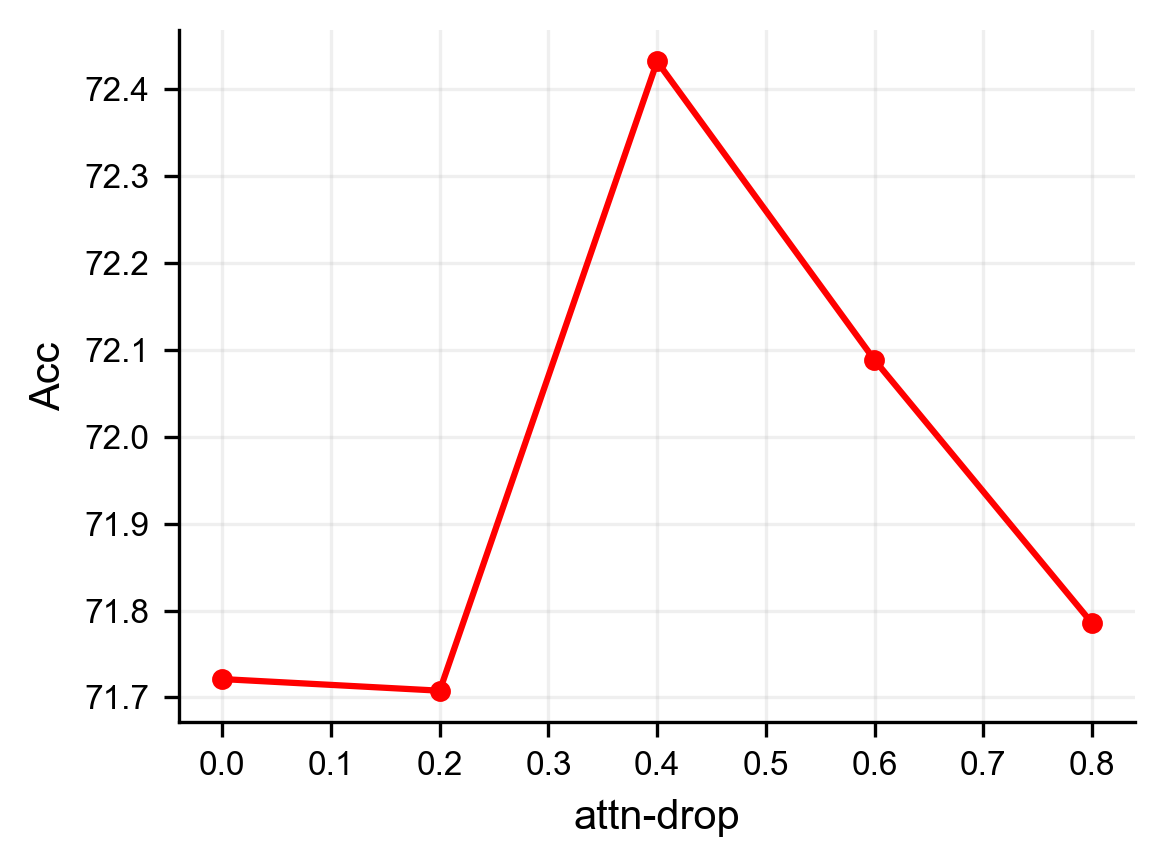
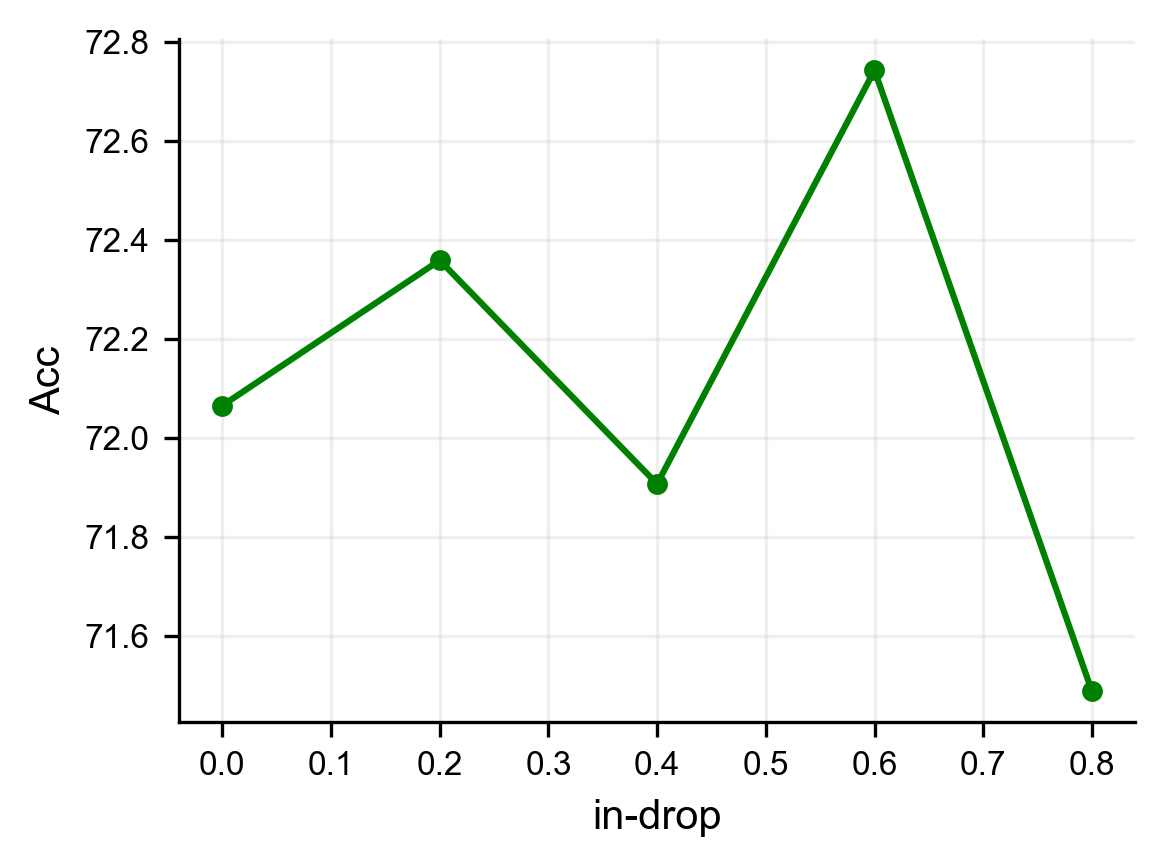
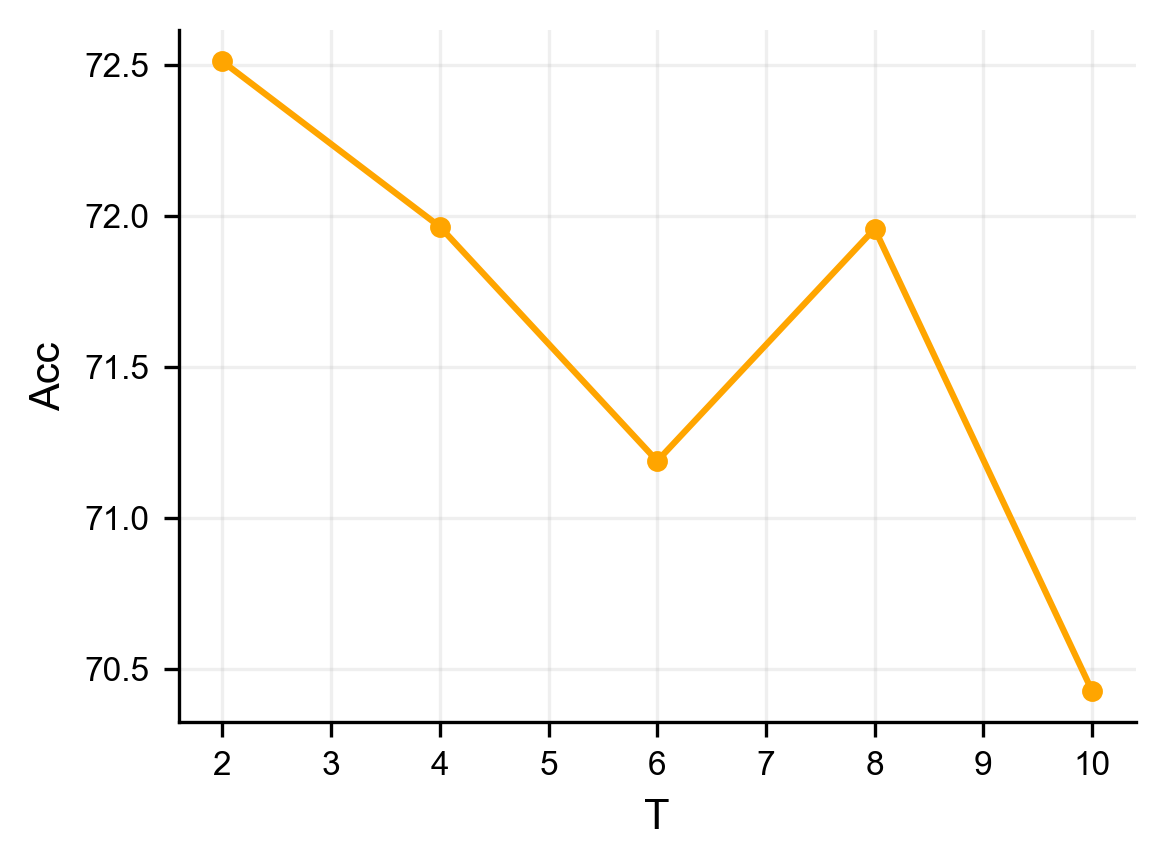
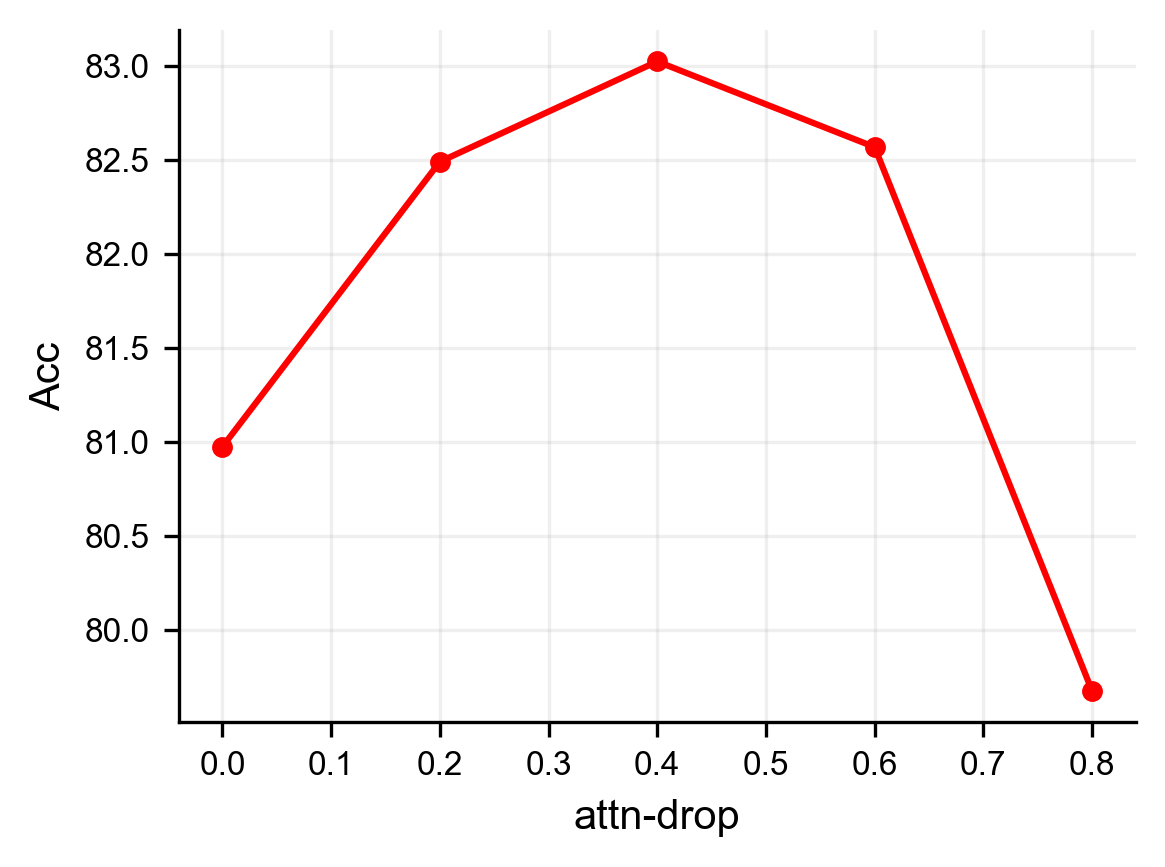
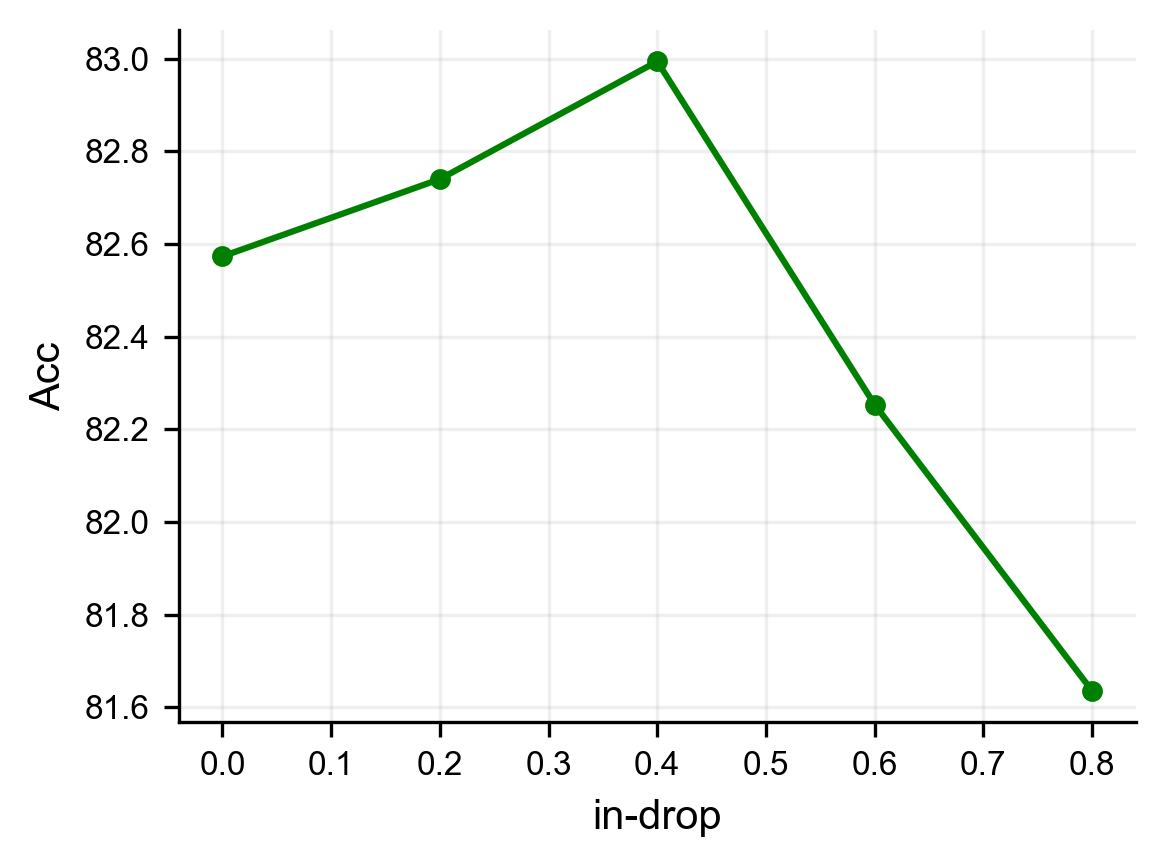
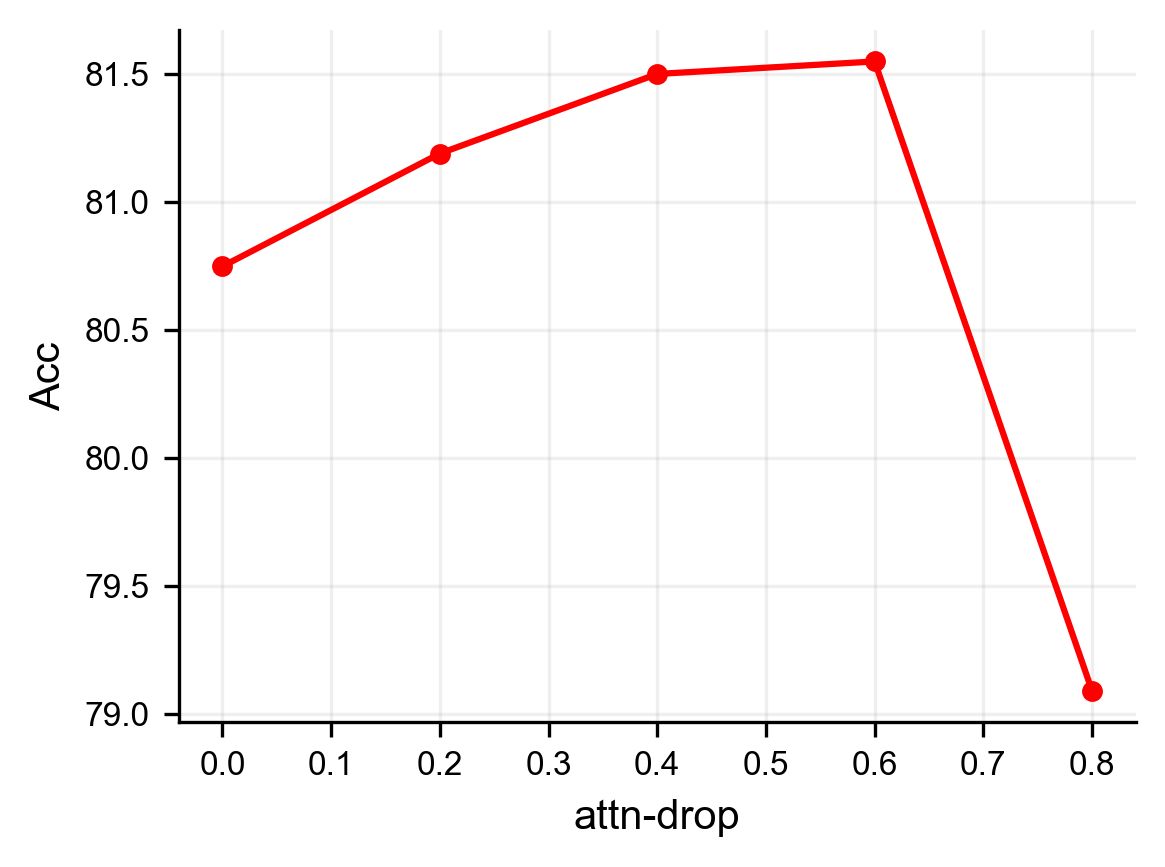
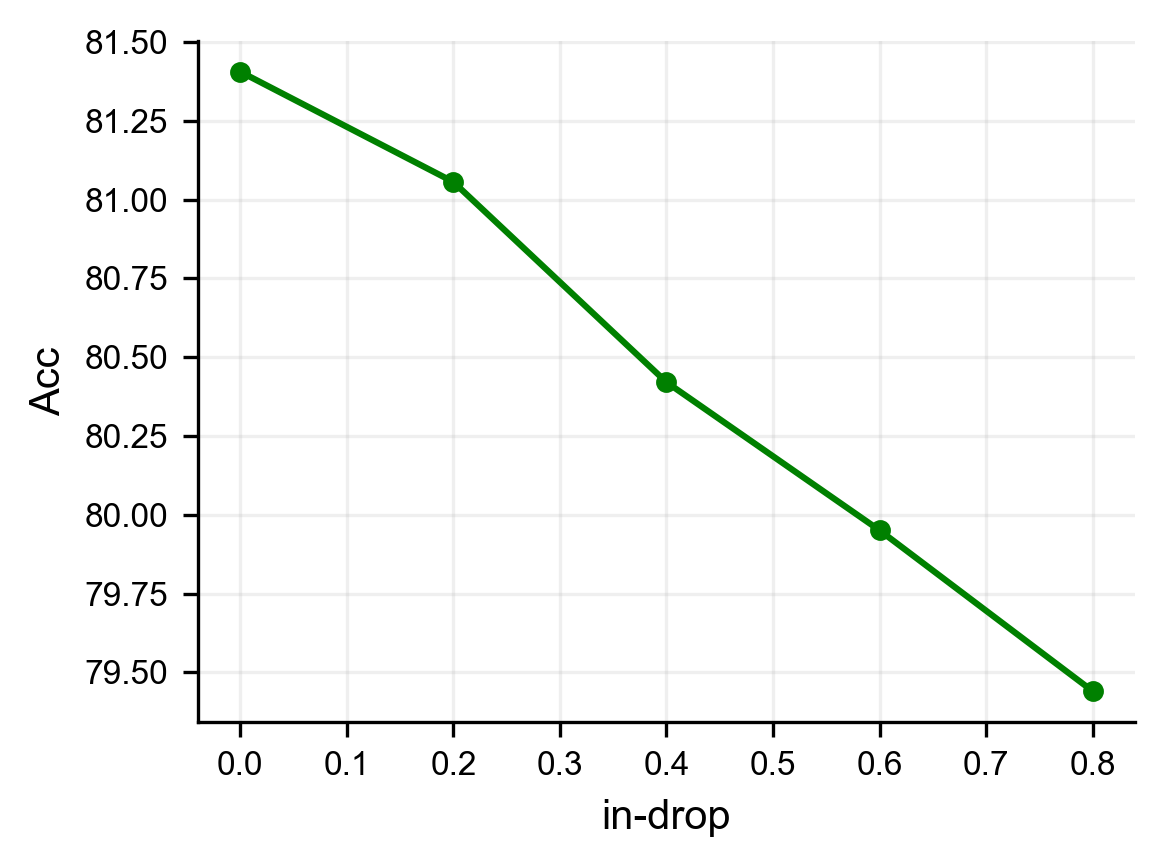
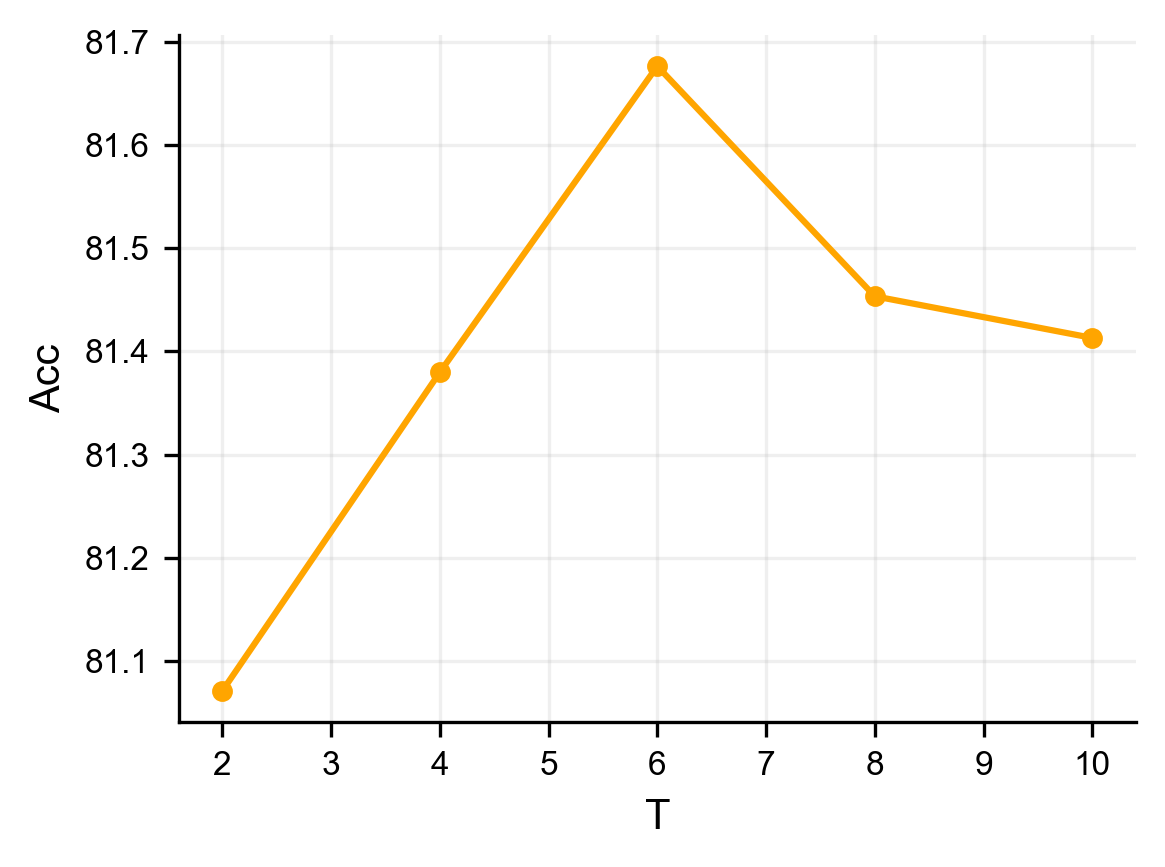
In this paper, a hyperparametric analysis is carried out on each adjusted hyperparameter to understand more clearly the impact of each hyperparameter on the model performance and further adjust the hyperparameters to find the optimal combination of hyperparameters to optimise the model performance, and the results of the hyperparametric analysis of the model are shown in Fig. 3 as follows.
(a) Cora

(b) Citeseer
(c) PubMed
Based on the performance variation of GRE2-MDCL on Cora, Citeseer and Pubmed datasets with the variation of temperature , input feature random drop rate im-drop, and attentional weight random drop rate attn-drop hyper-parameters as shown in Fig. 3, the following sensitivity analyses can be carried out:1) In this paper, it is observed that the model achieves the best performance on Cora when the temperature parameter is 1 and Citeseer datasets, while larger results in lower accuracy for both datasets, but when the temperature parameter is 5 the model achieves the best performance on the PubMed dataset, which may be due to the larger size of the PubMed dataset in comparison to the other two datasets, suggesting that as the size of the model increases, in order for the model to achieve the optimal performance, an attempt can be made to increase the hyperparameter temperature. 2) Although there is no obvious pattern indicating the trend of its relationship with the model performance when the value of the input feature random discard rate is small, in general, the model performance shows a decreasing trend with the increase of the input feature random discard rate, which suggests that it is not advisable to set its value larger in the future experimental process. 3) The model performance in general is first strengthened and then weakened with the increase of the random discard rate of the attentional weight, which suggests that it is not advisable to set its value larger in the future experimental process. This suggests that in the future experimental process can be the first to try to take its middle value for experimental comparison.
IV Conclusion
In this paper, we propose a graph neural network architecture called GRE2-MDCL for node classification. Firstly, GRE2-MDCL performs local-global graph enhancement. Local graph enhancement via LAGNN refines the graph neural network’s representation ability when node degrees are small. Meanwhile, global graph enhancement is achieved through SVD decomposition to preserve the overall graph structure and important topological features. Secondly, the proposed approach introduces a triple graph neural network model, which provides a more efficient graph encoder by exploiting the mutual regularization between the online network and the target network for self-supervised node representation learning. Finally, GRE2-MDCL introduces multi-dimensional contrastive loss learning, which fuses three types of contrastive loss: cross-network, cross-view, and neighbor contrast. The neighbor contrast loss utilizes the network topology as a supervisory signal, rather than directly using a contrast loss that ignores the graph structure. These three contrastive loss functions are combined to form the total graph contrast loss, which is then used to optimize the model parameters.
Through extensive experiments, the proposed GRE2-MDCL model achieves average accuracies of 82.5%, 72.6%, and 77.8% on the Cora, Citeseer, and PubMed datasets, respectively, outperforming the baseline comparison models and even some supervised learning methods. This demonstrates the high effectiveness and robustness of the proposed approach.
Although the experimental results are promising, there are still several areas that warrant further investigation:
1. Expanding the dataset: Collecting more diverse and extensive literature data can help further verify the model’s generalization ability and performance; 2. Optimizing the loss function: Exploring additional contrastive loss functions that better capture the structural features of graphs and the relationships between nodes could lead to stronger generalization and better performance on a wider range of tasks. 3. Considering more complex graph structures: The current method focuses on simple graph structures. Extending GRE2-MDCL to handle more complex graph types, such as heterogeneous graphs with multiple node and edge types, could enhance the model’s effectiveness and pervasiveness.
References
- [1] D. Cai and W. Lam, “Graph transformer for graph-to-sequence learning,” in Proceedings of the 34th AAAI Conference on Artificial Intelligence. New York, NY, USA: AAAI Press, 2020, pp. 7464–7471.
- [2] M. He, Z. Wei, H. Xu et al., “Bernnet: Learning arbitrary graph spectral filters via bernstein approximation,” Advances in Neural Information Processing Systems, vol. 34, pp. 14 239–14 251, 2021.
- [3] H. Pei, B. Wei, K. C. Chang, Y. Lei, and B. Yang, “Geom-gcn: Geometric graph convolutional networks,” in Proceedings of the 8th International Conference on Learning Representations. Addis Ababa, Ethiopia: OpenReview.net, 2020.
- [4] Z. Peng, W. Huang, M. Luo, Q. Zheng, Y. Rong, T. Xu, and J. Huang, “Graph representation learning via graphical mutual information maximization,” in Proceedings of the Web Conference. Taipei, Taiwan: ACM / IW3C2, 2020, pp. 259–270.
- [5] E. Ranjan, S. Sanyal, and P. P. Talukdar, “ASAP: adaptive structure aware pooling for learning hierarchical graph representations,” in Proceedings of the 34th AAAI Conference on Artificial Intelligence. New York, NY, USA: AAAI Press, 2020, pp. 5470–5477.
- [6] J. Tang, M. Qu, M. Wang, M. Zhang, J. Yan, and Q. Mei, “LINE: large-scale information network embedding,” in Proceedings of the 24th International Conference on World Wide Web. Florence, Italy: ACM, 2015, pp. 1067–1077.
- [7] P. Velickovic, G. Cucurull, A. Casanova, A. Romero, P. Liò, and Y. Bengio, “Graph attention networks,” in Proceedings of the 6th International Conference on Learning Representations. Vancouver, BC, Canada: OpenReview.net, 2018.
- [8] J. Zhu, Y. Yan, L. Zhao, M. Heimann, L. Akoglu, and D. Koutra, “Beyond homophily in graph neural networks: Current limitations and effective designs,” in Proceedings of the Advances in Neural Information Processing Systems, Online, 2020.
- [9] J. Zhang, Y. Dong, Y. Wang, J. Tang, and M. Ding, “Prone: Fast and scalable network representation learning,” in Proceedings of the 28th International Joint Conference on Artificial Intelligence, S. Kraus, Ed. Macao, China: ijcai.org, 2019, pp. 4278–4284.
- [10] T. N. Kipf and M. Welling, “Semi-supervised classification with graph convolutional networks,” in Proceedings of the 5th International Conference on Learning Representations. Toulon, France: OpenReview.net, 2017.
- [11] Z. Tian, W. Huang, T. He, P. He, and Y. Qiao, “Detecting text in natural image with connectionist text proposal network,” in Proceedings of the 14th European Conference on Computer Vision, ser. Lecture Notes in Computer Science, vol. 9912. Amsterdam, The Netherlands: Springer, 2016, pp. 56–72.
- [12] S. Wan, S. Pan, J. Yang, and C. Gong, “Contrastive and generative graph convolutional networks for graph-based semi-supervised learning,” in Proceedings of the 35th AAAI Conference on Artificial Intelligence. Online: AAAI Press, 2021, pp. 10 049–10 057.
- [13] Y. Zhu, Y. Xu, F. Yu, Q. Liu, S. Wu, and L. Wang, “Deep graph contrastive representation learning,” CoRR, vol. abs/2006.04131, 2020.
- [14] K. Hassani and A. H. K. Ahmadi, “Contrastive multi-view representation learning on graphs,” in Proceedings of the 37th International Conference on Machine Learning, vol. 119. Online: PMLR, 2020, pp. 4116–4126.
- [15] Y. Zhu, Y. Xu, F. Yu, Q. Liu, S. Wu, and L. Wang, “Graph contrastive learning with adaptive augmentation,” in Proceedings of the Web Conference, J. Leskovec, M. Grobelnik, M. Najork, J. Tang, and L. Zia, Eds. Ljubljana, Slovenia: ACM / IW3C2, 2021, pp. 2069–2080.
- [16] Y. Mo, L. Peng, J. Xu, X. Shi, and X. Zhu, “Simple unsupervised graph representation learning,” in Proceedings of the 36th AAAI Conference on Artificial Intelligence. Online: AAAI Press, 2022, pp. 7797–7805.
- [17] N. Lee, J. Lee, and C. Park, “Augmentation-free self-supervised learning on graphs,” in Proceedings of the 36th AAAI Conference on Artificial Intelligence. Online: AAAI Press, 2022, pp. 7372–7380.
- [18] X. Shen, D. Sun, S. Pan, X. Zhou, and L. T. Yang, “Neighbor contrastive learning on learnable graph augmentation,” in Proceedings of the 37th AAAI Conference on Artificial Intelligence. Washington, DC, USA: AAAI Press, 2023, pp. 9782–9791.
- [19] P. Velickovic, W. Fedus, W. L. Hamilton, P. Liò, Y. Bengio, and R. D. Hjelm, “Deep graph infomax,” in Proceedings of the 7th International Conference on Learning Representations. New Orleans, LA, USA: OpenReview.net, 2019.
- [20] Y. You, T. Chen, Y. Sui, T. Chen, Z. Wang, and Y. Shen, “Graph contrastive learning with augmentations,” Advances in Neural Information Processing Systems, vol. 33, pp. 5812–5823, 2020.
- [21] X. Han, Z. Jiang, N. Liu, and X. Hu, “G-mixup: Graph data augmentation for graph classification,” in Proceedings of the International Conference on Machine Learning, vol. 162. Baltimore, Maryland, USA: PMLR, 2022, pp. 8230–8248.
- [22] Y. Yin, Q. Wang, S. Huang, H. Xiong, and X. Zhang, “Autogcl: Automated graph contrastive learning via learnable view generators,” in Proceedings of the 36th AAAI Conference on Artificial Intelligence. Online: AAAI Press, 2022, pp. 8892–8900.
- [23] R. Bing, G. Yuan, F. Meng, S. Wang, S. Qiao, and Z. Wang, “Heterogeneous graph structure learning method with multi-view contrast enhancement,” Journal of Software, vol. 34, no. 10, pp. 4477–4500, 2023.
- [24] Y. Liu, Y. Zhao, X. Wang, L. Geng, and Z. Xiao, “Multi-scale subgraph contrastive learning,” CoRR, vol. abs/2403.02719, 2024.