Automate Strategy Finding with LLM in Quant investment
Abstract.
Despite significant progress in deep learning for financial trading, existing models often face instability and high uncertainty, hindering their practical application. Leveraging advancements in Large Language Models (LLMs) and multi-agent architectures, we propose a novel framework for quantitative stock investment in portfolio management and alpha mining. Our framework addresses these issues by integrating LLMs to generate diversified alphas and employing a multi-agent approach to dynamically evaluate market conditions. This paper proposes a framework where large language models (LLMs) mine alpha factors from multimodal financial data, ensuring a comprehensive understanding of market dynamics. The first module extracts predictive signals by integrating numerical data, research papers, and visual charts. The second module uses ensemble learning to construct a diverse pool of trading agents with varying risk preferences, enhancing strategy performance through a broader market analysis. In the third module, a dynamic weight-gating mechanism selects and assigns weights to the most relevant agents based on real-time market conditions, enabling the creation of an adaptive and context-aware composite alpha formula. Extensive experiments on the Chinese stock markets demonstrate that this framework significantly outperforms state-of-the-art baselines across multiple financial metrics. The results underscore the efficacy of combining LLM-generated alphas with a multi-agent architecture to achieve superior trading performance and stability. This work highlights the potential of AI-driven approaches in enhancing quantitative investment strategies and sets a new benchmark for integrating advanced machine learning techniques in financial trading can also be applied on diverse markets.
1. Introduction
According to the survey by Grand View Research, in 2023 the global alternative data market was valued at 7.2bn USD and is expected to expand at the compound annual growth rate (CAGR) of 52.1% from 2023 to 2030 representing a complex and dynamic ecosystem that attracts millions of investors seeking profitable investment opportunities. (vladi2024quantitative, ) Recent advancements in quantitative trading have significantly enhanced the ability to analyze and process vast amounts of financial data, leading to the development of sophisticated trading strategies. One of the key areas of focus in quantitative trading is Alpha mining—the process of discovering and refining predictive signals, or alpha factors, that forecast asset returns. (tulchinsky2015finding, ) Eugene Fama proposed the Efficient Market Hypothesis (EMH) to present that stock price will be the reflection of all the market available information. (fama1970efficient, ) However with the market condition change the same information may make different influence on the market, some researchers also found information asymmetry. (allen1999genetic, ) Here we found three major challenges to the current Alpha mining process (1) Rigidness of traditional methods: traditional methods for identifying alpha factors in finance often rely on heuristic rules and financial expertise. These rule-based approaches, typically perform well only under specific market conditions and lack the flexibility to adapt to varying market dynamics. (2) Data diversity and integration, recent research has explored the application of machine learning techniques to uncover alpha factors from diverse data sources, such as economic news, social media trends, and historical price movements. (cui2021alphaevolve, ; allen1999genetic, ; yu2023generating, ) (3) Adapting to market variability, Market dynamics are fluid, and strategies that perform well in one environment may fail in another. In recent years many researchers proposed to use deep learning methods to predict the market (xu2018stock, ) and form their strategy. (chen2019investment, ) Efficiently mining and utilizing alpha factors across different market conditions remains a significant challenge.
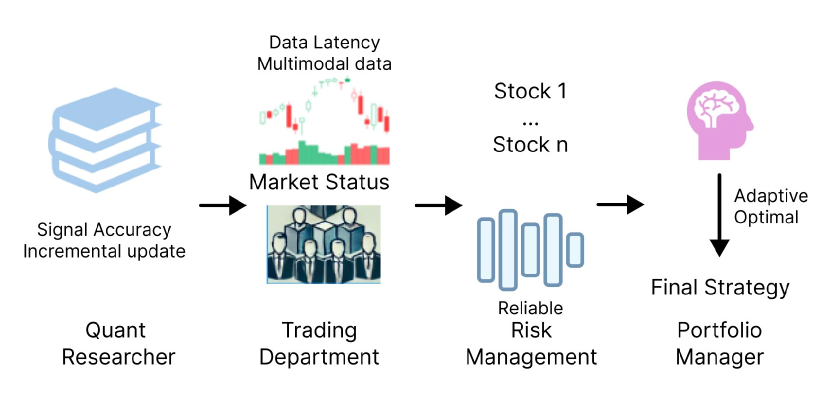
To address this challenge, we propose a novel framework that leverages the exploratory power of Large Language Models (LLMs) for Alpha mining and strategy optimization. (1) Flexible Alpha mining with LLMs, the framework starts with the collection and categorization of potential alpha factors from academic research, financial literature, and proprietary datasets. These seed alphas are filtered and categorized using the potential of the LLM, which ensures a comprehensive and diverse set of candidate seed Alphas for further research. All these seed alpha factors are well categorized as momentum factors, fundamental factors, liquidity factors, etc., and based on traditional finance research we believe that these factors are independent of each other. (xu2018stock, ) Once new research work is published, our model will be able to incremental update the seed alphas factory. This dynamic approach allows for the discovery of adaptable alpha factors, overcoming the rigidity of traditional methods. (2) Multi-Agent multimodal market evaluation, the seed Alpha factors undergo rigorous back-testing against historical market data to assess their performance. This includes back test under different market conditions to determine which factors can respond to the market for excess returns under different market conditions. To handle the variability in market conditions, we employ a multi-Agent approach. This method allows specialized agents to evaluate the relevance and effectiveness of each alpha factor under multimodal market scenarios. The multi-Agent architecture captures the nuanced dynamics of various market environments from different perspectives. Based on the current market condition the multi-Agent part can filter the out performance seed alphas for us further strategy design. (3) Dynamic strategy optimization, following the evaluation and back-testing phases, a weight gating layer assigns optimal weights to each seed alpha based on current market conditions. This dynamic weighting mechanism ensures that the strategy adapts to changing market environments, optimizing overall performance. The weighted alpha strategies are then aggregated to form a comprehensive investment strategy that maximizes returns while managing risk. Our approach integrates state-of-the-art techniques in machine learning and finance to develop a robust system capable of identifying and optimizing alpha strategies across multiple asset classes. As Figure 7 shows here the work inspired from the idea in real-life quant company practice, for the real quant investment company they generally have four major departments. The first one is the research department’s response to find the valuable trading signals and record them; the second part is the trading department need to analyze the current market condition and select the ideal alphas for future portfolio construction; the third part is the risk management part, they need to evaluate and make the strategy suitable for the risk preference; the last part will be the portfolio manager, they mix up the traders idea construct the final trading strategy for profit.(fabozzi2010quantitative, )
Our main contributions are three-fold:
-
•
A new framework for searching formulaic alpha factors based on LLM, to utilize the strong exploratory power of LLM to provide Alpha factory from multimodal information with incremental updates features.
-
•
We introduce the multi-Agent approach to the financial domain to evaluate the relationship between the market condition and Alpha factors, enabling specialized evaluation of alpha strategies under different senior.
-
•
By integrating advanced techniques from both fields, our work represents a significant step forward in developing robust and adaptive investment strategies without human interval.
The proposed framework is versatile and can be applied across various asset classes, enhancing its utility and effectiveness. To support future research and the reproducibility of the results, we make our source code publicly available at https://anonymous.4open.science/r/Automate-Strategy-Finding-with-LLM-in-Quant-investment-ADA2/.
2. Problem Formulation
This section introduces a comprehensive framework for generating alpha factors and strategies in quantitative trading. It begins by outlining how alpha factors are calculated for a set of stocks over multiple trading periods, with the best-performing seed alphas selected based on back-test results and current market conditions. The framework leverages Large Language Models (LLMs) and a multi-agent system to dynamically mine and select seed alphas, ensuring adaptability to market variability. The seed alphas are expressed as mathematical formulas, incorporating both cross-sectional and time-series operators. The framework also includes a process for refining and updating these alphas over time, ensuring they remain relevant to evolving market conditions.
2.1. Alpha Factor & Strategy
We suppose there are stocks in next trading period . For each trading period , for every stock can calculate out several alphas from each category value . The value of each stock may firstly have initial features like the volume & price etc. now we can use the value to represent the potential value of the stocks of different category. Then from each category we choose the domain best performance seed alpha from back test performance linked with the current market condition as the raw material for our final strategy. The overall Alpha Strategy can be represent by .
2.2. Seed Alpha Mining & Selection
In quantitative trading, the static nature of traditional heuristic and rule-based alpha mining methods poses significant limitations (e.g. Information coefficient), particularly in the context of rapidly changing market conditions. (zhang2020information, ) These methods often fail to adapt dynamically, leading to suboptimal performance and the selected Alpha may loss function. Moreover, the reliance on structured financial data, such as historical prices and fundamental indicators, overlooks the rich insights that can be derived from alternative data sources like economic news and social media trends. To address these challenges, we propose a novel framework that leverages the exploratory power of Large Language Models (LLMs) and a multi-agent system for seed alpha mining and selection. Our approach integrates state-of-the-art machine learning techniques with financial principles to create a robust system capable of dynamically adjusting to market variability and optimizing alpha strategies across categories of seed alphas. This multimodal framework links current market conditions with alpha back-test results, allowing LLMs to identify the most suitable seed alphas while assigning confidence scores to ensure reliability. Specialized agents further customize the evaluation based on risk preferences and expertise, ensuring a comprehensive and adaptive solution for maximizing returns and managing risks in diverse market environments.
2.3. Seed Alpha Formulaic
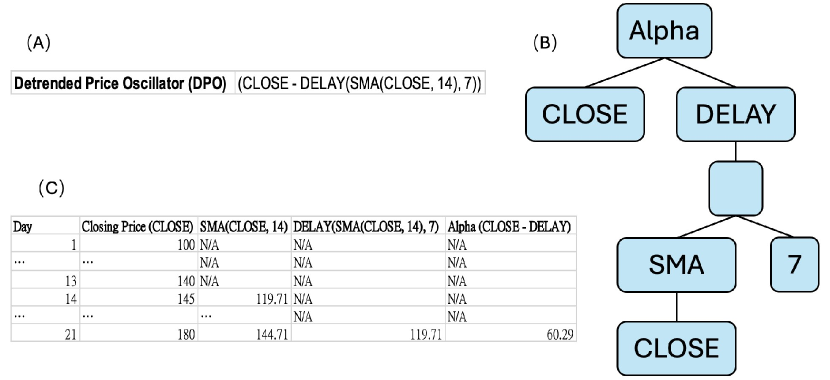
Our framework sets a rule for the output of the LLM-generated seed alphas, ensuring they are expressed as mathematical expressions that combine various operators with raw financial features. These operators include elementary functions such as addition (”+”) and logarithms (”log”), which are used on one-day data and are referred to as cross-section operators. Additionally, there are time-series operators that require data spanning multiple days. An example of a time-series operator is ” (CLOSE - DELAY(SMA(CLOSE, 14),7)”, which measures the momentum by comparing the current closing price to the 14-period Simple Moving Average (SMA) value from 7 periods ago, indicating whether the price is trending upward or downward relative to that past average, as illustrated in Figure 2 (B).
The comprehensive list of seed alpha formulas used in our experiments can be found in Appendix 2. It is important to note that with ongoing research and new data, some alpha formulas may undergo numerical adjustments, and others might be replaced with new seed alpha formulas. This reflects our commitment to incremental updates and the continuous refinement of our seed alpha factory to adapt to the latest market conditions and research insights.
3. Methodology
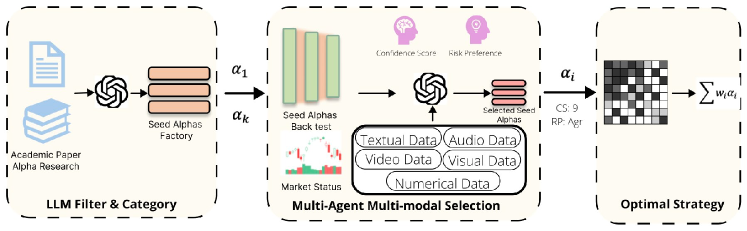
This section details the methodology of a comprehensive framework for constructing and optimizing alpha strategies in quantitative trading. It introduces three key components: the Seed Alphas Factory, a multi-agent decision-making process, and a weight optimization approach. The Seed Alphas Factory is built using Large Language Models (LLMs) to filter and categorize multimodal data, creating a robust set of seed alphas. The multi-agent system evaluates and selects these alphas based on diverse risk preferences and market conditions, while a confidence scoring mechanism ensures reliability. Finally, the selected alphas’ weights are optimized using a Deep Neural Network (DNN) to predict future yields, forming the foundation for a dynamic and adaptable investment strategy.
3.1. Overview of the Framework
Our framework is structured into three primary components: the Seed Alphas Factory, multi-agent decision-making, and the weight optimization approach. (Figure 3) The initial phase utilizes a Large Language Model (LLM) to filter and categorize multimodal documents, constructing the Seed Alphas Factory. The LLM’s ability to process vast and diverse datasets ensures a comprehensive and robust set of seed alphas categorized into independent alpha categories, as established by finance alpha mining research. In the second phase, the framework employs a multimodal multi-agent decision-making process. This multi-agent approach allows for the incorporation of varied risk perspectives, enhancing the adaptability and robustness of the strategy across different market conditions. The outcome of this phase is an alpha list suited to the current market status and risk preferences. The final phase involves a weight optimization approach using deep learning methods to assess the performance of each seed alpha and construct the overall strategy.
The framework is designed to be dynamic, allowing for continuous improvement and adaptation. As new research emerges and market conditions evolve, the Seed Alphas Factory can be incrementally updated by providing additional information to the LLM. This continuous update mechanism ensures that the Seed Alphas Factory remains relevant and robust over time. Similarly, the multi-agent decision-making process can adapt to changing market conditions by selecting new sets of seed alphas, thereby maintaining the efficacy of the strategy. This methodology is versatile and can be applied to any structured market globally. By integrating advanced LLM capabilities and multi-agent systems, this proposed methodology aims to replicate and enhance the sophisticated strategies used in professional investment research.
3.2. LLM Filter & Category
The first stage of our methodology involves the LLM Filter & Category process for alpha-related research. This stage utilizes the summarization and categorization capabilities of Large Language Models (LLMs) to expedite the understanding of recent alpha mining research and to establish our Seed Alpha Factory for further development.
For this study, we employed custom versions of ChatGPT, named “Alpha Grail,” to perform the LLM filtering and categorization tasks. The primary function of Alpha Grail is to assist quantitative researchers in building the Seed Alpha Factory by processing alpha-related research documents. The specific instruction given to Alpha Grail was: ”Summarize the document information to help quantitative researchers build the Seed Alpha Factory according to traditional financial categories, ensuring that each category of seed alphas is independent.” (openai2023gpt4, ) Initially, we provided 11 documents encompassing diverse backgrounds in both financial and computer science alpha mining research. Details of these documents are available in Appendix 1. Through this process, Alpha Grail generated nine categories comprising 100 seed alphas.
| Data Type | Description | Examples |
| Textual Data | Financial reports, academic papers, news articles, and other textual documents. | Trading forums’ sentiment analysis and stock predictions, company disclosures, financial statements, Sina Finance |
| Numerical Data | Historical stock market data, financial metrics, and performance indicators. | Returns, log returns, annualized returns, volatility |
| Visual Data | Charts, graphs, and other visual representations of financial data. | Kline charts, trading charts |
| Audio Data | Financial news broadcasts. | Financial morning news radio, stock review radio, market discussion radio |
| Video Data | Financial news channels. | CCTV Securities Information Channel, CCTV News Broadcast (news affecting China’s stock market) |
The LLM Filter & Category stage also integrates multimodal processing capabilities. By incorporating multimodal data sources such as text, images, tables, and figures from the research documents, the LLM can provide a more comprehensive analysis and categorization of the seed alphas. This multimodal approach enhances the LLM’s ability to capture intricate details and relationships within the research, leading to a more robust and diverse Seed Alpha Factory.
The output of this stage is a structured set of seed alphas categorized into distinct financial domains such as Momentum, Mean Reversion, Volatility, and Fundamental analysis. Each category includes specific alpha names and corresponding alpha codes, which are derived from the LLM’s summarization and categorization process. The detailed generated Seed alphas factory can be seen in the Appendix 2. This structured output forms the foundation for the subsequent multi-agent decision-making and weight optimization stages in our framework.
3.3. Multimodal & multi-Agent Evaluate Alpha set
The second stage of our methodology involves a comprehensive evaluation and selection of alpha factors through a multimodal and multi-agent system. This approach ensures a diversified and thorough assessment of the seed alphas by integrating diverse data sources and leveraging multiple analytical perspectives.
In this stage, we incorporate multimodal data encompassing textual, numerical, visual, and multimedia inputs to enrich the evaluation process. By integrating these varied data types, we provide a comprehensive view of market conditions and the performance of alpha factors. Table 2 outlines the five types of data utilized in our evaluation framework. This holistic approach allows for a nuanced understanding of the market dynamics and enhances the robustness of the evaluation process.
The multi-agent system comprises various agents, each designed with distinct risk preferences and investment strategies. These agents analyze the multimodal data and evaluate the seed alphas based on their respective criteria. Each agent conducts a risk preference analysis, assessing the seed alphas according to its predefined risk parameters. This ensures that the evaluation covers a wide spectrum of risk perspectives. Agents then select alpha factors that align with their risk preferences and market analyses, ensuring relevance and robustness under different market scenarios. To enhance the reliability of the selected alpha factors, a confidence scoring mechanism is implemented. Each agent assigns a confidence score to the alpha factors based on their analysis and historical performance, reflecting the agent’s assessment of the alpha factor’s predictive power and robustness. Selected alpha factors undergo rigorous backtesting using historical market data to evaluate their performance under various market conditions. This step is crucial for identifying the most promising alpha factors for the final strategy. Key evaluation metrics include performance indicators such as the Information Coefficient (IC) and Sharpe Ratio etc.(sharpe1994sharpe, ) Additionally, seed alpha factors from each category must meet specific confidence score thresholds to be considered for the final selection, ensuring that only the most reliable and robust alpha factors are chosen.
To automate the selection process, we designed the Category-Based Alpha Selection algorithm. This algorithm identifies and selects alphas from different categories based on their confidence scores. The input consists of multiple categories, each containing a set of alphas and a confidence threshold. The algorithm begins with an empty set of selected alphas and iterates through each category, using the SelectBestAlphas function to determine the most promising candidates. Each alpha’s confidence score is evaluated, and those exceeding the threshold are included in the final set. This process repeats for all categories, ensuring a rigorous selection of alphas that meet the confidence criteria from all categories. The final output is a set of selected alphas that have successfully passed the confidence evaluation.
The multimodal and multi-agent evaluation stage leverages advanced data integration and diverse analytical perspectives to ensure a comprehensive assessment of alpha factors. The incorporation of confidence scoring adds an additional layer of reliability, making the selection process more robust. This stage is crucial for identifying the most promising alpha factors and constructing a resilient investment strategy that can adapt to varying market conditions. The integration of multimodal data sources and the utilization of a multi-agent system provide a nuanced and in-depth evaluation, laying a solid foundation for the subsequent stages of the framework.
3.4. Optimal weight alpha strategy
To optimize the weights of selected seed alphas, we employ a Deep Neural Network (DNN) to fit alpha values to future yields. The network architecture comprises three layers: an input layer, a hidden layer, and an output layer. The input layer takes daily alpha calculations derived from historical closing prices as input features. The hidden layer, equipped with ten nodes, utilizes ReLU activation functions to introduce non-linearity and enhance the model’s learning capability. (chen2020dynamic, ) The output layer, consisting of a single node, predicts future yields. During the training phase, the network employs backpropagation and gradient descent to minimize the loss function, which quantifies the discrepancy between predicted and actual yields. This iterative process adjusts the network’s weights and biases to improve prediction accuracy. To ensure the model’s generalizability and prevent overfitting, a separate validation set is utilized. This methodology establishes a robust framework for predicting future yields based on historical alpha values, thus forming an effective investment strategy. The DNN model processes the input data through the hidden layer, transforming it with learned weights and biases. The final output is generated by applying another set of weights, biases, and an activation function in the output layer. Our approach demonstrates the efficacy of leveraging deep learning techniques to optimize alpha weights, thereby enhancing the predictive performance of investment strategies.
4. Experiment
Our research aims to develop a comprehensive LLM-driven alpha mining framework that operates without human intervention. This framework is uniquely capable of processing multimodal information and adapting to varying market conditions. A critical innovation in our system is the introduction of a confidence score, designed to mitigate potential hallucinations during the LLM’s seed alpha selection process. By integrating the results of seed alpha back tests with multimodal market conditions, our framework enables a more thorough understanding of market dynamics, and the sentiments associated with each category of seed alphas. The primary objectives of our research are as follows: Evaluate Framework Effectiveness: Assess whether our LLM-driven framework can identify alphas that are better suited to prevailing market conditions compared to traditional methods. Multimodal knowledge extraction: Analyze the framework’s capability to process and integrate diverse data inputs, enhancing its understanding of market dynamics and sentiment analysis. Confidence Scoring Mechanism: Investigate the effectiveness of the confidence score in reducing the likelihood of hallucinations during the alpha selection process. Overall Strategy Performance: Determine whether our comprehensive strategy, leveraging the LLM-driven framework, can outperform the market.
To validate the effectiveness of our framework, we have conducted a series of experiments addressing the following research questions (RQs):
-
•
RQ1: Does the framework can achieve multimodal knowledge extraction and capture the new alpha with the market condition difference?
-
•
RQ2: Does our LLM-driven alpha mining framework outperform current alpha factory in terms of trading effectiveness?
-
•
RQ3: Can our overall strategy, incorporating the LLM-driven framework and confidence scoring, consistently beat the market?
4.1. Datasets
| Aspect | Details |
| Primary Features | Open, Close, High, Low, Volume, VWAP |
| Alpha Factors | Custom factors based on price, volume, financial ratios, moving averages, sentiment analysis |
| Financial Reports | Quarterly and Annual reports from SSE 50 constituent companies |
| Time Periods | - Training: Jan 1, 2021 - Dec 31, 2022 |
| - Test: Jan 1, 2023 - Dec 31, 2023 | |
| Market Coverage | SSE 50 Index, covering major sectors in the Chinese A-shares market |
| Evaluation Criteria | Causal relationships, Alpha factor performance, model robustness |
Our study focuses on financial data from the Chinese A-shares market, specifically targeting the SSE 50 Index. The dataset encompasses six primary features as original inputs for our Alpha factors: open, close, high, low, volume, and volume-weighted average price (VWAP). To ensure rigorous evaluation and robust model performance, the dataset is divided into distinct time periods: Training Set: January 1, 2021, to December 31, 2022 and Test Set: January 1, 2023, to December 31, 2023. Our experiments integrate financial reports and factor performances of the 50 constituent companies of the SSE 50 Index, providing a comprehensive view of the market. (li2020asset, )The evaluation considers various datasets, including financial reports from the specified periods and performance metrics of different Alpha factors. This extensive dataset allows us to identify causal relationships and patterns between financial features and Alpha factor performances. The diversified portfolio in our evaluation comprises prominent companies within the SSE 50 Index, selected for their extensive market coverage and representation across different sectors of the Chinese A-shares market. This selection underscores the versatility and consistency of our model across various financial environments, showcasing its broad applicability and reliability.
4.2. Research Questions
4.2.1. RQ1: Does the framework can achieve multimodal knowledge extraction and capture the new alpha with the market condition difference?
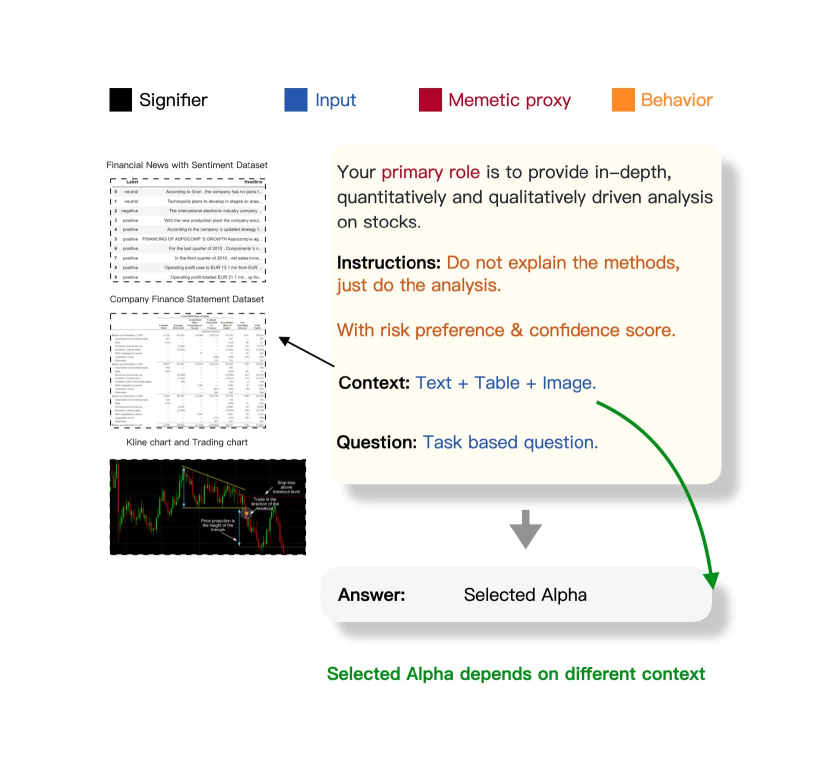
We present a prompt architecture (Figure 4) that incorporates multimodal market information into a Large Language Model (LLM) to achieve multimodal knowledge extraction and select optimal seed alphas under varying market conditions. By integrating textual data from financial news sentiment, numerical data from company financial statements, and visual data from trading charts, our framework provides comprehensive stock analysis. This data fusion ensures a holistic market view, enhancing decision-making. Contextual analysis adjusts parameters based on market trends and sector performance, ensuring relevant and accurate alpha selection.
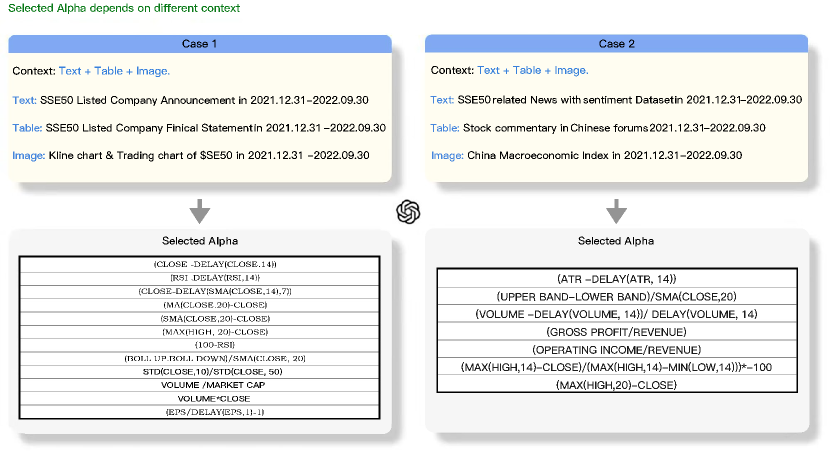
Experiments demonstrate the framework’s effectiveness in multimodal knowledge extraction and dynamic alpha selection under different market conditions. (Figure 5) In Case 1, using SSE50 company announcements, financial statements, K-line charts, and trading charts from December 31, 2021, to September 30, 2022, the selected alphas included momentum and volume-based indicators such as price momentum, RSI, MACD, moving averages, Bollinger Bands, volume, market cap, and EPS adjustments. In Case 2, focusing on incremental updated SSE50 related news, stock commentary, and the China Macroeconomic Index, the selected alphas emphasized volatility and economic factors, including ATR, Bollinger Bands ratios, volume-based indicators with delays, gross profit and operating income ratios, and high/low price comparisons. The experiment underscores the framework’s adaptability, capturing new opportunities by integrating diverse data sources and employing advanced analytical models. This dynamic approach ensures the selected alphas are relevant and responsive to current market conditions, enhancing the robustness and effectiveness of investment strategies.
4.2.2. RQ2: Does our LLM-driven alpha mining framework outperform current alpha factory in terms of trading effectiveness?
When evaluating the performance of selected seed alpha signals, the primary metric is the Information Coefficient (IC). [25] These metrics provide insights into the predictive power of alpha values for future returns. The Information Coefficient (IC) measures the correlation between predicted alpha values and actual future returns. It is quantified using Pearson’s correlation coefficient, which assesses the linear relationship between two variables. A higher IC indicates a stronger predictive relationship, meaning the alpha values are more effective at forecasting returns.
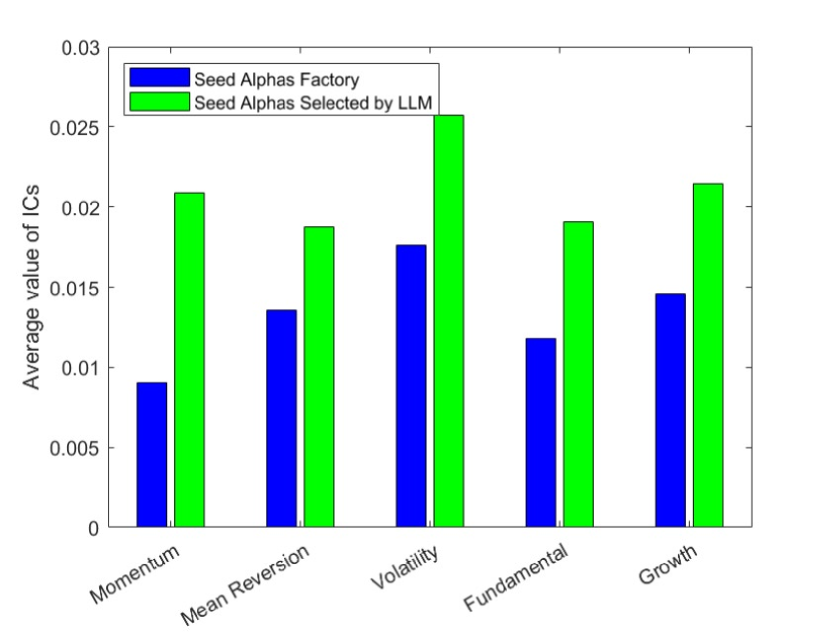
where is Pearson’s correlation coefficient between predicted alphas and actual future returns . We evaluated four most common alpha categories: Momentum, Mean Reversion, Volatility, Fundamental and Growth. The figure 6 below shows the average IC values for each category. The results demonstrate that our LLM-driven framework consistently achieves higher average IC values across all categories, particularly in Volatility and Fundamental, indicating superior trading effectiveness compared to the traditional alpha factory.
4.2.3. RQ3: Can our overall strategy, incorporating the LLM-driven framework and confidence scoring, consistently beat the market?
Table 3 presents an example combination of 12 alphas generated by our framework, evaluated on the SSE50 constituent stock set. The table details the seed alphas selected by the LLM from each category, along with their respective weights and Information Coefficient (IC) values. The weight combination IC value is quite high as -0.0587. Although some of the seed alphas exhibit relatively low IC values individually, their removal results in a significant drop in the retrained combination weight, indicating their critical role in the overall performance. For example, if we remove alpha #6 the weight combination will drop to -0.055; once we remove the alpha #11, the weight combination will drop to merely 0.0491. This suggests that the seed alpha set selected by the LLM synergizes effectively, providing robust predictive power. (zhang2020information, )
| Alpha | Weight | IC(SSE50) | |
| 1 | (CLOSE - DELAY(CLOSE, 14)) | -0.1459 | 0.0209 |
| 2 | (RSI - DELAY(RSI, 14)) | -1.0265 | -0.0225 |
| 3 | (CLOSE - DELAY(SMA(CLOSE, 14), 7)) | -0.1978 | 0.0193 |
| 4 | (MA(CLOSE, 20) - CLOSE) | 0.0556 | -0.0186 |
| 5 | (SMA(CLOSE, 20) - CLOSE) | -0.945 | -0.0186 |
| 6 | (MAX(HIGH, 20) - CLOSE) | -0.4053 | -0.0185 |
| 7 | (100-RSI) | -0.3199 | 0.0194 |
| 8 | (BOLL_UP - BOLL_DOWN) / SMA(CLOSE, 20) | 3.6186 | 0.0278 |
| 9 | STD(CLOSE, 10) / STD(CLOSE, 50) | -0.183 | 0.0236 |
| 10 | VOLUME / MARKET_CAP | -3.2145 | -0.0194 |
| 11 | VOLUME * CLOSE | -0.0058 | 0.0187 |
| 12 | (EPS / DELAY(EPS, 1) - 1) | -1.8351 | -0.0215 |
| Weighted Combination | -0.0587 | ||
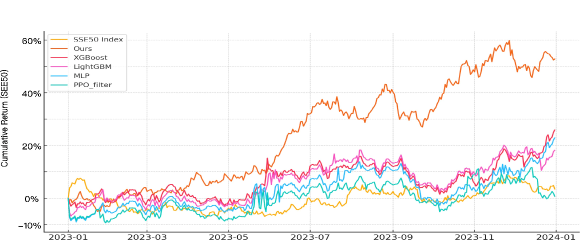
To address the question of whether our overall strategy, incorporating the LLM-driven framework and confidence scoring, can consistently beat the market, we conducted a backtest using a straightforward investment approach during the period from January 1, 2023, to December 31, 2023, on the SSE50 dataset. Our strategy involves a daily portfolio reconstruction based on a top- drop selection process. Each trading day, we rank the stocks by their alpha values and select the top stocks for investment. We aim to distribute investments evenly among these selected stocks, but we limit our transactions to a maximum of stocks per day to reduce trading costs. For this experiment, we set to 13 and to 5 . The net worth progression of the respective strategies over the testing period is shown in Figure 7. Despite not explicitly optimizing for absolute returns, our framework demonstrates impressive performance in the backtest, achieving the highest profit compared to other methods. Our cumulative return for 2023 backtest comes to positive and meanwhile the index performance is -11.73%, EFund performance is -9.17% and the Boshi Fund performance is -8.81%. We also do the compression with others alpha mining work shows our framework are able to gain most profit in the market.
This approach shows the potential of our LLM-driven framework combined with confidence scoring to consistently outperform the market by adapting dynamically to changing conditions and minimizing costs through a disciplined investment strategy.
5. Related Work
5.1. Formulaic alphas
Formulaic alphas in quantitative investment refer to systematic, rule-based strategies that generate excess returns by exploiting specific market patterns, anomalies, or inefficiencies. (kakushadze2016101, ) These strategies use predefined mathematical models or algorithms and are often implemented through automated trading systems. The common method for creating formulaic alphas is genetic programming involves structure and numerical mutations to generate new alphas. (cong2021alphaportfolio, ) The gplearn library is enhanced with time-series operators specific forming an alpha-mining framework that incorporates mutual information as the fitness measure. (lin2019alpha, ) AlphaEvolve evolving new alphas from existing ones, using algorithmic graphs for more complex and accurate predictions, though this can reduce interpretability and increase the risk of overfitting. (cui2021alphaevolve, ) Another approach is Machine learning-based alphas are predictive models designed to generate trading signals or investment strategies using advanced machine learning techniques. Key algorithms include neural networks, such as Long Short-Term Memory (LSTM) (hochreiter1997lstm, ) and Transformer models (vaswani2017attention, ), which excel at capturing complex temporal dependencies in time series data. Decision trees, exemplified by models like XGBoost (chen2016xgboost, ) and LightGBM (ke2017lightgbm, ), are valued for their interpretability and ability to handle high-dimensional data. Explainable AI (XAI) (arrieta2020xai, ) methods and tools provide deeper insights into how these models make decisions, fostering greater understanding and trust among investors. Specialized network structures for stock forecasting, such as SFM (zhang2017stock, ), which employs a DFT-like mechanism, have also been developed. More recent research focuses on integrating non-standard data with time series data. For example, REST (xu2021rest, ) combines multi-granular time series data with historical event data to model the overall market. HIST (xu2021hist, ) uses concept graphs alongside regular time series data to capture commonalities in future trends across different stock groups.
5.2. Financial Domain LLM
The development of general-domain large language models (LLMs) has spurred interest in Finance Large Language Models (Fin-LLMs). While general LLMs are well-studied, Fin-LLMs are still emerging (novy-marx2015momentum, ; yang2023investlm, ; zhang2023instruction, ; zhao2023survey, ). Open-source LLMs, such as LLaMA(touvron2023llama, ), BLOOM (bloom2023, ), and Flan-T5(chung2022scaling, ), provide flexibility and privacy on self-hosted servers but may underperform compared to proprietary models. Fine-tuned financial LLMs outperform base models (e.g., LLaMA) and other open-source LLMs (e.g., BLOOM) in finance tasks, showing enhanced domain-specific comprehension (lewis2020retrieval, ). However, in generative tasks, their performance is comparable or inferior to general LLMs like ChatGPT and GPT-4, indicating the need for better domain-specific datasets (koa2024learning, ).
5.3. Multimodal & Multi-Agent LLM
The integration of multimodal large language models (LLMs) in the investment sector has been extensively researched, highlighting their potential to transform financial technology. Li et al. (li2023multimodal, ) demonstrate how multimodal LLMs can process diverse data types such as text, images, and numerical data, offering comprehensive insights and predictive capabilities. Ouyang et al. (ouyang2024modal, ) emphasize the robustness of these models in developing investment strategies that mitigate market volatility risks. By analyzing textual data from news articles and social media, these models can gauge investor emotions and predict market movements with higher accuracy. (zhao2024revolutionizing, ). This is particularly beneficial in high-frequency trading, where anticipating market shifts can provide a competitive edge (zhang2024multimodal, ). In portfolio management, multimodal LLMs offer personalized investment advice tailored to individual risk profiles and financial goals. (li2024cumo, ). These models analyze a client’s financial history and current market conditions to recommend optimal asset allocations and strategies, enhancing client satisfaction and portfolio performance. Additionally, they automate routine tasks such as data entry and report generation, allowing investment professionals to focus on strategic activities (luz2024enhancing, ).
The application of multi-agent LLMs further enhances market analysis and portfolio management. Zhang et al. (zhang2024multimodal, ) highlight how these models leverage vast datasets and advanced natural language processing to interpret financial reports, news, and social media sentiment, providing nuanced insights. Multi-agent systems simulate various market scenarios and stress tests, enabling fund managers to devise robust strategies resilient to market volatility (talebirad2023multiagent, ). The collaborative operation of multiple agents ensures diverse strategies can be tested and optimized in parallel, promoting a balanced approach to risk and return (wang2024rethinking, ). However, the implementation of these advanced models raises ethical and governance considerations. Ensuring transparency, accountability, and adherence to ethical guidelines and regulatory standards is crucial to maintaining investor trust and market integrity. Managing potential biases in data and model training is also essential to prevent systemic risks and ensure fair outcomes (yu2024finmem, ; mundhenk2021symbolic, ).
5.4. Discussion
The term “formulaic alpha” is often associated with investing, the concept of simple and interpretable formulaic predictors, which can be combined into more expressive models and many more application scenarios. The concept of the “formulaic alpha” can solve many forecasting problems in other subjects such as energy consumption prediction, anomaly detection, and biomedical applications. (deb2017review, ; ashok2018online, ; tuarob2017feeling, )The work also has potential future work, The current framework utilizes a multi-Agent architecture to evaluate market conditions and select alpha factors. Future work can explore transitioning this architecture to a Mixture of Experts (MoE) structure, which can improve learning efficiency and model performance. MoE can dynamically allocate computational resources to different ”experts” based on the specific characteristics of the input data, thereby enhancing the model’s ability to learn and distinguish category seed alphas features more effectively. (masoudnia2014mixture, )Another promising avenue for future research is the incorporation of financial knowledge graph techniques into the strategy development process. Financial markets are inherently complex and interconnected, with numerous dependencies between stocks, sectors, and economic indicators. (wang2023methods, ) By introducing the knowledge graph information may help in our stock selection phase and achieve better performance in the future.
6. Conclusion
In this paper, we proposed a novel framework for quantitative stock investment and portfolio management by leveraging advancements in Large Language Models (LLMs) and multi-Agent architectures. Our framework addresses the challenges of instability and high uncertainty in existing models by integrating LLMs to generate diversified alphas and employing a multi-Agent approach to dynamically evaluate market conditions. The LLMs mine and generate potential alpha factors from a multimodal financial information landscape, providing a comprehensive understanding of market dynamics and a rich set of predictive signals. Subsequently, we construct a diverse pool of trading agents with various risk preferences through an multi-Agent approach, enabling personalized market insights and trading strategies. The final stage involves a sophisticated weight deep learning mechanism that dynamically selects and assigns weights to the most relevant agents based on real-time market conditions. Through extensive experiments on Chinese stock markets, we demonstrate that our framework significantly outperforms tranditional alpha generating SOTA works, human traders performance & index across multiple financial metrics.
References
- [1] Vladi Nikolov. 3 quantitative strategies based on alternative data. 2024.
- [2] I. Tulchinsky. Finding Alphas: A Quantitative Approach to Building Trading Strategies. 2015.
- [3] Eugene F Fama. Efficient capital markets: A review of theory and empirical work. The Journal of Finance, 25(2):383–417, 1970.
- [4] Franklin Allen and Risto Karjalainen. Using genetic algorithms to find technical trading rules. Journal of Financial Economics, 51(2):245–271, 1999.
- [5] Can Cui, Wei Wang, Meihui Zhang, Gang Chen, Zhaojing Luo, and Beng Chin Ooi. Alphaevolve: A learning framework to discover novel alphas in quantitative investment. In Proceedings of the 2021 International Conference on Management of Data (SIGMOD ’21), pages 2208–2216, Virtual Event, China, 2021. ACM.
- [6] Shuo Yu, Hongyan Xue, Xiang Ao, Feiyang Pan, Jia He, Dandan Tu, and Qing He. Generating synergistic formulaic alpha collections via reinforcement learning. In Proceedings of the 29th ACM SIGKDD Conference on Knowledge Discovery and Data Mining (KDD ’23), pages 5476–5486, New York, NY, USA, 2023. Association for Computing Machinery.
- [7] Yumo Xu and Shay B Cohen. Stock movement prediction from tweets and historical prices. In Proceedings of the 56th Annual Meeting of the Association for Computational Linguistics (ACL), pages 1970–1979, 2018.
- [8] Chi Chen, Li Zhao, Jiang Bian, Chunxiao Xing, and Tie-Yan Liu. Investment behaviors can tell what inside: Exploring stock intrinsic properties for stock trend prediction. In Proceedings of the 25th ACM SIGKDD International Conference on Knowledge Discovery & Data Mining, pages 2376–2384, 2019.
- [9] Frank J Fabozzi, Sergio M Focardi, and Petter N Kolm. Quantitative equity investing: Techniques and strategies. John Wiley & Sons, 2010.
- [10] Feng Zhang, Ruite Guo, and Honggao Cao. Information coefficient as a performance measure of stock selection models, 2020.
- [11] OpenAI. Gpt-4 technical report, 2023.
- [12] William F Sharpe. The sharpe ratio. Journal of portfolio management, 21(1):49–58, 1994.
- [13] Yinpeng Chen and et al. Dynamic relu. In European Conference on Computer Vision. Springer International Publishing, 2020.
- [14] Weiping Li and Feng Mei. Asset returns in deep learning methods: An empirical analysis on sse 50 and csi 300. Research in International Business and Finance, 54:101291, 2020.
- [15] Zura Kakushadze. 101 formulaic alphas. Wilmott, 2016(84):72–81, 2016.
- [16] L. W. Cong, K. Tang, J. Wang, and Y. Zhang. Alphaportfolio: Direct construction through deep reinforcement learning and interpretable ai, 2021.
- [17] Xiaoming Lin, Ye Chen, Ziyu Li, and Kang He. Stock alpha mining based on genetic algorithm. Technical report, Huatai Securities Research Center, 2019.
- [18] Sepp Hochreiter and Jürgen Schmidhuber. Long short-term memory. Neural Computation, 9(8):1735–1780, 1997.
- [19] Ashish Vaswani, Noam Shazeer, Niki Parmar, Jakob Uszkoreit, Llion Jones, Aidan N. Gomez, Lukasz Kaiser, and Illia Polosukhin. Attention is all you need. In Isabelle Guyon, Ulrike von Luxburg, Samy Bengio, Hanna M. Wallach, Rob Fergus, S. V. N. Vishwanathan, and Roman Garnett, editors, Advances in Neural Information Processing Systems 30: Annual Conference on Neural Information Processing Systems 2017, pages 5998–6008, Long Beach, CA, USA, 2017. Neural Information Processing Systems Foundation.
- [20] Tianqi Chen and Carlos Guestrin. Xgboost: A scalable tree boosting system. In Balaji Krishnapuram, Mohak Shah, Alexander J. Smola, Charu C. Aggarwal, Dou Shen, and Rajeev Rastogi, editors, Proceedings of the 22nd ACM SIGKDD International Conference on Knowledge Discovery and Data Mining, pages 785–794, San Francisco, CA, USA, 2016. ACM.
- [21] Guolin Ke, Qi Meng, Thomas Finley, Taifeng Wang, Wei Chen, Weidong Ma, Qiwei Ye, and Tie-Yan Liu. Lightgbm: A highly efficient gradient boosting decision tree. In Isabelle Guyon, Ulrike von Luxburg, Samy Bengio, Hanna M. Wallach, Rob Fergus, S. V. N. Vishwanathan, and Roman Garnett, editors, Advances in Neural Information Processing Systems 30: Annual Conference on Neural Information Processing Systems 2017, pages 3146–3154, Long Beach, CA, USA, 2017. Neural Information Processing Systems Foundation.
- [22] Alejandro Barredo Arrieta and et al. Explainable artificial intelligence (xai): Concepts, taxonomies, opportunities and challenges toward responsible ai. Information Fusion, 58:82–115, 2020.
- [23] Liheng Zhang, Charu C. Aggarwal, and Guo-Jun Qi. Stock price prediction via discovering multi-frequency trading patterns. In Proceedings of the 23rd ACM SIGKDD International Conference on Knowledge Discovery and Data Mining, pages 2141–2149, Halifax, NS, Canada, 2017. ACM.
- [24] Wentao Xu, Weiqing Liu, Chang Xu, Jiang Bian, Jian Yin, and Tie-Yan Liu. Rest: Relational event-driven stock trend forecasting. In Jure Leskovec, Marko Grobelnik, Marc Najork, Jie Tang, and Leila Zia, editors, WWW ’21: The Web Conference 2021, pages 1–10, Virtual Event / Ljubljana, Slovenia, 2021. ACM / IW3C2.
- [25] Wentao Xu, Weiqing Liu, Lewen Wang, Yingce Xia, Jiang Bian, Jian Yin, and Tie-Yan Liu. Hist: A graph-based framework for stock trend forecasting via mining concept-oriented shared information, 2021.
- [26] Robert Novy-Marx. Fundamentally, momentum is fundamental momentum. Technical Report w20984, NBER, 2015.
- [27] Y. Yang, Y. Tang, and K. Y. Tam. Investlm: A large language model for investment using financial domain instruction tuning, 2023.
- [28] S. Zhang, L. Dong, X. Li, S. Zhang, X. Sun, S. Wang, and et al. Instruction tuning for large language models: A survey, 2023.
- [29] W. X. Zhao, K. Zhou, J. Li, T. Tang, X. Wang, Y. Hou, Y. Min, B. Zhang, J. Zhang, Z. Dong, and et al. A survey of large language models, 2023.
- [30] H. Touvron, T. Lavril, G. Izacard, X. Martinet, M.-A. Lachaux, T. Lacroix, B. Rozière, N. Goyal, E. Hambro, F. Azhar, A. Rodriguez, A. Joulin, E. Grave, and G. Lample. Llama: Open and efficient foundation language models, 2023.
- [31] B. W. and et al. Bloom: A 176b-parameter open-access multilingual language model, 2023.
- [32] H. W. and et al. Scaling instruction-finetuned language models, 2022.
- [33] P. Lewis and et al. Retrieval-augmented generation for knowledge-intensive nlp tasks. In NeurIPS, volume 33, pages 9459–9474, 2020.
- [34] K. J. Koa, Y. Ma, R. Ng, and T.-S. Chua. Learning to generate explainable stock predictions using self-reflective large language models. In Proceedings of the ACM on Web Conference 2024, pages 4304–4315, 2024.
- [35] Li L, Chang T Y, and Wang H. Multimodal gen-ai for fundamental investment research, 2023.
- [36] Ouyang K, Liu Y, Li S, and et al. Modal-adaptive knowledge-enhanced graph-based financial prediction from monetary policy conference calls with llm, 2024.
- [37] H. Zhao, Z. Liu, Z. Wu, and et al. Revolutionizing finance with llms: An overview of applications and insights, 2024.
- [38] W. Zhang, L. Zhao, H. Xia, and et al. A multimodal foundation agent for financial trading: Tool-augmented, diversified, and generalist. Technical report, 2024.
- [39] J. Li, X. Wang, S. Zhu, and et al. Cumo: Scaling multimodal llm with co-upcycled mixture-of-experts, 2024.
- [40] A. Luz. Enhancing the interpretability and explainability of ai-driven risk models using llm capabilities. Technical report, EasyChair, 2024.
- [41] Y. Talebirad and A. Nadiri. Multi-agent collaboration: Harnessing the power of intelligent llm agents, 2023.
- [42] Q. Wang, Z. Wang, Y. Su, and et al. Rethinking the bounds of llm reasoning: Are multi-agent discussions the key?, 2024.
- [43] Yangyang Yu and et al. Finmem: A performance-enhanced llm trading agent with layered memory and character design. In Proceedings of the AAAI Symposium Series, volume 3, 2024.
- [44] T. Nathan Mundhenk, Mikel Landajuela, Ruben Glatt, Daniel M. Faissol, and Brenden K. Petersen. Symbolic regression via neural-guided genetic programming population seeding. In 9th International Conference on Learning Representations (ICLR), Virtual Event, Austria, 2021.
- [45] Chirag Deb, Fan Zhang, Junjing Yang, Siew Eang Lee, and Kwok Wei Shah. A review on time series forecasting techniques for building energy consumption. Renewable and Sustainable Energy Reviews, 74:902–924, 2017.
- [46] Aditya Ashok, Manimaran Govindarasu, and Venkataramana Ajjarapu. Online detection of stealthy false data injection attacks in power system state estimation. IEEE Transactions on Smart Grid, 9(3):1636–1646, 2018.
- [47] Suppawong Tuarob, Conrad S. Tucker, Soundar R. T. Kumara, C. Lee Giles, Aaron L. Pincus, David E. Conroy, and Nilam Ram. How are you feeling: A personalized methodology for predicting mental states from temporally observable physical and behavioral information. Journal of Biomedical Informatics, 68:1–19, 2017.
- [48] Saeed Masoudnia and Reza Ebrahimpour. Mixture of experts: a literature survey. Artificial Intelligence Review, 42:275–293, 2014.
- [49] Liping Wang, Jiawei Li, Lifan Zhao, Zhizhuo Kou, Xiaohan Wang, Xinyi Zhu, Hao Wang, Yanyan Shen, and Lei Chen. Methods for acquiring and incorporating knowledge into stock price prediction: A survey. arXiv preprint arXiv:2308.04947, 2023.
Appendix A Seed Alphas document lists for GPTs
| Document name | Author |
| Financial Time Series Prediction Using Mixture of Experts | M. Serdar Yumlu, Fikret S. Gurgen, and Nesrin Okay |
| Model-Free Implied Dependence and the Cross-Section of Returns | Koen Inghelbrecht, Gertjan Verdickt, Daniël Linders, and Yong Xie |
| Dynamic Graph-based Deep Reinforcement Learning with Long and Short-term Relation Modeling for Portfolio Optimization | Pengqian Yu, Joon Sern Lee, Ilya Kulyatin, Zekun Shi, Sakyasingha Dasgupta |
| Can Large Language Models Beat Wall Street? Unveiling the Potential of AI in Stock Selection | Georgios Fatouros, Konstantinos Metaxas, John Soldatos, Dimosthenis Kyriazis |
| Mastering Stock Markets with Efficient Mixture of Diversified Trading Experts | Shuo Sun, Xinrun Wang, Wanqi Xue, Xiaoxuan Lou, and Bo An |
| 101 Formulaic Alphas | Zura Kakushadze |
| A Multimodal Foundation Agent for Financial Trading: Tool-Augmented, Diversified, and Generalist | Wentao Zhang, Lingxuan Zhao, Haochong Xia, Shuo Sun, Jiaze Sun, Molei Qin, Xinyi Li, Yuqing Zhao, Yilei Zhao, Xinyu Cai, Longtao Zheng, Xinrun Wang, Bo An |
| Causal Factor Investing: Can Factor Investing Become Scientific? | Marcos Lopez de Prado |
| Alpha-GPT: Human-AI Interactive Alpha Mining for Quantitative Investment | Saizhuo Wang, Hang Yuan, Leon Zhou, Lionel M. Ni, Heung-Yeung Shum, Jian Guo |
| AlphaPortfolio: Direct Construction Through Deep Reinforcement Learning and Interpretable AI | Lin William Cong, Ke Tang, Jingyuan Wang, Yang Zhang |
| FinGPT: Open-Source Financial Large Language Models | Hongyang (Bruce) Yang, Xiao-Yang Liu, Christina Dan Wang |
Appendix B Generate Seed Alpha factory
| Category | Name | Short Code |
| Momentum | Price Momentum | (CLOSE - DELAY(CLOSE, 14)) |
| Volume Momentum | (VOLUME - DELAY(VOLUME, 14)) | |
| RSI Momentum | (RSI - DELAY(RSI, 14)) | |
| Rate of Change (ROC) | ((CLOSE / DELAY(CLOSE, 14)) - 1) | |
| MACD Momentum | (MACD - DELAY(MACD, 14)) | |
| Momentum Oscillator | ((CLOSE - DELAY(CLOSE, 14)) / DELAY(CLOSE, 14)) | |
| Chande Momentum Oscillator (CMO) | (SUM(IF(CLOSE - DELAY(CLOSE, 1) ¿ 0, CLOSE - DELAY(CLOSE, 1), 0), 14) - SUM(IF(CLOSE - DELAY(CLOSE, 1) 0, DELAY(CLOSE, 1) - CLOSE, 0), 14)) / (SUM(IF(CLOSE - DELAY(CLOSE, 1) ¿ 0, CLOSE - DELAY(CLOSE, 1), 0), 14) + SUM(IF(CLOSE - DELAY(CLOSE, 1) 0, DELAY(CLOSE, 1) - CLOSE, 0), 14)) * 100 | |
| Stochastic Momentum Index (SMI) | ((CLOSE - MIN(LOW, 14)) - (MAX(HIGH, 14) - CLOSE)) / (MAX(HIGH, 14) - MIN(LOW, 14)) | |
| ATR Momentum | (ATR - DELAY(ATR, 14)) | |
| Detrended Price Oscillator (DPO) | (CLOSE - DELAY(SMA(CLOSE, 14), 7)) | |
| Average Directional Index (ADX) Momentum | (ADX - DELAY(ADX, 14)) | |
| Mean Reversion | Mean Reversion | (MEAN(CLOSE, 20) - CLOSE) |
| Z-Score Mean Reversion | (CLOSE - MEAN(CLOSE, 20)) / STD(CLOSE, 20) | |
| Bollinger Bands | (CLOSE - LOWER_BAND) / (UPPER_BAND - LOWER_BAND) | |
| Keltner Channel | (CLOSE - LOWER_CHANNEL) / (UPPER_CHANNEL - LOWER_CHANNEL) | |
| Moving Average Reversion | (SMA(CLOSE, 20) - CLOSE) | |
| Exponential Moving Average (EMA) Reversion | (EMA(CLOSE, 20) - CLOSE) | |
| Distance from High | (MAX(HIGH, 20) - CLOSE) | |
| Distance from Low | (CLOSE - MIN(LOW, 20)) | |
| Relative Strength Index (RSI) Reversion | (100 - RSI) | |
| Percent B | ((CLOSE - LOWER_BAND) / (UPPER_BAND - LOWER_BAND)) * 100 | |
| Volatility | Standard Deviation | STD(CLOSE, 20) |
| Average True Range (ATR) | ATR(14) | |
| Bollinger Band Width | (UPPER_BAND - LOWER_BAND) / SMA(CLOSE, 20) |
| Historical Volatility | STD(RETURNS, 20) * SQRT(252) | |
| Volatility Ratio | STD(CLOSE, 10) / STD(CLOSE, 50) | |
| Chaikin Volatility | (EMA(HIGH - LOW, 10) / DELAY(EMA(HIGH - LOW, 10), 10)) - 1 | |
| Garman-Klass Volatility | SQRT(0.5 * LOG(HIGH / LOW)2 - (2 * LOG(2) - 1) * LOG(CLOSE / OPEN)2) | |
| Parkinson Volatility | SQRT((1 / (4 * N * LOG(2))) * SUM(LOG(HIGH / LOW)2, 20)) | |
| Yang-Zhang Volatility | SQRT(VAR(LOG(CLOSE / OPEN)) + 0.5 * VAR(LOG(HIGH / OPEN) - LOG(LOW / OPEN)) + 0.25 * VAR(LOG(CLOSE / DELAY(OPEN, 1)))) | |
| Ulcer Index | SQRT(MEAN(DRAWDOWN2, 14)) | |
| Fundamental | Price-to-Earnings Ratio (P/E) | (CLOSE / EPS) |
| Price-to-Book Ratio (P/B) | (CLOSE / BOOK_VALUE) | |
| Dividend Yield | (DIVIDENDS / CLOSE) | |
| Earnings Yield | (EPS / CLOSE) | |
| Sales-to-Price Ratio | (SALES / CLOSE) | |
| Cash Flow Yield | (OPERATING_CASH_FLOW / CLOSE) | |
| Liquidity | Trading Volume | VOLUME |
| Average Trading Volume | MEAN(VOLUME, 20) | |
| Volume Rate of Change (VROC) | (VOLUME - DELAY(VOLUME, 14)) / DELAY(VOLUME, 14) | |
| On-Balance Volume (OBV) | SUM(VOLUME * SIGN(CLOSE - DELAY(CLOSE, 1))) | |
| Liquidity Ratio | VOLUME / MARKET_CAP | |
| Turnover Rate | VOLUME / SHARES_OUTSTANDING | |
| Amihud Illiquidity Ratio | ABS(RETURN) / VOLUME | |
| High-Low Spread | (HIGH - LOW) / CLOSE | |
| Dollar Volume | VOLUME * CLOSE | |
| Debt-to-Equity Ratio | (TOTAL_DEBT / TOTAL_EQUITY) | |
| Return on Equity (ROE) | (NET_INCOME / EQUITY) | |
| Return on Assets (ROA) | (NET_INCOME / TOTAL_ASSETS) | |
| Gross Profit Margin | (GROSS_PROFIT / REVENUE) | |
| Price-to-Sales Ratio (P/S) | (CLOSE / SALES) | |
| Price-to-Cash Flow Ratio (P/CF) | (CLOSE / OPERATING_CASH_FLOW) | |
| Book-to-Market Ratio (B/M) | (BOOK_VALUE / CLOSE) | |
| Enterprise Value to EBITDA (EV/EBITDA) | (ENTERPRISE_VALUE / EBITDA) | |
| Bid-Ask Spread | (ASK_PRICE - BID_PRICE) / MID_PRICE | |
| High-Low Spread | (HIGH - LOW) / CLOSE | |
| Dollar Volume | VOLUME * CLOSE | |
| Quality | Gross Profit Margin | (GROSS_PROFIT / REVENUE) |
| Operating Profit Margin | (OPERATING_INCOME / REVENUE) | |
| Net Profit Margin | (NET_INCOME / REVENUE) | |
| Earnings Stability | STD(EPS, 5) / MEAN(EPS, 5) | |
| Debt to Equity Ratio | (TOTAL_DEBT / TOTAL_EQUITY) | |
| Interest Coverage Ratio | (EBIT / INTEREST_EXPENSE) | |
| Cash Conversion Cycle | (DIO + DSO - DPO) | |
| Asset Turnover Ratio | (REVENUE / TOTAL_ASSETS) | |
| Growth | Earnings Growth Rate | (EPS / DELAY(EPS, 1) - 1) |
| Revenue Growth Rate | (REVENUE / DELAY(REVENUE, 1) - 1) | |
| EBITDA Growth Rate | (EBITDA / DELAY(EBITDA, 1) - 1) | |
| Cash Flow Growth Rate | (CASH_FLOW / DELAY(CASH_FLOW, 1) - 1) | |
| Dividends Growth Rate | (DIVIDENDS / DELAY(DIVIDENDS, 1) - 1) | |
| Book Value Growth Rate | (BOOK_VALUE / DELAY(BOOK_VALUE, 1) - 1) | |
| Sales Growth Rate | (SALES / DELAY(SALES, 1) - 1) | |
| Asset Growth Rate | (ASSETS / DELAY(ASSETS, 1) - 1) | |
| Equity Growth Rate | (EQUITY / DELAY(EQUITY, 1) - 1) | |
| Retained Earnings Growth Rate | (RETAINED_EARNINGS / DELAY(RETAINED_EARNINGS, 1) - 1) |
| Technical | Moving Average (MA) | SMA(CLOSE, 20) |
| Exponential Moving Average (EMA) | EMA(CLOSE, 20) | |
| Relative Strength Index (RSI) | RSI(14) | |
| Moving Average Convergence Divergence (MACD) | (EMA(CLOSE, 12) - EMA(CLOSE, 26)) | |
| Bollinger Bands | UPPER_BAND - LOWER_BAND | |
| Stochastic Oscillator | ((CLOSE - MIN(LOW, 14)) / (MAX(HIGH, 14) - MIN(LOW, 14))) * 100 | |
| Average True Range (ATR) | ATR(14) | |
| Commodity Channel Index (CCI) | (TYPICAL_PRICE - SMA(TYPICAL_PRICE, 20)) / (0.015 * MEAN_DEV(TYPICAL_PRICE, 20)) | |
| Williams %R | ((MAX(HIGH, 14) - CLOSE) / (MAX(HIGH, 14) - MIN(LOW, 14))) * -100 | |
| Macro Economics | GDP Growth Rate | GDP - DELAY(GDP, n) |
| Inflation Rate | CPI - DELAY(CPI, n) | |
| Unemployment Rate | UNEMPLOYMENT_RATE - DELAY(UNEMPLOYMENT_RATE, n) | |
| Interest Rate | INTEREST_RATE - DELAY(INTEREST_RATE, n) | |
| Industrial Production Index | IPI - DELAY(IPI, n) | |
| Retail Sales Growth | RETAIL_SALES - DELAY(RETAIL_SALES, n) | |
| Housing Starts Growth | HOUSING_STARTS - DELAY(HOUSING_STARTS, n) | |
| Consumer Confidence Index (CCI) | CCI - DELAY(CCI, n) | |
| Trade Balance | EXPORTS - IMPORTS | |
| Foreign Exchange Reserves | FX_RESERVES - DELAY(FX_RESERVES, n) |
Appendix C Sample prompt for Seed Alpha selection
1. The training set includes:
-
•
Financial Reports: 4 quarters (from December 31, 2021, to September 30, 2022) for 50 companies listed in the SSE 50.
-
•
Factor Analysis Data: 37 factors (from September 30, 2022, to December 30, 2022) divided into groups: Momentum, Mean Reversion, Volatility, Fundamental, Quality, Growth, Technical, Macro Economics. The metric used is the Information Coefficient (IC).
2. Objective: Learn the relationship between the performance of financial reports for the first four quarters from 2022 to 2023 and the factor analysis data (IC) for each of the 37 factors in the last quarter of 2022.
3. When provided with the test set (performance of the first 4 quarters of 2023):
-
•
Select the factors that will perform best in the last quarter of the SSE 50.
-
•
Provide a confidence score & the risk preference for your selection for each selected Alpha factor.
4. Selection Criteria:
-
•
If no relationship between financial reports and IC can be found, select the Alpha factor with the highest IC value in each group.
-
•
For verification of market information differences, if no relationship between financial reports and IR can be found, select the Alpha factor with the highest IR value.