Implications of feedback solutions to the tension for the baryon fractions of galaxy groups and clusters
Abstract
Recent large-scale structure (LSS) surveys have revealed a persistent tension in the value of compared to predictions from the standard cosmological model. This tension may suggest the need for new physics beyond the standard model, but an accurate characterisation of baryonic effects is essential to avoid biases. Although some studies indicate that baryonic effects are too small to resolve this tension, others propose that more aggressive feedback mechanisms could reconcile differences between cosmic microwave background (CMB) measurements and low-redshift LSS observations. In this paper, we investigate the role of baryonic effects in alleviating the tension. We extend the SP(k) model (Salcido et al., 2023), which was trained on hundreds of cosmological hydrodynamical simulations to map the suppression of the matter power spectrum to the baryon fraction in groups and clusters, to predict the required baryon fraction for a given suppression. We then compare predictions from recent cosmic shear (weak lensing) analyses with the latest baryon budget measurements from X-ray and weak gravitational lensing studies. Our findings show that studies marginalising over baryonic effects while fixing cosmological parameters to a Planck-like cosmology predict strong suppression and baryon fractions that are much lower than existing low-redshift baryon budget estimates of galaxy groups and clusters. Conversely, most studies that marginalise over both cosmological parameters and baryonic effects imply baryon fractions that are consistent with observations but lower values of than inferred from the CMB. Unless the observed baryon fractions are biased high by a factor of several, these results suggest that a mechanism beyond baryonic physics alone is required to modify or slow down the growth of structure in the universe in order to resolve the tension.
keywords:
cosmology: theory – cosmology: large-scale structure of Universe.1 Introduction
The CDM cosmological model, deeply rooted in General Relativity, has long served as the foundation for our understanding of the Universe. It elegantly explains a multitude of cosmic observations, from the cosmic microwave background (CMB) to the large-scale structure (LSS) of matter at late times. However, recent large-scale structure surveys have delivered increasingly precise constraints on cosmological parameters, and they may be starting to reveal subtle cracks in the standard model (see e.g. Di Valentino et al., 2021; Abdalla et al., 2022).
One of these tensions is the so-called “ tension”. Weak gravitational lensing, a measure of the correlation in the distortions of the shapes of distant galaxies due to the intervening matter, has rapidly become an important test of the cosmological model. The quantity it best constrains is , a combination of the present-day matter density and , the (linearly-evolved) amplitude of the matter power spectrum filtered on 8 Mpc/h scales. The best-fit value of the amplitude of the matter power spectrum appears to be in mild () tension with the predictions of the standard model fitted to the cosmic microwave background (see Heymans et al. 2021; Abbott et al. 2022 and references therein). This tension, though not statistically compelling on its own, has persisted for nearly a decade and spans several independent probes, each indicating tensions of similar significance and in the same direction.
There are three possible solutions the “cosmological tensions” with the CDM model. The first, and perhaps the most exciting possibility, is that the standard model of cosmology is incorrect and nature is governed by more “exotic physics”. While CMB measurements probe the early universe, LSS observations directly constrain the present-day cosmological parameters. Consequently, a deviation between these two parameter measurements might indicate that LSS has followed an evolutionary path distinct from what the standard model predicts. If this is correct, it could have significant consequences for fundamental physics.
The two remaining possibilities are that the measurements (or analysis thereof) of either the CMB data and/or LSS are flawed in some way. In terms of the CMB, it is unlikely that unknown systematics are responsible for the tension, at least in terms of the theory, as the thermal physics of the early Universe is well understood. While the measurements themselves could have systematic errors, independent measurements from previous large CMB missions, e.g., WMAP 9-year, have similar levels of tensions (e.g. Beutler et al., 2016).
In terms of the LSS analysis, current measurements are less precise than the CMB, and the modelling is more complicated. For instance, to obtain unbiased weak lensing cosmological constraints, accurate modelling of the non-linear matter distribution at scales of is imperative (see e.g. Huterer & Takada 2005 and Hearin et al. 2012). This involves understanding not only the non-linear dark matter evolution due to gravity to the percent-level, but also the intricate feedback mechanisms associated with star formation and black hole growth that can significantly impact the distribution of matter on small scales. Failure to incorporate these effects can introduce biases in the inferred cosmological parameters from upcoming surveys like DESI, Euclid, and LSST (Semboloni et al., 2011; Semboloni et al., 2013; Chisari et al., 2019; Schneider et al., 2020; Castro et al., 2021).
Recent cosmic shear surveys, such as the Kilo Degree Survey (KiDS), the Dark Energy Survey (DES) and the Hyper Suprime-Cam (HSC), have implemented different strategies to account for and quantify baryonic effects. The KiDS analysis incorporates these effects via a halo model framework, marginalising over a phenomenological ‘bloating’ parameter that modulates the concentration of dark matter haloes (Asgari et al., 2021; Heymans et al., 2021; Tröster et al., 2021). In contrast, DES initially addressed baryonic effects by applying scale cuts to eliminate small-scale data most susceptible to these influences (DeRose et al., 2019; Amon et al., 2022; Krause et al., 2021; Secco et al., 2022). More recently, several studies have revisited the full DES dataset (without scale cuts) using baryonification techniques (Schneider & Teyssier, 2015; Aricò et al., 2021b) to explicitly model the impact of baryonic physics (Aricò et al., 2023; Chen et al., 2023; Bigwood et al., 2024), while Terasawa et al. (2024) use the halo model of (Mead et al., 2020) to explore the baryonic effect signature in the HSC Year3 cosmic shear data (Li et al., 2022). Additionally, a combined KiDS cosmic shear and Sunyaev-Zel’dovich effect analysis (Tröster et al., 2022) utilised the physically motivated halo model of Mead et al. (2020), while a joint cosmic shear analysis involving DES, KiDS, and the HSC applied the BACCOemu emulator (Aricò et al., 2021b) to explore baryonic effects (García-García et al., 2024). These studies have identified baryonic signatures at level, indicating that current observations are indeed sensitive to such effects.
In this paper, we investigate whether baryonic effects can alleviate the tension observed in cosmic shear (weak lensing) galaxy surveys. Previous studies based on cosmological hydrodynamical simulations suggest that the impact of baryonic effects may be too small to fully account for the observed tension (McCarthy et al., 2018; McCarthy et al., 2023). Nevertheless, recent work by Amon & Efstathiou (2022), Preston et al. (2023), and the joint analysis of the DES cosmic shear with the kinematic Sunyaev-Zel’dovich (kSZ) data from the Atacama Cosmology Telescope (ACT, Naess et al., 2020) in Bigwood et al. (2024), have proposed that by considering more aggressive feedback mechanisms–beyond those typically modelled in simulations–it may be possible to reconcile the cosmological parameters derived from CMB measurements with those inferred from low-redshift LSS observations.
To explore this hypothesis, we exploit the tight correlation between the suppression of the matter power spectrum and the baryon fraction within galaxy groups and clusters (van Daalen et al., 2020). Specifically, we extend the SP(k) model introduced by Salcido et al. (2023), which was calibrated using a comprehensive suite of 400 cosmological hydrodynamical simulations, to predict the baryon fraction required for a given level of suppression. We then input suppression functions derived from various KiDS and DES analyses into the SP(k) model, translating these into predictions for baryon fractions. These predicted fractions are subsequently compared with the most recent baryon budget measurements, drawn from high-resolution X-ray observations in the XXL survey and weak-lensing mass measurements from HSC presented in Akino et al. (2022).
This methodology provides a stringent test of cosmological inferences from weak lensing surveys, as accurately modelling baryonic effects is crucial to avoid conflicts with other astronomical observations, such as the baryon fractions observed in galaxy groups and clusters. By evaluating whether the baryon fractions inferred from the suppression of the matter power spectrum are consistent with observed values, we aim to assess the extent to which baryonic effects may contribute to resolving the tension.
The present study is structured as follows. In Section 2 we describe SP(k) empirical model that provides the mapping between the observable baryon fractions of groups/clusters and the suppression of the matter power spectrum, . In Section 3 we develop an ‘inverted’ version of the SP(k) model to predict the required baryon fraction from a given suppression, and test its accuracy against hydrodynamical simulations. In Section 4 model the required baryon fractions from several recent weak lensing studies and test them against observations. Finally, in Section 5 we summarise our findings.
2 The SP(k) model
SP(k) is a parametric model that describes the effects of baryon physics on the non-linear matter power spectrum (namely its suppression as a function of comoving wavenumber, ) based on the median baryon fraction of haloes as function of halo mass. The model uses an optimal mass, , defined as the halo mass that maximises the strength of the correlation between the suppression of the total matter power spectrum and the total baryon fraction at a given wavenumber . Salcido et al. (2023) provide the following parametric fit for the optimal mass based on the ANTILLES simulations:
| (1) |
where the halo mass could be specified using either of two different spherical overdensity (SO) masses, namely or , which are the masses enclosed within the radius whose mean density is 200 or 500 times the critical density of the Universe, respectively. The functions , and are modelled with a polynomial fit for their redshift dependence as:
| (2) | ||||
where . The best fit coefficients, , are given in Table 3 in Salcido et al. (2023).
The fractional impact of baryons on the total matter power spectrum is then modelled with the function:
| (3) |
where is the baryon fraction at the optimal halo mass normalised by the universal baryon fraction, i.e.,
| (4) |
and , , and are given by the functional forms:
| (5) | ||||
| (6) | ||||
| (7) |
The evolution of each parameter is modelled as a polynomial function in redshift using Eq. 2, with accordingly. The best-fit coefficients are given in Table 4 in Salcido et al. (2023).
3 Inverted SP(k)
A convenient feature of SP(k) is that, because it is based on a set of monotonic analytical equations, the model can be easily “inverted” to infer a required baryon fraction–halo mass relation given an input suppression of the power spectrum. This allows us to quickly check the implied baryon fractions of groups and clusters for a proposed suppression.
Solving for in Eq. 3 yields:
| (8) |
where the best fitting parameters for , and remain the same as before.
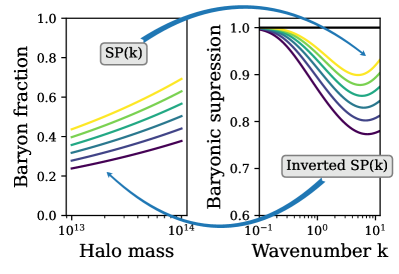
In Fig. 1, we illustrate how SP(k) and its inverted form in Eq. 8 are used to predict the suppression of the power spectrum based on the baryon fraction of haloes, and vice versa.
We test the accuracy of our inverted SP(k) model to recover the baryon fraction–halo mass relation against the BAHAMAS simulations (McCarthy et al., 2017; McCarthy et al., 2018), finding good agreement. We also tested using the cosmo-OWLS simulations (Le Brun et al., 2014), which were not included in either the calibration or validation sets presented in Salcido et al. (2023). These simulations use a flat CDM cosmology consistent with the WMAP 7-year results (Komatsu et al., 2011). The cosmological parameters are {, , , , , } = {0.272, 0.0455, 0.728, 0.81, 0.967, 0.704}. The simulations consist of a comoving volume with on a side and particles of dark matter particle mass, and initial gas particle mass. A full discussion of the sub-grid implementation, including the prescriptions for star formation, gas heating and cooling, black hole formation, and supernovae and active galactic nuclei (AGN) feedback models can be found in Le Brun et al. (2014) (see also Schaye et al. 2010). Due to their feedback implementation, the cosmo-OWLS simulations have lower-than-observed galaxy formation efficiencies for haloes with masses similar to the Milky Way’s ( M⊙). Hence, they consistently underpredict the abundance of galaxies with compared to recent galaxy stellar mass function observations (McCarthy et al., 2017).
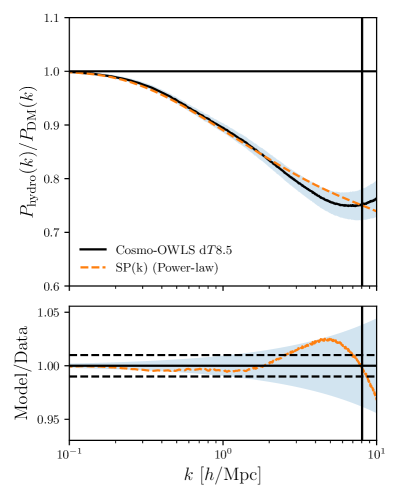
As we will discuss below, we are interested in simulations with strong baryonic suppression as a potential way to reconcile the tension in weak galaxy lensing surveys. Hence, we use the high AGN heating temperature model, cosmo-OWLS d, that predicts a lower gas fraction than inferred from recent X-ray observations (i.e., too much gas ejection). This removal of large quantities of gas results in a suppression of the total matter power spectrum , from large scales of all the way to small scales, (Chisari et al., 2019; van Daalen et al., 2020). In Fig. 2 we show the ratio of power spectra for the cosmo-OWLS d model with respect to its DM-only counterpart at redshift . The vertical black line shows the one-dimensional Nyquist frequency of the simulations, , where is the cube root of the total number of particles, and is the length of the box.
It is important to remember that all models have inherent limits and uncertainties associated with them. In particular, SP(k) provides an unbiased estimator of the true baryonic effects for a large ensemble of hydrodynamical simulations, but the error in the model increases with scale , giving rise to a heteroscedastic behaviour (Salcido et al., 2023). We should take these errors into consideration when inverse modelling the required baryon fraction from a given power spectrum suppression. Based on Figs. 8 and 9 in Salcido et al. (2023), we account for the maximum model uncertainties using a simple power-law that goes from a error at to error at . These uncertainties are shown as the light shaded blue region around the true suppression in Fig. 2.
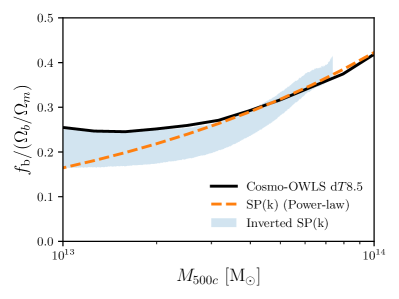
We now use the inverted SP(k) model to compute the required baryon fraction to reproduce the suppression of the matter power spectrum from the cosmo-OWLS d model. Using the model uncertainties directly into Eq. 8, the results are shown as the light shaded blue region in Fig. 3. The black line shows the true median baryon fraction computed directly from the simulations. We note that, in order to avoid noise in our modelling, we only used Eq. 8 to model scales , as for (very)large scales, the suppression of the matter power spectrum should be close to unity, independent of the baryon fraction. This is because a large fraction of the power on these scales comes from outside of haloes (van Daalen & Schaye, 2015). Hence, slight variations in the suppression may result in wide variations in the baryon fractions. Because the optimal mass in the SP(k) modelling plateaus for small scales, i.e. a narrow range of the most massive haloes are mapped to a significant range of large scales, our choice of ‘scale cut’ does not affect our ability to recover, or predict, the baryon fraction for large haloes (see Fig. 5 in Salcido et al., 2023). A scale cut111For comparison, a scale cut of corresponds to an optimal mass of of corresponds to the largest optimal mass recovered of as shown in Fig. 3.
SP(k) is a flexible model that is not restricted to a particular shape of the baryon fraction–halo mass relation, and by inverse modelling this relation using the power spectrum suppression directly, Fig. 3 shows that we are able to recover the true median baryon fraction–halo mas relation within the intrinsic uncertainties. Furthermore, the overall shape of the baryon fraction–halo mass relation form this particular simulation is well recovered.
Additionally, we can test specific functional forms for the baryon fraction–halo mass relation. As an example, we tested a simple power-law functional form for the relation. For the mass range that can be relatively well probed in current X-ray and Sunyaev-Zel’dovich effect observations (roughly ), the total baryon fraction of haloes can be roughly approximated by a power-law with constant slope (e.g. Mulroy et al., 2019; Akino et al., 2022). Hence, we use the following parameterisation,
| (9) |
where is the normalisation of the relation at a pivot mass of , and is the power-law slope.
Using SP(k), we find the best fitting values of and to reproduce the suppression of the matter power spectrum for the cosmo-OWLS d model directly, rather than fitting the baryon fraction. The best fit model is shown as a dashed orange line in Fig. 2. The figure shows that a simple power-law functional form can recover the suppression to better than up to , and to within for the entire range shown, up to . This error behaviour with wavenumber for a simple power-law form translates into a median baryon fraction that agrees with the true median for halo masses , but deviates for lower masses, as shown in Fig. 3. This is expected, as the simulations show a mass-dependent slope for the – relation.
4 Results
In this section, we use the inverted form of SP(k), as developed in Section 3, to model the baryon fraction–halo mass relation required to reproduce the suppression of the matter power spectrum observed in various cosmic shear analyses. We begin by presenting the results from cosmic shear studies of both the KiDS 1000 and DES Y3 surveys, which marginalise over baryonic effects while holding cosmological parameters fixed to a Planck-like cosmology. We then compare the modelled baryon fractions with the recent baryon budget measurements form Akino et al. (2022). In Section 4.3, we extend this analysis and comparison to cosmic shear studies that marginalise over both cosmological parameters and baryonic effects. Finally, we examine the findings from the latest DES Y3 weak lensing and kSZ joint analysis in Bigwood et al. (2024).
4.1 KiDS 1000 Cosmic shear + Planck CDM cosmology.
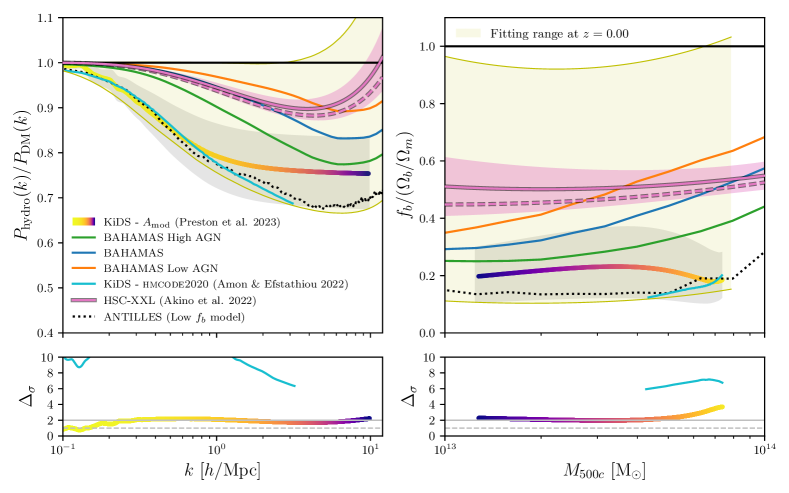
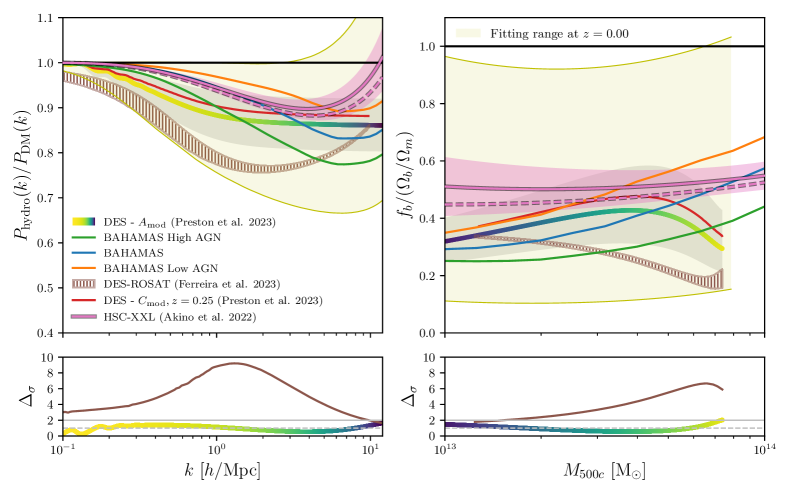
In the left panel of Fig. 4 we show the power spectrum suppression from Preston et al. (2023) using their phenomenological model required to match the KiDS 1000 cosmic shear measurements (Asgari et al., 2021) assuming Planck CDM priors on and . The line has been colour coded by the optimal halo mass in Eq. 1. In cyan, we show the inferred suppression from Amon & Efstathiou (2022) using hmcode2020 (Mead et al., 2021), that fixed the cosmological parameters to the best-fit Planck CDM values. We note that Amon & Efstathiou (2022) did not account for uncertainties on the Planck priors. For clarity, we only show the confidence interval for the model with a light grey shaded region.
For comparison, we show three feedback variations of the BAHAMAS simulations, Low AGN, Fiducial, and High AGN (with corresponding to respectively, McCarthy et al., 2017; McCarthy et al., 2018), where is the BAHAMAS subgrid parameter that controls the temperature increase of gas particles during AGN feedback events. These simulations have been shown to have consistent levels of suppression with the predictions from a joint analysis of KiDS cosmic shear and Sunyaev-Zel’dovich effect data (Tröster et al., 2022). We also show for comparison one of the most extreme feedback models in the ANTILLES suite (Salcido et al., 2023) in black. The light yellow shaded region shows the entire range of suppression spanned in the ANTILLES suite, which was specifically designed to conservatively bracket current observational constraints (with their associated uncertainties) on the stellar and gas fractions.
Using SP(k), we directly model the power spectrum suppression from the observed median baryon fraction of haloes from the latest HSC-XXL weak gravitational lensing data from Akino et al. (2022), with (pink solid) and without (pink dashed) a correction for the contribution of blue galaxies and the diffuse intracluster light. The light-shaded region encloses the confidence interval.
As already pointed out by Amon & Efstathiou (2022), for both the and the hmcode2020 models, a much more aggressive form of feedback beyond what is typically simulated is required to reconcile the KiDS 1000 cosmic shear measurements with a Planck CDM cosmology. We note that such levels of suppression can be achieved in cosmological hydrodynamical simulations with “extreme” feedback prescriptions such as the model shown from the ANTILLES suite (black dotted line). Nevertheless, as we discuss below, such extreme feedback models produce haloes that are highly depleted of their baryons at the present day (see black dotted line in the right panel of Fig. 4), which is at odds with the latest observations of X-ray-selected galaxy groups and clusters (see e.g. Akino et al., 2022).
For scales , the hmcode2020 model has similar suppression as the extreme feedback model from the ANTILLES suite. However, the model has a suppression shape that plateaus at smaller scales. This feature is not reproduced in simulations as, by construction, the phenomenological model only modifies the power spectrum in the non-linear regime.
It should be noted that the suppression inferred using SP(k) for the median baryon fraction of HSC-XXL haloes (Akino et al., 2022) sits somewhere in the middle of the predicted suppression from the Low AGN and the Fiducial BAHAMAS models (McCarthy et al., 2017; McCarthy et al., 2018). This is as expected as the BAHAMAS simulations were calibrated specifically to reproduce the gas fraction of observed galaxy groups and clusters. For reasons that will become clear in our discussion below, the Akino et al. (2022) suppression agrees better wit the fiducial BAHAMAS simulation model at large scales , while the Low AGN model does a better job for scales .
In the right panel of Fig. 4 we use the inverted form of SP(k) in Eq. 8 to model the required baryon fraction to reproduce the suppression of the matter power spectrum from the KiDS measurements in the left panel. The model has been colour coded by the optimal halo mass in the same way as in the left panel. This allows us to directly compare the scales that are used in the calculation of . Note that the mass ranges shown for each model correspond to the scales shown on the left panel. For example, the cyan line is only modelled for halo masses , as the published power spectrum suppression is only available for scales .
The figure shows that the baryon fraction of a narrow range of the most massive haloes () are mapped to a significant range of large scales (), while a large range of halo masses () are mapped to a comparable range of small, non-linear scales (). It follows from this mapping that the fiducial BAHAMAS simulation model agrees better with an inferred suppression from the median baryon fraction of haloes from HSC-XXL at large scales, as the blue line in the right panel in Fig. 4 overlaps with the pink region at large halo masses. Similarly, the Low AGN model does a better job for scales as the orange line overlaps with the Akino et al. (2022) data at lower halo masses.
In order to quantify the statistical difference between the observed and predicted baryon fractions, assuming that the probability density function is approximated by a Gaussian distribution at each halo mass scale, we compute,
| (10) |
where we used the associated uncertainties for each quantity.
Similarly, for the power spectrum suppression , we use,
| (11) |
In both cases, the subscript ‘obs’ refers to the observed baryon fraction of haloes from the latest HSC-XXL weak gravitational lensing and X-ray data from Akino et al. (2022), or its corresponding modelled suppression using SP(k). We show this measurement of statistical “tension” for and the power spectrum suppression in the bottom panel of Fig. 4.
The bottom right panel shows that the model predicts baryon fractions that are more than ’s away from the mean observed baryon fraction in Akino et al. (2022) in many adjacent bins. As we do not have access to the full covariance matrix of these studies, we cannot calculate a global measure of tension, but we expect that summing over the bins (while accounting for correlations between them) would increase the statistical tension between the datasets. Furthermore, for masses of , the model predicts baryon fractions that mildly decrease with increasing halo mass. This behaviour is not reproduced in the observations or in simulations, and is a consequence of only modifying the power spectrum in the non-linear regime. At scales of , which is the range that current cosmic shear data is most sensitive to, the level of statistical tension with respect to the observed baryon fraction of up to for halo masses between .
As the hmcode2020 model was, to an extent, calibrated on hydrodynamical simulations, the power spectrum suppression has a similar shape and amplitude to that of the ANTILLLES “extreme” feedback model (left panel). Consequently, for such extreme suppression, both models show an extremely low baryon fraction, where haloes are almost entirely depleted of their baryons (right panel). This severe baryon deficiency is in strong tension with the mean observed baryon fraction of Akino et al. (2022). While the hmcode2020 model has a similar level of baryonic suppression as the model for large scales, the increased tension is a result of the smaller uncertainties for the hmcode2020 model.
The bottom left panel of Fig. 4 shows that the model is within from the the suppression inferred using SP(k) for the median baryon fraction of haloes from HSC-XXL (Akino et al., 2022). The slightly better statistical agreement in the suppression compared to the baryon fraction, especially at high halo masses, is due to the non-linear mapping between the baryon fraction and the power spectrum suppression.
Based on Fig. 4, we generally conclude that, while invoking an aggressive form of baryonic feedback could in principle reconcile the primary CMB(+BAO+CMB lensing) measurements with low-redshift LSS measurements, this introduces another tension with the observed median baryon fraction of haloes. In Section 5 we discuss possible ways to avoid this new tension.
4.2 DES Y3 Cosmic shear + Planck CDM cosmology.
Figure 5 follows the same format as Fig. 4, but for the the DES Y3 cosmic shear measurements (Amon et al., 2022; Secco et al., 2022). We show the power spectrum suppression from Preston et al. (2023) required to match the DES Y3 cosmic shear measurements assuming Planck CDM priors on and and using their model. The line has been color coded by the optimal halo mass in Eq. 1. The red line shows the results using their six parameter redshift-dependent model , only shown at the published redshift of for reference. For clarity, we only show the confidence interval for the model with a light grey shaded region.
The brown hatched region shows the recent baryonic effects inferred in Ferreira et al. (2023), using the cross-correlation between the DES cosmic shear and the diffuse X-ray background from ROSAT (Voges et al., 1999). Ferreira et al. (2023) used a halo model similar to that of Mead et al. (2020) to model baryonic effects, with ‘bloating’ parameters that modulates the concentration of dark matter haloes, but keeping all cosmological parameters fixed to the best-fit Planck cosmology.
For comparison, we also show three feedback variations of the BAHAMAS simulations and the power spectrum suppression modelled using SP(k) for the observed baryon fraction from Akino et al. (2022).
The figure shows that, using both the and models in Preston et al. (2023), the power spectrum suppression due to baryons required to match DES Y3 cosmic shear measurements with a Planck cosmology is not as strong as for the KiDS 1000 measurements. However, the results from Ferreira et al. (2023) using the cross-correlation between DES cosmic shear and the diffuse X-ray background from ROSAT, require a stronger suppression, similar to that required to reconcile the KiDS 1000 measurements.
In the right panel of Fig. 5 we use the inverted form of SP(k) in Eq. 8 to predict the required baryon fraction to reproduce the suppression of the matter power spectrum from the DES Y3 measurements in the left panel. Similar to the behaviour shown in Fig. 4, for masses of , both the and the redshift-dependent models predict baryon fractions that decrease with increasing halo mass. On the other hand, the modelled baryon fraction from the Ferreira et al. (2023) suppression, shows a baryon fraction that decreases with halo mass. While some simulations within the ANTILLES suite show a similar behaviour, this is at odds with the increasing ‘power-law-like’ behaviour of the observed baryon fraction–halo mass relation (see e.g. Akino et al., 2022). This discrepancy may be a consequence of the parameter choices and their associated priors in Ferreira et al. (2023).
The bottom right panel shows that an “-like” suppression required to reconcile DES Y3 cosmic shear measurements with Planck CMB measurements, would only be in mild tension, particularly at halo masses between . On the other hand, because of the decreasing baryon fraction with halo mass, in contrast with the increasing behaviour in observations, the Ferreira et al. (2023) model shows an increasing statistical tension with halo mass, reaching up to at halo masses of .
Based on Fig. 5, we can conclude that, while not as extreme as in the case of KiDS 1000, invoking a more aggressive form of baryonic feedback may reconcile the primary CMB(+BAO+CMB lensing) measurements with low-redshift LSS measurements from DES, but this will introduce a mild tension with the observed median baryon fractions of X-ray-selected groups and clusters. This is especially true for large, quasi-linear scales (), where the and model require a large suppression that translates into a significantly lower baryon fraction compared to observations at relatively large halo masses of . These is also the regime where current cosmic shear data is most sensitive.
The cross-correlation between DES cosmic shear and the diffuse X-ray background from ROSAT, as presented in Ferreira et al. (2023), requires a stronger suppression, similar to that required to reconcile the KiDS 1000 measurements. Hence, this will introduce another tension with the observed median baryon fraction of haloes.
4.3 Cosmic shear + Free cosmology
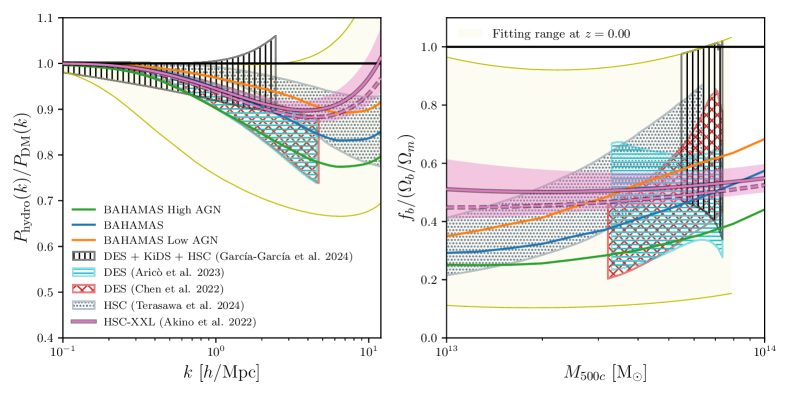
In Fig. 6 we compare the baryonic feedback constraints from cosmic shear measurements that marginalise over both cosmological parameters and baryonic effects using the using the BACCOemu emulator (Angulo et al., 2021; Aricò et al., 2021b, a), also based on the baryonification model (Schneider & Teyssier, 2015). While both Aricò et al. (2023, cyan) and Chen et al. (2023, red) used the small-scale DES Y3 shear measurements to constrain baryonic effects, Chen et al. (2023) only vary one BACCOemu baryonic parameter, namely, the parameter that controls the characteristic halo mass in which half of the cosmic gas fraction is expelled from the halo (), whereas Aricò et al. (2023) set free all the BACCOemu baryonic feedback parameters, i.e. the parameters controlling the shape of the density profile of the hot gas, the galaxy-halo mass ratio, the AGN feedback range, and the gas fraction–halo mass slope. We show in black, the recent analysis of García-García et al. (2024) that combines the DES Y3, KiDS 1000 and the Hyper Suprime-Cam (Aihara et al., 2018, HSC-DR1) weak lensing samples under a joint harmonic-space. The authors also use the BACCOemu emulator to marginalise over baryonic effects. Finally, the grey region shows the analysis of Terasawa et al. (2024) that used the Mead et al. (2021) halo model to explore the baryonic effect signature in the HSC Y3 cosmic shear data (Li et al., 2022). The hatched areas enclose the 68 per cent credible region for each study. As before, we also show three feedback variations of the BAHAMAS simulations and the power spectrum suppression modelled using SP(k) for the observed baryon fraction from Akino et al. (2022) for comparison.
In the right panel of Fig. 6 we use the inverted form of SP(k) in Eq. 8 to model the required baryon fraction to reproduce the suppression of the matter power spectrum from each study. We note that upper limit for the suppression inferred in García-García et al. (2024) falls outside the fitting range of SP(k) for . We do not extrapolate our model outside its fitting range, hence, the inferred baryon fraction for García-García et al. (2024) using the inverted form of SP(k) hit the upper fitting limit for most of the modelled range.
The figure shows that the inferred baryon fractions from the Aricò et al. (2023), Chen et al. (2023), García-García et al. (2024) and Terasawa et al. (2024) studies, which marginalise over cosmological parameters and baryonic effects without imposing a Planck-like cosmology, are statistically compatible with the observed baryon budget from the HSC-XXL weak gravitational lensing data from Akino et al. (2022).
Comparing these results with the previous sections, it is clear that marginalising over baryonic effects in weak lensing studies, while keeping the cosmological parameters consistent with the latest Planck measurements of the primary CMB(+BAO+CMB lensing), leads to a stronger inferred suppression to compensate for the higher values of and preferred by Planck (see also McCarthy et al., 2018; García-García et al., 2024; Terasawa et al., 2024).
4.3.1 DES Y3 Cosmic shear + kinetic Sunyaev Zel’dovich effect.
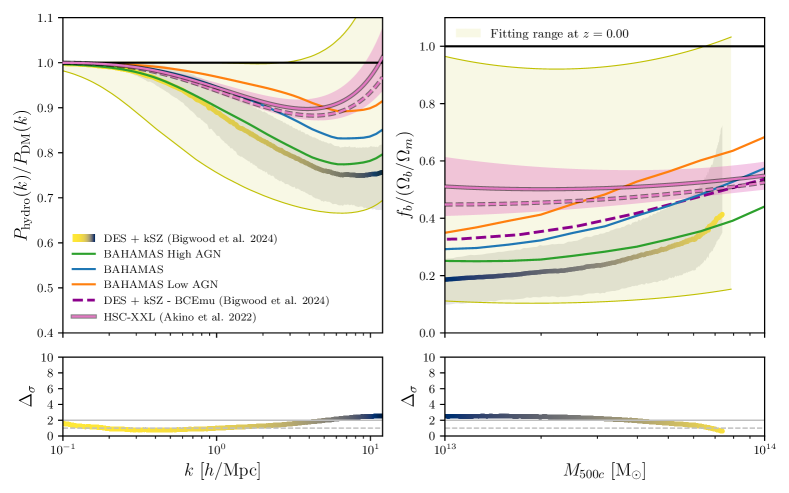
Recently, Bigwood et al. (2024) presented a joint analysis of the DES Y3 Cosmic shear weak lensing data with the Atacama Cosmology Telescope DR5 (Naess et al., 2020) measurements of the kinetic Sunyaev Zel’dovich effect in Schaan et al. (2021). Their analysis jointly constrained cosmological and astrophysical baryonic feedback parameters using the BCEmu emulators based on the ‘baryonification’ model (Schneider & Teyssier, 2015; Giri & Schneider, 2021). We show the power spectrum suppression from Bigwood et al. (2024) color coded by the optimal halo mass in Eq. 1. The confidence interval is shown with a light grey shaded region. We show three feedback variations of the BAHAMAS simulations and the power spectrum suppression modelled using SP(k) for the observed baryon fraction from Akino et al. (2022) for comparison.
The figure shows that the latest weak lensing and kinetic Sunyaev-Zel’dovich analysis favours a slightly higher baryonic feedback suppression, similar to that of the high AGN feedback model in the BAHAMAS simulation suite. The inclusion of kSZ effect data does not appear to be the primary factor behind the differences observed between the results of Bigwood et al. (2024), Aricò et al. (2023), Chen et al. (2023), and García-García et al. (2024). Notably, Bigwood et al. (2024) reports a somewhat stronger suppression in the matter power spectrum from WL alone compared to Aricò et al. (2023); Chen et al. (2023), or García-García et al. (2024), suggesting that the differences are more influenced by the WL data and associated modelling choices (e.g., adopted prior ranges on the baryonic modelling) than by the incorporation of the kSZ effect. Nevertheless, the differences are not highly statistically significant, particularly on large scales () that dominate the lensing signal to noise.
In the top right panel of Fig. 7 we use the inverted form of SP(k) in Eq. 8 to model the required baryon fraction to reproduce the suppression of the matter power spectrum from the DES Y3 weak lensing + kSZ joint analysis in the left panel. Since the level of power spectrum suppression in the WL + kSZ analysis is similar to that of the high AGN BAHAMAS model, as expected, both have similar baryon fractions.
The bottom right panel shows the level of statistical tension between the baryon fraction inferred from the DES Y3 weak lensing + kSZ joint analysis and the observed baryon fraction–halo mass relation. The figure show that the results from Bigwood et al. (2024) would be in mild tension for halo masses , but with a lower degree of tension at higher masses.
In the top right panel of Fig. 7, we also show with a dashed purple line the baryon fraction–halo mass relation directly modelled from BCEmu. We note the significant difference in the inferred baryon fraction for the same power spectrum suppression using either SP(k) or BCEmu. This discrepancy was already highlighted in Bigwood et al. (2024, see their appendix B4). Recent studies have confirmed a strong correlation between the predicted impact of baryons on the present-day from different simulations and the baryon fraction of groups and clusters of such simulations van Daalen et al. (2020); Salcido et al. (2023). The SP(k) model directly exploits this strong correlation, while the BCEmu model does not enforce a relationship between the baryon fraction and matter power suppression. Therefore, the BCEmu model can predict a more extreme matter power spectrum suppression for a given mean baryon fraction, beyond what has been found in cosmological hydrodynamical simulations (see also appendix B4 in Bigwood et al., 2024).
While the baryonification formalism can provide a high level of flexibility, it is still unclear if some of the parameter space may produce unrealistic results due to the lack of self-consistency of the method (e.g., the gas profiles are specified without regard for the evolutionary history of the halo and the energetics required to modify the profiles in the specified way). On the other hand, cosmological hydrodynamical simulations may not explore the full range of physical possibilities. For instance, while Debackere et al. (2021) have shown that the behaviour of the profiles between and can affect the matter power spectrum if the profiles are allowed to vary significantly over this range, the effect of baryons could be underestimated if gas is ejected much further away than normally found in hydrodynamical simulations (García-García et al., 2024). Hence, further work is essential to test the robustness of the correlation between the power spectrum suppression and the baryon fraction, and to provide physical priors to flexible methods such as the halo model and the baryonification formalism.
5 Summary and Conclusions
While the origin of the ‘ tension’ between high-redshift CMB and low-redshift LSS measurements remains unclear, recent studies suggest that baryonic effects alone may be insufficient to address this discrepancy (McCarthy et al., 2018; McCarthy et al., 2023). Others propose that incorporating mechanisms that strongly suppress the non-linear power spectrum could help reconcile these observations (Amon et al., 2022; Preston et al., 2023). In this study, we presented a novel method to model the required baryon fraction-halo mass relation from any power spectrum suppression inferred from weak lensing studies, allowing us to test such studies against the measured low-redshift baryon budget estimates in galaxy groups and clusters.
Our specific findings can be summarised as follows:
-
•
We introduced an inverted form of the analytical SP(k) model (Salcido et al., 2023), which enables the computation of the baryon fraction-halo mass relation required to produce a given suppression of the power spectrum.
-
•
By employing this inverted SP(k) model, we calculated the baryon fractions necessary to replicate the suppression of the matter power spectrum observed in various cosmic shear and cosmic shear cross-correlation analyses.
-
•
Studies that marginalise over baryonic effects while either holding cosmological parameters fixed to a Planck-like cosmology or jointly fitting to Planck, such as those by Amon et al. (2022), Ferreira et al. (2023), and Preston et al. (2023), predict a strong suppression of the power spectrum, , to compensate for the higher values of and favoured by Planck. The inferred baryon fractions from these studies are significantly lower than those measured by the latest HSC-XXL X-ray and weak gravitational lensing data from Akino et al. (2022).
-
•
The suppression inferred using the “” model (Amon et al., 2022) required to reconcile KiDS 1000 cosmic shear measurements with Planck CMB measurements would introduce a tension with the observed baryon fraction of galaxy groups and clusters, and up to a tension for halo masses in the range .
-
•
For DES Y3 cosmic shear measurements, the “-like” suppression required to reconcile them with Planck CMB measurements would result in only a mild tension with the observed baryon fraction of groups and clusters.
-
•
The results from Ferreira et al. (2023) using the cross-correlation between DES cosmic shear and the diffuse X-ray background from ROSAT using a fixed Planck cosmology introduce a statistical tension with the observed baryon fraction reaching up to at halo masses of .
-
•
In contrast, studies that marginalise over both cosmological parameters and baryonic effects, such as Aricò et al. (2021b), Chen et al. (2023), García-García et al. (2024), and Terasawa et al. (2024), still exhibit the tension but yield baryon fractions that are in good statistical agreement with the observations reported by Akino et al. (2022).
-
•
The WL+kSZ prediction of a more extreme suppression of the matter power spectrum in Bigwood et al. (2024) suggests a mild tension with the observed baryon fraction in haloes with mass , with a smaller tension at higher masses.
-
•
Both the ’bloating’ of dark matter halo concentrations via the modified halo model (Mead et al., 2016), as applied in Ferreira et al. (2023), and the use of the baryonification model (Schneider & Teyssier, 2015), as employed in Bigwood et al. (2024), can produce baryon fraction–halo mass relations that differ notably from those predicted by full hydrodynamical simulations. These discrepancies may lead to tensions of several with the observed baryon fractions. Consequently, further work is necessary to establish more physically motivated priors for flexible approaches like the halo model and baryonification formalism.
This study underscores the importance of carefully incorporating baryonic effects in cosmological pipelines for weak lensing studies, as well as ensuring consistency with other physically correlated observables, including the baryon fractions of galaxy groups and clusters (see also Bigwood et al., 2024).
Taking the observed baryon fractions of X-ray-selected groups and clusters at face value and under the assumption that the SP(k) model provides a realistic mapping between the matter power spectrum and baryon fractions, our results suggest that a mechanism beyond baryonic physics alone is required to modify or slow the growth of structure in the universe to resolve the tension. Our findings therefore suggest that another mechanism (e.g., new dark sector physics) may be at work and/or that there are unaccounted for systematic errors in the lensing or CMB measurements.
Alternatively, if feedback is the principle driver of the tension, the implication would be that current estimates of the baryon fraction–halo mass relation are strongly biased high, by up to a factor of several. This seems unlikely but would be a stunning development for our understanding intracluster medium if true. Note that previous work based on forward modelling of simulations has shown that observational methods such as those employed in Akino et al. (2022) are unbiased on average at the few percent level for weak lensing-based halo mass estimates (e.g., Becker & Kravtsov 2011; Bahé et al. 2012) and X-ray-based gas mass estimates (e.g, Nagai et al. 2007; Le Brun et al. 2014). Thus, there are unlikely to be large systematic errors in the observational baryon fraction estimates. However, correcting for the effects of X-ray-selection is more challenging, particularly at the group scale (e.g., Pearson et al. 2017; Andreon et al. 2024; Marini et al. 2024). If large numbers of gas-deficient groups are present in nature and unaccounted for the X-ray selection modelling, it may be possible to find consistency with the suppression in required to reconcile cosmic shear measurements with the primary CMB. Note, however, that such an explanation is unlikely to be successful for reconciling the similar offsets reported between the CMB and the tSZ power spectrum and its cross-correlation with the cosmic shear (McCarthy et al., 2023). That is because these measures of clustering are sensitive to the most massive haloes where the luminosities and baryon fractions are considerably higher than in groups and the selection effects are much better understood.
Recent results from the kinematic Sunyaev-Zel’dovich (kSZ) effect provide compelling evidence of a more extended gas distribution around dark matter haloes (Hadzhiyska et al., 2024), strongly disfavoring hydrodynamical simulations with weak feedback models. Conversely, the recent detection of the patchy screening effect, which probes the distribution of electrons around galaxies, supports the idea of extended gas distributions but aligns better with simulations that predict less heating and redistribution of the intracluster medium than those suggested by kSZ studies (Coulton et al., 2024). This apparent difference underscores that, while the exact nature and extent of baryonic feedback remain open questions, both kSZ and patchy screening are complementary and powerful tools for probing baryonic physics. To resolve these uncertainties, more precise observations coupled with improved theoretical models are essential.
As we enter an era of high-precision cosmology driven by forthcoming large-scale galaxy and cluster surveys such as Euclid (Laureijs et al., 2011), Roman (Green et al., 2011), LSST (LSST Dark Energy Science Collaboration, 2012), and DESI (DESI Collaboration et al., 2016), accurate modelling of baryonic effects in large-scale structure (LSS) analyses will become increasingly important. The precision and accuracy in measuring the expansion rate and large-scale distribution of matter in the Universe will reach unprecedented levels. Moreover, data from surveys like eROSITA (Predehl et al., 2021, X-ray), Advanced ACT (Henderson et al., 2016, tSZ, kSZ), and the Simons Observatory (Ade et al., 2019, tSZ, kSZ) will offer tighter constraints on the baryon fraction of groups and clusters across different redshifts.
To fully harness the potential of these surveys for constraining cosmological parameters and exploring possible extensions to the standard model, it is crucial to ensure accurate modelling of LSS by rigorously accounting for baryonic effects through a comprehensive exploration of the ‘feedback landscape’. Recent studies, such as Bigwood et al. (2024), which performed a joint analysis of DES Y3 cosmic shear and X-ray baryon fraction constraints using SP(k), not only improved cosmological constraints but also provided valuable insights into astrophysical feedback models. Moving forward, informative priors derived from observational constraints on the baryon fraction and other probes of hot gas will be vital in minimising the degradation of cosmological constraints and avoiding biases.
Acknowledgements
The authors thank Alexandra Amon for helpful comments on a draft version of the paper. This work was supported by the Science and Technology Facilities Council (grant number ST/Y002733/1). This project has received funding from the European Research Council (ERC) under the European Union’s Horizon 2020 research and innovation programme (grant agreement No 769130). This work used the DiRAC@Durham facility managed by the Institute for Computational Cosmology on behalf of the STFC DiRAC HPC Facility (www.dirac.ac.uk). The equipment was funded by BEIS capital funding via STFC capital grants ST/K00042X/1, ST/P002293/1, ST/R002371/1 and ST/S002502/1, Durham University and STFC operations grant ST/R000832/1. DiRAC is part of the National e-Infrastructure.
References
- Abbott et al. (2022) Abbott T. M. C., et al., 2022, PRD, 105, 023520
- Abdalla et al. (2022) Abdalla E., et al., 2022, Journal of High Energy Astrophysics, 34, 49
- Ade et al. (2019) Ade P., et al., 2019, J. Cosmology Astropart. Phys., 2019, 056
- Aihara et al. (2018) Aihara H., et al., 2018, PASJ, 70, S8
- Akino et al. (2022) Akino D., et al., 2022, Publications of the Astronomical Society of Japan, 74, 175
- Amon & Efstathiou (2022) Amon A., Efstathiou G., 2022, Monthly Notices of the Royal Astronomical Society, 516, 5355
- Amon et al. (2022) Amon A., et al., 2022, Phys. Rev. D, 105, 023514
- Andreon et al. (2024) Andreon S., Trinchieri G., Moretti A., 2024, A&A, 686, A284
- Angulo et al. (2021) Angulo R. E., Zennaro M., Contreras S., Aricò G., Pellejero-Ibañez M., Stücker J., 2021, Monthly Notices of the Royal Astronomical Society, 507, 5869
- Aricò et al. (2021a) Aricò G., Angulo R. E., Hernández-Monteagudo C., Contreras S., Zennaro M., 2021a, Monthly Notices of the Royal Astronomical Society, 503, 3596
- Aricò et al. (2021b) Aricò G., Angulo R. E., Contreras S., Ondaro-Mallea L., Pellejero-Ibañez M., Zennaro M., 2021b, Monthly Notices of the Royal Astronomical Society, 506, 4070
- Aricò et al. (2023) Aricò G., Angulo R. E., Zennaro M., Contreras S., Chen A., Hernández-Monteagudo C., 2023, A&A, 678, A109
- Asgari et al. (2021) Asgari M., et al., 2021, A&A, 645, A104
- Bahé et al. (2012) Bahé Y. M., McCarthy I. G., King L. J., 2012, MNRAS, 421, 1073
- Becker & Kravtsov (2011) Becker M. R., Kravtsov A. V., 2011, ApJ, 740, 25
- Beutler et al. (2016) Beutler F., et al., 2016, MNRAS, 455, 3230
- Bigwood et al. (2024) Bigwood L., et al., 2024, arXiv e-prints, p. arXiv:2404.06098
- Castro et al. (2021) Castro T., Borgani S., Dolag K., Marra V., Quartin M., Saro A., Sefusatti E., 2021, Monthly Notices of the Royal Astronomical Society, 500, 2316
- Chen et al. (2023) Chen A., et al., 2023, Monthly Notices of the Royal Astronomical Society, 518, 5340
- Chisari et al. (2019) Chisari N. E., et al., 2019, The Open Journal of Astrophysics, 2, 4
- Coulton et al. (2024) Coulton W. R., et al., 2024, arXiv e-prints, p. arXiv:2401.13033
- DESI Collaboration et al. (2016) DESI Collaboration et al., 2016, preprint, p. arXiv:1611.00036
- DeRose et al. (2019) DeRose J., et al., 2019, The Astrophysical Journal, 875, 69
- Debackere et al. (2021) Debackere S. N. B., Schaye J., Hoekstra H., 2021, Monthly Notices of the Royal Astronomical Society, 505, 593
- Di Valentino et al. (2021) Di Valentino E., et al., 2021, Classical and Quantum Gravity, 38, 153001
- Ferreira et al. (2023) Ferreira T., Alonso D., Garcia-Garcia C., Chisari N. E., 2023, arXiv e-prints, p. arXiv:2309.11129
- García-García et al. (2024) García-García C., Zennaro M., Aricò G., Alonso D., Angulo R. E., 2024, arXiv e-prints, p. arXiv:2403.13794
- Giri & Schneider (2021) Giri S. K., Schneider A., 2021, J. Cosmology Astropart. Phys., 2021, 046
- Green et al. (2011) Green J., et al., 2011, preprint, p. arXiv:1108.1374
- Hadzhiyska et al. (2024) Hadzhiyska B., et al., 2024, arXiv e-prints, p. arXiv:2407.07152
- Hearin et al. (2012) Hearin A. P., et al., 2012, JCAP, 2012, 034
- Henderson et al. (2016) Henderson S. W., et al., 2016, Journal of Low Temperature Physics, 184, 772
- Heymans et al. (2021) Heymans C., et al., 2021, A&A, 646, A140
- Huterer & Takada (2005) Huterer D., Takada M., 2005, Astropart. Phys, 23, 369
- Komatsu et al. (2011) Komatsu E., et al., 2011, ApJS, 192, 18
- Krause et al. (2021) Krause E., et al., 2021, arXiv e-prints, p. arXiv:2105.13548
- LSST Dark Energy Science Collaboration (2012) LSST Dark Energy Science Collaboration 2012, preprint, p. arXiv:1211.0310
- Laureijs et al. (2011) Laureijs R., et al., 2011, preprint, p. arXiv:1110.3193
- Le Brun et al. (2014) Le Brun A. M. C., McCarthy I. G., Schaye J., Ponman T. J., 2014, Monthly Notices of the Royal Astronomical Society, 441, 1270
- Li et al. (2022) Li X., et al., 2022, PASJ, 74, 421
- Marini et al. (2024) Marini I., et al., 2024, A&A, 689, A7
- McCarthy et al. (2017) McCarthy I. G., Schaye J., Bird S., Le Brun A. M. C., 2017, Monthly Notices of the Royal Astronomical Society, 465, 2936
- McCarthy et al. (2018) McCarthy I. G., Bird S., Schaye J., Harnois-Deraps J., Font A. S., van Waerbeke L., 2018, Monthly Notices of the Royal Astronomical Society, 476, 2999
- McCarthy et al. (2023) McCarthy I. G., et al., 2023, MNRAS, 526, 5494
- Mead et al. (2016) Mead A. J., Heymans C., Lombriser L., Peacock J. A., Steele O. I., Winther H. A., 2016, Monthly Notices of the Royal Astronomical Society, 459, 1468
- Mead et al. (2020) Mead A. J., Tröster T., Heymans C., Van Waerbeke L., McCarthy I. G., 2020, Astronomy and Astrophysics, 641, A130
- Mead et al. (2021) Mead A. J., Brieden S., Tröster T., Heymans C., 2021, Monthly Notices of the Royal Astronomical Society, 502, 1401
- Mulroy et al. (2019) Mulroy S. L., et al., 2019, Monthly Notices of the Royal Astronomical Society, 484, 60
- Naess et al. (2020) Naess S., et al., 2020, J. Cosmology Astropart. Phys., 2020, 046
- Nagai et al. (2007) Nagai D., Vikhlinin A., Kravtsov A. V., 2007, ApJ, 655, 98
- Pearson et al. (2017) Pearson R. J., et al., 2017, MNRAS, 469, 3489
- Predehl et al. (2021) Predehl P., et al., 2021, A&A, 647, A1
- Preston et al. (2023) Preston C., Amon A., Efstathiou G., 2023, arXiv e-prints, p. arXiv:2305.09827
- Salcido et al. (2023) Salcido J., McCarthy I. G., Kwan J., Upadhye A., Font A. S., 2023, Monthly Notices of the Royal Astronomical Society, 523, 2247
- Schaan et al. (2021) Schaan E., et al., 2021, Phys. Rev. D, 103, 063513
- Schaye et al. (2010) Schaye J., et al., 2010, Monthly Notices of the Royal Astronomical Society, 402, 1536
- Schneider & Teyssier (2015) Schneider A., Teyssier R., 2015, J. Cosmology Astropart. Phys., 2015, 049
- Schneider et al. (2020) Schneider A., Stoira N., Refregier A., Weiss A. J., Knabenhans M., Stadel J., Teyssier R., 2020, J. Cosmology Astropart. Phys., 2020, 019
- Secco et al. (2022) Secco L. F., et al., 2022, Phys. Rev. D, 105, 023515
- Semboloni et al. (2011) Semboloni E., Hoekstra H., Schaye J., van Daalen M. P., McCarthy I. G., 2011, Monthly Notices of the Royal Astronomical Society, 417, 2020
- Semboloni et al. (2013) Semboloni E., et al., 2013, MNRAS, 434, 148
- Terasawa et al. (2024) Terasawa R., et al., 2024, arXiv e-prints, p. arXiv:2403.20323
- Tröster et al. (2021) Tröster T., et al., 2021, A&A, 649, A88
- Tröster et al. (2022) Tröster T., et al., 2022, A&A, 660, A27
- Voges et al. (1999) Voges W., et al., 1999, A&A, 349, 389
- van Daalen & Schaye (2015) van Daalen M. P., Schaye J., 2015, Monthly Notices of the Royal Astronomical Society, 452, 2247
- van Daalen et al. (2020) van Daalen M. P., McCarthy I. G., Schaye J., 2020, Monthly Notices of the Royal Astronomical Society, 491, 2424