What Guides Our Choices? Modeling Developers’ Trust and Behavioral Intentions Towards GenAI
Abstract.
Generative AI (genAI) tools, such as ChatGPT or Copilot, are advertised to improve developer productivity and are being integrated into software development. However, misaligned trust, skepticism, and usability concerns can impede the adoption of such tools. Research also indicates that AI can be exclusionary, failing to support diverse users adequately. One such aspect of diversity is cognitive diversity—variations in users’ cognitive styles—that leads to divergence in perspectives and interaction styles. When an individual’s cognitive style is unsupported, it creates barriers to technology adoption. Therefore, to understand how to effectively integrate genAI tools into software development, it is first important to model what factors affect developers’ trust and intentions to adopt genAI tools in practice?
We developed a theoretical model to (1) identify factors that influence developers’ trust in genAI tools and (2) examine the relationship between developers’ trust, cognitive styles, and their intentions to use these tools. We surveyed software developers (N=238) at two major global tech organizations and employed Partial Least Squares-Structural Equation Modeling (PLS-SEM) to evaluate our model. Our findings reveal that genAI’s system/output quality, functional value, and goal maintenance significantly influence developers’ trust in these tools. Furthermore, developers’ trust and cognitive styles influence their intentions to use these tools. We offer practical suggestions for designing genAI tools for effective use and inclusive user experience.
1. Introduction
Generative AI (genAI) tools (e.g., ChatGPT (OpenAI, 2024), Copilot (Microsoft, 2024)) are being increasingly used in software development (Fan et al., 2023). These tools promise enhanced productivity (Kalliamvakou, 2024) and are transforming how developers code and innovate (Peng et al., 2023). However, this push for adoption (Center, 2023) is marked with AI hype and skepticism (McKinsey, 2024), as well as interaction challenges (Fan et al., 2023; Liang et al., 2024).
Trust has long been recognized as a critical design requirement of AI tools (Hoff and Bashir, 2015; Lee and See, 2004; Sellen and Horvitz, 2023). Miscalibrated levels of trust—over or under trust—can lead developers to overlook errors and risks introduced by AI (Pearce et al., 2022) or deter them from using these tools (Boubin et al., 2017). Prior research has identified various factors that foster developers’ trust in genAI tools (Wang et al., 2023; Cheng et al., 2023; Johnson et al., 2023). For instance, interaction factors such as setting appropriate expectations and validating AI suggestions (Wang et al., 2023) along with community factors like shared experiences and community support (Cheng et al., 2023) are relevant in building trust. Recently, Johnson et al. (2023) introduced the PICSE framework through a qualitative investigation with software developers, outlining key components that influence the formation and evolution of trust in software tools (see Sec. 2.1). What is missing, however, is an empirically grounded theoretical understanding of how the multitude of factors associate with developers’ trust in genAI tools. Therefore, it becomes important to answer (RQ1): What factors predict developers’ trust in genAI tools? Understanding the significance and strength of these associations is needed to inform the design and adoption of genAI tools in software development.
Another important concern in industry-wide integration of AI tools is that software design can be exclusionary in different ways (Adib-Moghaddam, 2023; Beckwith and Burnett, 2004; bus, 2023), often failing to support diverse users (Eubanks, 2018). While a substantial body of work exists on modeling users’ technology acceptance (Venkatesh et al., 2003, 2012; Chau, 1996; Russo, 2024), these studies do not consider the inclusivity of the software design. One often overlooked aspect of inclusivity is supporting cognitive diversity—variations in individuals’ cognitive styles—which fosters divergence in perspectives and thoughts (see Sec. 2.2) (Sternberg and Grigorenko, 1997). Numerous studies have shown that when technology is misaligned with users’ diverse cognitive styles (Burnett et al., 2016; Beckwith and Burnett, 2004; Murphy-Hill et al., 2024), it creates additional barriers for those whose styles are unsupported, forcing them to exert additional cognitive effort (Burnett et al., 2016). Thus, it is essential to understand how developers’ cognitive styles influence their intention to adopt genAI tools, and how trust contributes to this multi-faceted decision. Therefore, we investigate (RQ2): How are developers’ trust and cognitive styles associated with their intentions to use genAI tools?
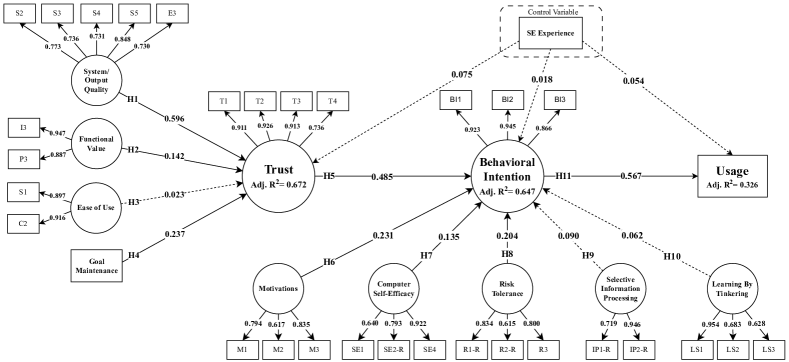
We answer these research questions by establishing a theoretical model, grounded in prior literature, for trust and behavioral intentions toward genAI tools. We evaluated this model using Partial Least Squares-Structural Equation Modeling (PLS-SEM) with survey data from developers (N=238) at two major global tech organizations. Our theoretical model (Figure 1) empirically shows that genAI’s system/output quality (presentation, adherence to safe and secure practices, performance, and output quality in relation to work style/practices), functional value (educational value and practical benefits), and goal maintenance (alignment between developers’ immediate objectives and genAI’s actions) are positively associated with developers’ trust in these tools. Furthermore, developers’ trust and cognitive styles—intrinsic motivations behind using technology, computer self-efficacy within peer groups, and attitudes towards risk—are associated with their intentions to use these tools, which in turn, correlates with their reported genAI usage in work.
The main contributions of this paper are twofold: (1) an empirically grounded theoretical model for developers’ trust and behavioral intentions towards genAI tools, extending our understanding of AI adoption dynamics in software development, and (2) a psychometrically validated instrument for capturing trust-related factors in the context of human-genAI interactions that can be leveraged in future work.
2. Background
2.1. Trust in AI
Trust in AI is commonly defined as “the attitude that an agent will help achieve an individual’s goals in a situation characterized by uncertainty and vulnerability” (Lee and See, 2004; Liao and Sundar, 2022; Vereschak et al., 2021; Wang et al., 2023; Perrig et al., 2023). Trust is subjective and thus a psychological construct that is not directly observable (Hopkins, 1998) and should be distinguished from observable measures such as reliance (Wischnewski et al., 2023). Trust involves users attributing intent and anthropomorphism to the AI (Jacovi et al., 2021), leading to feelings of betrayal when trust is violated. Despite AI systems being inanimate, users often anthropomorphize them (Jacovi et al., 2021), thereby shifting from reliance to trust in AI systems.
Unobservable psychological constructs are commonly measured through validated self-reported scales (instruments) (DeVellis and Thorpe, 2021) using questions designed to capture the construct of interest. In this paper, we measure developers’ trust in genAI tools using the validated Trust in eXplainable AI (TXAI) instrument (Perrig et al., 2023; Hoffman et al., 2023). TXAI has been derived from existing trust scales (Madsen and Gregor, 2000; Jian et al., 2000; Hoffman et al., 2023) and its psychometric quality has been validated (Perrig et al., 2023). Researchers frequently advocate using the TXAI instrument for measuring trust in AI (Perrig et al., 2023; Scharowski et al., 2024; Makridis et al., 2023).
Factors affecting trust: Prior research has extensively examined factors influencing human trust in automation (Madsen and Gregor, 2000; Jian et al., 2000; McKnight et al., 2002; Merritt, 2011). However, these preliminary insights do not necessarily transfer to human-AI interactions (Wang et al., 2023) because of the nuances in how users form trust in AI tools, alongside the inherent uncertainty (Vereschak et al., 2021) and variability (Weisz et al., 2023) associated with these systems. Additionally, the context in which AI is applied (in our case, software development) influences how trust is developed and its contributing factors (Omrani et al., 2022).
Relevant to our domain, Johnson et al. (2023) interviewed software engineers to outline factors that engineers consider when establishing and (re)building trust in tools through the PICSE framework: (1) Personal (internal, external, and social factors), (2) Interaction (aspects of engagement with a tool), (3) Control (over the tool), (4) System (properties of the tool), and (5) Expectations (with the tool). Since PICSE is developed for software engineering (SE), we use it to design our survey instrument to identify factors influencing developers’ trust in genAI tools. However, the PICSE framework was qualitatively developed and the psychometric quality—reliability and validity—of a survey based on it has not yet been assessed.
Our work builds upon PICSE to contribute (a) a validated instrument for capturing different factors that developers consider when forming trust in genAI tools (Sec. 3.2) through a psychometric analysis of the PICSE framework and (b) assesses the significance and strength of these factors’ association with trust in genAI tools (Sec. 4).
2.2. Users’ Cognitive Styles
AI can be exclusionary in different ways often failing to support all users as it should (Eubanks, 2018; Adib-Moghaddam, 2023; bus, 2023). E.g., Weisz et al. (2022) found that some, but not all, participants could produce high-quality code with AI assistance, and the differences were linked to varying participant interactions with AI.
User experience in Human-AI interaction (HAI-UX) can be improved by supporting diverse cognitive styles (Anderson et al., 2022), which refer to the ways users perceive, process, and interact with information and technology, as well as their approach to problem-solving (Sternberg and Grigorenko, 1997). While no particular style is inherently better or worse, if a tool insufficiently supports (or is misaligned with) users’ cognitive styles; they pay an additional “cognitive tax” to use it, creating barriers to usability (Murphy-Hill et al., 2024).
Here, we scope developers’ diverse cognitive styles to the five cognitive styles in the GenderMag inclusive design method (Burnett et al., 2016). GenderMag’s cognitive styles (facets) are users’ diverse: attitudes towards risk, computer self-efficacy within their peer group, motivations to use the technology, information processing style, and learning style for new technology. Each facet represents a spectrum. For example, risk-averse individuals (one endpoint of the ‘attitude towards risk’ spectrum) hesitate to try new technology or features, whereas risk-tolerant ones (the other end) are inclined to try unproven technology that may require additional cognitive effort or time. GenderMag’s cognitive styles are well-suited as they have been (a) repeatedly shown to align with users’ interactions with technology both in the context of SE (Murphy-Hill et al., 2024; Burnett et al., 2016; Guizani et al., 2022) and HAI interactions (Anderson et al., 2022; Hamid et al., 2024), and (b) distilled from an extensive list of applicable cognitive style types (Beckwith and Burnett, 2004; Burnett et al., 2016), intended for actionable use by practitioners. We used the validated GenderMag facet survey instrument (Hamid et al., 2023) in our study.
2.3. Behavioral Intention and Usage
Behavioral intention refers to the extent to which a person has made conscious plans to undertake a specific future activity (Venkatesh et al., 2003). Technology acceptance models, such as TAM (Chau, 1996) and UTAUT (Venkatesh et al., 2003), identify behavioral intention as a key indicator of actual technology usage (Venkatesh et al., 2012). Understanding users’ behavioral intentions is useful for predicting technology adoption and guiding future design strategies (Venkatesh et al., 2003). While there is an extensive body of work modeling users’ behavioral intentions towards software tools (Venkatesh et al., 2003, 2012; Russo, 2024), these studies primarily focus on socio-technical factors driving adoption.
Our work contributes to this line of research by examining the role of developers’ trust and cognitive styles in shaping their intentions to use genAI tools (Sec. 3.3 and 4), thereby extending the understanding of AI adoption dynamics in SE. We used components of the UTAUT model (Venkatesh et al., 2003) to capture developers’ behavioral intentions and usage of genAI tools.
3. Method
To address our RQs, we surveyed software developers from two major global tech organizations, pseudonymized as TechNxt and TechCo. We leveraged existing theoretical frameworks and instruments to design our data collection instrument (see Sec. 2). While using existing theoretical frameworks is a first step in developing questionnaires, conducting a psychometric quality assessment is essential to ensure its subsequent reliability and validity (Furr, 2011). As there was no validated instrument to measure the constructs of the PICSE framework (Johnson et al., 2023)–our chosen trust framework–we performed its psychometric assessment (Furr, 2011) (Sec. 3.2). This assessment helped us define a theoretical model of factors developers consider when forming trust in genAI tools, which we then evaluated using Partial Least Squares-Structural Equation Modeling (PLS-SEM) to answer RQ1. To answer RQ2, we assessed the relationships between developers’ trust and cognitive styles with their intentions to use genAI tools. Next, we discuss each step.
3.1. Survey Design and Data Collection
3.1.1. Survey design
We defined the measurement model (Hair et al., 2019) based on the theoretical frameworks discussed in Sec. 2 to guide our survey design (Table 1). Four researchers with experience in survey studies and TechNxt’s research team co-designed the survey over a four-month period (Oct 2023 to Jan 2024). We adapted existing (validated) instruments in designing the survey questions (Table 1). The questions were contextualized for the target population and pragmatic decisions were made to limit the survey length. The complete questionnaire is available in the supplemental material (sup, [n. d.]).
| Attribute | N | Percentage |
|---|---|---|
| Gender | ||
| Man | ||
| Woman | % | |
| Non-binary or gender diverse | % | |
| Prefer not to say | % | |
| Continent of Residence | ||
| North America | % | |
| Europe | % | |
| Asia | % | |
| Africa | % | |
| South America | % | |
| Pacific/Oceania | % | |
| SE Experience | ||
| 1-5 years | % | |
| 6-10 years | % | |
| 11-15 years | % | |
| Over 15 years | % | |
| SE Responsibilities | ||
| Coding/Programming | % | |
| Code Review | % | |
| System Design | % | |
| Documentation | % | |
| Maintenance & Updates | % | |
| Requirements Gathering & Analysis | % | |
| Performance Optimization | % | |
| Testing & Quality Assurance | % | |
| DevOps/(CI/CD) | % | |
| Project Management & Planning | % | |
| Security Review & Implementation | % | |
| Client/Stakeholder Communication | % | |
After the IRB-approved informed consent, participants responded to closed questions about their familiarity with genAI technology and their attitudes and intentions towards using genAI tools in work. All closed questions utilized a 5-point Likert scale ranging from 1 (“strongly disagree”) to 5 (“strongly agree”) with a neutral option. These questions also included a option (“I’m not sure”) for participants who either preferred not to or did not know how to respond to a question. This differs from being neutral–acknowledging the difference between ignorance and indifference (Grichting, 1994).
Demographic questions covered gender, continent of residence, years of software engineering (SE) experience, and primary SE responsibilities at work. We did not collect data on country of residence or specific job roles/work contexts to maintain participant anonymity, as per TechNxt and TechCo’s guidelines. An open-ended question for additional comments was included at the end of the survey.
The survey took between 7-10 minutes to complete. Attention checks were included to ensure the quality of the survey data. To reduce response bias, we randomized the order of questions within their respective blocks (each construct in Table 1). We piloted the questionnaire with collaborators at TechNxt to refine its clarity and phrasing.
3.1.2. Distribution
TechCo and TechNxt administered the online questionnaire using their internal survey tool. The survey was distributed to team leads, who were asked to cascade it to their team members. This approach was chosen over using mailing lists to ensure a broader reach (Trinkenreich et al., 2023). The survey was available for one month (Feb-Mar, 2024), and while participation was optional, it was encouraged.
3.1.3. Responses
We received a total of 343 responses: 235 from TechCo and 108 from TechNxt. We removed patterned responses (n=20), outliers ( year SE experience, n=1), and those that failed attention checks (n=29). Further, we excluded respondents who discontinued the survey without answering all the close-ended questions (n=55). We considered “I’m not sure” responses as missing data points. As in prior work (Trinkenreich et al., 2023), we did not impute data points due to the unproven efficacy of imputation methods within SEM group contexts (Sarstedt et al., 2017).
After filtration, we retained 238 valid responses (TechCo: 154, TechNxt: 84) from developers across six continents, representing a wide distribution of SE experience. Most respondents were from North America (54.2%) and Europe (23.1%), and most identified as men (78.2%), aligning with distributions reported in previous studies with software engineers (Trinkenreich et al., 2023; Russo, 2024). Table 2 summarizes the respondent demographics.
3.2. Psychometric Analysis of PICSE Framework
Psychometric quality (Lord and Novick, 2008; Raykov and Marcoulides, 2011) refers to the objectivity, reliability, and validity of an instrument. We primarily used validated instruments in designing the survey. However, since PICSE was not validated, we conducted a psychometric analysis to empirically refine its factor groupings, which were then evaluated for their association with trust (Sec. 4). Table 3 presents the factors evaluated in our survey. We performed the analysis using the JASP tool (JASP Team, 2024), adhering to established psychometric procedures (Raykov and Marcoulides, 2011; Howard, 2016; Perrig et al., 2023) as detailed next:
| Category | Items |
|---|---|
| Personal | Community (P1), Source reputation (P2), Clear advantages (P3) |
| Interaction | Output validation support (I1), Feedback loop (I2), Educational value (I3) |
| Control | Control over output use (C1), Ease of workflow integration (C2) |
| System | Ease of use (S1), Polished presentation (S2), Safe and secure practices (S3), Consistent accuracy and appropriateness (S4), Performance (S5) |
| Expectations | Meeting expectations (E1), Transparent data practices (E2), Style matching (E3), Goal maintenance (E4) |
-
•
We dropped C3 (tool ownership), as it pertained to AI engineers developing parts of genAI models.
1) Confirmatory Factor Analysis (CFA) – Original grouping: CFA is a statistical technique that examines intercorrelations between items and proposed factors to test whether a set of observed variables align with a pre-determined factor structure (Harrington, 2009). We assessed whether the PICSE items align with their original five-factor structure (Personal, Interaction, Control, System, and Expectations). The model fit was evaluated using multiple indices: Chi-square test, Root Mean Square Error of Approximation (RMSEA), Comparative Fit Index (CFI), and Tucker-Lewis Index (TLI) (Hu and Bentler, 1999). Indications of a good model fit include for test, , , and (Hu and Bentler, 1999). We employed robust maximum likelihood estimator (MLE),111Robust maximum likelihood estimation adjusts for non-normality in data. In general, “robust” in factor analyses refer to methods and values resilient to deviations from ideal distributional assumptions. since the data did not meet multivariate normality assumptions, confirmed using Mardia’s test (Mardia, 1970) (see supplemental (sup, [n. d.])). As shown in Table 5, results from the original five-factor structure did not indicate a good model fit based on RMSEA, SRMR, CFI, and TLI. This was not entirely unexpected given PICSE’s conceptual nature (Harrington, 2009). Therefore, to identify a more appropriate model of factors, we proceeded with an exploratory factor analysis (EFA), uncovering alternative groupings that might better fit the data.
| Item | Factor 1 | Factor 2 | Factor 3 | Factor 4 | Factor 5 | |
|---|---|---|---|---|---|---|
| S2 | 0.655 | 0.525 | ||||
| S3 | 0.729 | 0.609 | ||||
| S4 | 0.823 | 0.623 | ||||
| S5 | 0.638 | 0.657 | ||||
| E3 | 0.614 | 0.559 | ||||
| I3 | 0.941 | 0.779 | ||||
| P3 | 0.791 | 0.599 | ||||
| S1 | 0.739 | 0.668 | ||||
| C2 | 0.671 | 0.607 | ||||
| P1 | 0.613 | 0.418 | ||||
| P2 | 0.539 | 0.367 | ||||
| C1 | 0.517 | 0.312 | ||||
| E4 | 0.628 | 0.685 | ||||
| I1 | 0.398 | |||||
| I2 | 0.481 | |||||
| E1 | 0.405 | |||||
| E2 | 0.492 |
2) Exploratory Factor Analysis (EFA): Unlike CFA, which relies on an existing a priori expectation of factor structures, EFA identifies the suitable number of latent constructs (factors) and underlying factor structures without imposing a preconceived model (Howard, 2016). Given the violation of multivariate normality, we used principal axis factoring (considering factors with eigenvalues), as recommended for EFA (Howard, 2016). We employed oblique rotation, anticipating correlations among the factors. The data met EFA assumptions: significant Bartlett’s test for sphericity ( (136) = 1633.97, ) and an adequate Kaiser-Meyer-Olkin (KMO) test (0.892, ) (Howard, 2016). We used both parallel analysis and a scree plot to determine the number of factors (Howard, 2016), suggesting an alternate five-factor model explaining 64.6% of the total variance. However, most of this variance (60.3%) was accounted for by factors 1, 2, 3, and 5 (22.7, 15.1, 10.6, and 11.9% respectively), while factor 4 explained only 4.3%. The factors showed low correlations (0.2-0.3), except for factor 4, which had high correlations with factors 2 (0.625) and 3 (0.524) (see supplemental). Table 4 presents the factor loadings, which indicate the extent to which changes in the underlying factor are reflected in the corresponding indicator (item). All items loaded well onto their factors with primary (items with loadings below 0.4 should be excluded) (Hair et al., 2019). For interpreting communality (i.e., the proportion of an item’s variance explained by the common factors in factor analyses), are considered problematic and not interpretable (Hair, 2009). As shown in Table 4, the communality values for items I1, I2, E1, and E2 were below 0.5, and as they did not load onto any of the factors, they were excluded from the final model. Items in factor 4 (P1, P2, C1) also had low communality values and were likewise dismissed. Based on these results, we concluded that a four-factor solution was the most appropriate, dropping factor 4 due to its low variance explanation, high correlations with other factors, and low communality. The fit indices in Table 5 indicate a good model fit, showing that the EFA factor structure better fits the data than the original PICSE grouping in the above CFA analysis.
3) CFA - Alternate grouping: In the final step, as is best practice (Raykov and Marcoulides, 2011), we conducted CFA to validate the factor structure identified through EFA. The CFA fit indices in Table 5 confirm the EFA-derived four-factor model (RMSEA = 0.048; SRMR = 0.047, CFI = 0.982, TLI = 0.973). Table 4 outlines the factor structure and corresponding item groupings. Factor 1, labeled System/Output quality, includes items S2 through S5 and E3, which relate to the System group (in PICSE) and the style matching of genAI’s outputs. Factor 2, labeled Functional value, encompasses items I3 and P3, reflecting the educational value and practical advantages of using genAI tools. Factor 3, labeled Ease of use, comprises items S1 and C2, addressing the ease of using and integrating genAI in the workflow. Factor 5, labeled Goal maintenance, includes a single item, E4, focusing on genAI’s maintenance of human goals. The reliability and validity assessments further support the robustness of these constructs (see Sec. 4.1).
In summary, the psychometric analysis confirmed that a four-factor solution is most appropriate and provided a validated measurement instrument for capturing these factors.
| Model | RMSEA | SRMR | CFI | TLI | p-val | |
|---|---|---|---|---|---|---|
| CFA-Original | 0.104 | 0.084 | 0.925 | 0.927 | 147.3 | 0.01 |
| EFA | 0.057 | 0.054 | 0.968 | 0.965 | 109.1 | 0.01 |
| CFA-Alternate | 0.048 | 0.047 | 0.982 | 0.973 | 59.0 | 0.01 |
-
•
test results were not considered, as the test is affected by deviations from multivariate normality (Schumacker and Lomax, 2004). We still report the values for completeness.
3.3. Model Development
As discussed in the previous section, we refined the factor groupings within the PICSE framework. In this study, we are not proposing fundamentally different relationships to trust beyond those identified in the PICSE framework. Instead, we have constrained our focus to only those factors that were psychometrically validated. Next, we detail the hypotheses embedded in our theoretical model for each research question.
RQ1) Factors associated with trust
System/Output quality encompasses genAI tools’ presentation, adherence to safe and secure practices (including privacy and security implications of using genAI), and its performance and output quality (consistency and correctness) in relation to the development style or work environment in which it is utilized (S2-S5, E3). Developers often place trust in AI based on its performance and output quality (accuracy and consistency), which serve as proxies for the system’s perceived credibility (Fogg and Tseng, 1999; Wang et al., 2023; Cheng et al., 2023; Yu et al., 2019). Prior work (Wang et al., 2023) evidenced that developers are often wary about the security and privacy implications of using AI tools in their work, which influences the level of trust they place in these tools. Drawing upon these insights, we hypothesize: (H1) System/Output quality of genAI is positively associated with developers’ trust in these tools.
Functional value of a tool refers to the practical benefits and utility it offers users in their work (Sheth et al., 1991). In our context, genAI’s functional value encompasses its educational value and clear advantages relative to work performance (I3, P3). Prior work highlights that developers’ expectations of clear advantages from using AI tools (e.g., increased productivity, improved code quality) contribute to their trust in using these tools (Johnson et al., 2023; Ziegler et al., 2024). Further, AI’s ability to support learning fosters trust in these tools (Wang et al., 2023). Based on these, we posit: (H2) Functional value of genAI is positively associated with developers’ trust in these tools.
Ease of use associated with genAI tools includes the extent to which developers can easily use and integrate genAI into their current workflow (S1, C2). Prior research highlights that a tool’s ease of use (Gefen et al., 2003) and compatibility with existing workflows (Lee and See, 2004; Russo, 2024) contribute to users’ trust. Following this, we hypothesize: (H3) GenAI’s ease of use is positively associated with developers’ trust in these tools.
Goal maintenance is related to the degree to which genAI’s actions and responses align with the developer’s ongoing goals (E4). By its very nature, goals can vary depending on the task and context (Johnson et al., 2023). Therefore, aligning AI behavior with an individual’s immediate goals is crucial in human-AI collaboration scenarios (Wischnewski et al., 2023). In terms of human cognition, this congruence is important for maintaining cognitive flow and reducing cognitive load (Unsworth et al., 2012), which, in turn, fosters trust in systems (van der Werff et al., 2019; Chow and Chan, 2008). Consequently, we propose: (H4) Goal maintenance is positively associated with developers’ trust in genAI tools.
RQ2) Factors associated with behavioral intentions
Trust is a key factor in explaining resistance toward automated systems (Wischnewski et al., 2023) and plays an important role in technology adoption (Xiao et al., 2014; Witschey et al., 2015). Multiple studies have correlated an individual’s trust in technology with their intention to use it (Kim et al., 2019; Gefen et al., 2003; Baek and Kim, 2023). In our context, we thus posit: (H5) Trust is positively associated with intentions to use genAI tools.
In the context of GenderMag’s cognitive styles:
Motivations behind why someone uses technology (technophilic or task-focused) not only influences their intention to use it but also affects how they engage with its features and functionalities (Venkatesh et al., 2012; O’Brien, 2010). Naturally, individuals motivated by their interest and enjoyment in using and exploring the technology (opposite end of the spectrum from those motivated by task completion) are early adopters of new technology (Burnett et al., 2016). Based on this, we posit: (H6) Motivation to use technology for its own sake is positively associated with intentions to use genAI tools.
Computer self-efficacy refers to an individual’s belief in their ability to engage with and use new technologies to succeed in tasks (Bandura, 1997). It shapes how individuals apply cognitive strategies and the effort and persistence they invest in using new technologies (Compeau and Higgins, 1995), thereby influencing their intention to use them (Venkatesh and Davis, 2000; Li et al., 2024). In line with this, we propose: (H7) Computer self-efficacy is positively associated with intentions to use genAI tools.
Attitude towards risk encompasses an individual’s inclination to take risks in uncertain outcomes (Byrnes et al., 1999). This cognitive facet influences decision-making processes, particularly in contexts involving new or unfamiliar technology (Venkatesh and Davis, 2000). Risk-tolerant individuals (one end of the spectrum) are more inclined to experiment with unproven technology than risk-averse ones (the other end) (Burnett et al., 2016), and show higher intentions to use new tools (Venkatesh et al., 2012; Li et al., 2024). Thus, we posit: (H8) Risk tolerance is positively associated with intentions to use genAI tools.
Information processing style influences how individuals interact with technology when problem-solving: some gather information comprehensively to develop a detailed plan before acting; others gather information selectively, acting on initial promising pieces and acquiring more as needed (Burnett et al., 2016). GenAI systems, by their very interaction paradigm, inherently support the latter by providing immediate responses to queries, allowing users to act quickly on the information received and gather additional details incrementally. Accordingly, we posit: (H9) Selective information processing style is positively associated with intentions to use genAI tools.
Learning style for technology (by process vs. by tinkering) refers to how an individual approaches problem-solving and how they structure their approach to a new technology (Burnett et al., 2016). Some prefer to learn through an organized, step-by-step process, while others prefer to tinker around—exploring and experimenting with new technology or its features (Burnett et al., 2016). Prior work indicates that software, more often than not, is designed to support and encourage tinkering (Carroll and Rosson, 2003), making individuals who prefer this approach more inclined to adopt and use new tools (Venkatesh et al., 2003). Thus, we propose: (H10) Tinkering style is positively associated with intentions to use genAI tools.
Behavioral intention. Successful technology adoption hinges on users’ intention to use it, translating into future usage. Prior work has consistently shown these factors to be positively correlated (Venkatesh et al., 2003, 2012), suggesting that users who intend to use technology are more likely to do so. Accordingly, we hypothesize: (H11) Behavioral intention to use genAI tools is positively associated with the usage of these tools.
3.4. Data Analysis
We used Partial Least Squares-Structural Equation Modeling (PLS-SEM) to test our theoretical model. PLS-SEM is a second-generation multivariate data analysis technique that has gained traction in empirical SE studies investigating complex phenomena (Russo, 2024; Trinkenreich et al., 2023; Russo and Stol, 2021). It allows for simultaneous analysis of relationships among constructs (measured by one or more indicators) and addresses multiple interconnected research queries in one comprehensive analysis. It is particularly suited for exploratory studies due to its flexibility in handling model complexity while accounting for measurement errors in latent variables (Hair et al., 2019). Importantly, PLS-SEM does not require data to meet distributional assumptions. Instead, it uses a bootstrapping approach to determine the statistical significance of path coefficients (i.e., relationships between constructs). The PLS path model is estimated for a large number of random subsamples (usually 5000), generating a bootstrap distribution, which is then used to make statistical inferences (Hair et al., 2019).
We used the SmartPLS (v4.1.0) software (SmartPLS Team, 2024) for PLS-SEM analyses, which comprised two main steps, each involving specific tests and procedures. First, we evaluated the measurement model, empirically assessing the relationships between the latent constructs and their indicators (Sec. 4.1). Next, we evaluated the theoretical (or structural) model (Sec. 4.2), representing the hypotheses presented in Section 3.3.
The appropriate sample size was determined by conducting power analysis using the G*Power tool (Faul et al., 2009). We performed an F-test with multiple linear regression, setting a medium effect size (0.25), a significance level of 0.05, and a power of 0.95. The maximum number of predictors in our model is seven (six theoretical constructs and one control variable to Behavioral Intention) (see Fig. 1). The calculation indicated a minimum sample size of 95; our final sample size of 238 exceeded it considerably.
4. Results
In this section, we report the evaluation of the measurement model (Sec. 4.1), followed by the evaluation of the structural model (Sec. 4.2). We adhered to the evaluation protocols outlined in prior studies (Russo and Stol, 2021; Hair et al., 2019). The analysis was performed using the survey data, which met the assumptions for factor analysis (Hair et al., 2019): significant Bartlett’s test of sphericity on all constructs ((496)=4474.58, p .001) and adequate KMO measure of sampling adequacy (0.901), well above the recommended threshold (0.60) (Howard, 2016).
4.1. Measurement Model Evaluation
Our model evaluates several theoretical constructs that are not directly observable (e.g., Trust, Behavioral Intention). These constructs are modeled as latent variables, each measured by a set of indicators or manifest variables (see Fig. 1). The first step in evaluating a structural equation model is to ensure the soundness of the measurement of these latent variables, a process referred to as evaluating the ‘measurement model’ (Hair et al., 2019). We performed a series of tests to validate the measurement model (Russo and Stol, 2021), detailed as follows:
1) Convergent validity examines how a measure correlates with alternate measures of the same construct, focusing on the correlations between indicators (questions) and their corresponding construct. This evaluation assesses whether respondents interpret the questions as intended by the question designers (Kock, 2014). Our theoretical model comprises latent constructs that are reflectively measured, meaning the changes in the construct should be reflected in changes in the indicators (Russo and Stol, 2021). Consequently, these indicators should exhibit a significant proportion of shared variance by converging on their respective constructs (Hair et al., 2019). We assessed convergent validity using Average Variance Extracted (AVE) and indicator reliability through outer loadings (Hair et al., 2019).
AVE represents a construct’s communality, indicating the shared variance among its indicators, and should exceed 0.5 (Hair et al., 2019). AVE values for all latent constructs in our model surpassed this threshold (see Table 6). Regarding outer loadings, values above 0.708 are considered sufficient, while values above 0.60 are sufficient for exploratory studies (Hair et al., 2019). We removed variables that did not sufficiently reflect changes in the latent construct (SE3 from computer self-efficacy and IP3 from selective information processing).222After removing SE3 and IP3, the AVE values for computer self-efficacy (now with 3 indicators) and selective information processing (now with 2 indicators) increased from 0.627 to 0.736 and 0.609 to 0.741, respectively. Thus, all indicators in our model exceeded the threshold, ranging between 0.615 and 0.954 (see Fig. 1).
| Cronbach’s | CR() | CR() | AVE | |
|---|---|---|---|---|
| System/Output quality | 0.816 | 0.834 | 0.874 | 0.781 |
| Functional value | 0.816 | 0.895 | 0.914 | 0.842 |
| Ease of use | 0.780 | 0.782 | 0.902 | 0.822 |
| Trust | 0.856 | 0.889 | 0.906 | 0.710 |
| Motivations | 0.713 | 0.722 | 0.835 | 0.718 |
| Risk tolerance | 0.715 | 0.754 | 0.795 | 0.667 |
| Computer self-efficacy | 0.802 | 0.809 | 0.847 | 0.736 |
| Selective information processing | 0.711 | 0.714 | 0.849 | 0.741 |
| Learning by tinkering | 0.721 | 0.722 | 0.817 | 0.697 |
| Behavioral intention | 0.827 | 0.831 | 0.920 | 0.851 |
-
•
Cronbach’s tends to underestimate reliability, whereas composite reliability (CR: ) tends to overestimate it. The true reliability typically lies between these two estimates and is effectively captured by CR() (Russo and Stol, 2021).
2) Internal consistency reliability seeks to confirm that the indicators are consistent with one another and that they consistently and reliably measure the same construct. To assess this, we performed both Cronbach’s and Composite Reliability (CR: ) tests (Russo and Stol, 2021). The desirable range for these values is between 0.7 and 0.9 (Hair et al., 2019). As presented in Table 6, all values corresponding to our model constructs fall within the acceptable range, confirming that the constructs and their indicators meet the reliability criteria.
3) Discriminant validity assesses the distinctiveness of each construct in relation to the others. Our model includes 10 latent variables (Table 6). A primary method for assessing discriminant validity is the Heterotrait-Monotrait (HTMT) ratio of correlations (Henseler et al., 2015). Discriminant validity may be considered problematic if the HTMT ratio , with a more conservative cut-off at (Hair et al., 2019). In our case, the HTMT ratios between the latent constructs ranged from 0.064 to 0.791, all below the threshold. We report the HTMT ratios in the supplemental (sup, [n. d.]), along with the cross-loadings of the indicators, and the Fornell-Larcker criterion values for the sake of completeness.
4) Collinearity assessment is conducted to evaluate the correlation between predictor variables, ensuring they are independent to avoid potential bias in the model path estimations. We assessed collinearity using the Variance Inflation Factor (VIF). In our model, all VIF values are below 2.1, well below the accepted cut-off value of 5 (Hair et al., 2019).
4.2. Structural Model Evaluation
After confirming the constructs’ reliability and validity, we assess the structural model (graphically represented in Fig. 1). This evaluation involves validating the research hypotheses and assessing the model’s predictive power.
4.2.1. Path coefficients and significance
Table 7 presents the results of the hypotheses testing, including the mean of the bootstrap distribution (B), the standard deviation (SD), the 95% confidence interval (CI), and the p-values. The path coefficients in Fig. 1 and Table 7 are interpreted as standard regression coefficients, indicating the direct effects of one variable on another. Each hypothesis is represented by an arrow between constructs in Fig. 1. For instance, the arrow from “Functional Value” to “Trust” corresponds to H2. Given its positive path coefficient (B=0.142), genAI’s functional value is positively associated with developers’ trust in these tools. The coefficient of 0.142 indicates that when the score for functional value increases by one standard deviation unit, the score for trust increases by 0.142 standard deviation units. The analysis results (Table 7) show that most of our hypotheses are supported, except for H3 (p=0.58), H9 (p=0.06), and H10 (p=0.33). Next, we detail the factors associated with trust and behavioral intentions for the supported hypotheses with some exemplary quotes from responses to the open-ended question to illustrate our findings.
Factors associated with trust (RQ1): Our analysis supported Hypotheses H1 (p=0.00), H2 (p=0.03), and H4 (p=0.00) (Table 7). First, the support for system/output quality in fostering trust (H1) can be explained by how developers prefer tools that deliver accurate, reliable outputs matching their work style and practices (Wang et al., 2023; Yu et al., 2019). Next, the functional value of genAI, encompassing educational benefits and practical advantages, promotes trust (H2) since developers prioritize tools that offer tangible utility in their work (Johnson et al., 2023; Ziegler et al., 2024). For instance, one survey respondent mentioned the practical utility of genAI tools, stating, “I find value in these models for creative endeavors, gaining different perspectives, or coming up with ideas I wouldn’t have otherwise”. Finally, goal maintenance is relevant for cultivating trust (H4). The alignment between a developer’s goals and genAI’s actions supports using genAI tools to achieve these goals. This eliminates the need for developers to constantly verify the relevance of genAI’s outputs, thereby reducing cognitive load. This congruence ultimately enhances genAI’s credibility as a cognitive collaborator (Wischnewski et al., 2023) rather than as an independent and potentially untrustworthy tool, thus bolstering trust in these tools.
Factors associated with behavioral intentions (RQ2): Our analysis supported Hypotheses H5 (p=0.00), H6 (p=0.01), H7 (p=0.01), and H8 (p=0.00), indicating that developers’ trust (H5) and their cognitive styles—motivations (H6), computer self-efficacy (H7), and risk tolerance (H8)—are significantly associated with their behavioral intentions to use genAI tools.
Trust (H5) is pivotal in shaping adoption decisions as it reduces resistance to new technologies (Xiao et al., 2014; Witschey et al., 2015). When developers trust genAI tools, they perceive them as credible partners, enhancing their willingness to use these tools. Moreover, developers’ cognitive styles significantly shape their intentions to adopt genAI tools. Developers motivated by the intrinsic enjoyment of technology (H6) have higher intentions to adopt genAI tools. In contrast, those with a task-oriented approach tend to be more cautious and hesitant about the cognitive effort they are willing to invest in these tools (Burnett et al., 2016). One respondent echoed this, stating, “I am slow to adopt new workflows; I put off actively exploring new tools unless it is related to what I need to do”. Higher computer self-efficacy within peer groups is also significantly associated with increased intentions to use genAI tools (H7). Despite generally high self-efficacy, some developers face interaction challenges with genAI that may impact their confidence and adoption rates. One respondent shared, “I see my colleagues getting good responses while I fiddle around to get the answers I need. Also, it does not always show the right document relevant to me, so I prefer traditional ways”. Furthermore, we found that developers with higher risk tolerance are significantly more inclined to use these tools than risk-averse individuals (H8). The context (and involved stakes) in which these tools are used further play a role, as highlighted by another respondent: “I don’t use it yet to write code that I can put my name behind in production; I just use it for side projects or little scripts to speed up my job, but not in actual production code”.
Finally, our analysis supported Hypothesis H11 (p=0.00), highlighting a significant positive association between developers’ behavioral intention to use genAI tools and its usage in their work. This corroborates with prior technology acceptance models (Venkatesh et al., 2003, 2012), emphasizing the pivotal role of behavioral intentions in predicting use behavior.
Control variables: Although experience is often relevant for technology adoption (Venkatesh et al., 2003), our analysis found no significant associations between SE experience and trust, behavioral intentions, or usage of genAI tools. This is likely since genAI introduces a new interaction paradigm (Weisz et al., 2023), which diverges from traditional SE tools and requires different skills and interactions not necessarily linked to SE experience. Familiarity with genAI, while potentially influential, was excluded as a control variable due to a highly skewed distribution of responses, with most participants reporting high familiarity. Including such skewed variables could lead to unreliable estimates and compromise the model’s validity (Hair et al., 2019; Sarstedt and Cheah, 2019). Similarly, the gender variable was excluded due to its skewed distribution. The analysis of unobserved heterogeneity (see supplemental (sup, [n. d.])) confirms the absence of any group differences in the model (e.g., organizational heterogeneity) caused by unmeasured criteria.
| B | SD | 95% CI | p | ||
|---|---|---|---|---|---|
| H1 System/Output qualityTrust | (.45, .77) | ||||
| H2 Functional valueTrust | (.01, .26) | ||||
| H3 Ease of useTrust | (-.08, .16) | ||||
| H4 Goal maintenance Trust | (.07, .36) | ||||
| H5 TrustBI | (.38, .58) | ||||
| H6 MotivationsBI | (.07, .40) | ||||
| H7 Computer self-efficacyBI | (.03, .24) | ||||
| H8 Risk toleranceBI | (.09, .33) | ||||
| H9 Selective information processing BI | (-.02, .14) | ||||
| H10 Learning by tinkeringBI | (-.06, .18) | ||||
| H11 BIUsage | (.46, .67) | ||||
| SE ExperienceTrust | (-.01, 0.2) | ||||
| SE ExperienceBI | (-.03, .11) | ||||
| SE ExperienceUsage | (-.06, .15) |
-
•
BI: Behavioral Intention. We consider 0.02 to be no effect, [0.02, 0.15) to be small, [0.15, 0.35) to be medium, and 0.35 to be large (Cohen, 2013).
4.2.2. Model evaluation
We assessed the relationship between constructs and the predictive capabilities of the theoretical model by evaluating the model’s explanatory power (, Adjusted (Adj.) ), model fit (SRMR), effect sizes (), and predictive relevance () (Russo and Stol, 2021).
Explanatory power: The coefficient of determination ( and Adj. values) indicate the proportion of variance in the endogenous variables explained by the predictors. Ranging from 0 to 1, higher values signify greater explanatory power, with 0.25, 0.5, and 0.75 representing weak, moderate, and substantial levels, respectively (Hair et al., 2019). As shown in Table 8, the values in our model are 0.68 for Trust, 0.66 for Behavioral intention, and 0.33 for Usage, demonstrating moderate to substantial explanatory power, well above the accepted threshold of 0.19 (Chin et al., 1998). Further, Table 7 presents the effect sizes (), which measure the impact of each predictor on the endogenous variables. The effect sizes indicate that the predictors exhibit medium to large effects on their respective endogenous variables for all supported hypotheses in our model, with values ranging from 0.14 to 0.54 (Cohen, 2013), further corroborating the model’s explanatory power.333Large and can occasionally indicate overfitting. We thoroughly evaluated this issue by analyzing residuals and conducting cross-validation, finding no evidence of model overfitting (see (sup, [n. d.])).
Model fit: We analyzed the overall model fit using the standardized root mean square residual (SRMR), a recommended fit measure for detecting misspecification in PLS-SEM models (Russo and Stol, 2021). Our results suggest a good fit of the data in the theoretical model, with SRMR = 0.077, which is below the suggested thresholds of 0.08 (conservative) and 0.10 (lenient) (Henseler et al., 2016).
Predictive relevance: Finally, we evaluated the model’s predictive relevance using Stone-Geisser’s (Stone, 1974), a measure of external validity (Hair et al., 2019) obtainable via the PLS-predict algorithm (Shmueli et al., 2016) in SmartPLS. PLS-predict is a holdout sample-based procedure: it divides the data into subgroups (folds) of roughly equal size, using (k-1) folds as a training sample to estimate the model, while the remaining fold serves as a holdout to assess out-of-sample predictive power. values are calculated for endogenous variables; values greater than 0 indicate predictive relevance, while negative values suggest the model does not outperform a simple average of the endogenous variable. Our sample was segmented into k=10 parts, and 10 repetitions were used to derive the statistic (Hair et al., 2019), all of which were greater than 0 (Table 8), confirming our model’s adequacy in terms of predictive relevance.
| Construct | Adj. | ||
|---|---|---|---|
| Trust | |||
| Behavioral Intention | |||
| Usage |
4.2.3. Common method bias
We collected data via a single survey instrument, which might raise concerns about Common Method Bias/Variance (CMB/CMV) (Russo and Stol, 2021). To test for CMB, we applied Harman’s single factor test (Podsakoff et al., 2003) on the latent variables. No single factor explained more than 23% variance. An unrotated exploratory factor analysis with a forced single-factor solution was conducted, which explained 30.3% of the variance, well below the 50% threshold. Additionally, we used Kock’s collinearity approach (Kock, 2015). The VIFs for the latent variables ranged from 1.01 to 2.45, all under the cut-off of 3.3. These indicate that CMB was not a concern in our study.
5. Discussion
5.1. Implications for practice
Design to maintain developers’ goals. Our findings suggest that developers’ trust in genAI tools manifests when these tools align with their goals (H4). This is likely because goal maintenance reduces the need for developers to constantly verify the relevance of genAI’s contributions, easing cognitive load and allowing them to focus on task-related activities.
To achieve goal maintenance, the AI should consistently account for the developer’s (1) current state; (2) immediate goals, and the expected success (outcomes from AI) (Wischnewski et al., 2023); as well as (3) preferences for transitioning from their current state (1) to achieving their immediate goals (2). These preferences may involve process methodologies, interaction styles, output specifications, alignment with the work style, or safety/security considerations (Johnson et al., 2023; Burnett et al., 2016). Given that an individual’s goal(s) may evolve in response to changes in their task state, toolsmiths must also prioritize adaptability in genAI tool design. For instance, adaptability can be incorporated by iteratively adjusting AI’s actions based on user input on (1), (2), and (3) to ensure its ongoing alignment with their shifting goals.
Allowing developers the flexibility to explicitly steer AI’s actions as needed is also important for goal maintenance. This control can be essential if the genAI tool deviates from the expected trajectory, enabling developers to (re)calibrate it to support their goals. Further, this can also support developers’ metacognitive flexibility (Tankelevitch et al., 2024), i.e., they may adapt their cognitive strategies based on new information or task-state changes. The ability to steer the AI to align with these adapted strategies helps accommodate their evolving goals.
Design for contextual transparency. Developers often face decisions about incorporating genAI tool support for their tasks. Any mismatch between their expectations and genAI’s true capabilities can lead to over/under-estimating the tool’s functionality, increasing the risk of errors, lost productivity, or potential adverse outcomes in critical tasks (Pearce et al., 2022). Such outcomes are detrimental to fostering subsequent trust. Thus, helping developers to calibrate their expectations to match the true tool capabilities is essential. Creating this alignment involves designing interfaces that explicitly communicate the tool’s capabilities and limitations, consistent with HAI interaction guidelines (Amershi et al., 2019; Google, 2023). This clarity allows individuals to form accurate expectations about system quality (H1) within their task contexts and assess its functional value (H2), thereby fostering appropriate trust (Jacovi et al., 2021). To that end, we suggest:
(a) Communicating genAI’s reasoning process and derivation of its outputs in the context of the current task. Such transparency about the source and how an AI arrived at its output can enable developers to assess correctness more accurately and evaluate any safety or security issues related to using these outputs in their work. This can enhance the assessment of system/output quality, thus cultivating appropriate trust (H1).
(b) Communicating genAI’s limitations for the current task and scoping assistance under conditions of uncertainty to incite warranted trust (Jacovi et al., 2021). Doing so allows developers to consider the tool’s practical utility for their task context, clarifying its appropriate functional value (H2) in their work.
Inclusive tool design for HAI-UX fairness. AI fairness has gained substantial traction over the years (Green and Chen, 2019). While much of the research and discussion has focused on data or algorithmic fairness, fairness should also include user experiences in human-AI interactions (HAI-UX). We advocate promoting fairness in HAI-UX through inclusive genAI tool design, specifically by supporting developers’ diverse cognitive styles.
Our findings indicate that developers who are motivated to use genAI tools for their own sake (H6), have higher computer self-efficacy (H7), and have greater tolerance for risk (H8) are more inclined to adopt these tools compared to their peers. To achieve more equitable acceptance of these tools across the cognitive spectrum of developers, future designs must prioritize adaptability based not only on developers’ goals (discussed above) but also on their cognitive styles. This can be achieved by capturing these styles (e.g., using the survey questions from this study) and designing genAI tools that dynamically adapt to align with these styles using various strategies. For example, to support developers motivated by task completion, genAI tools can solicit their immediate goals and expected outcomes and deliver contextually appropriate information (and explanations) consistent with their preferred styles. This would simplify developers’ ongoing tasks without overwhelming them with unrelated features or extraneous information, helping them complete their tasks effectively. As another example, genAI tools can support individuals with lower self-efficacy by offering explicit cues that differentiate between errors arising from prompting issues and those due to system limitations. For instance, it can caution users about tasks where it typically underperforms, based on prior feedback, or highlight specific parts of the prompt that influenced the generated output. This distinction can help prevent individuals from doubting their ability to effectively use these tools in their work.
5.2. Implications for research
Our study establishes an understanding of developers’ trust and intention-related factors during the early stage of genAI adoption. Furthermore, our study offers a validated instrument for capturing relevant factors in the context of human-genAI interaction. Researchers can utilize this instrument to operationalize theoretical expectations or hypotheses—such as capturing the dynamics of trust and intentions in finer contexts, refining genAI tools with design improvements, and comparing user experiences before and after design changes; thus advancing the understanding of AI adoption.
Non-significant associations: Our analysis did not find support for Hypotheses H3 (p=0.59), H9 (p=0.06), and H10 (p=0.33). These findings are surprising, as ease of use, information processing, and tinkering learning style are relevant when considering traditional software tools (Burnett et al., 2016; Venkatesh et al., 2003). However, in genAI contexts, these constructs may manifest differently due to the altered dynamics of user engagement compared to more traditional software. The intuitive nature of genAI interfaces might diminish the traditional impact of these factors. For example, ease of use might not show a relation as using these interfaces is inherently easy; instead, the appropriateness of the queries is what matters. Similarly, developers’ information processing style (H9) did not significantly influence their intentions to use genAI tools, likely because how individuals articulate their needs—a single comprehensive prompt or sequence of queries—often aligns with their preferences for consuming information (comprehensive or selective). The lack of a relationship for tinkering style (H10), as well, could be attributed to genAI’s interaction paradigm, which is primarily centered around (re)formulating and following up with queries rather than “tinkering” with the software’s features. If these speculations hold, how certain validated constructs were framed in the current study (sup, [n. d.]) might have indeed limited our understanding of these dynamics. Future research should explore these constructs more deeply within the context of human-genAI interactions. For instance, instead of focusing on ‘ease of use’ or ‘tinkering with software features’, studies could examine ‘ease of prompting’ or ‘tinkering with prompt strategies’ and how preferences (and proficiency) in these areas influence developers’ trust and behavioral intentions. Understanding these dynamics can inform the future design and adoption strategies of genAI tools, aligning them more closely with user interaction patterns and cognitive styles.
5.3. Threats to validity and limitations
Construct validity: We captured constructs through self-reported measures, asking participants to express their agreement with literature-derived indicators. This approach assumes that participants’ responses accurately reflect their beliefs and experiences, which might not always be the case due to various biases or misinterpretations. To reduce this threat, we used validated instruments, evaluated the psychometric validity of the PICSE questions, involved practitioners in designing the questions, ran pilot studies, incorporated attention checks, randomized the questionnaire within blocks, and screened the responses. Further, our analysis confirmed that the constructs were internally consistent, reliable, and met convergent and discriminant validity criteria.
Internal validity: Our hypotheses propose associations between constructs, rather than causal relationships, given the cross-sectional nature of the study (Stol and Fitzgerald, 2018). We acknowledge the limitation of self-selection bias, as respondents interested in (or skeptical about) genAI tools might be more willing to complete the questionnaire. Further, a theoretical model like ours cannot capture an exhaustive list of factors. Other factors can play a role, thus positioning our results as a reference for future studies. Future work should also consider using longitudinal data and control for potential confounding factors, such as familiarity with genAI and demographic variables. Additionally, trust is a situation-dependent construct (Jacovi et al., 2021). Although we focused on software development, trust in genAI tools may vary based on finer work contexts (e.g., software design vs. software testing tasks). Therefore, our results should be interpreted as a theoretical starting point, guiding future studies to explore these contextual influences.
External validity: Our survey was conducted within TechNxt and TechCo. While the sample includes engineers from around the globe, it may not fully represent the broader software developer community. However, the sample distribution aligns with previous empirical studies involving software engineers (Russo, 2024; Trinkenreich et al., 2023), providing a suitable starting point to understand the associations presented in our model. The responses were sufficiently consistent to find full or partial empirical support for the hypotheses. Nevertheless, theory development is an iterative process (Shull et al., 2007). Thus, our results should be interpreted as a starting point, aiming for theoretical rather than statistical generalizability. Future studies should replicate, validate, and extend our theoretical model in various contexts.
6. Conclusion
Our findings highlight that genAI’s system/output quality, functional value, and goal maintenance significantly influence developers’ trust. Furthermore, trust and cognitive styles (motivations, computer self-efficacy, and attitude towards risk) influence intentions to use these tools, which, in turn, drives usage. We also contribute a validated instrument to capture trust-related factors in human-genAI interaction contexts.
Beyond theoretical contributions, our study offers practical implications, including pointers for design mechanisms that foster appropriate trust and promote equitable user experiences (Sec. 5). While our work enhances the understanding of developers’ trust and behavioral intentions towards genAI tools, long-term longitudinal studies are essential for refining the knowledge of AI adoption dynamics in software engineering.
Acknowledgements.
We thank the GitHub Next team, Tom Zimmermann, and Christian Bird for providing valuable feedback on the survey contents and Brian Houck for facilitating the survey distribution. We also thank all the survey respondents for their time and insights. This work was partially supported by the National Science Foundation under Grant Numbers 2235601, 2236198, 2247929, 2303042, and 2303043. Any opinions, findings, conclusions, or recommendations expressed in this material are those of the authors and do not necessarily reflect the views of the sponsors.References
- (1)
- sup ([n. d.]) [n. d.]. Supplemental Package. https://zenodo.org/record/12798074.
- bus (2023) 2023. AI mislabeled essays by non-native English speakers as bots. Business Insider (Jul 2023).
- Adib-Moghaddam (2023) Arshin Adib-Moghaddam. 2023. Is Artificial Intelligence Racist?: The Ethics of AI and the Future of Humanity. Bloomsbury Publishing.
- Amershi et al. (2019) Saleema Amershi, Dan Weld, Mihaela Vorvoreanu, Adam Fourney, Besmira Nushi, Penny Collisson, Jina Suh, Shamsi Iqbal, Paul N Bennett, Kori Inkpen, et al. 2019. Guidelines for human-AI interaction. In 2019 CHI Conference on Human Factors in Computing Systems. 1–13.
- Anderson et al. (2022) Andrew Anderson, Jimena Noa Guevara, Fatima Moussaoui, Tianyi Li, Mihaela Vorvoreanu, and Margaret Burnett. 2022. Measuring User Experience Inclusivity in Human-AI Interaction via Five User Problem-Solving Styles. ACM Transactions on Interactive Intelligent Systems (2022).
- Baek and Kim (2023) Tae Hyun Baek and Minseong Kim. 2023. Is ChatGPT scary good? How user motivations affect creepiness and trust in generative artificial intelligence. Telematics and Informatics 83 (2023), 102030.
- Bandura (1997) Albert Bandura. 1997. Self-efficacy the exercise of control. New York: H. Freeman & Co. Student Success 333 (1997), 48461.
- Beckwith and Burnett (2004) Laura Beckwith and Margaret Burnett. 2004. Gender: An important factor in end-user programming environments?. In 2004 IEEE symposium on visual languages-human centric computing. IEEE, 107–114.
- Boubin et al. (2017) Jayson G Boubin, Christina F Rusnock, and Jason M Bindewald. 2017. Quantifying compliance and reliance trust behaviors to influence trust in human-automation teams. Human Factors and Ergonomics Society Annual Meeting 61, 1 (2017), 750–754.
- Burnett et al. (2016) Margaret Burnett, Simone Stumpf, Jamie Macbeth, Stephann Makri, Laura Beckwith, Irwin Kwan, Anicia Peters, and William Jernigan. 2016. GenderMag: A method for evaluating software’s gender inclusiveness. Interacting with Computers 28, 6 (2016), 760–787.
- Byrnes et al. (1999) James P Byrnes, David C Miller, and William D Schafer. 1999. Gender differences in risk taking: A meta-analysis. Psychological bulletin 125, 3 (1999), 367.
- Carroll and Rosson (2003) John M Carroll and Mary Beth Rosson. 2003. Design rationale as theory. HCI models, theories and frameworks: Toward a multidisciplinary science (2003), 431–461.
- Center (2023) Microsoft News Center. 2023. Siemens and Microsoft partner to drive cross-industry AI adoption.
- Chau (1996) Patrick YK Chau. 1996. An empirical assessment of a modified technology acceptance model. Journal of management information systems 13, 2 (1996), 185–204.
- Cheng et al. (2023) Ruijia Cheng, Ruotong Wang, Thomas Zimmermann, and Denae Ford. 2023. “It would work for me too”: How Online Communities Shape Software Developers’ Trust in AI-Powered Code Generation Tools. ACM Transactions on Interactive Intelligent Systems (2023).
- Chin et al. (1998) Wynne W Chin et al. 1998. The partial least squares approach to structural equation modeling. Modern methods for business research 295, 2 (1998), 295–336.
- Chow and Chan (2008) Wing S Chow and Lai Sheung Chan. 2008. Social network, social trust and shared goals in organizational knowledge sharing. Information & management 45, 7 (2008), 458–465.
- Cohen (2013) Jacob Cohen. 2013. Statistical power analysis for the behavioral sciences. Routledge.
- Compeau and Higgins (1995) Deborah R Compeau and Christopher A Higgins. 1995. Computer self-efficacy: Development of a measure and initial test. MIS quarterly (1995), 189–211.
- DeVellis and Thorpe (2021) Robert F DeVellis and Carolyn T Thorpe. 2021. Scale development: Theory and applications. Sage publications.
- Eubanks (2018) Virginia Eubanks. 2018. Automating inequality: How high-tech tools profile, police, and punish the poor. St. Martin’s Press.
- Fan et al. (2023) Angela Fan, Beliz Gokkaya, Mark Harman, Mitya Lyubarskiy, Shubho Sengupta, Shin Yoo, and Jie M Zhang. 2023. Large language models for software engineering: Survey and open problems. arXiv preprint arXiv:2310.03533 (2023).
- Faul et al. (2009) Franz Faul, Edgar Erdfelder, Axel Buchner, and Albert-Georg Lang. 2009. Statistical power analyses using G* Power 3.1: Tests for correlation and regression analyses. Behav Res Methods 41, 4 (2009), 1149–1160.
- Fogg and Tseng (1999) Brian J Fogg and Hsiang Tseng. 1999. The elements of computer credibility. In Human Factors in Computing Systems. 80–87.
- Furr (2011) Mike Furr. 2011. Scale construction and psychometrics for social and personality psychology. Scale Construction and Psychometrics for Social and Personality Psychology (2011), 1–160.
- Gefen et al. (2003) David Gefen, Elena Karahanna, and Detmar W Straub. 2003. Trust and TAM in online shopping: An integrated model. MIS quarterly (2003), 51–90.
- Google (2023) Google. 2023. People+AI guidebook. https://pair.withgoogle.com/guidebook/.
- Green and Chen (2019) Ben Green and Yiling Chen. 2019. Disparate interactions: An algorithm-in-the-loop analysis of fairness in risk assessments. In Conference on fairness, accountability, and transparency. 90–99.
- Grichting (1994) Wolfgang L Grichting. 1994. The meaning of “I Don’t Know” in opinion surveys: Indifference versus ignorance. Aust Psychol 29, 1 (1994).
- Guizani et al. (2022) Mariam Guizani, Igor Steinmacher, Jillian Emard, Abrar Fallatah, Margaret Burnett, and Anita Sarma. 2022. How to debug inclusivity bugs? a debugging process with information architecture. International Conference on Software Engineering: Software Engineering in Society (2022), 90–101.
- Hair (2009) Joseph F Hair. 2009. Multivariate data analysis. (2009).
- Hair et al. (2019) Joseph F Hair, Jeffrey J Risher, Marko Sarstedt, and Christian M Ringle. 2019. When to use and how to report the results of PLS-SEM. Eur. Bus. Rev. (2019).
- Hamid et al. (2023) Md Montaser Hamid, Amreeta Chatterjee, Mariam Guizani, Andrew Anderson, Fatima Moussaoui, Sarah Yang, Isaac Escobar, Anita Sarma, and Margaret Burnett. 2023. How to measure diversity actionably in technology. Equity, Diversity, and Inclusion in Software Engineering: Best Practices and Insights (2023).
- Hamid et al. (2024) Md Montaser Hamid, Fatima Moussaoui, Jimena Noa Guevara, Andrew Anderson, and Margaret Burnett. 2024. Improving User Mental Models of XAI Systems with Inclusive Design Approaches. arXiv preprint arXiv:2404.13217 (2024).
- Harrington (2009) Donna Harrington. 2009. Confirmatory factor analysis. Oxford university press.
- Henseler et al. (2016) Jörg Henseler, Geoffrey Hubona, and Pauline Ash Ray. 2016. Using PLS path modeling in new technology research: updated guidelines. Industrial management & data systems 116, 1 (2016), 2–20.
- Henseler et al. (2015) Jörg Henseler, Christian M Ringle, and Marko Sarstedt. 2015. A new criterion for assessing discriminant validity in variance-based structural equation modeling. J. Acad. Mark. Sci. 43, 1 (2015), 115–135.
- Hoff and Bashir (2015) Kevin Anthony Hoff and Masooda Bashir. 2015. Trust in automation: Integrating empirical evidence on factors that influence trust. Human factors 57, 3 (2015), 407–434.
- Hoffman et al. (2023) Robert R Hoffman, Shane T Mueller, Gary Klein, and Jordan Litman. 2023. Measures for explainable AI: Explanation goodness, user satisfaction, mental models, curiosity, trust, and human-AI performance. Frontiers in Computer Science 5 (2023), 1096257.
- Hopkins (1998) Kenneth D Hopkins. 1998. Educational and psychological measurement and evaluation. ERIC.
- Howard (2016) Matt C Howard. 2016. A review of exploratory factor analysis decisions and overview of current practices: What we are doing and how can we improve? International journal of human-computer interaction 32, 1 (2016), 51–62.
- Hu and Bentler (1999) Li-tze Hu and Peter M Bentler. 1999. Cutoff criteria for fit indexes in covariance structure analysis: Conventional criteria versus new alternatives. Structural equation modeling: a multidisciplinary journal 6, 1 (1999), 1–55.
- Jacovi et al. (2021) Alon Jacovi, Ana Marasović, Tim Miller, and Yoav Goldberg. 2021. Formalizing trust in artificial intelligence: Prerequisites, causes and goals of human trust in AI. In Proceedings of the 2021 ACM conference on fairness, accountability, and transparency. 624–635.
- JASP Team (2024) JASP Team. 2024. JASP (Version 0.16.4) [Computer software]. https://www.jasp-stats.org Accessed: 2024-07-07.
- Jian et al. (2000) Jiun-Yin Jian, Ann M Bisantz, and Colin G Drury. 2000. Foundations for an empirically determined scale of trust in automated systems. International journal of cognitive ergonomics 4, 1 (2000), 53–71.
- Johnson et al. (2023) Brittany Johnson, Christian Bird, Denae Ford, Nicole Forsgren, and Thomas Zimmermann. 2023. Make Your Tools Sparkle with Trust: The PICSE Framework for Trust in Software Tools. In 2023 IEEE/ACM 45th International Conference on Software Engineering: Software Engineering in Practice (ICSE-SEIP). IEEE, 409–419.
- Kalliamvakou (2024) Eirini Kalliamvakou. 2024. A developer’s second brain: Reducing complexity through partnership with AI.
- Kim et al. (2019) Jin W Kim, Hye I Jo, and Bong G Lee. 2019. The study on the factors influencing on the behavioral intention of chatbot service for the financial sector: Focusing on the UTAUT model. Journal of Digital Contents Society 20, 1 (2019), 41–50.
- Kock (2014) Ned Kock. 2014. Advanced mediating effects tests, multi-group analyses, and measurement model assessments in PLS-based SEM. International Journal of e-Collaboration 10, 1 (2014).
- Kock (2015) Ned Kock. 2015. Common method bias in PLS-SEM: A full collinearity assessment approach. International Journal of e-Collaboration (ijec) 11, 4 (2015), 1–10.
- Lee and See (2004) John D Lee and Katrina A See. 2004. Trust in automation: Designing for appropriate reliance. Human factors 46, 1 (2004), 50–80.
- Li et al. (2024) Xiang Li, Jian Zhang, and Jie Yang. 2024. The effect of computer self-efficacy on the behavioral intention to use translation technologies among college students: Mediating role of learning motivation and cognitive engagement. Acta Psychologica 246 (2024), 104259.
- Liang et al. (2024) Jenny T Liang, Chenyang Yang, and Brad A Myers. 2024. A large-scale survey on the usability of ai programming assistants: Successes and challenges. In Proceedings of the 46th IEEE/ACM International Conference on Software Engineering. 1–13.
- Liao and Sundar (2022) Q Vera Liao and S Shyam Sundar. 2022. Designing for responsible trust in AI systems: A communication perspective. 2022 ACM Conference on Fairness, Accountability, and Transparency (2022), 1257–1268.
- Lord and Novick (2008) Frederic M Lord and Melvin R Novick. 2008. Statistical theories of mental test scores. IAP.
- Madsen and Gregor (2000) Maria Madsen and Shirley Gregor. 2000. Measuring human-computer trust. In 11th australasian conference on information systems, Vol. 53. Citeseer, 6–8.
- Makridis et al. (2023) Georgios Makridis, Georgios Fatouros, Athanasios Kiourtis, Dimitrios Kotios, Vasileios Koukos, Dimosthenis Kyriazis, and Jonh Soldatos. 2023. Towards a unified multidimensional explainability metric: Evaluating trustworthiness in ai models. In 2023 19th International Conference on Distributed Computing in Smart Systems and the Internet of Things (DCOSS-IoT). IEEE, 504–511.
- Mardia (1970) Kanti V Mardia. 1970. Measures of multivariate skewness and kurtosis with applications. Biometrika 57, 3 (1970), 519–530.
- McKinsey (2024) McKinsey. 2024. the state of AI in early 2024: genAI adoption spikes and starts to generate value.
- McKnight et al. (2002) D Harrison McKnight, Vivek Choudhury, and Charles Kacmar. 2002. Developing and validating trust measures for e-commerce: An integrative typology. Information systems research 13, 3 (2002), 334–359.
- Merritt (2011) Stephanie M Merritt. 2011. Affective processes in human–automation interactions. Human Factors 53, 4 (2011), 356–370.
- Microsoft (2024) Microsoft. 2024. Copilot. https://copilot.microsoft.com.
- Murphy-Hill et al. (2024) Emerson Murphy-Hill, Alberto Elizondo, Ambar Murillo, Marian Harbach, Bogdan Vasilescu, Delphine Carlson, and Florian Dessloch. 2024. GenderMag Improves Discoverability in the Field, Especially for Women. In 2024 IEEE/ACM 46th International Conference on Software Engineering (ICSE). IEEE Computer Society, 2333–2344.
- Omrani et al. (2022) Nessrine Omrani, Giorgia Rivieccio, Ugo Fiore, Francesco Schiavone, and Sergio Garcia Agreda. 2022. To trust or not to trust? An assessment of trust in AI-based systems: Concerns, ethics and contexts. Technological Forecasting and Social Change 181 (2022), 121763.
- OpenAI (2024) OpenAI. 2024. GPT-4. https://openai.com/product/gpt-4.
- O’Brien (2010) Heather Lynn O’Brien. 2010. The influence of hedonic and utilitarian motivations on user engagement: The case of online shopping experiences. Interacting with computers 22, 5 (2010), 344–352.
- Pearce et al. (2022) Hammond Pearce, Baleegh Ahmad, Benjamin Tan, Brendan Dolan-Gavitt, and Ramesh Karri. 2022. Asleep at the keyboard? assessing the security of GitHub copilot’s code contributions. In 2022 IEEE Symposium on Security and Privacy (SP). IEEE, 754–768.
- Peng et al. (2023) Sida Peng, Eirini Kalliamvakou, Peter Cihon, and Mert Demirer. 2023. The impact of AI on developer productivity: Evidence from GitHub copilot. arXiv preprint arXiv:2302.06590 (2023).
- Perrig et al. (2023) Sebastian AC Perrig, Nicolas Scharowski, and Florian Brühlmann. 2023. Trust issues with trust scales: examining the psychometric quality of trust measures in the context of AI. In Extended abstracts of the 2023 CHI Conference on human factors in computing systems. 1–7.
- Podsakoff et al. (2003) Philip M Podsakoff, Scott B MacKenzie, Jeong-Yeon Lee, and Nathan P Podsakoff. 2003. Common method biases in behavioral research: a critical review of the literature and recommended remedies. Journal of applied psychology 88, 5 (2003), 879.
- Raykov and Marcoulides (2011) Tenko Raykov and George A Marcoulides. 2011. Introduction to psychometric theory. Routledge.
- Russo (2024) Daniel Russo. 2024. Navigating the complexity of generative AI adoption in software engineering. ACM Transactions on Software Engineering and Methodology (2024).
- Russo and Stol (2021) Daniel Russo and Klaas-Jan Stol. 2021. PLS-SEM for Software Engineering Research: An Introduction and Survey. ACM Comput Surv 54, 4 (2021).
- Sarstedt and Cheah (2019) Marko Sarstedt and Jun-Hwa Cheah. 2019. Partial least squares structural equation modeling using SmartPLS: a software review.
- Sarstedt et al. (2017) Marko Sarstedt, Christian M Ringle, and Joseph F Hair. 2017. Treating unobserved heterogeneity in PLS-SEM: A multi-method approach. In Partial least squares path modeling. Springer, 197–217.
- Scharowski et al. (2024) Nicolas Scharowski, Sebastian AC Perrig, Lena Fanya Aeschbach, Nick von Felten, Klaus Opwis, Philipp Wintersberger, and Florian Brühlmann. 2024. To Trust or Distrust Trust Measures: Validating Questionnaires for Trust in AI. arXiv preprint arXiv:2403.00582 (2024).
- Schumacker and Lomax (2004) Randall E Schumacker and Richard G Lomax. 2004. A beginner’s guide to structural equation modeling. psychology press.
- Sellen and Horvitz (2023) Abigail Sellen and Eric Horvitz. 2023. The rise of the AI Co-Pilot: Lessons for design from aviation and beyond. Commun. ACM (2023).
- Sheth et al. (1991) Jagdish N Sheth, Bruce I Newman, and Barbara L Gross. 1991. Why we buy what we buy: A theory of consumption values. Journal of business research 22, 2 (1991), 159–170.
- Shmueli et al. (2016) Galit Shmueli, Soumya Ray, Juan Manuel Velasquez Estrada, and Suneel Babu Chatla. 2016. The elephant in the room: Predictive performance of PLS models. Journal of business Research 69, 10 (2016), 4552–4564.
- Shull et al. (2007) Forrest Shull, Janice Singer, and Dag IK Sjøberg. 2007. Guide to Advanced Empirical Software Engineering.
- SmartPLS Team (2024) SmartPLS Team. 2024. SmartPLS (Version 4.1.0) [Computer software]. https://smartpls.com/ Accessed: 2024-07-07.
- Sternberg and Grigorenko (1997) Robert J Sternberg and Elena L Grigorenko. 1997. Are cognitive styles still in style? American psychologist 52, 7 (1997), 700.
- Stol and Fitzgerald (2018) Klaas-Jan Stol and Brian Fitzgerald. 2018. The ABC of software engineering research. ACM TOSEM 27, 3 (2018).
- Stone (1974) Mervyn Stone. 1974. Cross-validatory choice and assessment of statistical predictions. J R Stat Soc Series B Stat Methodol 36 (1974).
- Tankelevitch et al. (2024) Lev Tankelevitch, Viktor Kewenig, Auste Simkute, Ava Elizabeth Scott, Advait Sarkar, Abigail Sellen, and Sean Rintel. 2024. The metacognitive demands and opportunities of generative AI. In CHI Conference on Human Factors in Computing Systems. 1–24.
- Trinkenreich et al. (2023) Bianca Trinkenreich, Klaas-Jan Stol, Anita Sarma, Daniel M German, Marco A Gerosa, and Igor Steinmacher. 2023. Do i belong? modeling sense of virtual community among linux kernel contributors. In 2023 IEEE/ACM 45th International Conference on Software Engineering (ICSE). IEEE, 319–331.
- Unsworth et al. (2012) Nash Unsworth, Thomas S Redick, Gregory J Spillers, and Gene A Brewer. 2012. Variation in working memory capacity and cognitive control: Goal maintenance and microadjustments of control. Quarterly Journal of Experimental Psychology 65, 2 (2012), 326–355.
- van der Werff et al. (2019) Lisa van der Werff, Alison Legood, Finian Buckley, Antoinette Weibel, and David de Cremer. 2019. Trust motivation: The self-regulatory processes underlying trust decisions. Organizational Psychology Review 9, 2-3 (2019), 99–123.
- Venkatesh and Davis (2000) Viswanath Venkatesh and Fred D Davis. 2000. A theoretical extension of the technology acceptance model: Four longitudinal field studies. Management science 46, 2 (2000), 186–204.
- Venkatesh et al. (2003) Viswanath Venkatesh, Michael G Morris, Gordon B Davis, and Fred D Davis. 2003. User acceptance of information technology: Toward a unified view. MIS quarterly (2003), 425–478.
- Venkatesh et al. (2012) Viswanath Venkatesh, James YL Thong, and Xin Xu. 2012. Consumer acceptance and use of information technology: extending the unified theory of acceptance and use of technology. MIS quarterly (2012), 157–178.
- Vereschak et al. (2021) Oleksandra Vereschak, Gilles Bailly, and Baptiste Caramiaux. 2021. How to evaluate trust in AI-assisted decision making? A survey of empirical methodologies. Human-Computer Interaction 5, CSCW2 (2021), 1–39.
- Wang et al. (2023) Ruotong Wang, Ruijia Cheng, Denae Ford, and Thomas Zimmermann. 2023. Investigating and designing for trust in AI-powered code generation tools. arXiv preprint arXiv:2305.11248 (2023).
- Weisz et al. (2023) Justin D Weisz, Michael Muller, Jessica He, and Stephanie Houde. 2023. Toward general design principles for generative AI applications. arXiv preprint arXiv:2301.05578 (2023).
- Weisz et al. (2022) Justin D Weisz, Michael Muller, Steven I Ross, Fernando Martinez, Stephanie Houde, Mayank Agarwal, Kartik Talamadupula, and John T Richards. 2022. Better together? an evaluation of AI-supported code translation. In 27th International conference on intelligent user interfaces. 369–391.
- Wischnewski et al. (2023) Magdalena Wischnewski, Nicole Krämer, and Emmanuel Müller. 2023. Measuring and understanding trust calibrations for automated systems: a survey of the state-of-the-art and future directions. In Proceedings of the 2023 CHI Conference on Human Factors in Computing Systems. 1–16.
- Witschey et al. (2015) Jim Witschey, Olga Zielinska, Allaire Welk, Emerson Murphy-Hill, Chris Mayhorn, and Thomas Zimmermann. 2015. Quantifying developers’ adoption of security tools. In 10th Joint Meeting on Foundations of Software Engineering. 260–271.
- Xiao et al. (2014) Shundan Xiao, Jim Witschey, and Emerson Murphy-Hill. 2014. Social influences on secure development tool adoption: why security tools spread. In 17th ACM conference on Computer supported cooperative work & social computing. 1095–1106.
- Yu et al. (2019) Kun Yu, Shlomo Berkovsky, Ronnie Taib, Jianlong Zhou, and Fang Chen. 2019. Do i trust my machine teammate? an investigation from perception to decision. In Proceedings of the 24th International Conference on Intelligent User Interfaces. 460–468.
- Ziegler et al. (2024) Albert Ziegler, Eirini Kalliamvakou, X Alice Li, Andrew Rice, Devon Rifkin, Shawn Simister, Ganesh Sittampalam, and Edward Aftandilian. 2024. Measuring GitHub Copilot’s Impact on Productivity. Commun. ACM (2024).