Signatures of high-redshift galactic outflows in the thermal Sunyaev Zel’dovich effect
Abstract
Anisotropies of the Sunyaev Zel’dovich (SZ) effect serve as a powerful probe of the thermal history of the universe. At high redshift, hot galactic outflows driven by supernovae (SNe) can inject a significant amount of thermal energy into the intergalactic medium, causing a strong -type distortion of the CMB spectrum through inverse Compton scattering. The resulting anisotropies of the -type distortion are sensitive to key physical properties of high- galaxies pertaining to the launch of energetic SNe-driven outflows, such as the efficiency and the spatio-temporal clustering of star formation. We develop a simple analytic framework to calculate anisotropies of -type distortion associated with SNe-powered outflows of galaxies at . We show that galactic outflows are likely the dominant source of thermal energy injection, compared to contributions from reionized bubbles and gravitational heating. We further show that next-generation CMB experiments such as LiteBIRD can detect the contribution to anisotropies from high- galactic outflows through the cross-correlation with surveys of Lyman-break galaxies by e.g. the Roman Space Telescope. Our analysis and forecasts demonstrate that thermal SZ anisotropies are a promising probe of SNe feedback in early star-forming galaxies.
keywords:
galaxy: formation – galaxies: ISM – cosmology: large-scale structure of Universe – cosmology: theory1 Introduction
The James Webb Space Telescope (JWST) has made unprecedented observations of high-redshift galaxies across different environments and mass regimes, leading to notable discoveries regarding galaxy formation in the first billion years of cosmic time (Robertson, 2022; Adamo et al., 2024). One of the most intriguing findings about galaxy populations at is the prevalence of spatio-temporal clustering of star formation, namely the formation of stars in spatially clustered clumps (e.g. Fujimoto et al., 2024; Mowla et al., 2024) and with a temporally stochastic (or ‘bursty’) star formation history (e.g. Ciesla et al., 2024; Dressler et al., 2024; Endsley et al., 2024). Interestingly, high-resolution cosmological simulations of galaxy formation suggest a similar picture that early galaxies are characterized by spatially and temporally clustered star formation (e.g. Ma et al., 2018; Sun et al., 2023a, b; Bhagwat et al., 2024).
Stellar feedback from supernovae (SNe) is considered as a main physical driver of the spatio-temporal clustering of star formation in galaxies (Hopkins et al., 2023; Hu et al., 2023). Besides regulating star formation, SNe feedback also drives multi-phase outflows with particularly strong rates at high redshift where galaxies are more gas rich and less massive (Hayward & Hopkins, 2017; Furlanetto, 2021). An essential part of the cosmic baryon cycle, galactic outflows inform the efficiency at which SNe feedback regulates stellar and gas mass buildup in galaxies while depositing energy and metal-enriched gas into the intergalactic medium (IGM). A complete picture of high- galaxy formation thus requires understanding galactic outflows.
The cosmic microwave background (CMB) is a powerful and versatile tool to probe the collective effects of early galaxy populations in a highly complementary way to galaxy observations. Its polarization provides an integral constraint on the history of cosmic reionization driven by the UV radiation from galaxies (Miranda et al., 2017; Pagano et al., 2020). High- galaxies and reionization also leave measurable imprints on the CMB spectrum through the Sunyaev-Zel’dovich (SZ) effect (Sunyaev & Zeldovich, 1980) associated with the inverse Compton scattering of CMB photons on free electrons. The bulk motion of electrons created during and after patchy reionization causes the kinetic SZ (kSZ) effect, a Doppler shift whose spatial fluctuations constrain the reionization timeline and morphology (Battaglia et al., 2013; Gorce et al., 2020; Chen et al., 2023; Jain et al., 2024). The thermal motion of electrons, on the other hand, causes the thermal SZ (tSZ) effect characterized by the Compton parameter. This -type distortion of the CMB spectrum is a promising probe of the thermal energy of gas surrounding early galaxies due to both reionization and winds launched by SNe (Oh et al., 2003; Baxter et al., 2021; Namikawa et al., 2021; Yamaguchi et al., 2023).
In this Letter, motivated by the recent progress in understanding high- galaxies and the planned next-generation CMB experiments like LiteBIRD (LiteBIRD Collaboration et al., 2023), we analytically estimate the -type distortion and its spatial fluctuations (i.e. anisotropies) induced by the thermal energy injection from high- galaxies especially their SNe-driven winds. We then compare the derived anisotropies with the expected CMB measurement uncertainties and its potential synergy with galaxy surveys to estimate the constraining power on . Throughout, we assume a Chabrier initial mass function (IMF; Chabrier, 2003) and a flat, CDM cosmology consistent with measurements by Planck Collaboration et al. (2016).
2 Models
2.1 Cooling of SNe-powered galactic outflows
Recent observations and simulations have suggested that star formation might be highly clumpy and bursty in high- galaxies. Therefore, rather than considering supernova explosions randomly distributed in the ISM, we consider the possibility that clustered SNe can drive superbubbles by launching more powerful galactic winds into the IGM Fielding et al. (2017, 2018). The breakout of superbubbles driven by clustered SNe minimizes radiative losses in the interstellar medium (ISM), thus depositing a substantially higher fraction of SNe energy into the IGM, which is then transferred to the CMB. For a galaxy of halo mass , we can approximate SNe as simultaneous events with a total energy released of erg, where is the time-integrated star formation efficiency (SFE) that should be distinguished from the instantaneous SFE and the baryon mass fraction . In this work, we adopt , as permitted by models that can plausibly explain the galaxy populations at observed by JWST (Furlanetto & Mirocha, 2022; Dekel et al., 2023). We also assume here that on average one SN (releasing erg of energy in total) explodes for every of stars formed (Cen, 2020), or an energy output per unit mass of star formation erg.
To estimate the fractions of kinetic energy released by supernova explosions lost through radiative and inverse Compton processes, we follow Oh et al. (2003) and compare the timescales of isobaric radiative cooling, , to the ambient ISM/IGM gas, and of inverse Compton cooling, , to CMB photons in the IGM. The fraction of explosion energy deposited in the IGM which thus modifies the CMB spectrum can be approximated as
| (1) |
with
| (2) |
where is the Thomson scattering cross section for electrons and , and
| (3) |
where is the cooling function at the postshock temperature and is the number density of the ambient gas. Within the inhomogeneous ISM, the cooling due to radiative losses can be expressed as (Martizzi et al., 2015; Fielding et al., 2018)
| (4) |
which is a few orders of magnitude shorter than even if large density fluctuations exist in the turbulent ISM.
However, considering the expansion and the eventual breakout (from the galactic disc) of winds powered by clustered SNe, Fielding et al. (2018) suggest that SNe exploded in massive star clusters efficiently overlap in space and time to collectively power superbubbles. The cooling time for radiative losses is significantly longer than the expansion time of bubbles out to scales of 100 pc if the mixing of SNe ejecta and the ambient ISM remains inefficient
| (5) |
Thus, radiative cooling can be very modest throughout the bubble expansion within galaxies even if the gas is as dense as , a typical threshold for star formation. Although models of disc galaxy evolution may not be entirely valid at , of order 100 pc is still a relevant scale for the breakout of SNe-powered superbubbles into ambient gas with significantly lower densities, given the typical sizes of high- galaxies (Morishita et al., 2024) and spatially-resolved star-forming clumps (Fujimoto et al., 2024) observed by the JWST. In low-mass galaxies, SNe feedback may be strong enough to rapidly blow out the dense gas entirely, making radiative losses even less of an effect.
Provided that radiative losses are small before breakout, we can estimate the postshock temperature after breakout from the Sedov-Taylor solution assuming a strong shock, namely , where for ionized gas with primordial abundances and the speed at which the shock wave of radius propagates is with . The radius of the SN-driven bubble during the adiabatic Sedov-Taylor phase is . Evaluating at and comparing the resulting with , we have
| (6) |
which is broadly consistent with the physical picture that warm-/hot-phase (K) outflows dominate the energy loading of SNe-driven winds suggested by simulations (Pandya et al., 2021). Combining with the assumption that after breakout the post-shock density is related to the mean IGM density by , we get (Oh et al., 2003)
| (7) |
which suggests a typical wind-powering energy fraction of , in line with the time-averaged energy loading factor in hydrodynamical simulations resolving the spatio-temporal clustering of SNe (Fielding et al., 2018) and the often made assumption in semi-analytic models of high- galaxy formation (Furlanetto et al., 2017). Note the weak halo mass dependence (assuming a constant , though see Section 4) but strong redshift dependence of . In what follows, we adopt a constant for simple estimates of the -type distortion associated with galactic outflows at .
2.2 CMB spectral distortions induced by high-redshift galaxies
The Compton- parameter that characterizes the tSZ effect directly probes the line-of-sight integral of the (proper) electron gas pressure, , namely
| (8) |
where is the electron mass and is the comoving radial distance.
In addition to distortions in the sky-averaged CMB spectrum, equation (8) also implies a large-scale clustering signal of -type distortion anisotropies that scales as . It is therefore instructive to compare thermal energy contributions to from different sources, including SNe-powered galactic winds, reionized bubbles, and gravitational heating. Considering the halo model (Cooray & Sheth, 2002), we can sum up the thermal energy contributed from individual haloes to obtain the average bias-weighted (proper) electron pressure (Vikram et al., 2017)
| (9) |
where is the halo mass function and is the halo bias.
Assuming clustered SNe, we can approximate the thermal energy injected by the SNe into their host galaxy/halo as
| (10) |
where erg and as has been discussed in Section 2.1. For our fiducial model, we take a duty cycle of such that all haloes have active SNe-driven outflows (see Section 4 for discussion of alternative assumptions). For an order-of-magnitude estimate of the -type distortion induced by hot galactic winds, we can simply assume that all the SN energy is injected and lost to the CMB (with a fraction ) instantaneously at redshift . The amount of thermal energy added to the CMB per baryon in the universe is then (Oh et al., 2003)
| (11) |
where is the collapse fraction of dark matter haloes. This implies a parameter proportional to (Oh et al., 2003)
| (12) |
which is approximately at . A more accurate determination of requires tracing the thermal history of the CMB, which in terms of the total CMB energy density is given by (Yamaguchi et al., 2023)
| (13) |
where and
| (14) |
The thermal energy of reionized bubbles can be estimated by
| (15) |
where , with and , and is the typical energy of the reionized medium photo-heated to roughly K. With canceled out, the ratio thus scales as . Note that equation (15) assumes that the ionized bubble is created for the first time, ignoring previous photoheating. Thus, by , it in fact serves as an upper limit on the thermal energy due to reionization. Finally, for isothermal gas shocked-heated to the virial temperature by gravity, we have
| (16) |
2.3 Auto-/cross-correlations of -type distortion anisotropies
The -type spectral distortion power spectrum from the tSZ effect associated with high- galaxies can be written in the large-scale, two-halo limit111We note that a non-negligible one-halo term may arise from extended/overlapping outflows and ionized bubbles. However, since observational constraints considered here are most sensitive to (equivalent to physical scales Mpc at ), we ignore its contribution in our analysis. as
| (17) |
which is approximately proportional to as is evident from equations (8) and (9).
The cross-correlation of -type distortion anisotropies with galaxy surveys provides an alternative and likely more reliable way to constrain the energy of SNe-powered high- galactic winds, given the significant low- contributions in measurements that are challenging to remove. The –galaxy cross-correlation is advantageous because low- contributions to only add to the variance but do not bias the measurement. On large scales, the cross-power spectrum is
| (18) |
where the window function and the top-hat galaxy window function is over and zero elsewhere.
The uncertainties of the auto- and cross-power spectra can be expressed as (Baxter et al., 2021)
| (19) |
and
| (20) |
where is the sky covering fraction and is the multipole bin width centered at . The terms , , are the instrument noise power spectrum for the -type distortion, the galaxy angular power spectrum, and the galaxy noise power spectrum (equal to the inverse of galaxy number density), respectively.
3 Results
3.1 Contributions to from different sources of thermal energy
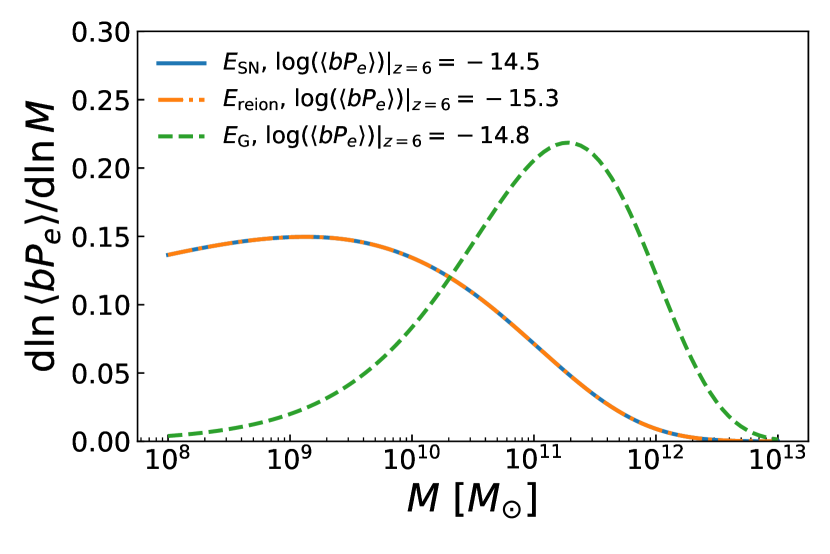
We show in the left panel of Figure 1 the fractional contribution of each source of thermal energy to at for different halo masses. Because of the identical linear dependence on , the SNe and reionization components have the same larger contributions from low-mass haloes with , whereas haloes with contribute most to the gravitational heating component due to its stronger dependence.
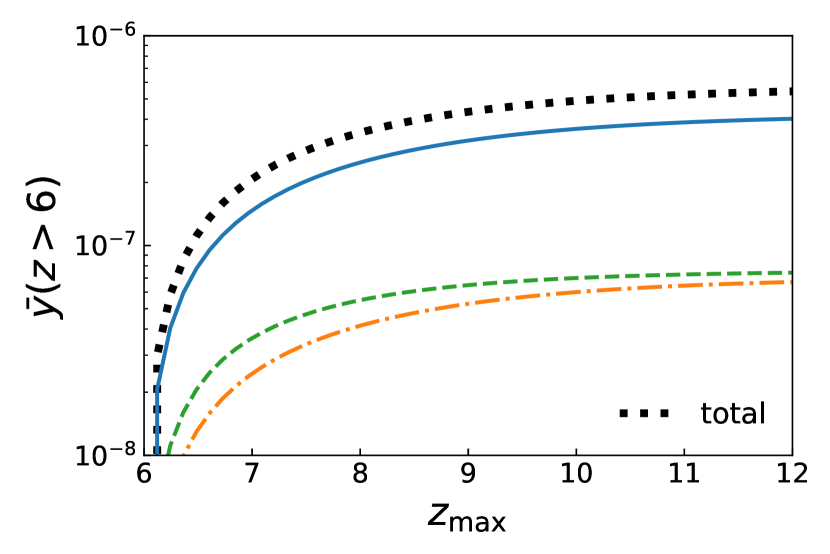
The right panel of Figure 1 shows the level of signal contributed by haloes at different redshifts, as predicted by our fiducial model. For gravitational heating, the large contribution from less abundant massive haloes makes it subdominant to the other two components. Given our fiducial parameters, we expect from galaxies above and with a significant () contribution from SNe-driven galactic outflows. This predicted value is consistent with the observational constraints available from COBE FIRAS (; Fixsen et al., 1996) and a joint analysis of Planck and SPT data (; Khatri & Sunyaev, 2015). As will be shown below, the LiteBIRD satellite to be launched in 2032 is expected to substantially increase the detectability of from large-scale tSZ anisotropies (Miyamoto et al., 2014; Remazeilles et al., 2024) and place useful constraints on its high- contribution.
3.2 Anisotropies of the -type distortion from high- galaxies
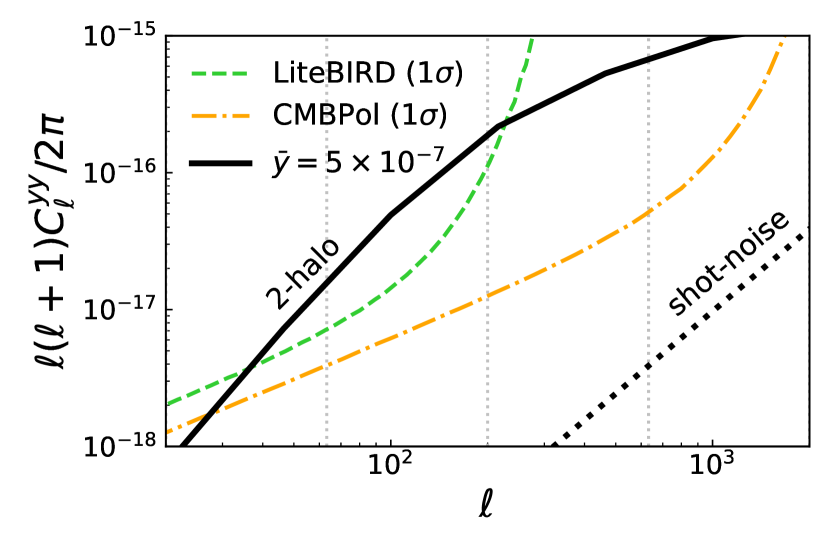
With the estimated associated with high- galaxies in hand, we can calculate the anisotropy signals and compare them against the sensitivity level of CMB observations as described in Section 2.3. In Figure 2, we show the large-scale angular power spectrum of the -type distortion derived from our fiducial model for galaxies at . For completeness, we also illustrate the level of shot noise arising from the self-correlation of individual sources, which is much smaller than the clustering signal on the scales of interest. In contrast with previous studies, our predicted and are slightly below even the most pessimistic model of Oh et al. (2003) in which a higher is assumed. Our predicted , however, is significantly larger than those (–) from Hill et al. (2015) and Yamaguchi et al. (2023) as a combined result of the larger and in our fiducial model. As elaborated in Section 2.1, these values are motivated by our current understanding of galaxy populations at although some caveats apply (see Section 4).
The predicted is compared against the sensitivity curves of two example CMB experiments: LiteBIRD and CMBPol, which is a hypothesized, future-generation CMB satellite with better angular resolution than LiteBIRD. Following Miyamoto et al. (2014), we take the instrument noise power of LiteBIRD and CMBPol to be and , respectively. On degree scales (), sourced by high- galaxies lies above the 1- uncertainty level of LiteBIRD. Considering and an close to unity, we can use equation (19) to estimate the signal-to-noise ratio (S/N) of the pure signal to be about 3.
However, in reality, it would be extremely challenging to separate or remove the low- contribution to (by methods like masking, see e.g. Baxter et al. 2021), whose residuals can easily overwhelm the high- signal of interest (Oh et al., 2003). Therefore, it is instructive to consider the –galaxy cross-correlation that allows a cleaner and unbiased measurement of truly associated with high- galaxies (Baxter et al., 2021).
3.3 Detectability of the –galaxy cross-correlation
The full-sky survey strategy of LiteBIRD makes it convenient to cross-correlate with other cosmological data sets, as discussed in several previous studies (Namikawa & Sherwin, 2023; Lonappan et al., 2024). To assess whether -type distortion anisotropies of high- origin can be detected when residual low- contributions are present, we consider a case study for a joint analysis between LiteBIRD and the High Latitude Wide Area Survey (HLWAS) of the Nancy Grace Roman Space Telescope. Assuming corresponding to the planned 2200 deg2 coverage of HLWAS and a 5-sigma depth of , we adopt the galaxy number density and bias estimated for HLWAS by La Plante et al. (2023) to evaluate , , and in the redshift range of interest.
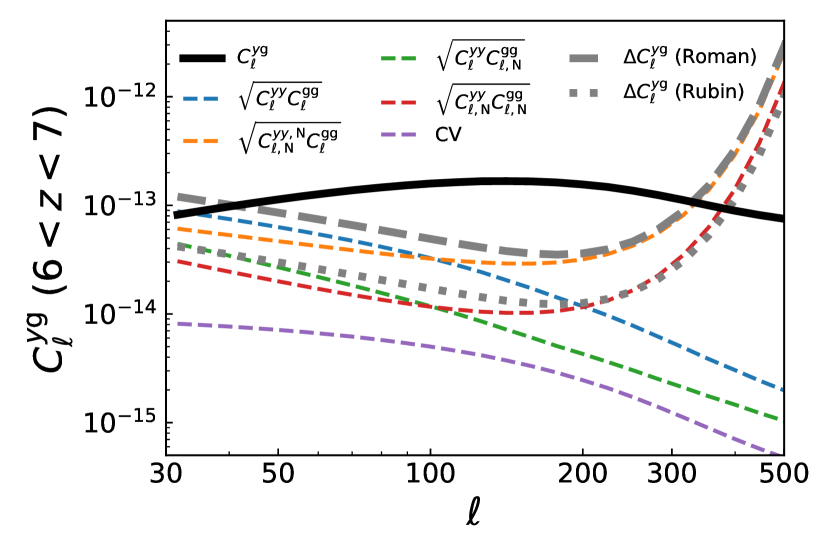
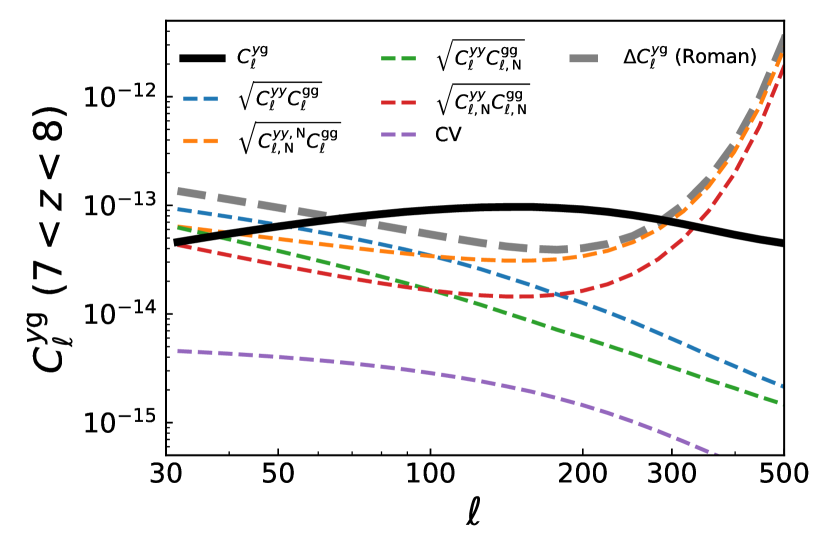
Figure 3 shows the cross-power spectrum between the -type distortion to be measured by LiteBIRD and Lyman-break galaxies (LBGs) to be observed by the Roman HLWAS survey, together with a decomposition of the uncertainty as given by equation (20). Note that here we have included a low- contribution (after a reasonable level of masking) to the auto-power term using the estimate in Baxter et al. (2021), which is roughly two orders of magnitude stronger than the high- contribution in our fiducial model. We have also assumed that the distinctive y-distortion spectral signature allows perfect component separation. That is, we assume negligible residual foreground contamination in the multi-frequency LiteBIRD data from cosmic infrared background fluctuations and other components (Remazeilles et al., 2024).
The comparison suggests that even with the inclusion of a strong residual low- contribution to , thanks to the wide overlapping area and the large number of galaxies available the –galaxy cross-correlation is likely detectable on scales . More specifically, summing over the bins (with ) over , we estimate the total S/N of to be about 4.6 and 2.5 for and , respectively. This implies that the cross-correlation measurement can place useful constraints on the -type distortion induced by high- galaxies, in particular the thermal energy content of their SNe-driven outflows.
In addition to Roman, we show at the expected improvement in the detectability of from accessing a larger by cross-correlating LiteBIRD with LBGs from the Rubin Observatory Legacy Survey of Space and Time (LSST; Ivezić et al. 2019). Assuming Rubin/LSST LBG samples at the same depth as Roman but with , we expect a roughly threefold increase in sensitivity. This adds to both the range probed and the constraining power for a wider range of parameter combinations, especially less optimistic ones. For example, models where the product is 2–3 times lower than the fiducial value taken () can still be significantly constrained up to by the cross-correlation between LiteBIRD and Rubin/LSST.
4 Discussion
It is worth noting that the roughly comparable thermal energy contributions from SNe-driven winds and reionized bubbles we find should be contrasted with previous simulation-based analyses such as Baxter et al. (2021) with caution for two main reasons. First, the simulations do not distinguish thermal energies attributed to galactic winds and the ionized bubble created by the galaxy, but rather focus on the total thermal energy content. Second, the weak dependence of signal on the prescription of stellar feedback reported in Baxter et al. (2021), which might be interpreted as evidence for a subdominant role of SNe-driven winds, can be (at least) partially due to the limited resolution of the simulations to properly resolve the spatio-temporal clustering of SNe. As discussed in Section 2.1, superbubbles driven by clustered SNe can be the main reason for a significant fraction of SNe energy to be vented into the galactic halo and thus contribute to the -type distortion. This explains the overall larger anisotropies predicted by our analytic calculations.
Several aspects of our simple model should be further investigated in the future for better understanding the -type distortion signal associated with high- galaxies. First, the amplitude and relative importance of each form of thermal energy shown in Figure 1 can vary if alternative values or the evolution of quantities like and are considered. While the values assumed ( and ) for our main results are physically motivated, more sophisticated treatments considering e.g. the halo mass dependence of these parameters (Khaire et al., 2016; Sun & Furlanetto, 2016; Li et al., 2023; Mutch et al., 2024; Sipple & Lidz, 2024) can lead to weaker signals that are more challenging to detect. Moreover, not all haloes have active SNe-driven outflows, though we note the significant longer timescale for inverse Compton cooling ( Myr) compared to that for burst cycles of star formation ( Myr) in high- galaxies (Furlanetto & Mirocha, 2022), which makes likely still a valid assumption. Furthermore, at high redshift, the presence of a more top-heavy stellar IMF and/or massive Population III stars may increase the average energy released per supernova by a factor of 2–3 (Woosley & Weaver, 1995) and thereby counteract in part the effects of lower or values. It would be interesting for future work to quantify the impact of these model variations and complexities on and .
Another key simplification made here is the treatment of low- contributions to the -type distortion. Our simplistic model prevents us from physically describing the thermal energy deposited by low- haloes, especially the massive ones hosting resolved or unresolved galaxy clusters which are responsible for the majority of the observable tSZ signal. It is possible that the simulation-based predictions we adopt from Baxter et al. (2021) do not accurately capture the true level of low- signals or the effectiveness of source masking. Building data-driven models across redshift in future work will therefore be extremely helpful. The –galaxy cross-correlation described in Section 3.3 may be attempted at lower redshift with existing data (e.g. Planck/ACT and DESI) for such purposes.
Finally, many physical factors not considered in our analysis actually affect the expected -type distortion signals and lead to measurable signals of interest. For example, with sufficiently high angular resolution, distinctions in the scale/redshift dependence of different sources of thermal energy (e.g. galactic outflows versus reionized bubbles) may be utilized for component separation on intermediate scales where non-linear clustering dominates. This is helpful for isolating and exclusively constraining SNe feedback and galactic outflows with . It is thus instructive to extend the current modeling framework and self-consistently predict the size evolution of ionized bubbles during reionization in future studies. Alternatively, one may also stack on galaxies of different types, e.g. starburst versus quiescent galaxies, to narrow down the strength of outflow signals.
5 Conclusions
In summary, we have presented in this Letter a physically motivated model that allows us to calculate and analyze the -type distortion of the CMB spectrum and its anisotropies induced by high- galaxies, especially their SNe-driven outflows. Motivated by recent discoveries of how clustered SNe feedback may boost the fraction of SNe energy injected in the IGM by powering superbubbles, our model predicts a relatively large associated with high- galaxies, primarily powered by the thermal energy of galactic outflows rather than reionized bubbles or gravitational heating. While still in good agreement with observational constraints (), this higher level of implies large-scale anisotropies of stronger than many previous models predict. We have demonstrated that, in cross-correlation with forthcoming wide-area surveys of LBGs such as Roman/HLWAS and Rubin/LSST, the planned LiteBIRD mission can measure anisotropies induced by high- galactic outflows at high statistical significance up to .
Acknowledgements
We thank Greg Bryan, Claude-André Faucher-Giguère, Drummond Fielding, and Natsuko Yamaguchi for helpful discussions. GS was supported by a CIERA Postdoctoral Fellowship. SRF was supported by NASA through award 80NSSC22K0818 and by the National Science Foundation through award AST-2205900. AL acknowledges support from NASA ATP grant 80NSSC20K0497.
Data Availability
The data supporting the plots and analysis in this article are available on reasonable request to the corresponding author.
References
- Adamo et al. (2024) Adamo A., et al., 2024, arXiv e-prints, p. arXiv:2405.21054
- Battaglia et al. (2013) Battaglia N., Natarajan A., Trac H., Cen R., Loeb A., 2013, ApJ, 776, 83
- Baxter et al. (2021) Baxter E. J., Weinberger L., Haehnelt M., Iršič V., Kulkarni G., Pandey S., Roy A., 2021, MNRAS, 501, 6215
- Bhagwat et al. (2024) Bhagwat A., Costa T., Ciardi B., Pakmor R., Garaldi E., 2024, MNRAS, 531, 3406
- Cen (2020) Cen R., 2020, ApJ, 889, L22
- Chabrier (2003) Chabrier G., 2003, PASP, 115, 763
- Chen et al. (2023) Chen N., Trac H., Mukherjee S., Cen R., 2023, ApJ, 943, 138
- Ciesla et al. (2024) Ciesla L., et al., 2024, A&A, 686, A128
- Cooray & Sheth (2002) Cooray A., Sheth R., 2002, Phys. Rep., 372, 1
- Dekel et al. (2023) Dekel A., Sarkar K. C., Birnboim Y., Mandelker N., Li Z., 2023, MNRAS, 523, 3201
- Dressler et al. (2024) Dressler A., et al., 2024, ApJ, 964, 150
- Endsley et al. (2024) Endsley R., et al., 2024, MNRAS, 533, 1111
- Fielding et al. (2017) Fielding D., Quataert E., Martizzi D., Faucher-Giguère C.-A., 2017, MNRAS, 470, L39
- Fielding et al. (2018) Fielding D., Quataert E., Martizzi D., 2018, MNRAS, 481, 3325
- Fixsen et al. (1996) Fixsen D. J., Cheng E. S., Gales J. M., Mather J. C., Shafer R. A., Wright E. L., 1996, ApJ, 473, 576
- Fujimoto et al. (2024) Fujimoto S., et al., 2024, arXiv e-prints, p. arXiv:2402.18543
- Furlanetto (2021) Furlanetto S. R., 2021, MNRAS, 500, 3394
- Furlanetto & Mirocha (2022) Furlanetto S. R., Mirocha J., 2022, MNRAS, 511, 3895
- Furlanetto et al. (2017) Furlanetto S. R., Mirocha J., Mebane R. H., Sun G., 2017, MNRAS, 472, 1576
- Gorce et al. (2020) Gorce A., Ilić S., Douspis M., Aubert D., Langer M., 2020, A&A, 640, A90
- Hayward & Hopkins (2017) Hayward C. C., Hopkins P. F., 2017, MNRAS, 465, 1682
- Hill et al. (2015) Hill J. C., Battaglia N., Chluba J., Ferraro S., Schaan E., Spergel D. N., 2015, Phys. Rev. Lett., 115, 261301
- Hopkins et al. (2023) Hopkins P. F., et al., 2023, MNRAS, 525, 2241
- Hu et al. (2023) Hu C.-Y., et al., 2023, ApJ, 950, 132
- Ivezić et al. (2019) Ivezić Ž., et al., 2019, ApJ, 873, 111
- Jain et al. (2024) Jain D., Choudhury T. R., Raghunathan S., Mukherjee S., 2024, MNRAS, 530, 35
- Khaire et al. (2016) Khaire V., Srianand R., Choudhury T. R., Gaikwad P., 2016, MNRAS, 457, 4051
- Khatri & Sunyaev (2015) Khatri R., Sunyaev R., 2015, J. Cosmology Astropart. Phys., 2015, 013
- La Plante et al. (2023) La Plante P., Mirocha J., Gorce A., Lidz A., Parsons A., 2023, ApJ, 944, 59
- Li et al. (2023) Li Z., Dekel A., Sarkar K. C., Aung H., Giavalisco M., Mandelker N., Tacchella S., 2023, arXiv e-prints, p. arXiv:2311.14662
- LiteBIRD Collaboration et al. (2023) LiteBIRD Collaboration et al., 2023, Progress of Theoretical and Experimental Physics, 2023, 042F01
- Lonappan et al. (2024) Lonappan A. I., et al., 2024, J. Cosmology Astropart. Phys., 2024, 009
- Ma et al. (2018) Ma X., et al., 2018, MNRAS, 477, 219
- Martizzi et al. (2015) Martizzi D., Faucher-Giguère C.-A., Quataert E., 2015, MNRAS, 450, 504
- Miranda et al. (2017) Miranda V., Lidz A., Heinrich C. H., Hu W., 2017, MNRAS, 467, 4050
- Miyamoto et al. (2014) Miyamoto K., Sekiguchi T., Tashiro H., Yokoyama S., 2014, Phys. Rev. D, 89, 063508
- Morishita et al. (2024) Morishita T., et al., 2024, ApJ, 963, 9
- Mowla et al. (2024) Mowla L., et al., 2024, arXiv e-prints, p. arXiv:2402.08696
- Mutch et al. (2024) Mutch S. J., Greig B., Qin Y., Poole G. B., Wyithe J. S. B., 2024, MNRAS, 527, 7924
- Namikawa & Sherwin (2023) Namikawa T., Sherwin B. D., 2023, Phys. Rev. Lett., 131, 131001
- Namikawa et al. (2021) Namikawa T., Roy A., Sherwin B. D., Battaglia N., Spergel D. N., 2021, Phys. Rev. D, 104, 063514
- Oh et al. (2003) Oh S. P., Cooray A., Kamionkowski M., 2003, MNRAS, 342, L20
- Pagano et al. (2020) Pagano L., Delouis J. M., Mottet S., Puget J. L., Vibert L., 2020, A&A, 635, A99
- Pandya et al. (2021) Pandya V., et al., 2021, MNRAS, 508, 2979
- Planck Collaboration et al. (2016) Planck Collaboration et al., 2016, A&A, 594, A13
- Remazeilles et al. (2024) Remazeilles M., et al., 2024, arXiv e-prints, p. arXiv:2407.17555
- Robertson (2022) Robertson B. E., 2022, ARA&A, 60, 121
- Sipple & Lidz (2024) Sipple J., Lidz A., 2024, ApJ, 961, 50
- Sun & Furlanetto (2016) Sun G., Furlanetto S. R., 2016, MNRAS, 460, 417
- Sun et al. (2023a) Sun G., Faucher-Giguère C.-A., Hayward C. C., Shen X., 2023a, MNRAS, 526, 2665
- Sun et al. (2023b) Sun G., Faucher-Giguère C.-A., Hayward C. C., Shen X., Wetzel A., Cochrane R. K., 2023b, ApJ, 955, L35
- Sunyaev & Zeldovich (1980) Sunyaev R. A., Zeldovich I. B., 1980, ARA&A, 18, 537
- Vikram et al. (2017) Vikram V., Lidz A., Jain B., 2017, MNRAS, 467, 2315
- Woosley & Weaver (1995) Woosley S. E., Weaver T. A., 1995, ApJS, 101, 181
- Yamaguchi et al. (2023) Yamaguchi N., Furlanetto S. R., Trapp A. C., 2023, MNRAS, 520, 2922