Predicting Miscibility in Binary Compounds: A Machine Learning and Genetic Algorithm Study
Abstract
The combination of data science and materials informatics has significantly propelled the advancement of multi-component compound synthesis research. This study employs atomic-level data to predict miscibility in binary compounds using machine learning, demonstrating the feasibility of such predictions. We have integrated experimental data from the Materials Project (MP) database and the Inorganic Crystal Structure Database (ICSD), covering 2,346 binary systems. We applied a random forest classification model to train the constructed dataset and analyze the key factors affecting the miscibility of binary systems and their significance while predicting binary systems with high synthetic potential. By employing advanced genetic algorithms on the Co-Eu system, we discovered three novel thermodynamically stable phases, , , and . This research offers valuable theoretical insights to guide experimental synthesis endeavors in binary and complex material systems.
keywords:
American Chemical Society, LaTeXGuangdong Provincial Key Laboratory of Sensing Physics and System Integration Applications, Guangdong University of Technology, Guangzhou 510006, China \alsoaffiliationGuangdong Provincial Key Laboratory of Sensing Physics and System Integration Applications, Guangdong University of Technology, Guangzhou 510006, China 11footnotetext: C.F. and Y.L. contributed equally to this paper \abbreviationsIR,NMR,UV
![[Uncaptioned image]](/html/2409.02633/assets/TOC.png)
1 Introduction
The field of materials science has consistently been a focal point for scientific research and innovation, leading to numerous in-depth and extensive R&D activities. The evolution of materials science research has progressed through four major paradigms: experimental science, theoretical laws, computational modeling, and data-driven approaches (Figure 1) 1, 2. The initial paradigm relied on experimental trial and error, a process characterized by long development cycles, potentially spanning 10-20 years and high experimental costs.
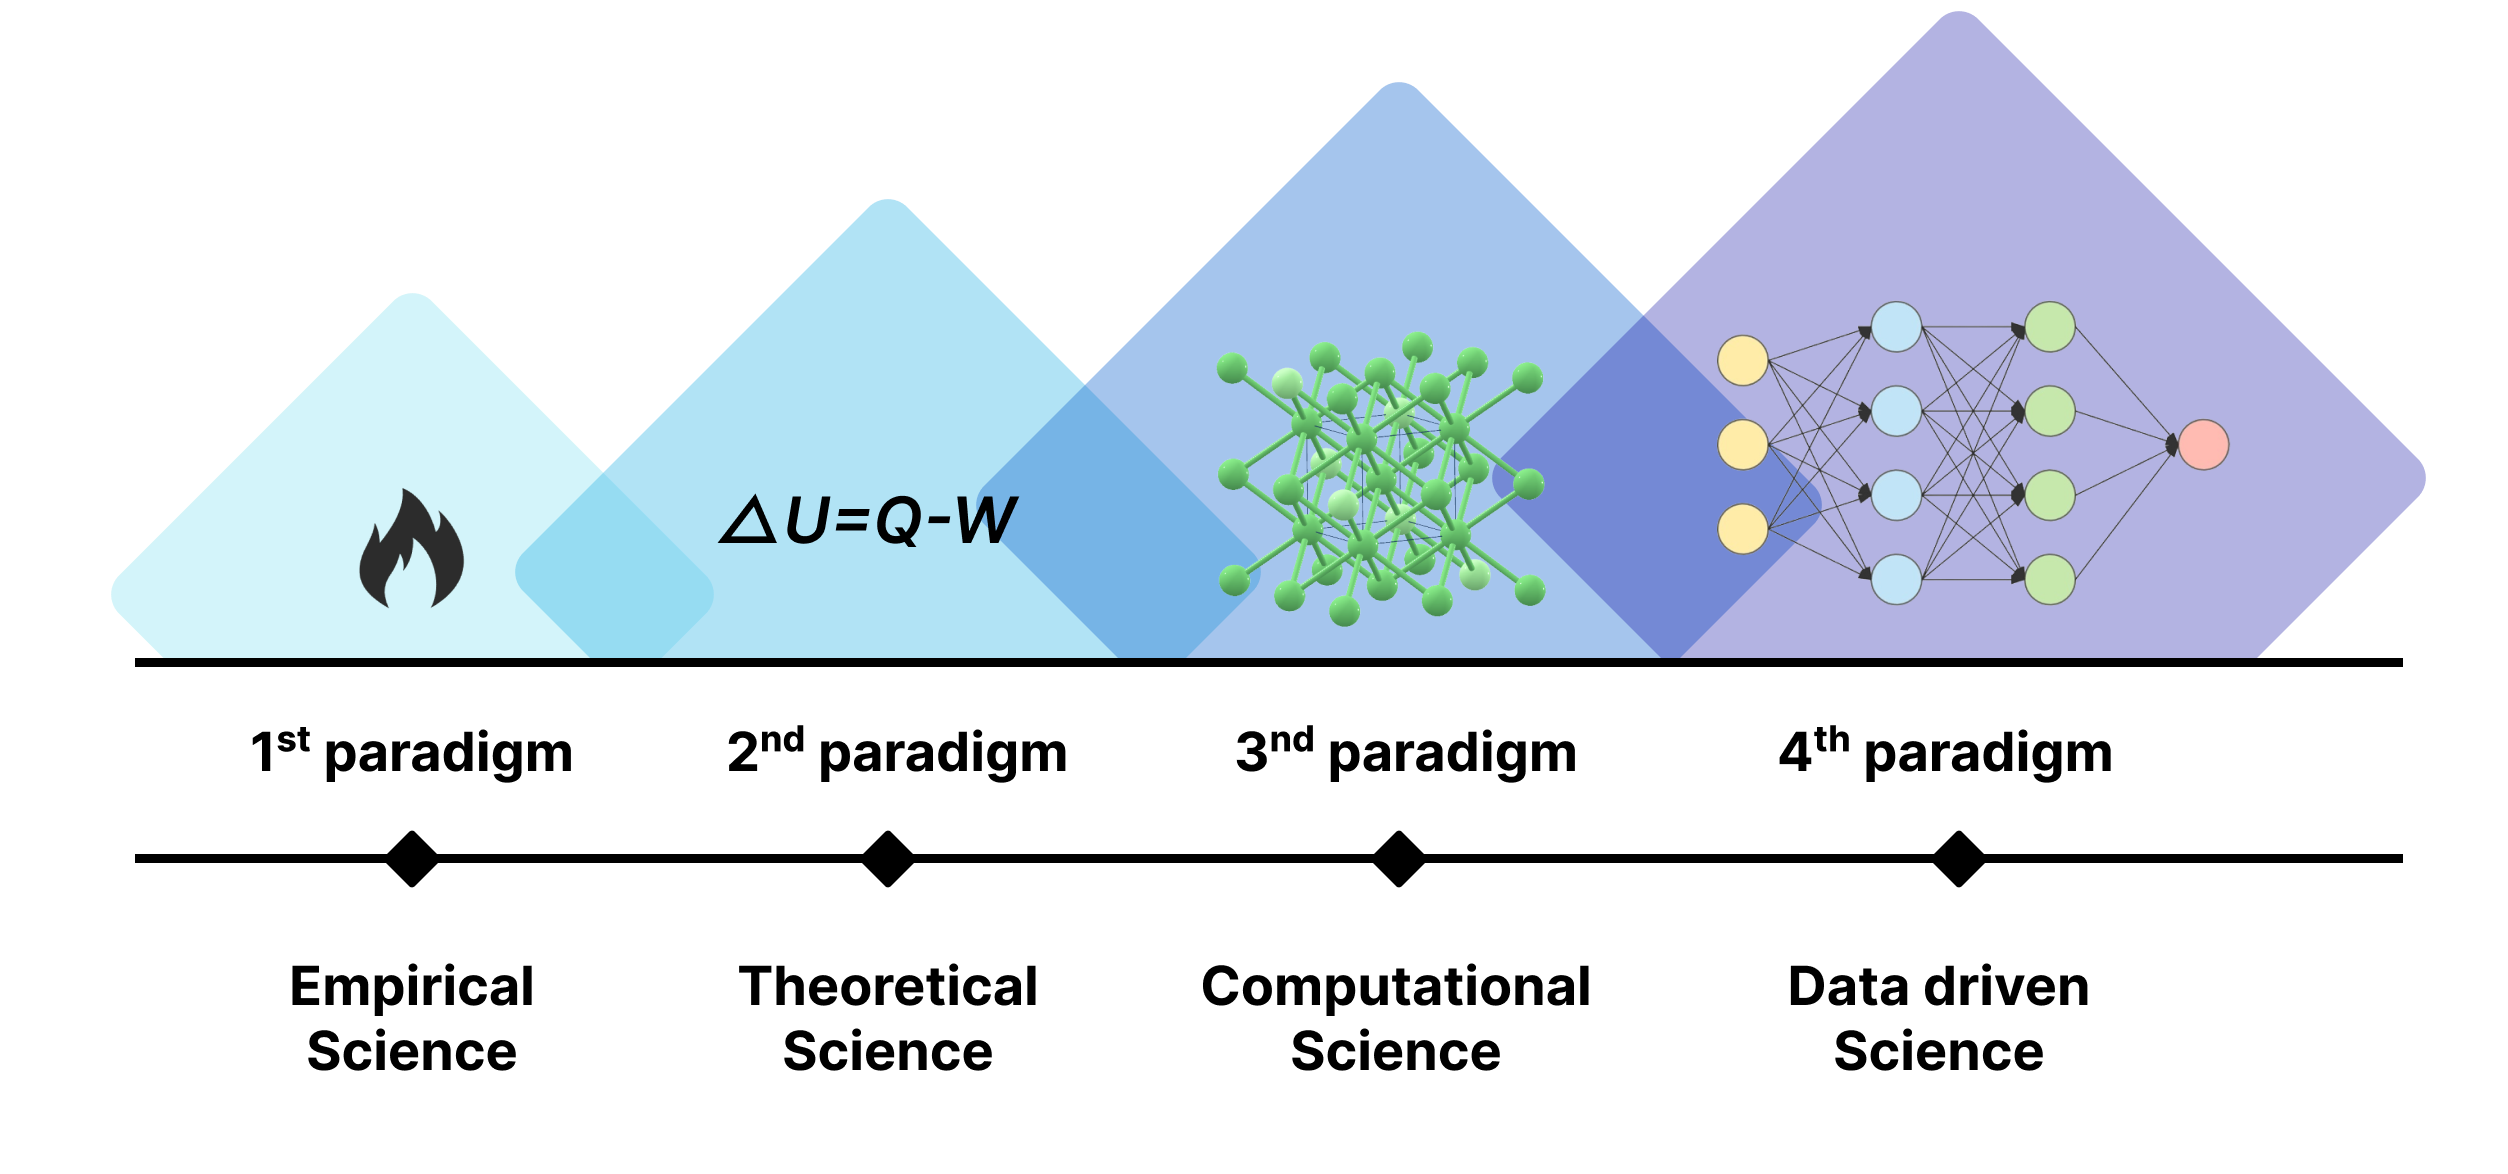
Only a few centuries ago, materials science began to transition from trial-and-error methods to a more systematic and theoretical approach, spurred by the development of physical theoretical models and general laws such as thermodynamic constants. This shift marked a new focus on “material design”. However, as calculations became more complex, theoretical computing in its second paradigm encountered significant bottlenecks in simulating intricate phenomena. It was not until the advancement of computers over the past decade that the third paradigm emerged, facilitating virtual laboratory simulations of real-world phenomena and enabling the “synthesis” of new materials.
First-principles calculations based on Density Functional Theory (DFT) 3, Local Density Approximation (LDA), and Generalized Gradient Approximation (GGA) 4 have been widely used to study the properties of new binary materials 5, 6. Meanwhile, significant advancements in ground-state structure prediction tools have completely transformed the field of materials science, making it possible to predict new material structures before experimental synthesis. For example, methods such as Genetic Algorithms/Evolutionary Algorithms 7, 8, Particle Swarm Optimization 9, 10, Random Sampling 11, 12, Minima Hopping 13, 14, Simulated Annealing 15, Topological Modeling Method 16, and Firefly Algorithm 17, 18 have achieved notable success. Among them, is the Universal Structure Predictor: Evolutionary Xtallography (USPEX), known for its powerful search capabilities and high success rate 19, 20. It performs well in finding low-energy structures of variable composition compounds, especially in the search for binary compounds 21.
However, given the vast unexplored space and the significant computational costs involved, traditional methods of exploration appear impractical. The rapid development of data mining and artificial intelligence technologies has propelled materials science into its fourth paradigm. Machine learning algorithms, known for their robust data processing capabilities and flexibility, can efficiently analyze large datasets without requiring preset hypotheses. Through machine learning, we can perform virtual high-throughput screening of extensive molecular spaces, rapidly identifying structures with potential22, 23, 24. This methodology not only expedites the discovery of novel materials but also significantly reduces both computational and experimental costs 5, 6.
The proposal of the Materials Genome Initiative 25 has significantly promoted the development of big data in materials science 26. A wealth of data has been accumulated through both experimental findings and computational simulations. The ICSD is currently the largest database for experimental identification of inorganic crystal structures, containing data dating back to 1913 and encompassing 291,382 fully evaluated and published crystal structure entries derived primarily from experimental results 27, 28. The MP database includes 154,718 entries, providing researchers with comprehensive DFT data 29, 30. The Open Quantum Materials Database (OQMD) is a high-throughput database that currently features nearly 300,000 compounds’ DFT total energy calculations and common crystal structure information from ICSD 31, 32. These databases lay a solid foundation for the application of machine learning in materials science 22, 33.
Currently, there is no unified theoretical framework or clear concept to describe the key factors that determine whether two different elements can be miscible to form binary compounds. Therefore, we employed the machine learning method (random forest classifier) to train a model on the constructed dataset. The dataset consists of binary system data from experiments in MP database and ICSD, as well as data on immiscible binary systems. This method leverages the powerful features and flexibility of machine learning to address the classification problem of binary system miscibility. It identifies key factors influencing the miscibility of two different elements in forming binary compounds and analyzes the importance of these factors. Notably, this model predicts potentially miscible binary systems that have not yet been recorded in experimental databases. Using USPEX to quickly search for variable component structures of potentially miscible binary systems, and combining the Vienna Ab-initio Simulation Package (VASP) 34 with high-precision optimization of the stable structures generated by USPEX, we successfully predicted the ground state structures of three different binary compounds. These structures demonstrate superior thermodynamic stability compared to theoretical data for the same systems in the OQMD, suggesting a greater advantage for experimental synthesis. Our theoretical research provides valuable guidance for discovering and synthesizing new compounds in similar systems.
2 Computational Method
2.1 Machine Learning Model Building
2.1.1 Dataset
The MP database does not include unstable elements like Po, At, Rn, Fr, Ra, Rf, Db, Sg, Bh, Hs, Mt, Ds, Rg, Cn, Nh, and Og, among others, which are either naturally radioactive or synthetically produced. Radioactive elements such as Ac, Th, Pa, U, Np, Pu, Tc, and Pm undergo spontaneous decay, leading to instability in the compounds they form. Noble gases —He, Ne, Ar, Kr, and Xe— have complete electron shells, making them chemically inert under normal conditions due to their high ionization energy. Halogens (F, Cl, Br, I) and elements like O, N, and H, known for their high electronegativity, multiple oxidation states, and reactivity, readily form a vast array of compounds.
Excluding these elements, our classification model will utilize a 2,346 possible binary system combinations dataset. We integrate experimental data from both the MP database and ICSD, encompassing 20,295 binary compounds across 1,420 binary systems. Binary systems that are experimentally miscible from these databases are used as positive samples, while the 926 non-miscible systems serve as negative samples. The balance of positive and negative samples in the data set enhances the model’s performance and generalization capability.
2.1.2 Determinants
Drawing from experience, we explored several factors that could influence the synthesis of binary compounds and developed simple features, such as addition or subtraction, to represent their interrelationships, aiming to pinpoint key factors. Initially, we examined various parameters from the periodic table, including electronegativity, atomic radius, melting point, flash point, and molar volume. Notably, we observed significant differences in electronegativity between miscible and non-miscible binary systems, characterizing that electronegativity plays a key role in the miscibility of elements to form binary compounds. This observation led us to hypothesize that electronegativity is a pivotal factor in compound formation. Electronegativity quantifies an atom’s capacity to attract electrons in a molecule, an element with a higher electronegativity value exerts a stronger pull on bonding electrons 35, 36. Consequently, we selected the sum of electronegativity values as a critical indicator for our study.
However, when comparing and analyzing other parameters, we did not observe the expected significant changes (see Figure S1), prompting the introduction of custom parameters. Empirically, the number of extranuclear electrons has been observed to play a significant role in the formation of binary compounds. However, there is currently no specific parameter available to quantify this effect. To address this, we propose a novel weighted indicator, termed WEle (Weighted Electrons of the Extranuclear Level), which quantifies the relationship between the extranuclear electron count of different elements and their contribution to compound stability.
WEle is defined to more intuitively represent the stability of an atom or molecule’s electron configuration in relation to its orbital capacity. A positive WEle value indicates an excess of electrons available for bonding, while a negative value suggests a need for interaction with other atoms to achieve stability. Consequently, we’ve chosen both the sum and difference of the valence electron weights as indicators, demonstrating the potential gain or loss of valence electrons for the elements involved in compound formation. The specific formula is shown below:
| (1) |
In this formula, represents the orbital type, with the ‘s’, ‘p’, ‘d’, and ‘f’ orbitals being assigned the numerical values 0, 1, 2, and 3, respectively. Additionally, represents the current number of electrons occupying the orbital . When the outermost orbital of the extranuclear charge distribution is an ‘s’ orbital, specifically refers to the current number of electrons in that outermost s orbital, furthermore, represents the “effective” electron count in orbitals such as ‘p’, ‘d’, and ‘f’, which are beyond the outermost shell.
We’ve also introduced a metric for the number of unoccupied orbitals for electrons, termed Unoccupy. Unoccupied orbitals indicate an atom’s potential to achieve a stable electron configuration by sharing, transferring, or rearranging electrons, particularly within the outermost shell. The difference in the number of Unoccupy orbitals between elements is selected as an indicator, reflecting their potential for chemical bonding and stability.
Taking Fe as an example, its arrangement of extranuclear electrons is [(1, ‘s’, 2), (2, ‘s’, 2), (2, ‘p’, 6), (3, ‘s’, 2), (3, ‘p’, 6), (3, ‘d’, 6), (4, ‘s’, 2)]. Based on the valence electron weight index formula, WEle can be calculated as , and the result is 0.667. Also, according to the definition of unoccupied orbitals, it’s determined that Unoccupy equals 4.
After careful consideration of various indicators, we have identified four critical parameters that significantly influence the miscibility of binary compounds: the sum of electronegativity values (sumElecNeg), the difference in the number of unoccupied orbitals (diffUnoccupy), the sum of valence electron weights (sumWEle), and the difference in valence electron weights (diffWEle), respectively.
| (2) |
| (3) |
| (4) |
| (5) |
where and represent two different elements.
2.1.3 Random Forest Model
Our research focuses on exploring the key factors that determine whether two different elements can be miscible to form binary compounds and quantifying the importance of these factors. There are the following characteristics in the data of this study: (1) high data dimension, involving the basic characteristics of many elements; (2) large data scale, with a large number of samples to be processed; (3) intricate relationship between the data, preceding a simple linear relationship. Given these characteristics, the random forest model is an ideal choice due to its exceptional fitting capability and its proficiency in managing complex data structures 37, 38.
We utilized data from 2,346 binary systems to construct our random forest model. To effectively evaluate the model’s performance, we employed a commonly used partitioning strategy, randomly dividing the dataset into a training set and a test set with an 80% to 20% ratio. This method ensures that the model does not overfit during training while allowing for effective performance evaluation on an independent dataset.
During the training process, we use information entropy as a criterion to evaluate the quality of node splitting because it can measure the data’s uncertainty and evaluate each node’s purity after splitting 39. By employing this method, we can identify the optimal split points, thereby enhancing the model’s performance to its fullest potential. We integrated a subset of 10 decision trees into the random forest model. Through this integration strategy, we enhanced the prediction accuracy and robustness of the model, thereby effectively improving its generalization ability.
To comprehensively evaluate the performance of the constructed random forest model in classifying the miscibility of binary compound systems, we utilized stratified sampling to randomly generate the test set. Additionally, we assessed the model using four key performance metrics: Accuracy, Precision, Recall, and F1-score. The calculation formulas for these metrics are as follows:
Accuracy measures the proportion of correctly classified samples to the total number of samples:
| (6) |
Precision measures the proportion of true positive samples among all samples classified as positive:
| (7) |
Recall measures the proportion of true positive samples correctly identified among all actual positive samples:
| (8) |
F1-score is the harmonic mean of precision and recall, providing a comprehensive metric that balances both aspects:
| (9) |
Here, , , , and represent true positives, true negatives, false positives, and false negatives, respectively. This evaluation framework ensures a thorough analysis of the model’s performance across multiple dimensions.
The key performance metrics we used, such as accuracy, precision, recall, and F1-score, were calculated using weighted averages based on class weights. These weights were assigned according to the size of each class to ensure balanced predictive performance across all classes. We performed numerous experiments with random combinations of potential tuning parameters to identify the optimal set of hyperparameters. Finally, we applied the best-fitting random forest model to the test set to evaluate its performance on unseen data.
2.2 Structural Prediction
Recognized for its efficiency in identifying all stable crystal structures across a range of atomic numbers, USPEX has been validated through numerous studies 40, 41, 42. We employed the USPEX algorithm to conduct a structural search at 0 GPa. The search began with an initial population of 150 diverse structures, each with up to 16 atoms in their respective primitive cells. The evolutionary process involved generating subsequent populations of 40 structures. This generation was composed through a combination of methods: 20% heredity, ensuring the propagation of successful structures; 20% random space group generation, introducing new symmetry possibilities; 20% transmutation, simulating atomic substitutions; 20% soft mutation, allowing for slight modifications to existing structures; 10% lattice mutation, altering the unit cell parameters; and 10% topological random generation, exploring new topological configurations.
The search algorithm is designed to terminate under two conditions: either when the optimal structure has remained unchanged for 30 consecutive generations, indicating convergence towards a stable solution, or after completing 60 iterations, ensuring a thorough exploration of the configurational space.
We employed the VASP code to carry out DFT calculations using the Perdew–Burke–Ernzerhof (PBE) functional within the framework of the GGA. To accurately represent the core electrons and their effects on the valence electrons, we utilized the projector-augmented wave (PAW) method 43.
A plane-wave basis was used with a kinetic energy cutoff of 500 eV, and the convergence criterion for the total energy was set to eV. The unit cell lattice vectors (both unit cell shape and size) were fully relaxed together with the atomic coordinates until the force on each atom was less than 0.005 eV/Å.
To characterize the energetic stability of structures at various compositions resulting from a structure search, the formation energy () of any given structure is calculated:
| (10) |
Where is the per-atom energy of structure, and represents the per-atom energy of Hexagonal-Co (-) and Hexagonal-Eu (), respectively (all details are provided in Table S3 of the Supporting information). Also, the phonon calculations were performed using the Density-Functional Perturbation Theory (DFPT) by combining the VASP code and PHONOPY package 44, 45. A 2 × 2 × 2 supercell and a kinetic energy cutoff of 500 eV were used to calculate the phonon spectra.
3 Results And Discussion
3.1 Machine Learning Prediction Model
Here, we have selected four critical factors: sumElecNeg, diffUnoccupy, sumWEle, and diffWEle. Figure 2 illustrates the relationships between the distribution of these key factors and the miscibility of different elements to form binary systems. The horizontal axis represents the four key factors, while the vertical axis represents the number of binary systems.
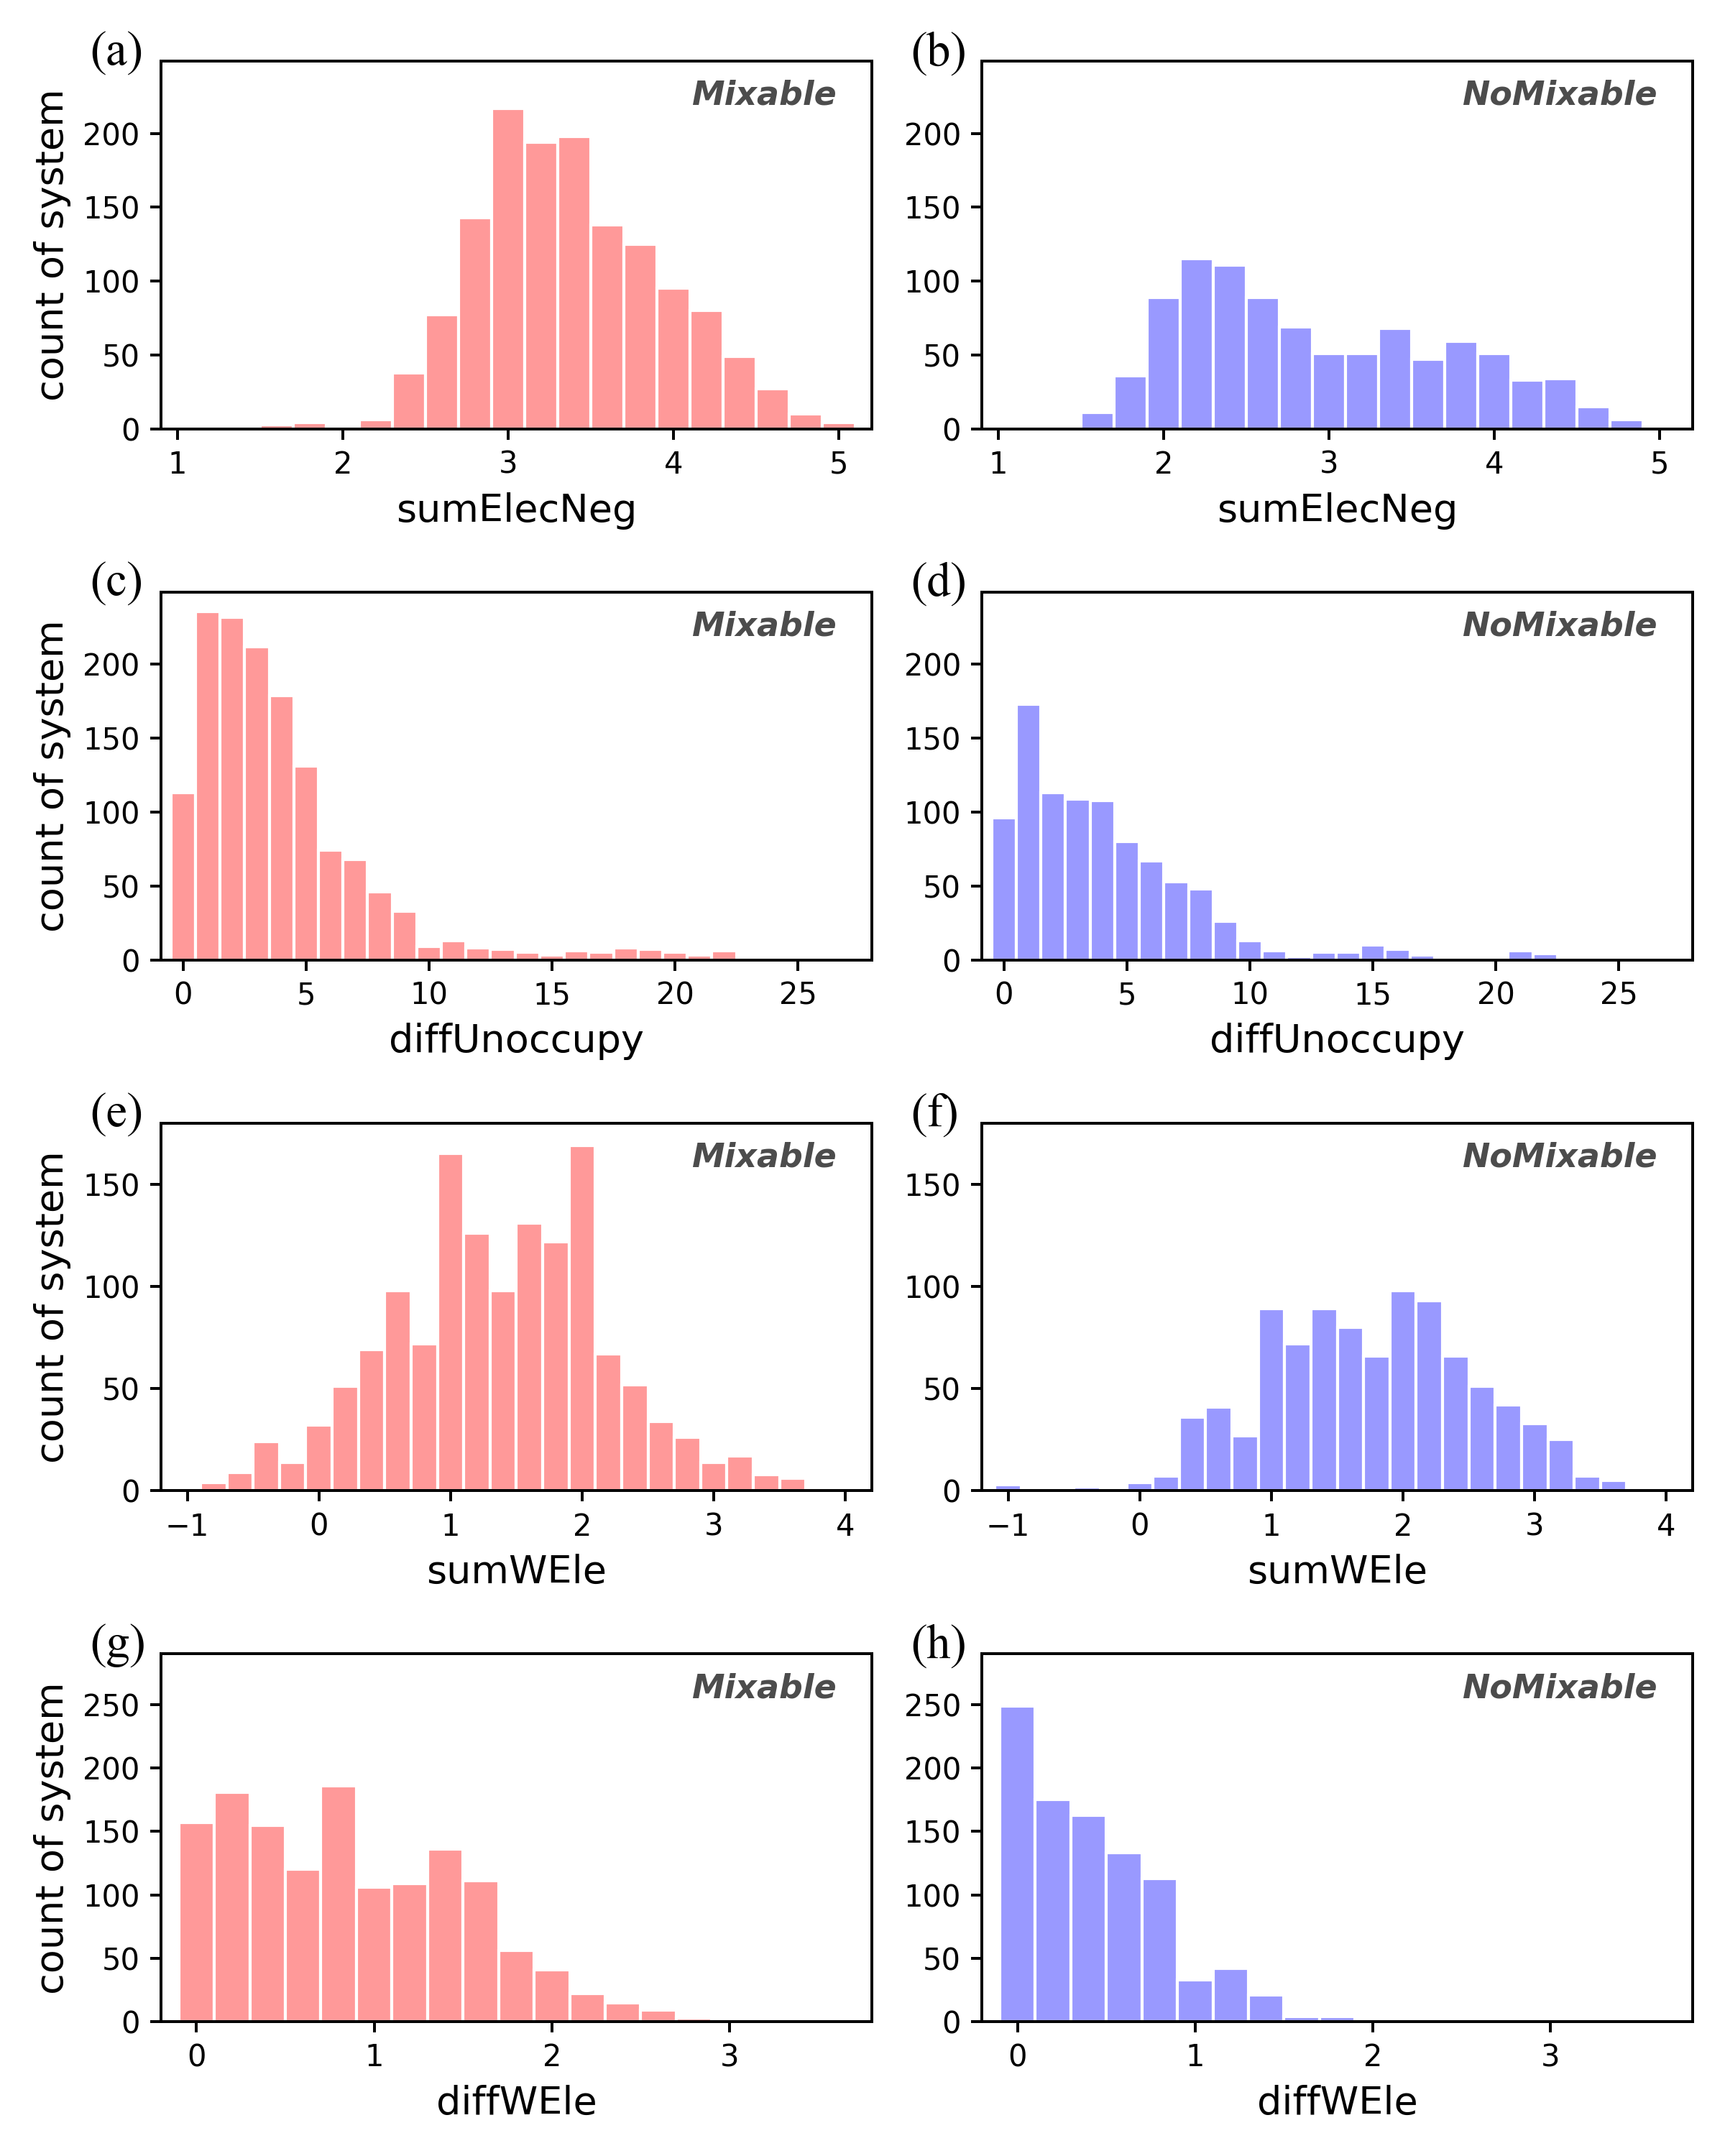
As seen from Figure 2, a, c, e, and g represent the sample label distributions that can form binary compound systems, while b, d, f, and h correspond to the sample label distributions for which no binary compound systems have been found yet.
The effect of sumElecNeg on the binding of binary compounds is shown in Figure 2(a-b). In Figure 2(a), mixable phases are cumulative in the range of 2.8-4. On the contrary, nonmixable ones range between 2 and 3 and fail to get binary phases. What’s more, Figure 2(c-d) reflects the effects of diffUnoccupy on the binding of binary compounds. In Figure 2(c), mixable compounds decay sharply in the region after 2, while in Figure 2(d), nonmixable compounds decay slowly in the region after 2. The effects of sumWEle on the binding of binary compounds are shown in Figure 2(e-f). In Figure 2(e), mixable phases are mainly concentrated in the region of 1-2, while in Figure 2(f), nonmixable phases are mostly concentrated in the region of 1-2.5. Figure 2(g-h) reflects the effects of diffWEle on the binding of binary compounds. In Figure 2(g), mixable compounds mainly decay in the region after 1.5, while in Figure 2(h), nonmixable drops in the region after 0.
We selected the above four predominant factors during the training of the Random Forest algorithm. Performance indicators were applied to test the model’s performance. The specific indicators are as follows: Accuracy is 94.47%, Precision is 94.83%, Recall is 94.55%, and F1-score is 94.64%. The complete specific performance parameters are shown in Table 1(Partial classification results for different labels in the binary system are shown in Table S2 in the supporting material).
| Mix or No-Mix | Precision | Recall | F1-Score | Support |
|---|---|---|---|---|
| 0 | 0.91 | 0.94 | 0.92 | 170 |
| 1 | 0.97 | 0.95 | 0.96 | 300 |
| accuracy | 0.94 | 470 | ||
| weighted avg | 0.95 | 0.94 | 0.94 | 470 |
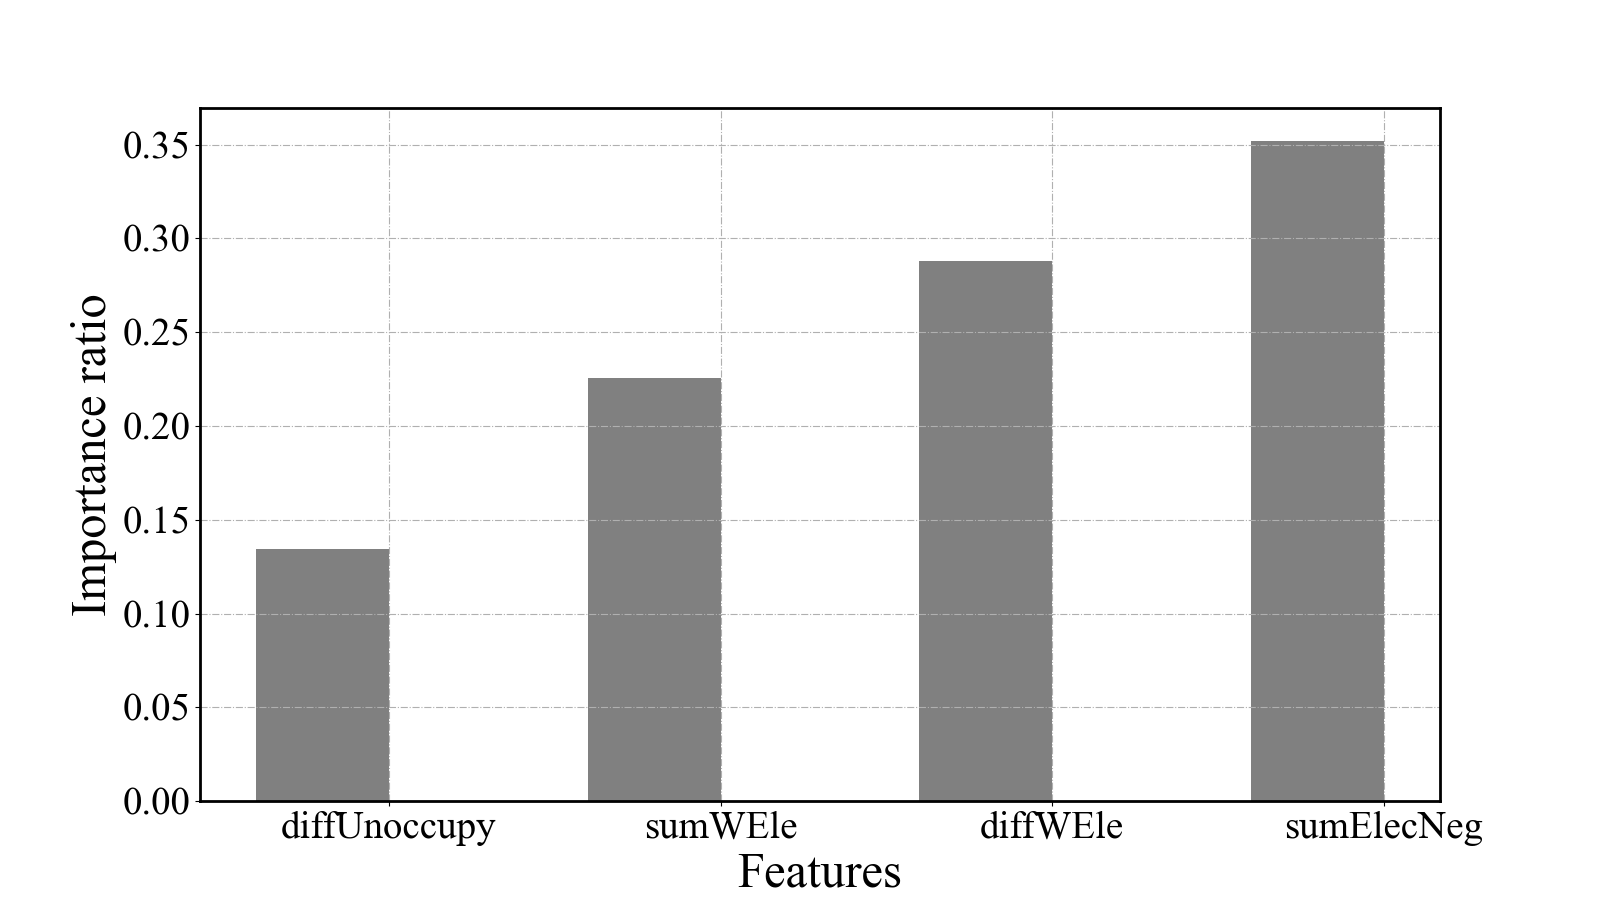
To further analyze the importance of each input, we extracted the feature contributions from the random forest model. As depicted in Figure 3 below, their weight ratios are 35.2% (sumElecNeg), 22.54% (diffWEle), 28.81% (sumWEle), and 13.45% (diffUnoccupy), respectively. SumElecNeg emerges as the most significant factor, highlighting the critical role of electronegativity summation in predicting the formation of binary compounds. Then it comes to sumWEle and diffWEle, which shows that the WEle weight value plays an important role in forming the compound. Also, diffUnoccupy provides useful global information about the formation propensity of a compound. These varying degrees of significance not only elucidate the extent to which these critical factors influence the formation of binary compounds by elements but also represent the degree to which distributions are differentiated in graphical analyses.
Finally, the trained model has been applied to predict, some potential combinations that have the potential to form binary compounds but have not yet been found in the experimental database, including Na-Fe, Al-Bi, P-Te, Fe-Rb, Co-Eu, As-Tl, Mo-Tb, Ru-Pb, Ru-Bi, Pd-Os, Tb-W, and Ho-W. These predicted binary combinations will serve as our target set for discovering new materials.
3.2 Updating The Energy Convex Hull Of Co-Eu System
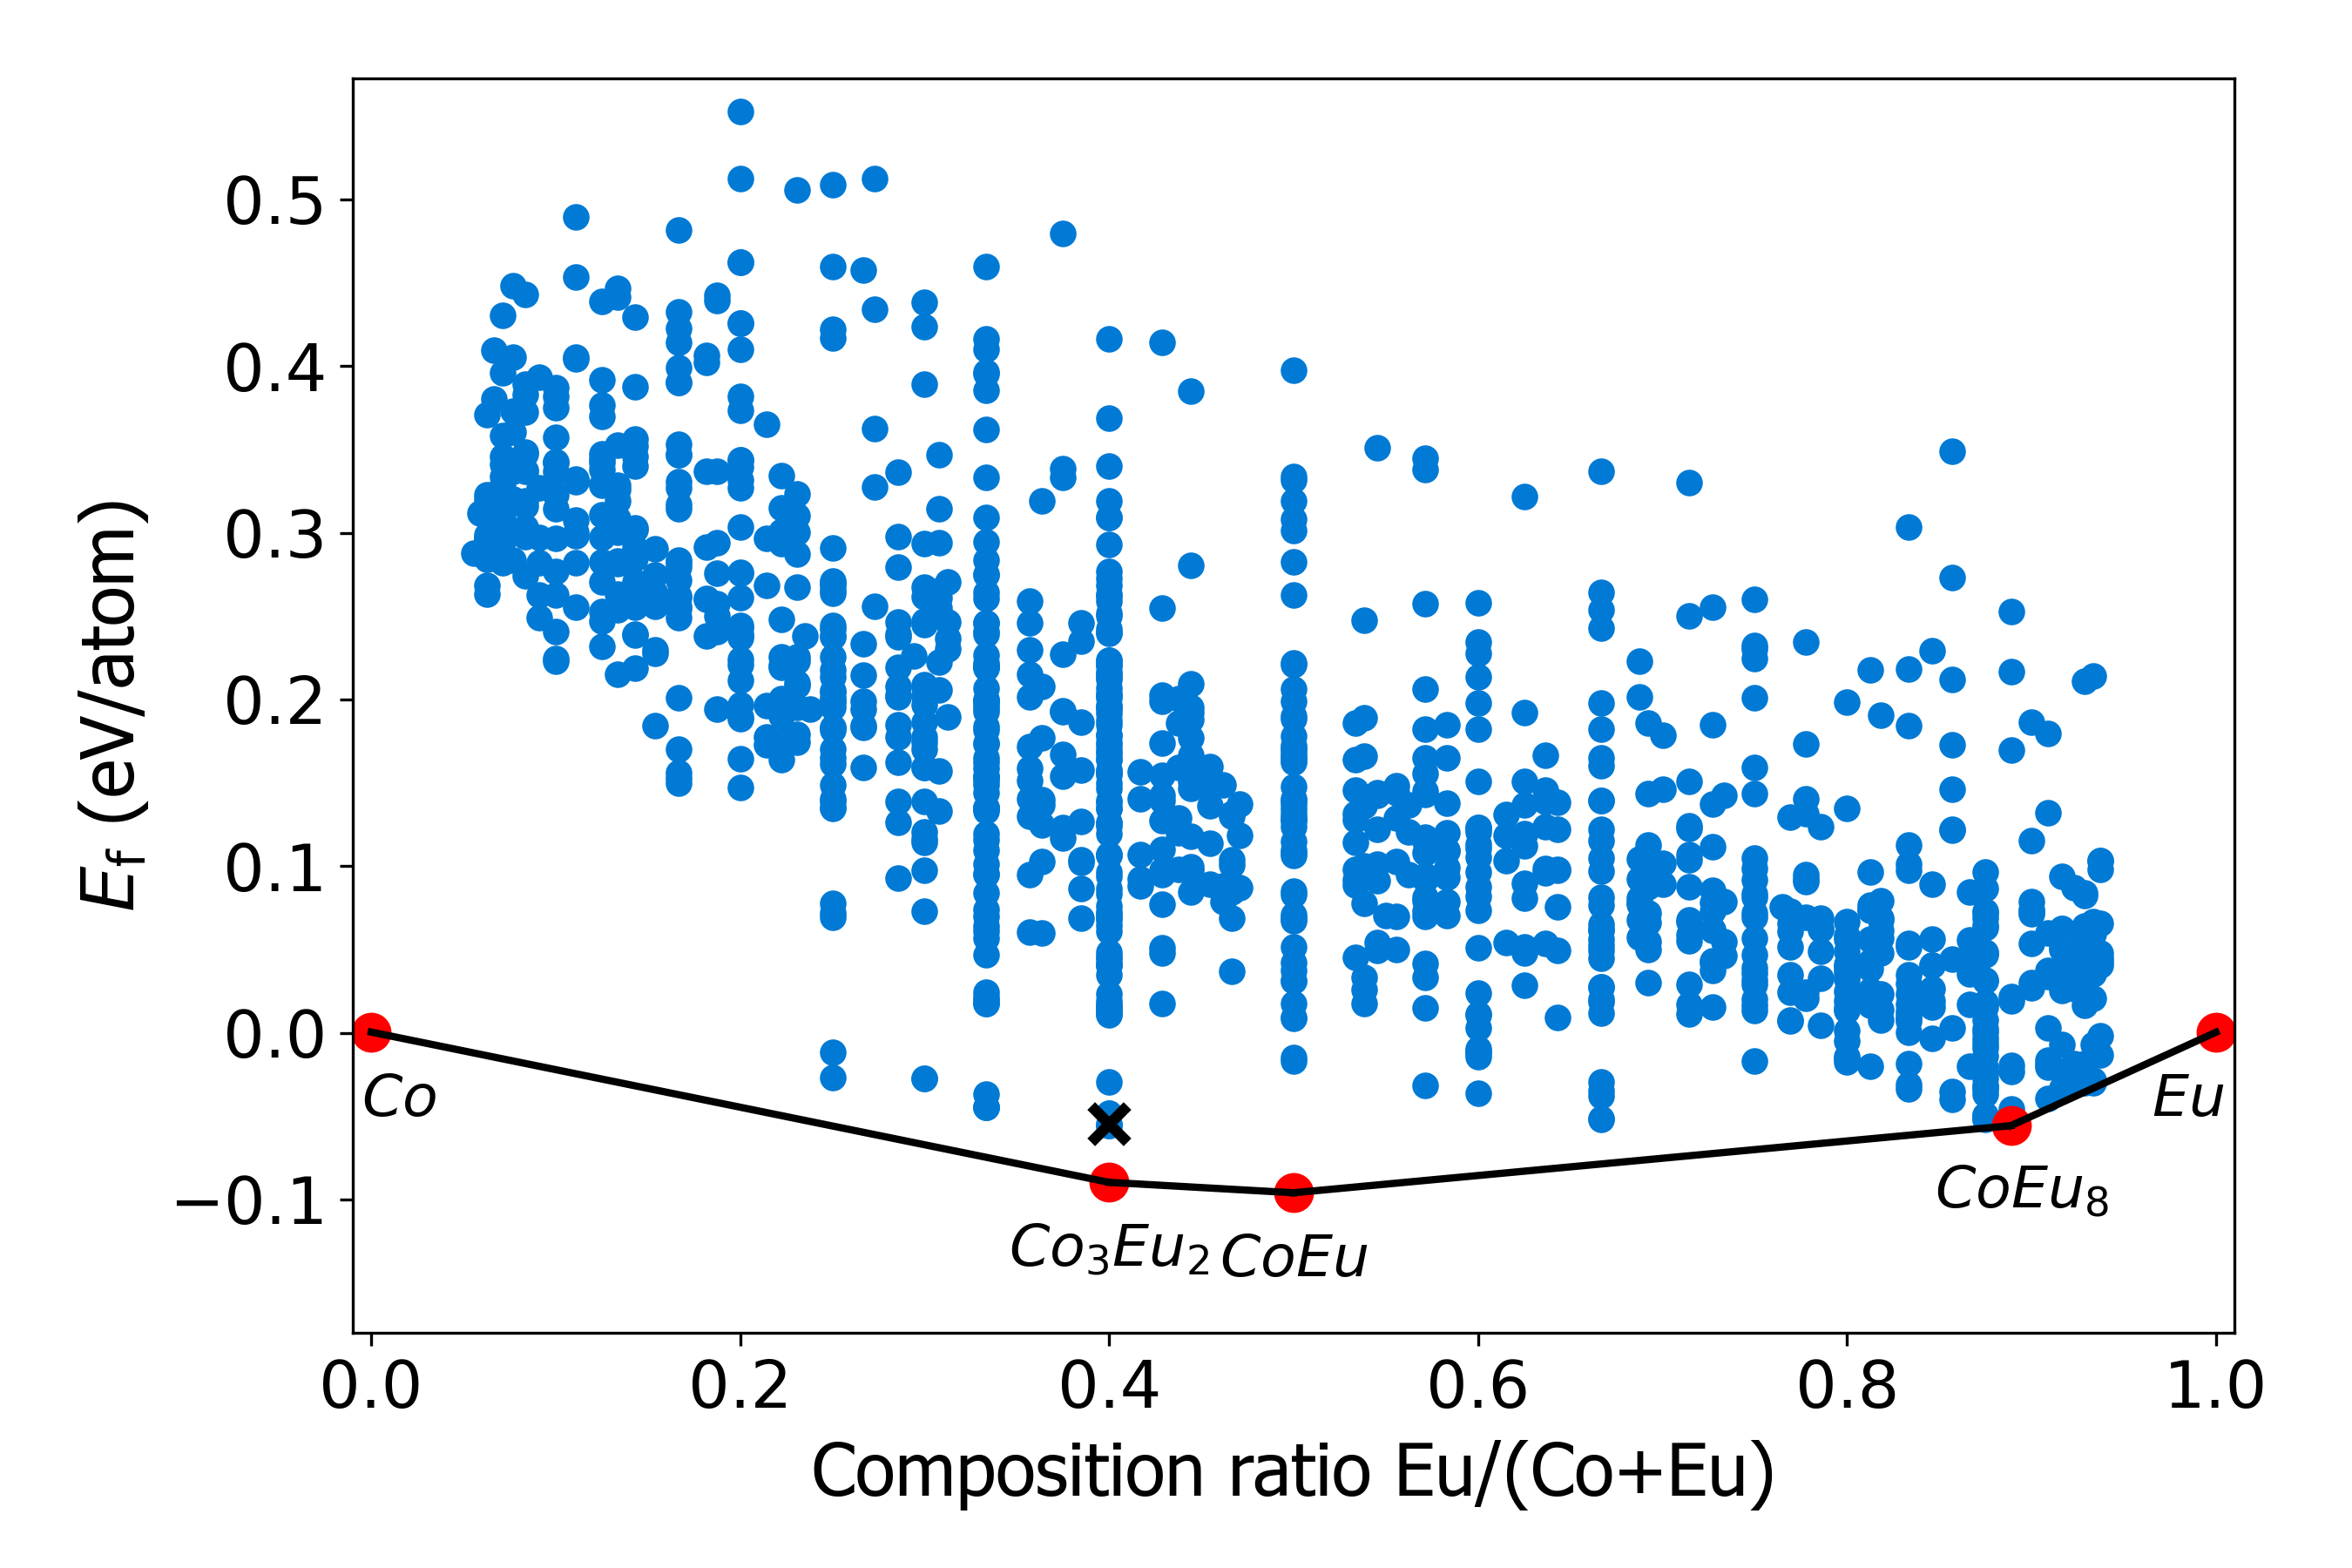
We conducted a rapid variable component structure search using USPEX, guided by the results from the Random Forest Model Prediction Combination previously mentioned. It’s known that the energy convex hull (ECH) phase diagram is a vital bias for judging the structural stability of a special system21. In Figure 4, red points represent stable phases, connected by continuous black lines to form the ECH. Phases directly on the ECH are thermally stable, while blue points above the hull indicate instability. Notably, the only currently stable phase, , was identified in the OQMD 31, 32. However, this phase has become metastable following the update of the ECH, and its formation energy is now marked as an ‘x’ in the phase diagram. As shown in Figure 4, , and exhibit negative formation energy, indicating they are thermodynamically stable.
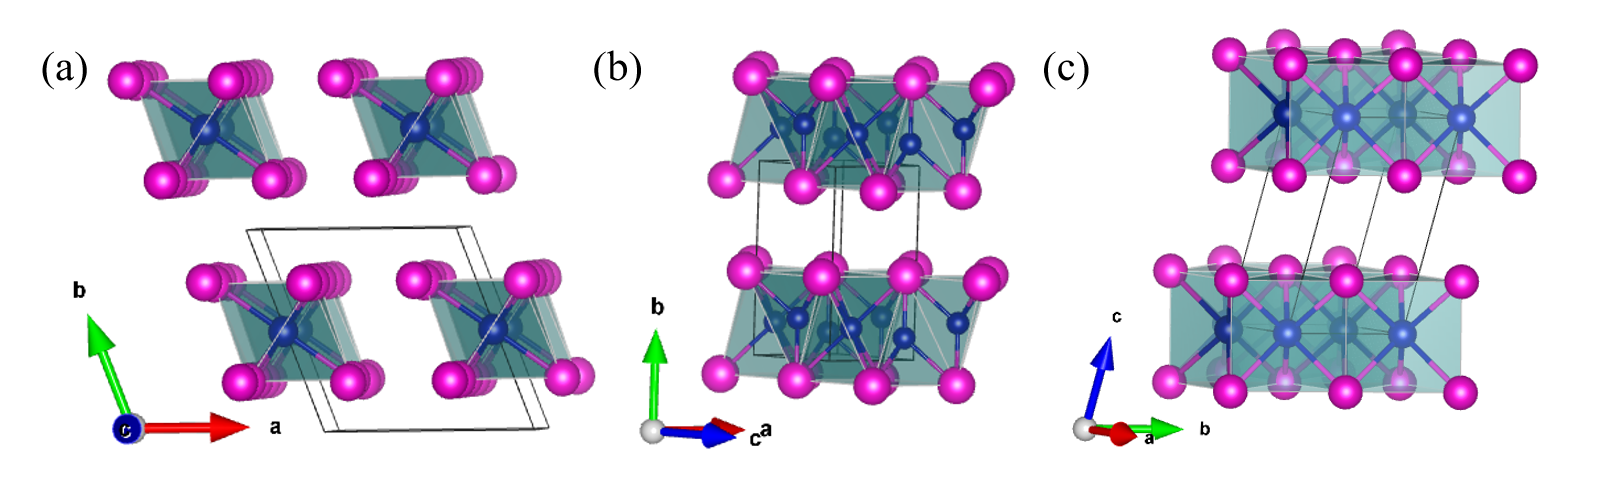
The structures of the lowest energy , and are both in the space group, as shown in Figure 5. Crystallographic details are provided in the supplementary materials (Tables S4-S6).
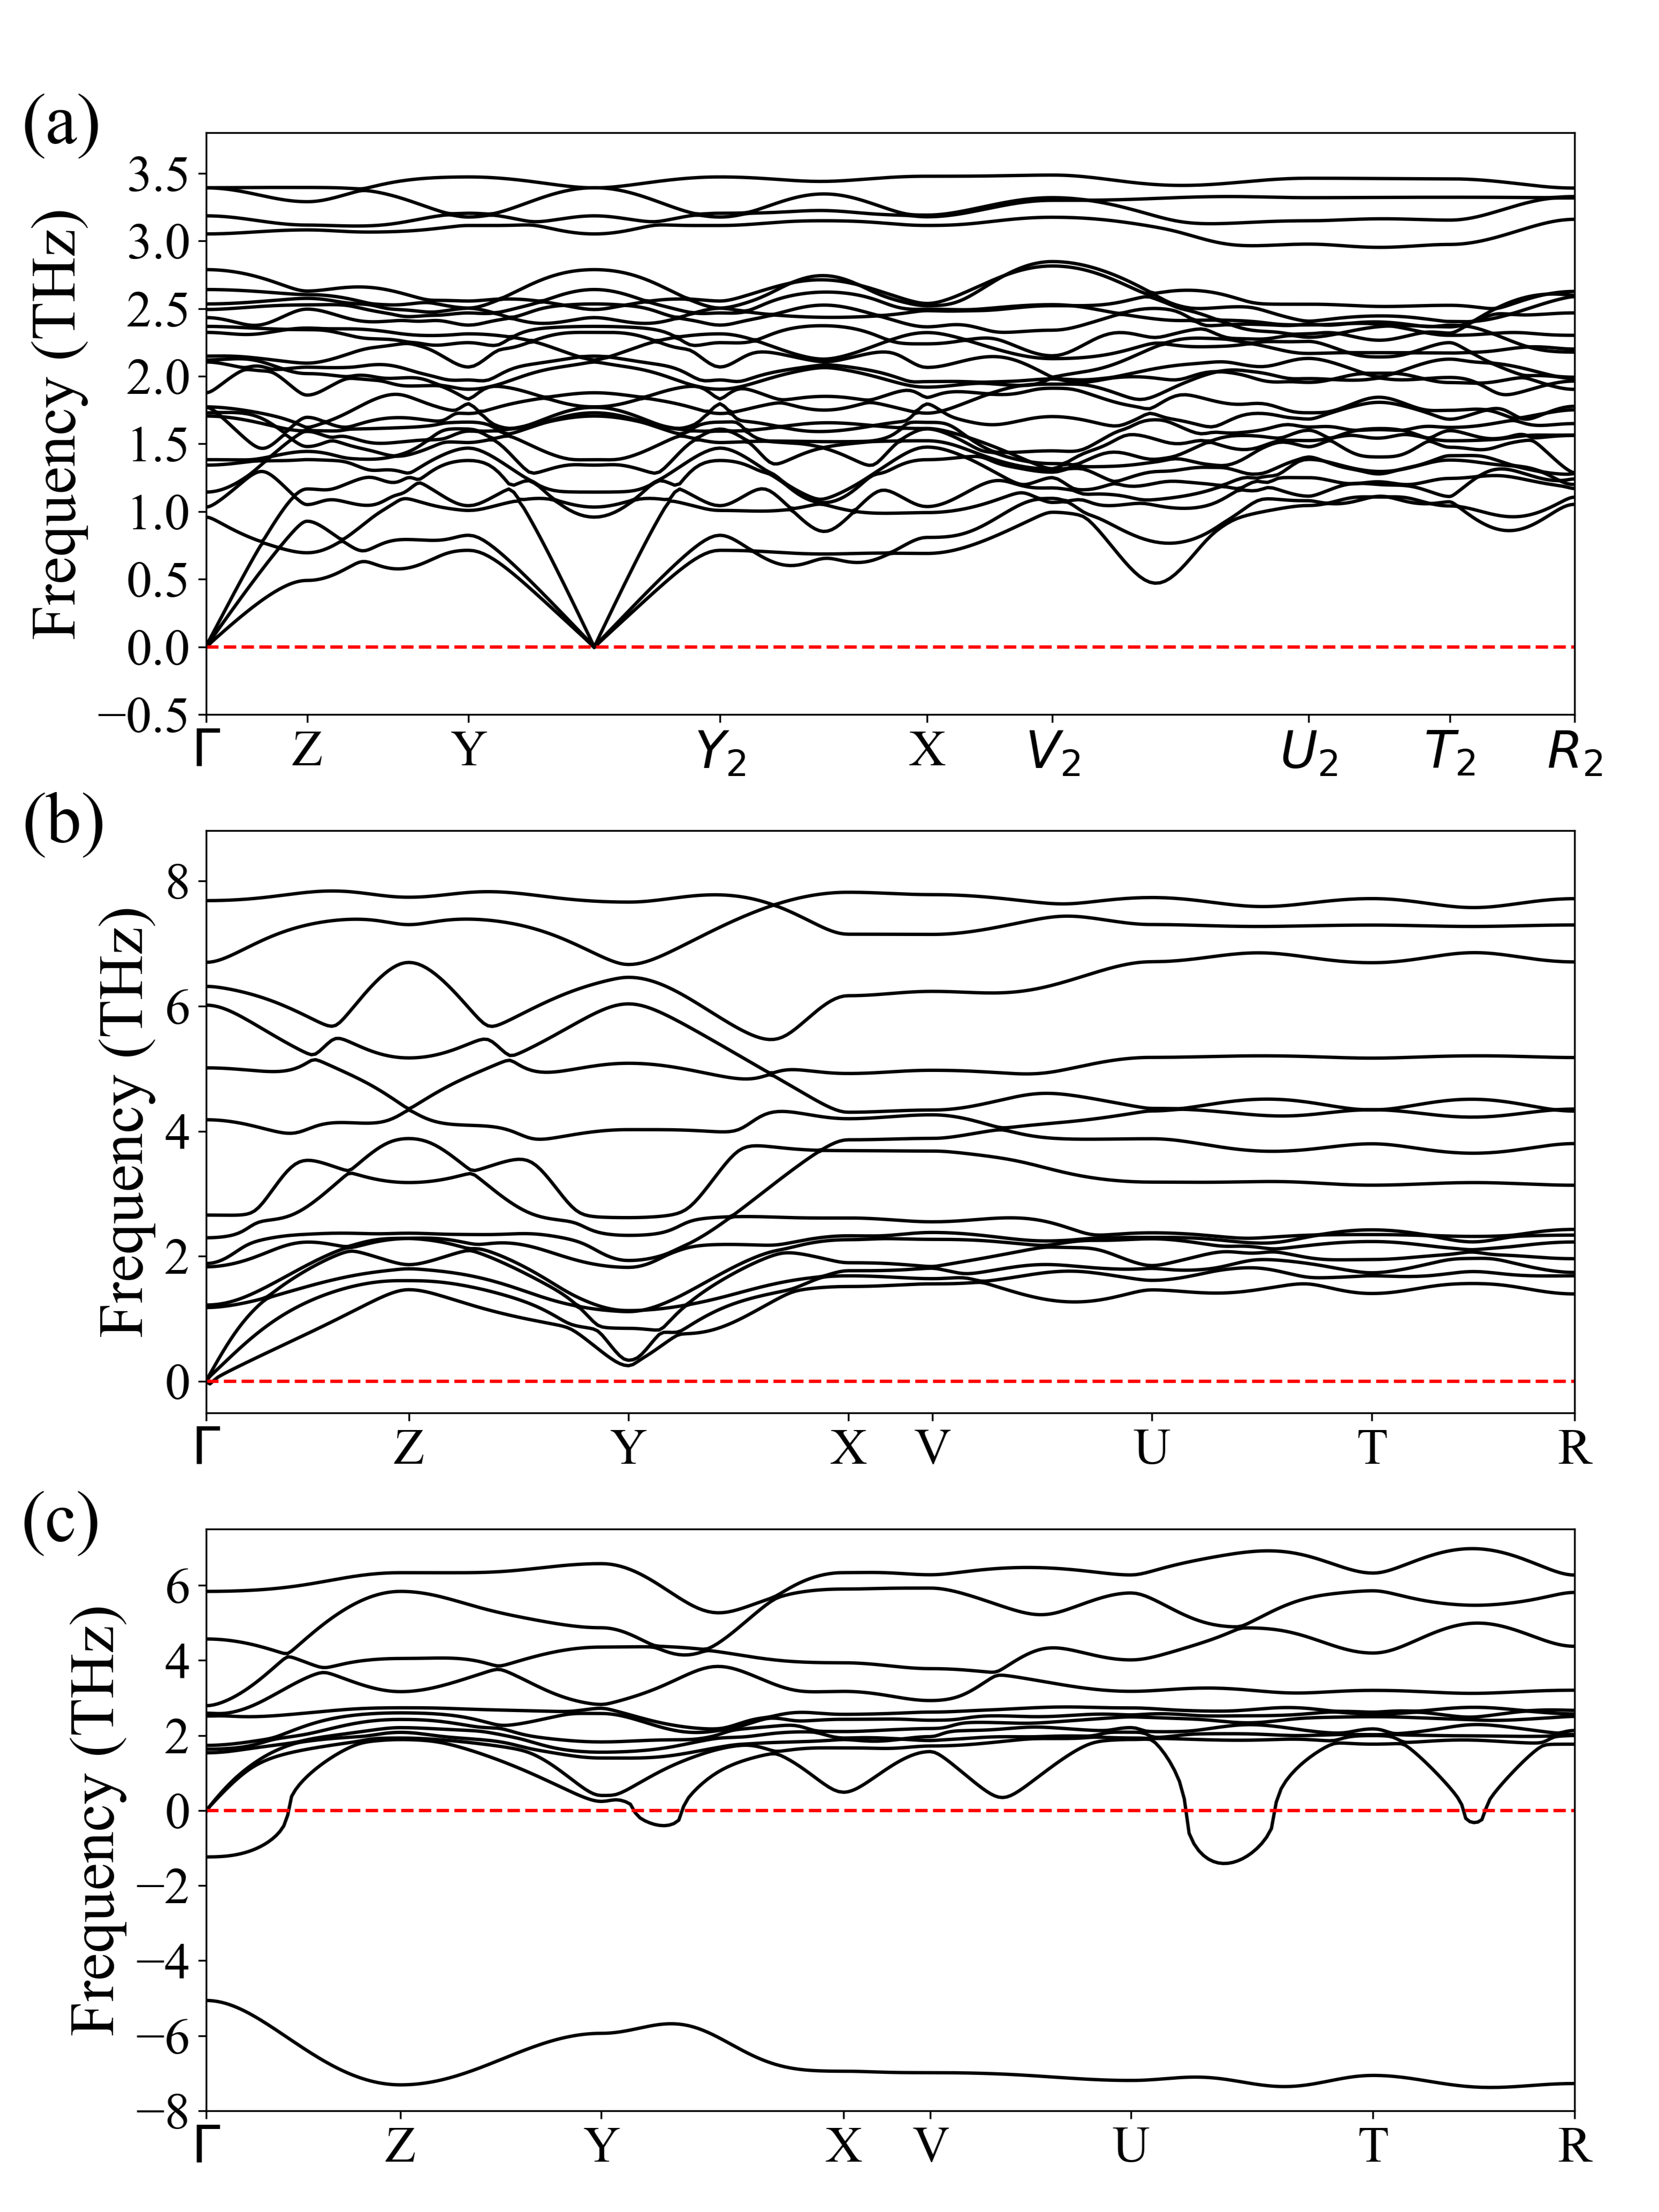
The phonon band structure offers key insights into the dynamic stability of newly predicted phases of , and . The and phases are dynamically stable, as there are no imaginary frequencies in Figure 6(a-b), which further consolidates the theoretical basis for and as potentially stable phases. Among them, since the phase has an imaginary frequency in Figure 6(c), it indicates that it may be dynamically unstable. The phonon spectrum of in OQMD after structural optimization also has imaginary frequencies, as shown in the supplementary material (Figure S7).
Our results indicate that the newly predicted structures of the Co-Eu system exhibit superior stability, making them strong candidates for experimental synthesis. This finding corroborates the results presented in Chapter 3.1.
4 Conclusion
In summary, our study utilized a dataset comprising 2,346 binary systems, including 1,420 experimentally synthesized binary systems from the MP database and ICSD as positive samples and 926 experimentally unsynthesized binary systems as negative samples. We employed a random forest model for binary classification, integrating key features such as the sumElecNeg for two different elements in the periodic table and custom-weighted features like sumWEle, diffWEle, and diffUnoccupy. This feature set significantly bolstered the model’s reliability, yielding an impressive Accuracy of 94.47%, Precision of 94.83%, Recall of 94.55%, and an F1-score of 94.64%.
We utilized USPEX to conduct rapid variable composition structure searches on 12 systems with synthetic potential predicted by our model and discovered three new thermodynamically stable structures, , and , in the Co-Eu system, thereby verifying the reliability of our model. Our model successfully explored combinations of miscible element pairs, allowing us to explore and synthesize potentially stable structures more efficiently, providing valuable guidance for future discovery of new materials. It also laid the foundation for further investigations into incorporating a third element to form new ternary systems with previously immiscible element pairs.
Work at Guangdong University of Technology is supported by the Guangdong Basic and Applied Basic Research Foundation (Grant No. 2022A1515012174 and 2021A1515110328). R. Wang also thanks Center of Campus Network and Modern Educational Technology, Guangdong University of Technology, Guangdong, China for providing computational resources and technical support for this work.
The Supporting Information can be accessed at no cost through https://pubs.acs.org/doi/xxx.
References
- Agrawal and Choudhary 2016 Agrawal, A.; Choudhary, A. Perspective: Materials informatics and big data: Realization of the “fourth paradigm” of science in materials science. Apl Materials 2016, 4
- Medina et al. 2022 Medina, J.; Ziaullah, A. W.; Park, H.; Castelli, I. E.; Shaon, A.; Bensmail, H.; El-Mellouhi, F. Accelerating the adoption of research data management strategies. Matter 2022, 5, 3614–3642
- Lejaeghere et al. 2016 Lejaeghere, K.; Bihlmayer, G.; Björkman, T.; Blaha, P.; Blügel, S.; Blum, V.; Caliste, D.; Castelli, I. E.; Clark, S. J.; Dal Corso, A.; others Reproducibility in density functional theory calculations of solids. Science 2016, 351, aad3000
- Perdew et al. 1996 Perdew, J. P.; Burke, K.; Ernzerhof, M. Generalized gradient approximation made simple. Physical review letters 1996, 77, 3865
- Singh et al. 2023 Singh, S. K.; Sose, A. T.; Wang, F.; Bejagam, K. K.; Deshmukh, S. A. Data driven discovery of MOFs for hydrogen gas adsorption. Journal of Chemical Theory and Computation 2023, 19, 6686–6703
- Huang and Zhang 2024 Huang, Y.; Zhang, L. Descriptor Design for Perovskite Material with Compatible Molecules via Language Model and First-Principles. Journal of Chemical Theory and Computation 2024,
- Chen et al. 2017 Chen, S.; Zheng, F.; Wu, S.; Zhu, Z. An improved genetic algorithm for crystal structure prediction. Current Applied Physics 2017, 17, 454–460
- Kadan et al. 2023 Kadan, A.; Ryczko, K.; Wildman, A.; Wang, R.; Roitberg, A.; Yamazaki, T. Accelerated organic crystal structure prediction with genetic algorithms and machine learning. Journal of Chemical Theory and Computation 2023, 19, 9388–9402
- Wang et al. 2012 Wang, Y.; Lv, J.; Zhu, L.; Ma, Y. CALYPSO: A method for crystal structure prediction. Computer Physics Communications 2012, 183, 2063–2070
- Wang et al. 2010 Wang, Y.; Lv, J.; Zhu, L.; Ma, Y. Crystal structure prediction via particle-swarm optimization. Physical Review B—Condensed Matter and Materials Physics 2010, 82, 094116
- Pickard and Needs 2011 Pickard, C. J.; Needs, R. Ab initio random structure searching. Journal of Physics: Condensed Matter 2011, 23, 053201
- Pickard and Needs 2009 Pickard, C. J.; Needs, R. Structures at high pressure from random searching. physica status solidi (b) 2009, 246, 536–540
- Goedecker 2004 Goedecker, S. Minima hopping: An efficient search method for the global minimum of the potential energy surface of complex molecular systems. The Journal of chemical physics 2004, 120, 9911–9917
- Amsler and Goedecker 2010 Amsler, M.; Goedecker, S. Crystal structure prediction using the minima hopping method. The Journal of chemical physics 2010, 133
- Doll et al. 2007 Doll, K.; Schön, J.; Jansen, M. Global exploration of the energy landscape of solids on the ab initio level. Physical Chemistry Chemical Physics 2007, 9, 6128–6133
- Carlsson 2020 Carlsson, G. Topological methods for data modelling. Nature Reviews Physics 2020, 2, 697–708
- Avendaño-Franco and Romero 2016 Avendaño-Franco, G.; Romero, A. H. Firefly algorithm for structural search. Journal of Chemical Theory and Computation 2016, 12, 3416–3428
- Yang 2010 Yang, X.-S. Firefly algorithm, stochastic test functions and design optimisation. International journal of bio-inspired computation 2010, 2, 78–84
- Oganov and Glass 2006 Oganov, A. R.; Glass, C. W. Crystal structure prediction using ab initio evolutionary techniques: Principles and applications. The Journal of chemical physics 2006, 124
- Oganov et al. 2011 Oganov, A. R.; Lyakhov, A. O.; Valle, M. How Evolutionary Crystal Structure Prediction Works and Why. Accounts of chemical research 2011, 44, 227–237
- Ali and Shin 2024 Ali, A.; Shin, Y.-H. Prediction of novel ground-state structures and analysis of phonon transport in two-dimensional compounds. Physical Chemistry Chemical Physics 2024, 26, 602–611
- Barnard 2014 Barnard, A. S. In silico veritas. ACS nano 2014, 8, 6520–6525
- Nosengo 2016 Nosengo, N. The Material Code: Machine-learning techniques could revolutionize how materials science is done. Nature 2016, 533, 22
- Curtarolo et al. 2013 Curtarolo, S.; Hart, G. L.; Nardelli, M. B.; Mingo, N.; Sanvito, S.; Levy, O. The high-throughput highway to computational materials design. Nature materials 2013, 12, 191–201
- Hill et al. 2016 Hill, J.; Mulholland, G.; Persson, K.; Seshadri, R.; Wolverton, C.; Meredig, B. Materials science with large-scale data and informatics: Unlocking new opportunities. Mrs Bulletin 2016, 41, 399–409
- De Pablo et al. 2014 De Pablo, J. J.; Jones, B.; Kovacs, C. L.; Ozolins, V.; Ramirez, A. P. The materials genome initiative, the interplay of experiment, theory and computation. Current Opinion in Solid State and Materials Science 2014, 18, 99–117
- Bergerhoff et al. 1983 Bergerhoff, G.; Hundt, R.; Sievers, R.; Brown, I. The inorganic crystal structure data base. Journal of chemical information and computer sciences 1983, 23, 66–69
- Belsky et al. 2002 Belsky, A.; Hellenbrandt, M.; Karen, V. L.; Luksch, P. New developments in the Inorganic Crystal Structure Database (ICSD): accessibility in support of materials research and design. Acta Crystallographica Section B: Structural Science 2002, 58, 364–369
- Jain et al. 2013 Jain, A.; Ong, S. P.; Hautier, G.; Chen, W.; Richards, W. D.; Dacek, S.; Cholia, S.; Gunter, D.; Skinner, D.; Ceder, G.; others Commentary: The Materials Project: A materials genome approach to accelerating materials innovation. APL materials 2013, 1
- Ong et al. 2013 Ong, S. P.; Richards, W. D.; Jain, A.; Hautier, G.; Kocher, M.; Cholia, S.; Gunter, D.; Chevrier, V. L.; Persson, K. A.; Ceder, G. Python Materials Genomics (pymatgen): A robust, open-source python library for materials analysis. Computational Materials Science 2013, 68, 314–319
- Saal et al. 2013 Saal, J. E.; Kirklin, S.; Aykol, M.; Meredig, B.; Wolverton, C. Materials design and discovery with high-throughput density functional theory: the open quantum materials database (OQMD). Jom 2013, 65, 1501–1509
- Kirklin et al. 2015 Kirklin, S.; Saal, J. E.; Meredig, B.; Thompson, A.; Doak, J. W.; Aykol, M.; Rühl, S.; Wolverton, C. The Open Quantum Materials Database (OQMD): assessing the accuracy of DFT formation energies. npj Computational Materials 2015, 1, 1–15
- Chen et al. 2022 Chen, D.; Jiang, F.; Fang, L.; Zhu, Y.-B.; Ye, C.-C.; Liu, W.-S. Machine learning assisted discovering of new -type thermoelectric materials. Rare Metals 2022, 41, 1543–1553
- Kresse and Furthmüller 1996 Kresse, G.; Furthmüller, J. Efficiency of ab-initio total energy calculations for metals and semiconductors using a plane-wave basis set. Computational materials science 1996, 6, 15–50
- Jensen 1996 Jensen, W. B. Electronegativity from avogadro to pauling: part 1: origins of the electronegativity concept. Journal of chemical education 1996, 73, 11
- Cherkasov et al. 1998 Cherkasov, A. R.; Galkin, V. I.; Zueva, E. M.; Rafael’A, C. The concept of electronegativity. The current state of the problem. Russian chemical reviews 1998, 67, 375–392
- Breiman 2001 Breiman, L. Random forests. Machine learning 2001, 45, 5–32
- Chandy and Raghavachari 2023 Chandy, S. K.; Raghavachari, K. MIM-ML: A Novel Quantum Chemical Fragment-Based Random Forest Model for Accurate Prediction of NMR Chemical Shifts of Nucleic Acids. Journal of Chemical Theory and Computation 2023, 19, 6632–6642
- Shannon 1948 Shannon, C. E. A mathematical theory of communication. The Bell system technical journal 1948, 27, 379–423
- Oganov and Ono 2004 Oganov, A. R.; Ono, S. Theoretical and experimental evidence for a post-perovskite phase of in Earth’s D ”layer. Nature 2004, 430, 445–448
- Ma et al. 2009 Ma, Y.; Eremets, M.; Oganov, A. R.; Xie, Y.; Trojan, I.; Medvedev, S.; Lyakhov, A. O.; Valle, M.; Prakapenka, V. Transparent dense sodium. Nature 2009, 458, 182–185
- Zhang et al. 2013 Zhang, W.; Oganov, A. R.; Goncharov, A. F.; Zhu, Q.; Boulfelfel, S. E.; Lyakhov, A. O.; Stavrou, E.; Somayazulu, M.; Prakapenka, V. B.; Konôpková, Z. Unexpected stable stoichiometries of sodium chlorides. Science 2013, 342, 1502–1505
- Sui et al. 2009 Sui, Y.; Liu, J.; Liu, B.; Wang, L.; Yao, B. Influence of flow ratio of N2 to (N2+ Ar) mixture on the structure and properties of zirconium nitride films prepared by radio frequency magnetron sputtering. Journal of Materials Research 2009, 24, 3206–3212
- Togo et al. 2008 Togo, A.; Oba, F.; Tanaka, I. First-principles calculations of the ferroelastic transition between rutile-type and -type at high pressures. Physical Review B—Condensed Matter and Materials Physics 2008, 78, 134106
- Togo and Tanaka 2015 Togo, A.; Tanaka, I. First principles phonon calculations in materials science. Scripta Materialia 2015, 108, 1–5