Exploring Citation Diversity in Scholarly Literature: An Entropy-Based Approach
Abstract
This study explores global citation diversity, examining its various patterns across countries and academic disciplines. We analyzed citation distributions in top institutes worldwide, revealing that the higher citation end of the distribution follow Power law or Pareto law pattern and the Pareto law’s scaling exponent changes with the number of institutes considered. An entropy based novel citation inequality measure has been introduced, enhancing the precision of our analysis. Our findings show that countries with small and large economies often group similarly based on citation diversity, with shifting the groupings as the number of institutes considered changes. Moreover, we analyzed citation diversity among award-winning scientists across six scientific disciplines, finding significant variations. We also explored the evolution of citation diversity over the past century across multiple fields. A gender-based study in various disciplines highlights citation inequalities among male and female scientists. Our innovative citation diversity measure stands out as a vital tool for evaluating citation inequality, providing insights beyond what traditional citation counts can offer. This thorough analysis deepens our understanding of global scientific contributions and promotes a more equitable view of academic accomplishments.
Keywords: Citation inequality; Diversity measure; General class of Entropy; Scholarly literature; Award winners.
I Introduction
Citations are the currency of academia, reflecting impacts and influences of research publications. Ideally, a fair citation landscape would see recognition distributed proportionally to the quality and contribution of research. However, a growing concern in recent years is the phenomenon of citation inequality. This refers to the uneven distribution of citations, where a small number of papers garner a disproportionate share of citations but the vast majority receive significantly fewer [1, 2, 3]. Understanding the dynamics of citation inequality is crucial for several reasons. Firstly, it raises concerns about the fairness and effectiveness of the current evaluation system in academia. Overemphasis on citations can lead to a ‘publish or perish’ mentality, potentially favoring sensational or trendy research over groundbreaking discoveries that take longer to gain recognition. Secondly, citation inequality can hinder the dissemination and application of valuable research, particularly from less established scholars or emerging fields.
Measuring citation inequality is a challenging task that has garnered significant attention in the research community. Interestingly, different approaches have been employed to quantify these measurements, drawing parallels to methods used in assessing economic inequality [2, 4, 5]. The Hirsch index, or h-index, is also widely recognized as a tool for measuring citation inequality, as highlighted by multiple studies [6, 7, 8]. However, in the studies of citation inequality, the generalised entropy index, used in the area of income inequality [9], has not yet been adopted as a useful measure.
Motivated from all these works, here, for the first time, an entropy based diversity measure is used to study the citation inequality. This research article delves into the complexities of citation inequality through an innovative approach utilizing , a concept from information theory, to quantify in scholarly literature. The underlying idea is that an entropy measure allows us to capture the evenness of citation distribution across a set of publications (or, institutions); so higher entropy values illustrate higher diversity and lower inequality of the citation distributions, and vice versa. To be more specific, high entropy signifies more even distribution of citation, while low entropy indicates a concentrated distribution with a few highly-cited papers. In general, means how spread out individuals are within a group with respect to a certain trait, that can be easily categorized or measured by . It may be mentioned here that assessing within a population is a crucial issue across various applied sciences, such as ecology, biology, economics, sociology, physics, and management sciences; see, e.g., [10, 11, 12, 13].
In the literature, we mostly find the use of classical Shannon entropy as the entropy-based diversity measure in different contexts [14, 15, 16]. However, in this study, we use a new measure for diversity quantification, based on the concept of [17, 18], to analyze the citation diversity across a range of scenarios. Firstly, we analyze the citation diversity of top-ranked institutions in different countries around the world, which allows us to explore potential geographical variations in citation diversity. Then, we extend our investigation to analyze the diversity of citations received by the publications of top award winning scientists (Nobel prize winners, Abel winners and Turing award winners). This analysis will encompass various disciplines, ensuring a holistic understanding of citation patterns in research publications across different academic fields. We also explore the time evolution of the citation diversity of the award winning scientists by analysing the diversity of recent and century old award winners across various disciplines. Finally, we dis-aggregate our findings by gender, enabling a nuanced exploration of potential gender-based disparities in citation practices of various academic disciplines. This entropy-based multifaceted approach on citation diversity offers a detailed picture, capturing the subtlety and variations in citation distribution within the scientific landscape.
This research facilitating an understanding of in scholarly literature is presented in a clear and logical structure. In Section II, we outline the data sources for citation information and meticulously describe the data employed in the study. We provide details regarding the selection criteria for the award winning scientists, the specific disciplines included, and the identification process for top institutes across different countries. Section III serves as the foundation of our analysis. We provide a step-by-step analytical framework in developing the concept of general class of logarithmic norm entropy and its use as a measure of citation diversity. Section IV presents the findings of our investigation where we delve into the analysis of citation diversity across various scenarios and the significance of our findings are also presented in this section. Finally a concise summary of our key findings are provided in Section V, describing the main takeaways from the analysis of citation diversity across disciplines, institutions, and publication references. Furthermore, we have discussed the broader implications of our research and potential avenues for future inquiry.
II Data Description
The ‘Ranking Web of Universities’ (also commonly known as the Webometrics) [19] is a comprehensive academic ranking system established in 2004, which appears twice per year since 2006. This public resource, developed by the Cybermetrics lab, encompasses over 31,000 higher education institutions (HEIs) across more than 200 countries. Webometrics employs a mix of webometric (all missions) and bibliometric (research mission) indicators to assess university performance, promoting open access to scholarly knowledge. [19] provides the detailed citation data of the top Institutes/ universities across the world through ‘Transparent Ranking: Top Universities by Citations in Top Google Scholar profiles’ [20]. We used the January 2024 edition of this data (retrieved on April 1, 2024) for our citation analysis. The detailed data of the citation counts of top institutes can be found in [19].
Moreover, our study also leverages data from ‘Scopus’ [21], a extensive bibliographic database of peer-reviewed literature. This resource provides publication and citation information for award-winning authors across various disciplines. This unified data source allows for robust comparisons and minimizes potential biases arising from using disparate data sources. To ensure consistency, this data source is utilized for all analyses within this study. We obtained total citation data for 21 scientists in each discipline from ‘Scopus’ [21] on May 23, 2024. Additionally, we collected publication and citation data for individual scientists, including 30 Nobel laureates in physics, chemistry, and physiology/medicine (split evenly between recent and century old awardees), 15 recent Abel prize winners in mathematics, 15 recent Turing award winners in computer science, and 15 recent Nobel laureates in economics from the same source on May 23, 2024.
III Methodology
III.1 General Class of logarithmic norm entropy (LNE) and diversity measure (D)
It was long known that the potential families of entropies can be used as generalised diversity measures [22]. Recently, the concept of logarithmic norm entropy (LNE) has been introduced in [17] as a new measure for quantifying diversity, justified by its better statistical efficiency and robustness properties compared to other existing classes of entropy based diversity measures. Building upon the established concept of Shannon entropy [23] and Renyi entropy [24], the LNE offers a scale-invariant generalization of the latter [18]. In this study, we leverage LNE to quantify citation diversity in scholarly literature. This unique approach allows us to assess the robustness of our findings and gain a more complete understanding of citation diversity patterns.
The generalized classes of Shannon entropy and Renyi entropy are defined, respectively, as:
| (1) |
| (2) |
where is the estimated normalized probability or frequency of the occurrence for the -th group/class among the M possible mutually exclusive groups, for each , and are two parameters (constants). Clearly, at , Eq. (1) and Eq. (2) coincides with the classical Shannon entropy and Renyi entropy, respectively.
In this study, we consider the novel scale-invariant generalization of the Renyi entropy, namely the LNE measure defined as [17]
| (3) |
where are two positive constants (tuning parameters) leading to different entropy measures. At or , the LNE reduces to the Renyi entropy family and is generally symmetric in the choice of . We readily note the limiting interrelations between these entropies as:
Imagine a finite set of categories representing diverse perspectives, denoted by , such as citations across top institutes, the author’s own publications, gender, and discipline-wise variations, where the (discrete) probability distribution of citing a particular perspective in these categories is represented as , with signifying the probability of a publication belonging to category for each . Formally, we define the LNE based diversity measure (in percentage) for such a probability distribution, , given by
| (4) |
Additionally, it is noteworthy that the maximum value of the diversity measure equals for all members of the LNE family regardless of the values of the tuning parameters (). It always lies between to (both inclusive) with higher values indicating greater diversity (and hence lower inequality) and vice versa.
The citation diversity measure (D), based on LNE, will be computed for each country and disciplinary group of prize winning scientists, as well as for individual award winners, replacing with its estimates derived from empirical data. We will also compute these metrics separately among males and females scientists within the award winning cohort.
III.2 Asymptotic standard error and confidence interval
Since we are estimating the LNE based diversity measures based on empirical data, we must additionally quantify the possible extent of statistical errors associated with our estimates to draw more effective conclusions. As proved in [17], such estimates of the diversity measure (D) will be -consistent and asymptotically normal with the asymptotic variance being , where
with the notation for any . Note that, is symmetric in the choice of , as intuitively expected from similar behavior of the LNE measure itself. Since varies continuously in the citation distribution (), we can reliably estimate it using our empirical data by replacing by its estimates . Finally, taking square root of the estimated asymptotic variances, we get the (asymptotic) standared error (say ) of the estimated diversity measure (D), with lower values indicating more reliable diversity estimates.
By utilizing the standard errors (s) of the estimated diversity (D) in all our cases, we have additionally computed and plotted the confidence intervals for the diversity measures as given by . This formula is obtained from the standard theory of statistical inference by utilizing the asymptotic normality of the diversity estimate. Note that, the length of the confidence interval is directly proportional to the standard error, and hence indicates the reliability of the estimated diversity; shorter the confidence interval more reliable our estimates are. Moreover, such confidence intervals also help us to statistically compare the diversity measure for two contexts (e.g., countries, subjects, or scientists); the two diversity values can be inferred to be significantly different at level if the associated confidence intervals do not overlap. This gives us a simple visual way to identify contexts having statistically similar or dissimilar diversities by just comparing the plots of their confidence intervals as presented in the following sections. Throughout our entire analysis, we have used and in the definition of the LNE based diversity to achieve lower (asymptotic) standard error, and hence the shorter confidence interval, based on the illustrations provided in [17].
IV Results and Discussions
IV.1 Citation analysis among top institutes across different countries
There is an increasing interest in world wide university rankings through various metrics [25]. The rich and exhaustive data of motivates one to analyse it from different angles and various perspectives [26]. In the present investigation of we consider the ranking of the universities/ institutes, (), according to their total number of citations (). This helps us in examining the distribution pattern of total citations, across all disciplines, of the world wide top institutions of a country as well as the citation diversity measure (D) among the top institutions of each country. This study helps in delineating the geographical variation [27] of research activities.
IV.1.1 Distribution pattern of citation counts of worldwide top institutes
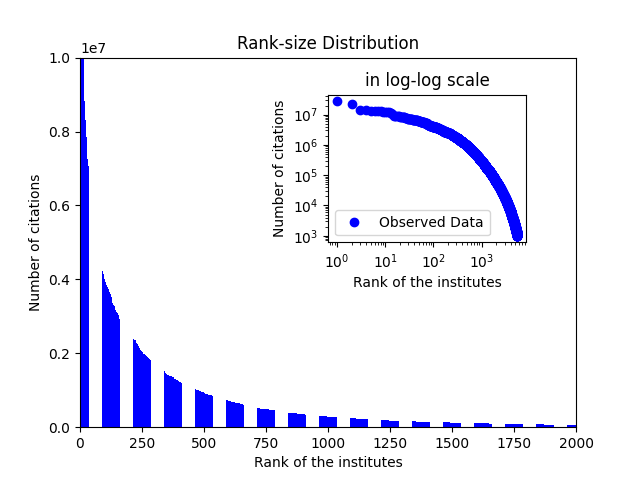
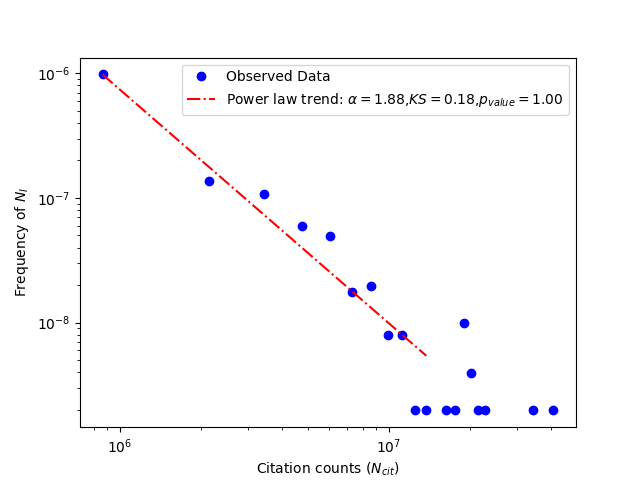
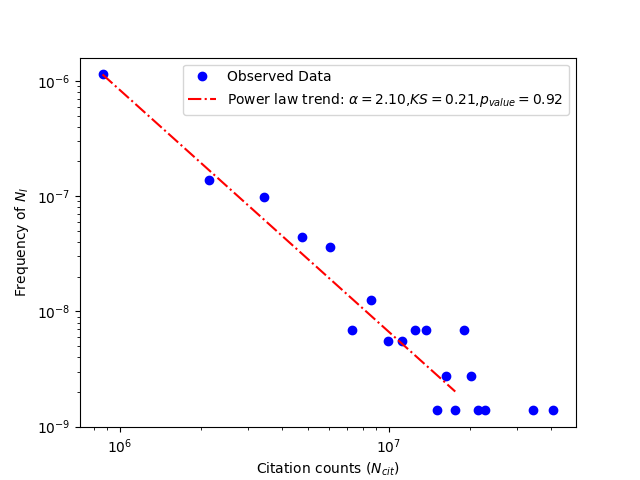
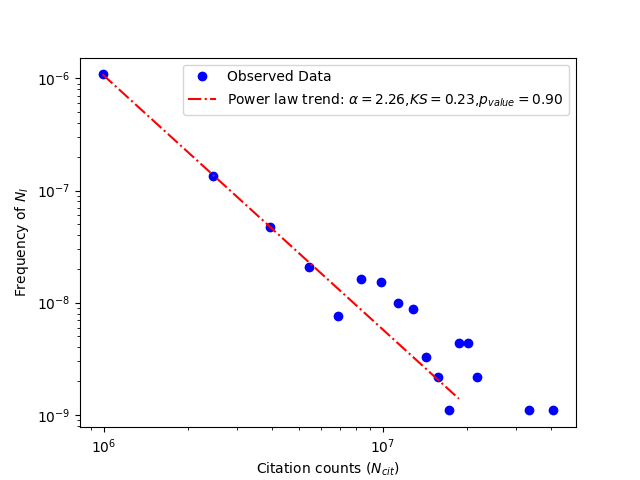
Initially, we examine the distribution pattern of total citation counts corresponding to a large number of institutes/universities () of various countries around the world. According to the Webomterics data (See Appendix for the data), considered for the analysis, rank 1 institute is the Harvard University of USA with citation count 27589889 and the Institute of Technology and Business of Czech Republic corresponds to rank 5661 with citation count 1004. The data furnishing a wide range of variation in . The distribution pattern (Fig. 1) provides valuable insights in understanding how the citation data is spread out or clustered around the world’s leading universities and institutes. Fig. 1(a) is the bar plot for the rank-size distribution, based on the ranks of the institutes and the corresponding size of citation counts ; with an inset displaying the same plot in log-log scale for a clear understanding of the trend. Fig. 1(b) depicts the frequency distribution curve of total citation counts across different institutions in log-log scale. The distribution plot exhibits a power-law behavior in the higher citation end. The robustness of the fitted power law is checked by a goodness-of-fit test yielding satisfactory Kolmogorov-Smirnov distance and -value for the fit.

To proceed further, we consider the citation data of top 10, 20, and 50 institutes or universities from each country across the globe. This data is found to be spread over 72, 55 and 25 countries respectively for top 10, 20 and 50 institutions. It is fascinating to note from Fig. 2 that the power law behaviour holds for all these 3 separate cases also. Each plot in the figure is accompanied with its respective KS distance and -value for the fit as well as the corresponding power law exponent . However, there is a variation in the value of the exponent with the change in the number of institutions considered for the analysis. The adherence of the consistent pattern of power law in the higher end of the citation counts indicates a predictable relationship between the rank of an institution and its citation count across different scales. Some recent studies have also demonstrated this power law trend in citation analyses [28, 29, 30].
IV.1.2 Citation diversity in top institutes across the globe
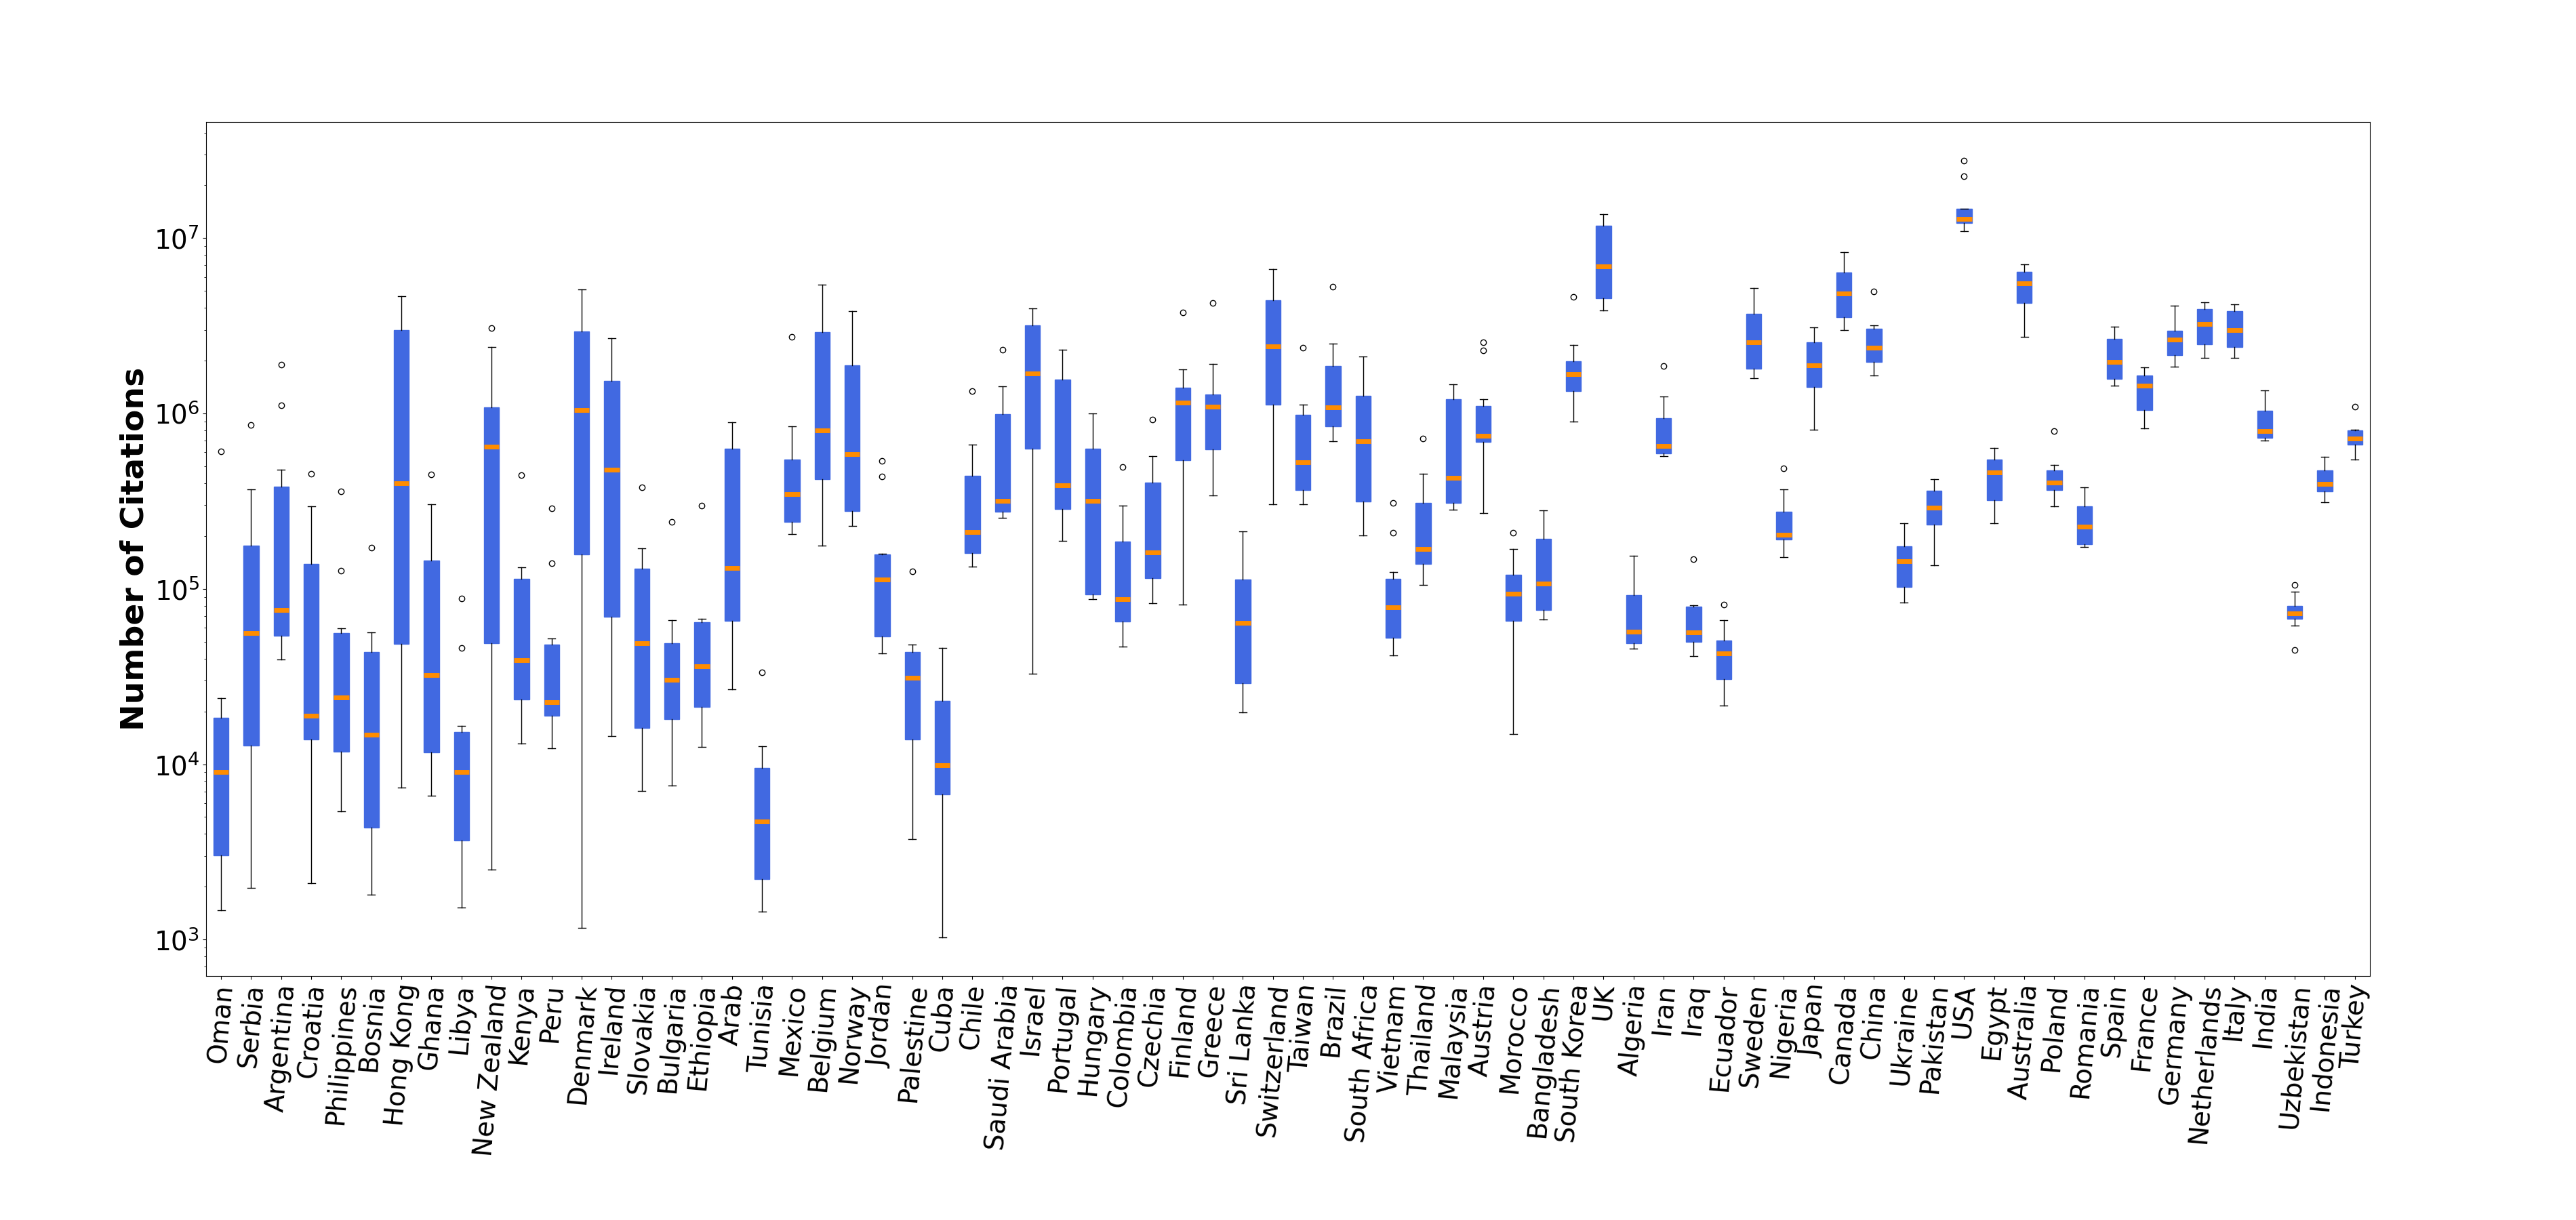
This part of the discussion zooms on the diversity in the distribution of the citations of the top institutes or universities within each country. We employ the calculated D values, as previously explained in Section III, derived from the total citation count across all disciplines for each country’s top 10, 20, and 50 institutions. This approach allows us to classify the countries based on these diversity values (D) and also into 3 subgroups within each country based on high, medium and low citation counts (). Tables 1,2 and 3 provide detailed breakdown of these grouping, respectively, for the top 10, 20 and 50 institutions across various nations; associated confidence intervals of the diversity measures are presented in Figs. 1,4 and 5, respectively, along with box-plot visualizations of the raw total citation data in each cases. Given the wide range of counts per country, we use a logarithmic scale for the y-axis in our box-plots (Figs. 3(b),4(b),5(b)) to effectively capture and represent the distribution of citation counts within different countries.
In general, we have noted that some countries, despite having a high count, do not necessarily have high D values. Conversely, there are countries with lower counts that exhibit very high D values. Therefore, a combined analysis offers insights into both the overall diversity and the spread of citations among top institutes/universities across various countries.
Results for top 10 institutions
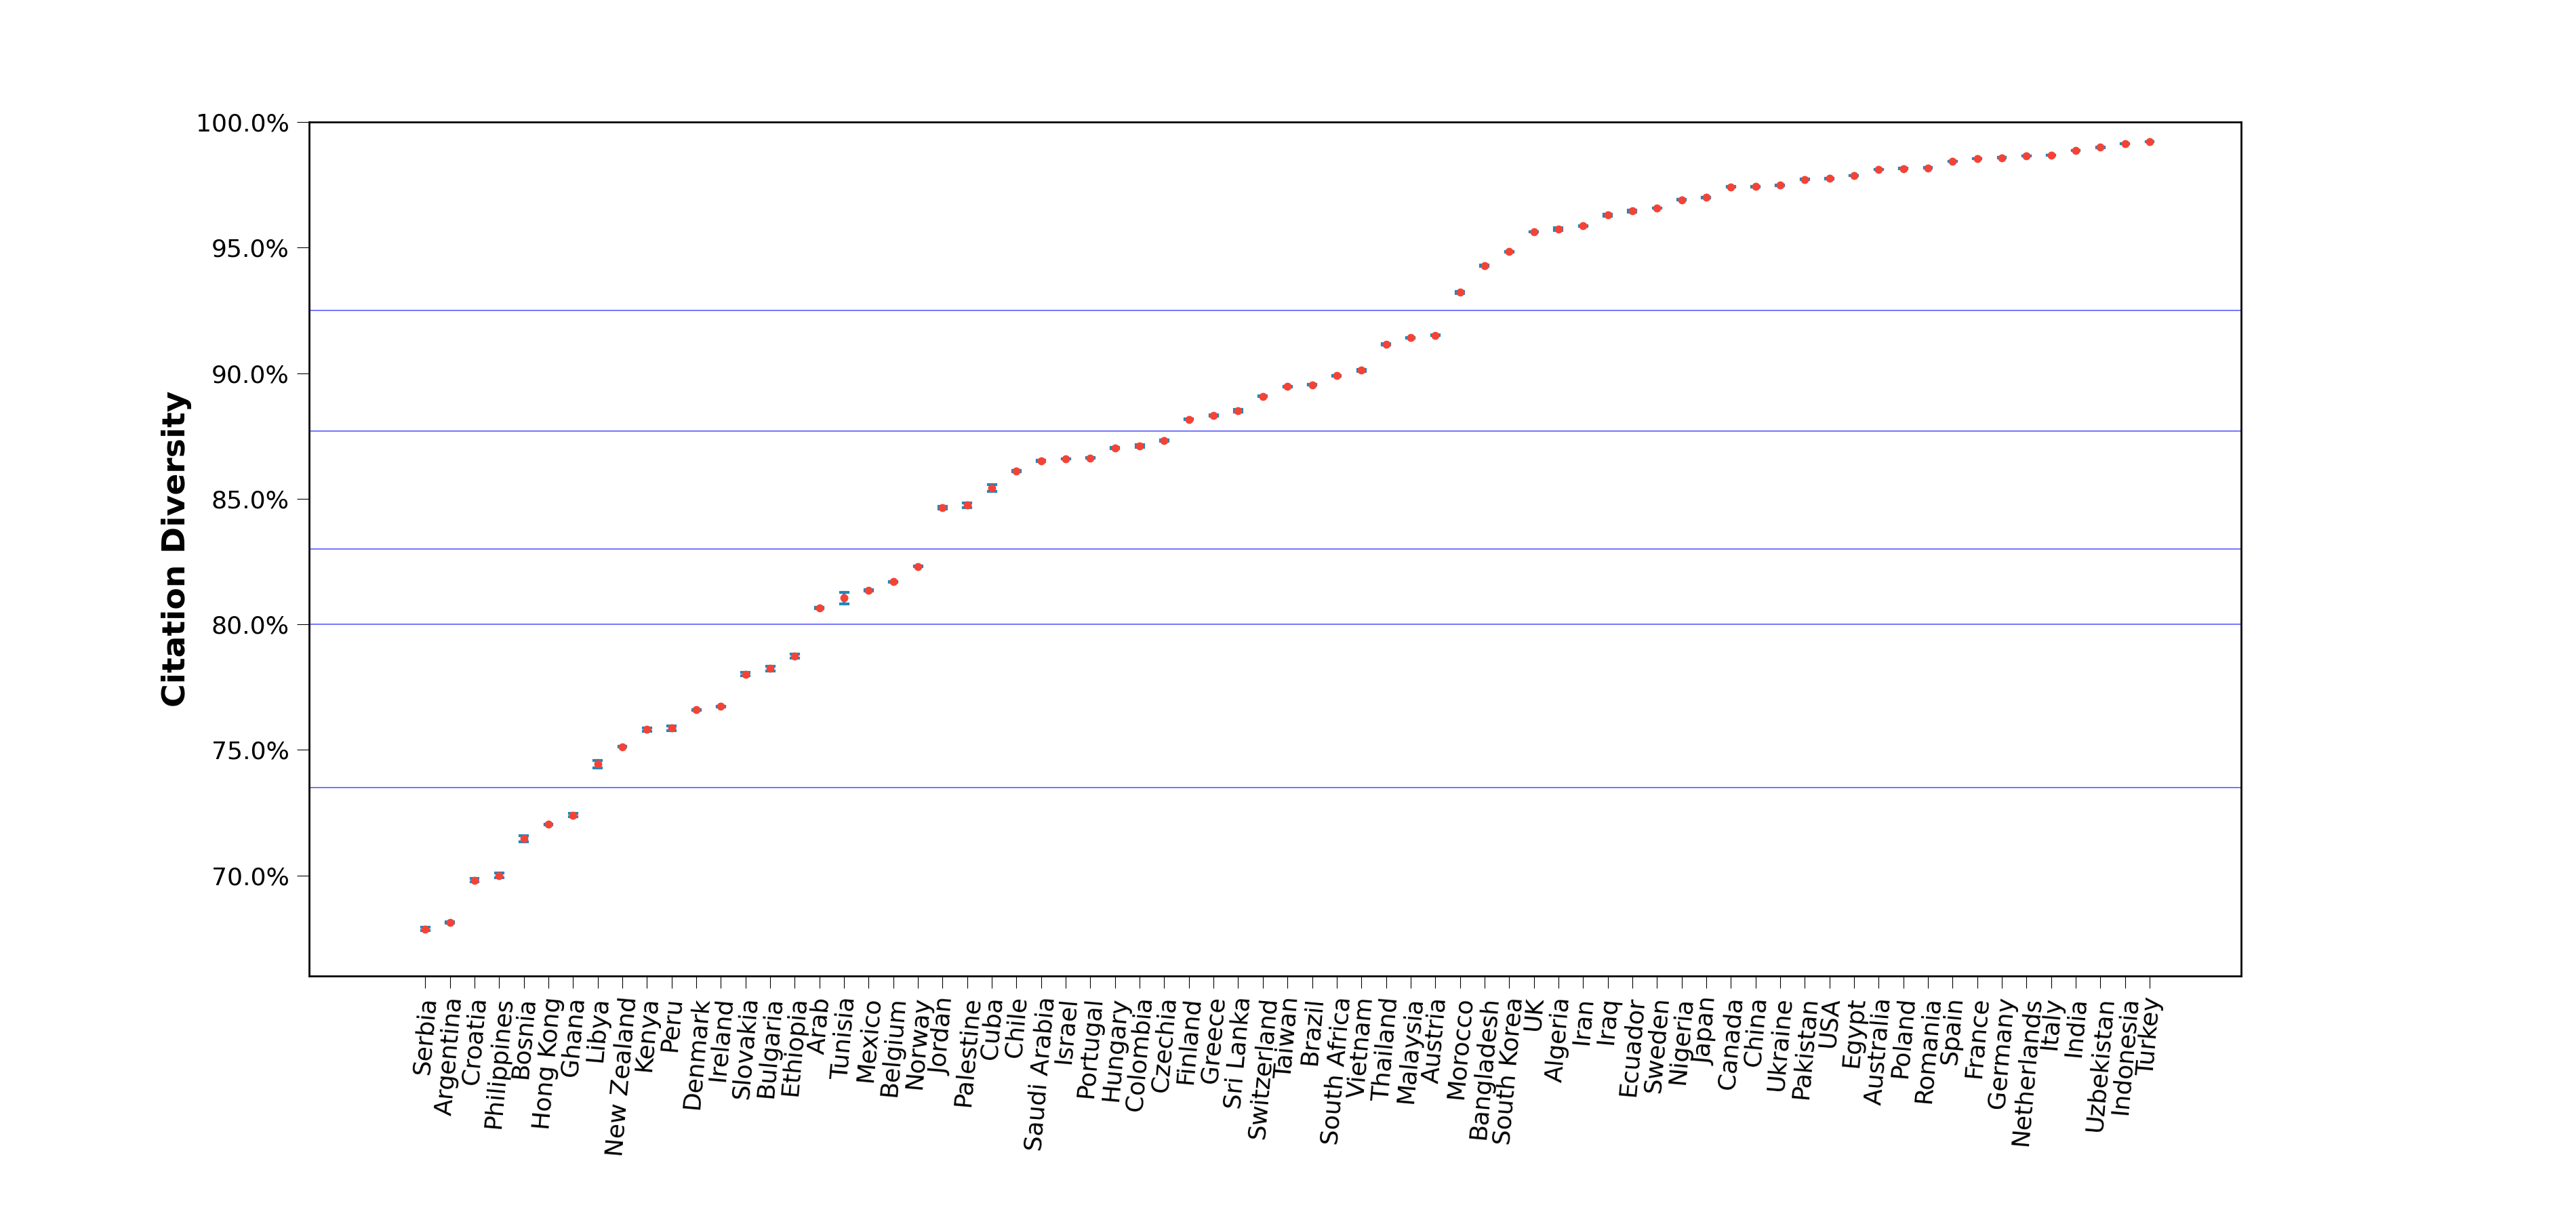
In this analysis of top 10 institutes across various countries, we examine 72 countries and divide them into six distinct groups (Group A - Group F) based on their decreasing diversity values (D), with each group being closely homogeneous in terms of their values of D. Each of these groups are again divided into 3 subgroups based on high, medium, and low citation counts for each country (see Table 1). For example, Group A countries with very high D, can be sub-grouped into A1, A2 and A3 group of countries with high, medium and low counts respectively. Notably, Fig. 3(a) highlights the remarkably small confidence interval for each country’s citation diversity, signifying a high degree of certainty in our diversity estimates.
It is evident from the count data of Table 1 that, within Group A, the USA stands out as the most highly cited country when examining its top 10 institutions. However, our analysis reveals a different leader in Group A, with Turkey emerging as the country with the highest citation diversity (lowest citation inequality). In Group B, while Switzerland emerges as the most frequently cited country, our study shows that Austria exhibits the highest citation diversity within the group. This indicates that although Switzerland may dominate in terms of citation volume, Austria’s citations are more evenly distributed. Conversely, Finland, despite being a part of the highly cited subgroup B1, registers the lowest citation diversity in Group B, suggesting a more concentrated citation pattern. Meanwhile, in Group D, Belgium stands out as the most frequently cited country, yet Norway surpasses it in citation diversity, indicating a wider spread of citations across top Norwegian institutes/universities.In all other groups and subgroups similar kind of results can be inferred. It is apparent that relying solely on total citation value or average citation counts fails to adequately appreciate the impression of citation analysis; the citation diversity measures are also required for a complete picture.
| Group | Sub-Gr. | Country | D | |
| A1 | USA | 15258270.00 | 97.86 | |
| UK | 8033507.00 | 95.74 | ||
| Australia | 5196256.00 | 98.23 | ||
| Canada | 5156112.00 | 97.53 | ||
| Netherlands | 3205991.00 | 98.76 | ||
| Italy | 3118657.00 | 98.79 | ||
| Sweden | 2823378.00 | 96.69 | ||
| Germany | 2718800.00 | 98.69 | ||
| China | 2607126.00 | 97.54 | ||
| Spain | 2117867.00 | 98.55 | ||
| Japan | 1924270.00 | 97.10 | ||
| South Korea | 1913191.00 | 94.94 | ||
| Gr. A | France | 1358776.00 | 98.65 | |
| countries | A2 | India | 897276.80 | 98.98 |
| Iran | 848094.30 | 95.97 | ||
| Turkey | 742169.30 | 99.33 | ||
| Egypt | 441066.70 | 97.98 | ||
| Poland | 438283.70 | 98.25 | ||
| Indonesia | 415959.30 | 99.25 | ||
| Pakistan | 287339.10 | 97.83 | ||
| Nigeria | 251443.80 | 97.02 | ||
| Romania | 244935.50 | 98.29 | ||
| Ukraine | 146194.00 | 97.59 | ||
| Bangladesh | 142648.90 | 94.38 | ||
| A3 | Morocco | 98366.10 | 93.33 | |
| Algeria | 75732.40 | 95.84 | ||
| Uzbekistan | 74695.20 | 99.10 | ||
| Iraq | 68101.10 | 96.40 | ||
| Ecuador | 43819.60 | 96.56 | ||
| B1 | Switzerland | 2883689.00 | 89.18 | |
| Brazil | 1679322.00 | 89.64 | ||
| Greece | 1306760.00 | 88.41 | ||
| Finland | 1247269.00 | 88.27 | ||
| Gr. B | Austria | 1054539.00 | 91.61 | |
| countries | B2 | South Africa | 845386.70 | 90.00 |
| Taiwan | 764616.10 | 89.57 | ||
| Malaysia | 729253.30 | 91.51 | ||
| Thailand | 259906.40 | 91.24 | ||
| Vietnam | 108368.90 | 90.21 | ||
| B3 | Sri Lanka | 87499.50 | 88.61 |
| Group | Sub-Gr. | Country | D | |
| C1 | Israel | 1897026.00 | 86.68 | |
| C2 | Portugal | 880957.10 | 86.72 | |
| Saudi Arabia | 732839.40 | 86.61 | ||
| Gr. C | Hungary | 396155.60 | 87.13 | |
| countries | Chile | 383313.90 | 86.19 | |
| Czechia | 299917.30 | 87.42 | ||
| Jordan | 171519.80 | 84.74 | ||
| Colombia | 154868.40 | 87.20 | ||
| C3 | Palestine | 35691.80 | 84.84 | |
| Cuba | 16006.10 | 85.54 | ||
| D1 | Belgium | 1819939.00 | 81.79 | |
| Gr. D | Norway | 1149549.00 | 82.40 | |
| countries | D2 | Mexico | 627030.00 | 81.44 |
| Arab | 314101.00 | 80.75 | ||
| D3 | Tunisia | 8102.40 | 81.14 | |
| E1 | Denmark | 1631915.00 | 76.68 | |
| E2 | New Zealand | 906472.50 | 75.22 | |
| Ireland | 893135.80 | 76.82 | ||
| Gr. E | E3 | Kenya | 93166.60 | 75.90 |
| countries | Slovakia | 92479.90 | 78.11 | |
| Ethiopia | 63702.60 | 78.83 | ||
| Peru | 62510.60 | 75.95 | ||
| Bulgaria | 51697.10 | 78.33 | ||
| Libya | 19220.90 | 74.52 | ||
| F1 | Hong Kong | 1570705.00 | 72.12 | |
| F2 | Argentina | 394459.70 | 68.21 | |
| Gr. F | Serbia | 170841.90 | 67.95 | |
| countries | Ghana | 109620.90 | 72.45 | |
| Croatia | 105208.20 | 69.88 | ||
| F3 | Philippines | 67549.00 | 70.09 | |
| Bosnia | 34852.90 | 71.55 | ||
| Outlier | Oman | 69586.90 | 41.06 |
Results for top 20 institutes
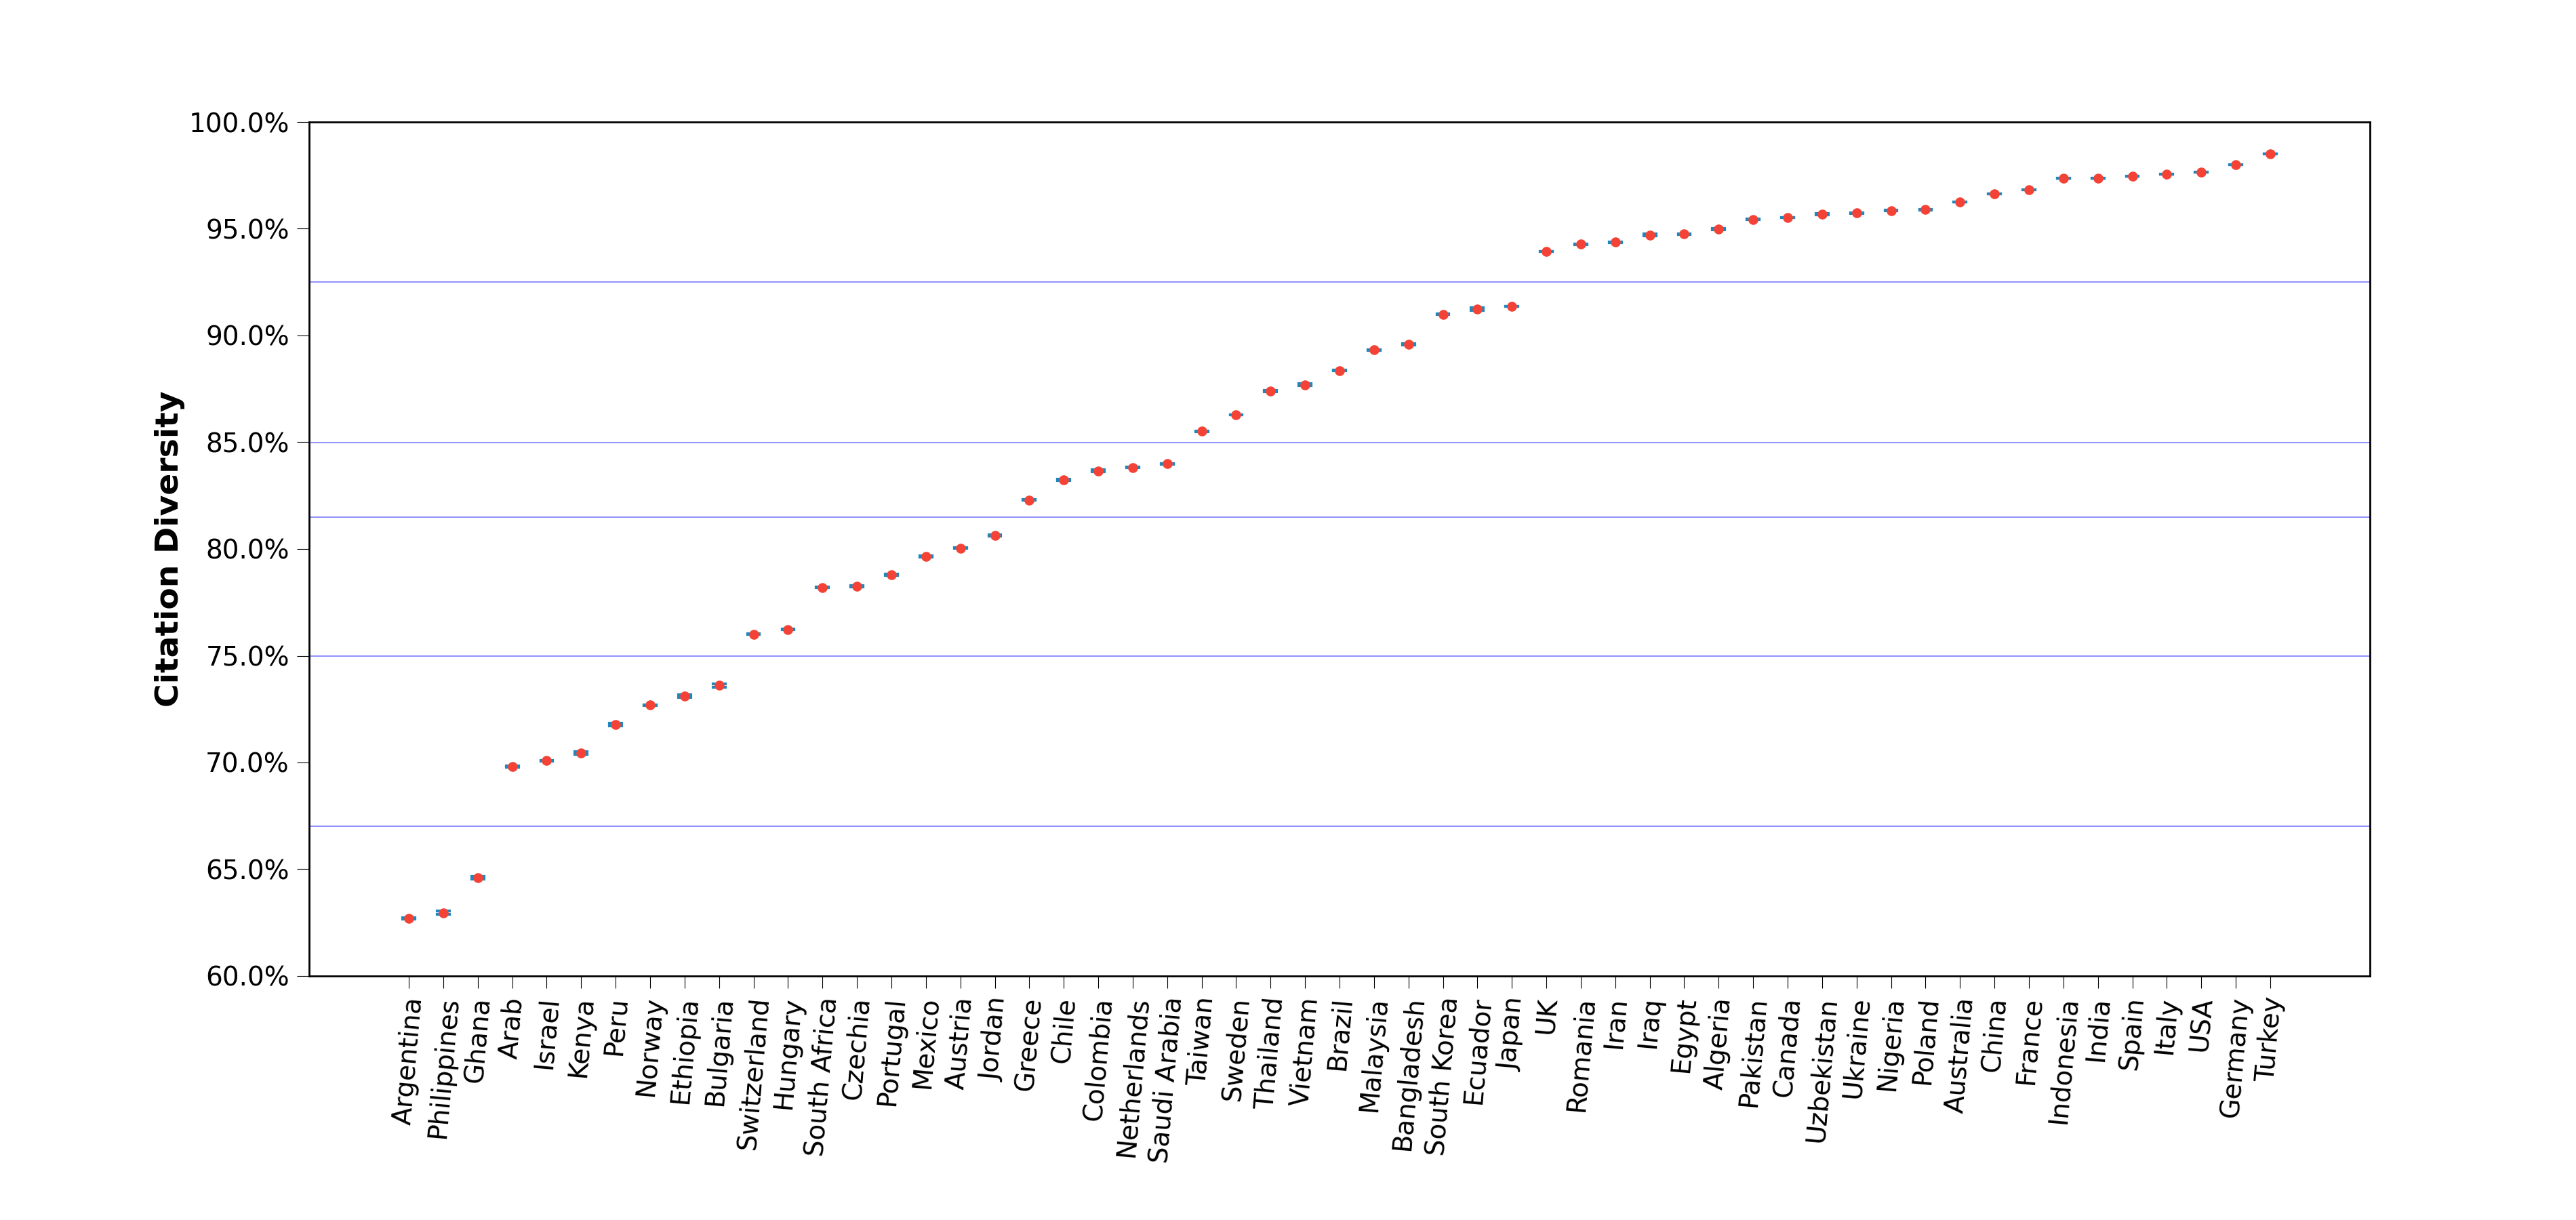
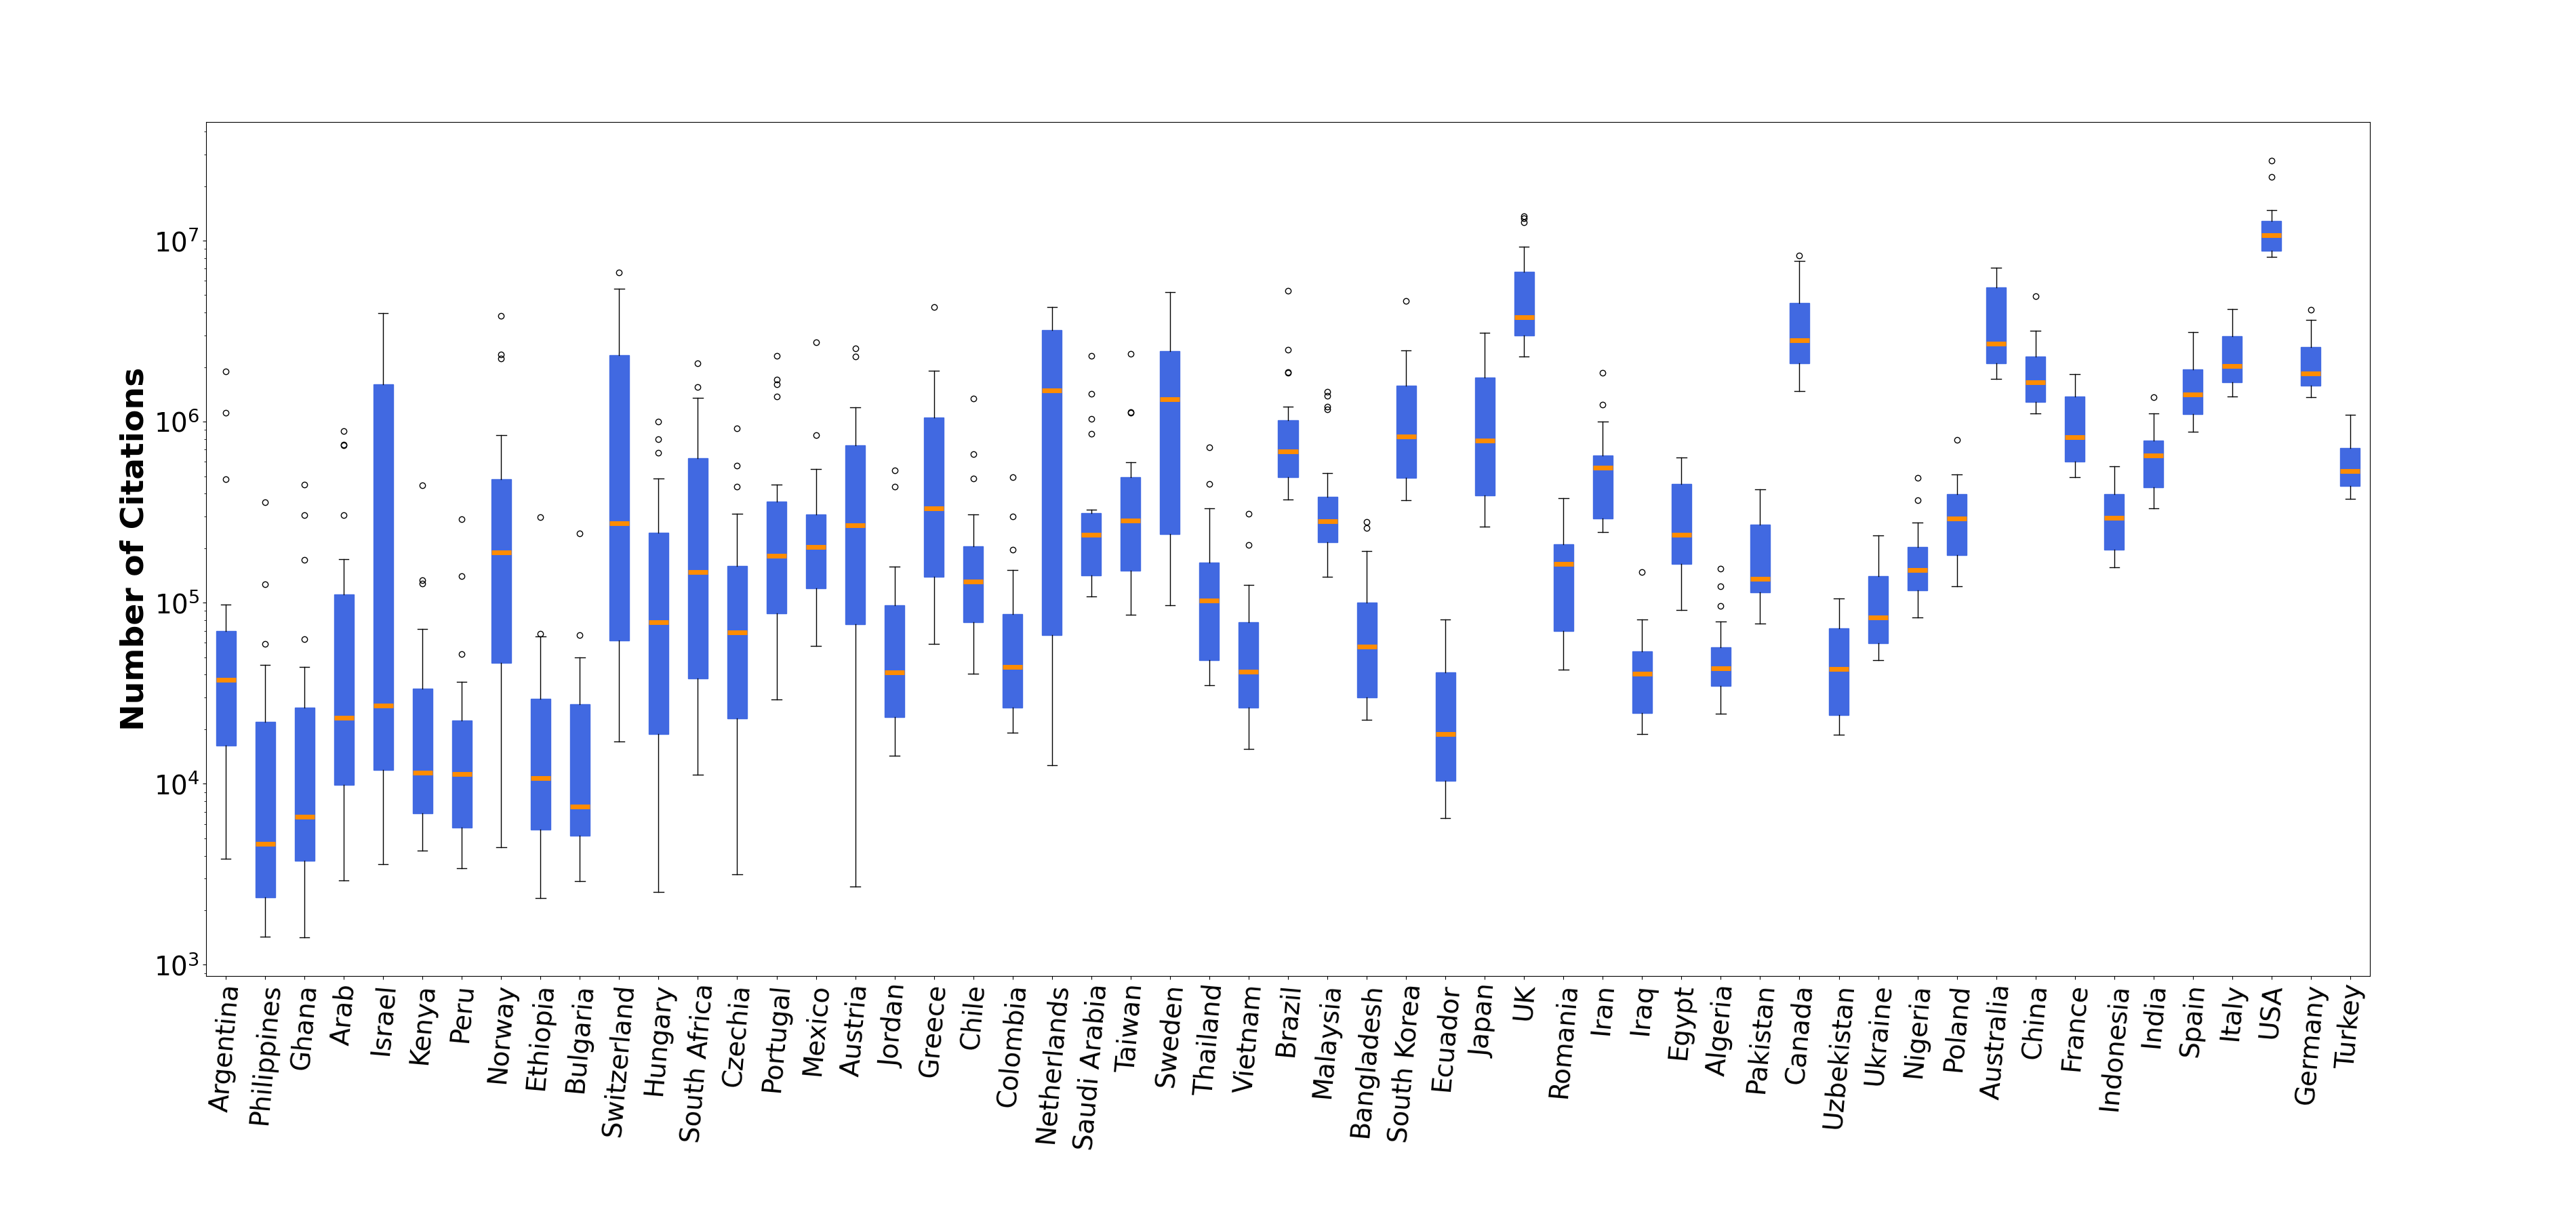
By broadening our analysis to include the top 20 institutes, we have been able to study 55 countries across the globe as per the availability of data. In this case, we observe significant changes, compared to top 10 institutions, in the diversity measure (D) and the average citation count () for each country. The countries are again grouped as per their values of D and as in the case of top 10 institutes (Table 2 and Fig. 4). This expanded view makes the distinctions between countries based on these metrics more apparent. For instance, Israel is initially ranked in Group C with high D and maximum within this group when considering the top 10 institutes. However, when the scope is broadened to include the top 20 institutes, its performance metrics decline, moving it to Group E with a significantly lower D value. Similarly, the Netherlands is categorized in Group C with lower D and values when examining the top 20 institutes, but rises to Group A with much higher D and values when focusing on the top 10 institutes. In contrast, while considering the top 10 institutes, Morocco is positioned in Group A with a much higher D and values, but completely drops out of the rankings when the scope is expanded to the top 20 institutes.
| Group | Sub-Gr. | Country | D | |
| A1 | USA | 12105340.00 | 97.63 | |
| UK | 5523985.00 | 93.92 | ||
| Australia | 3715297.00 | 96.24 | ||
| Canada | 3638187.00 | 95.51 | ||
| Italy | 2367446.00 | 97.54 | ||
| Germany | 2143908.00 | 97.98 | ||
| China | 1955727.00 | 96.63 | ||
| Spain | 1613509.00 | 97.44 | ||
| A2 | France | 993184.30 | 96.82 | |
| Gr. A | India | 671044.80 | 97.36 | |
| countries | Iran | 599467.90 | 94.36 | |
| Turkey | 594240.60 | 98.50 | ||
| Poland | 310970.30 | 95.89 | ||
| Indonesia | 307798.30 | 97.35 | ||
| Egypt | 300285.20 | 94.75 | ||
| Pakistan | 199903.00 | 95.42 | ||
| Nigeria | 183957.10 | 95.84 | ||
| Romania | 164146.60 | 94.27 | ||
| Ukraine | 104113.40 | 95.73 | ||
| A3 | Algeria | 54751.30 | 94.98 | |
| Uzbekistan | 51147.85 | 95.67 | ||
| Iraq | 48109.00 | 94.70 | ||
| B1 | Sweden | 1570605.00 | 86.28 | |
| South Korea | 1205591.00 | 90.98 | ||
| Japan | 1181852.00 | 91.35 | ||
| Brazil | 1086417.00 | 88.35 | ||
| Gr. B | B2 | Malaysia | 466856.50 | 89.32 |
| countries | Taiwan | 458992.30 | 85.50 | |
| Thailand | 159469.00 | 87.40 | ||
| B3 | Bangladesh | 87134.20 | 89.57 | |
| Vietnam | 68064.05 | 87.69 | ||
| Ecuador | 26947.45 | 91.23 |
| Group | Sub-Gr. | Country | D | |
| C1 | Netherlands | 1699040.00 | 83.82 | |
| Gr. C | C2 | Greece | 743842.40 | 82.29 |
| countries | Saudi Arabia | 441429.00 | 83.99 | |
| Chile | 230567.20 | 83.22 | ||
| C3 | Colombia | 91812.10 | 83.66 | |
| D1 | Switzerland | 1491331.00 | 76.01 | |
| D2 | Austria | 569110.70 | 80.03 | |
| Gr. D | Portugal | 480006.50 | 78.79 | |
| countries | South Africa | 444548.00 | 78.19 | |
| Mexico | 372942.90 | 79.65 | ||
| Hungary | 208885.20 | 76.23 | ||
| Czechia | 162180.00 | 78.25 | ||
| D3 | Jordan | 98843.60 | 80.62 | |
| E1 | Israel | 954046.30 | 70.07 | |
| Norway | 606315.00 | 72.68 | ||
| Gr. E | Arab | 161761.90 | 69.81 | |
| countries | E2 | Kenya | 50018.80 | 70.45 |
| Ethiopia | 34585.35 | 73.11 | ||
| Peru | 34206.85 | 71.77 | ||
| Bulgaria | 28378.05 | 73.60 | ||
| Gr. F | F1 | Argentina | 206299.20 | 62.71 |
| countries | F2 | Ghana | 56659.70 | 64.61 |
| Philippines | 34953.20 | 62.96 |
Results for top 50 institutes
When we focus on the citation data for the worldwide top 50 institutes, we get data only on 25 countries whose diversity values are calculated from their total citations (Table 3 and Fig. 5). In the analysis, when focusing on the top 50 institutions, Taiwan and Thailand fall into Group E, characterized by lower D values. However, when considering only the top 20 institutions in these countries, they move to Group B, which has comparatively higher D values. Conversely, Spain is placed in Group A with high D and values when considering the top 20 institutions, but it shifts to Group B with lower D and values when the top 50 institutions are considered. In Group C, Canada is grouped with South Korea, Japan, and others, sharing similar D values but with significantly different values when considering the top 50 institutions. However, when focusing on the top 20 institutions, Canada moves to Group A, while South Korea and Japan are in Group B, with different D values.
| Group | Sub-Gr. | Country | D | |
| A1 | USA | 8666838.00 | 97.52 | |
| Italy | 1431165.00 | 94.79 | ||
| Gr. A | Germany | 1303227.00 | 94.89 | |
| countries | China | 1211080.00 | 94.82 | |
| A2 | India | 402849.20 | 94.82 | |
| Turkey | 378319.00 | 96.41 | ||
| Indonesia | 173539.30 | 93.51 | ||
| A3 | Ukraine | 61362.62 | 93.61 | |
| B1 | UK | 3022509.00 | 90.76 | |
| B2 | Spain | 883924.30 | 91.84 | |
| Gr. B | France | 539431.30 | 92.22 | |
| countries | Iran | 309750.10 | 89.44 | |
| Poland | 164158.20 | 91.01 | ||
| Pakistan | 104250.40 | 90.43 | ||
| B3 | Nigeria | 96024.60 | 90.45 |
| Group | Sub-Gr. | Country | D | |
| C1 | Canada | 1675403.00 | 85.43 | |
| Gr. C | C2 | South Korea | 581050.20 | 84.85 |
| countries | Japan | 562057.30 | 85.12 | |
| C3 | Uzbekistan | 24379.08 | 87.26 | |
| Iraq | 23362.16 | 87.47 | ||
| Gr. D countries | D1 | Brazil | 501581.10 | 81.43 |
| D2 | Egypt | 132562.70 | 82.92 | |
| Gr. E | E1 | Taiwan | 200544.00 | 76.34 |
| countries | Mexico | 158899.30 | 70.76 | |
| E2 | Thailand | 68940.40 | 77.37 |
In conclusion, our novel citation diversity metric demonstrates its superiority over simple total citation counts in capturing a nation’s research landscape. We observed significant variations in diversity depending on different numbers of top institutes. For instance, Israel’s diversity dropped from (top 10) to (top 20), even falling out of the top 50 list altogether, indicating that the country has fewer than 50 renowned institutes. This highlights the crucial influence of a country’s concentration of high-performing institutes on its overall diversity score. Moreover, we observe that while the UK exhibits very high total citations across its top 10, 20, and 50 institutes, it is only classified in group A, characterized by a diversity range of 93% to 99%, when considering its top 10 and 20 institutes. However, when the top 50 institutes are taken into account, despite the high citation counts, the diversity value decreases, placing the UK in group B, with a diversity range of 89% to 93%. This indicates that although the UK maintains a strong citation performance, the citation diversity varies significantly with the number of institutes considered. When focusing on a smaller number of top institutes, the UK demonstrates a broader citation diversity, suggesting a wide-reaching influence of its most prominent research institutions. Conversely, India and USA displayed remarkable consistency in its diversity across all three institute tiers, suggesting a more balanced distribution of citations. However, expanding the scope to include more institutes reveals a drop in diversity, implying a more concentrated citation pattern. This highlights the importance of considering both citation count and diversity to fully understand the impact and reach of a country’s research output across different academic institutions across the globe. This analysis underscores the importance of considering citation distribution within a country, which total citation counts alone cannot effectively capture. Total citation counts often mask the underlying distribution of citations, potentially misleading interpretations. By employing our novel metric, we gain a clearer picture of how citations are distributed across a country’s top research institutions. Our approach provides a more nuanced understanding of a nation’s research landscape by revealing the distribution of citations amongst its leading institutions.
IV.2 Citation diversity in various scientific disciplines
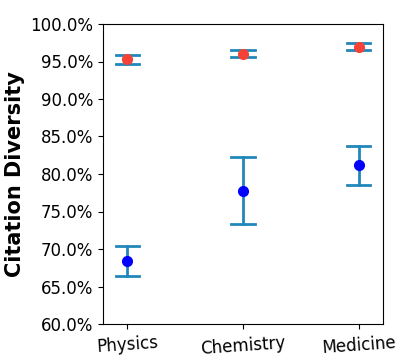
Our citation diversity analysis in the previous section has been performed at the institutional level, irrespective of individual scientists or any specific scientific discipline. We now shift our focus to study the citation diversity in the publication data of various scientific disciplines. We specifically explore the citation data of 126 internationally acclaimed elite researchers, in six important disciplines; physics, chemistry, mathematics, computer science, economics and physiology/medicine, 21 from each discipline. Additionally, to see whether the citation pattern in various scientific disciplines has changed over recent times or not, we also explored the citation data of a total of 63 Nobel prize winners in physics, chemistry and physiology/medicine.
IV.2.1 Award winning scientists in recent times in different scientific disciplines
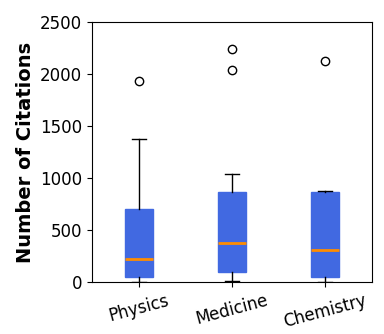
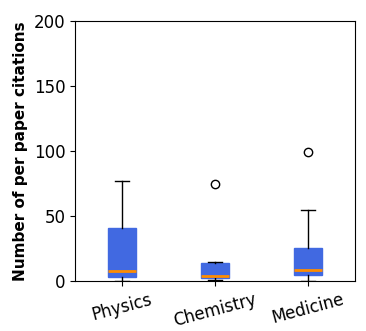
To develop a thorough understanding of citation diversity in different scientific disciplines, we implement our methodology from three distinct viewpoints. Table 4 showcases the calculated D values and counts per scientist for every discipline and Fig. 6 depicts these diversity measures, along with their 95% confidence intervals, and the distributions of individual numbers through their box-plots.
| Total Citation | Total Publication | Per-paper Citation | ||||
|---|---|---|---|---|---|---|
| Disciplines | D | D | D | |||
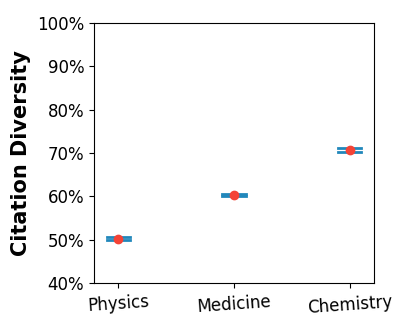
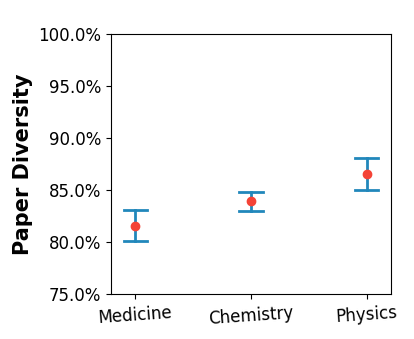
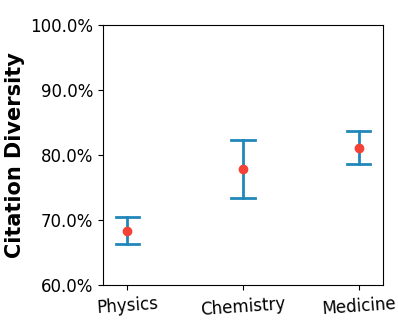
| Physics (2017-2023) | 35982.52 | 93.91 | 364.71 | 92.73 | 121.00 | 95.41 |
| Chemistry (2015-2023) | 50636.52 | 93.38 | 366.90 | 92.65 | 153.70 | 97.14 |
| Mathematics (2007-2023) | 7117.48 | 89.89 | 89.62 | 90.80 | 82.48 | 94.63 |
| Computer Science (2010-2023) | 54503.90 | 74.22 | 228.95 | 89.06 | 236.53 | 84.47 |
| Economics (2013-2023) | 19426.90 | 93.97 | 92.10 | 95.85 | 240.22 | 94.47 |
| Physiology/Medicine (2014-2023) | 48794.19 | 93.52 | 330.57 | 91.77 | 165.82 | 96.20 |
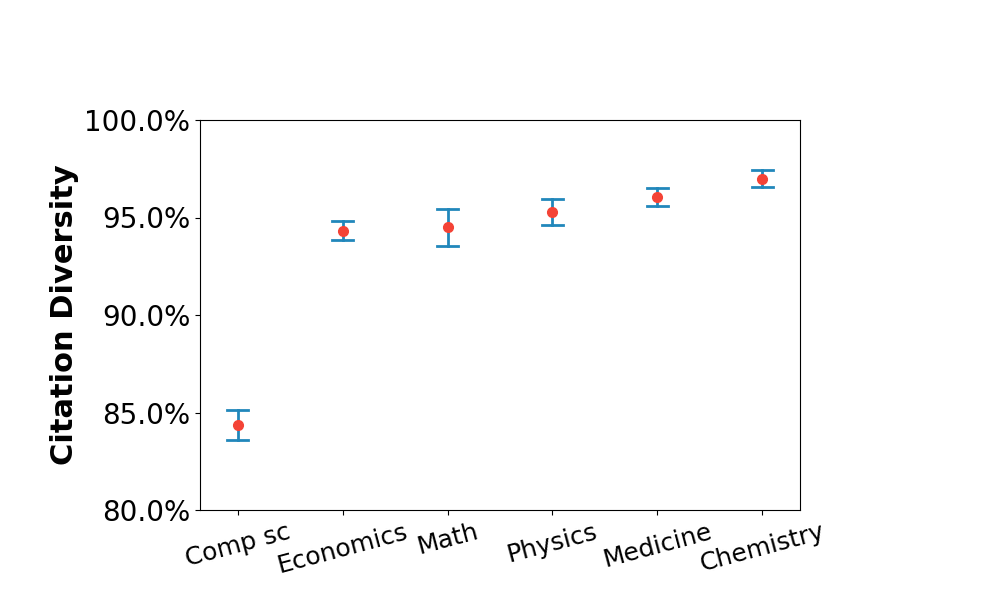
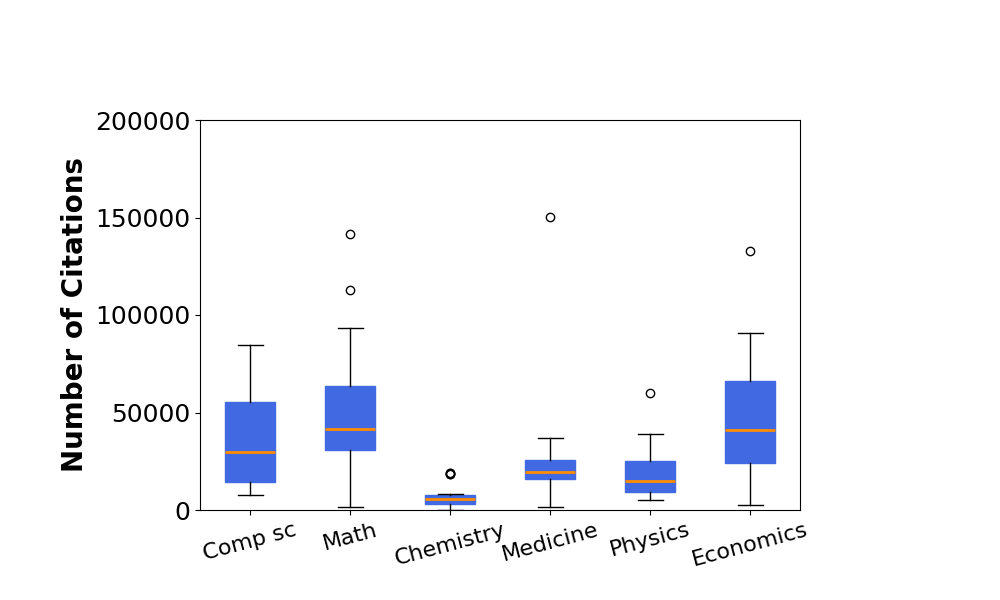
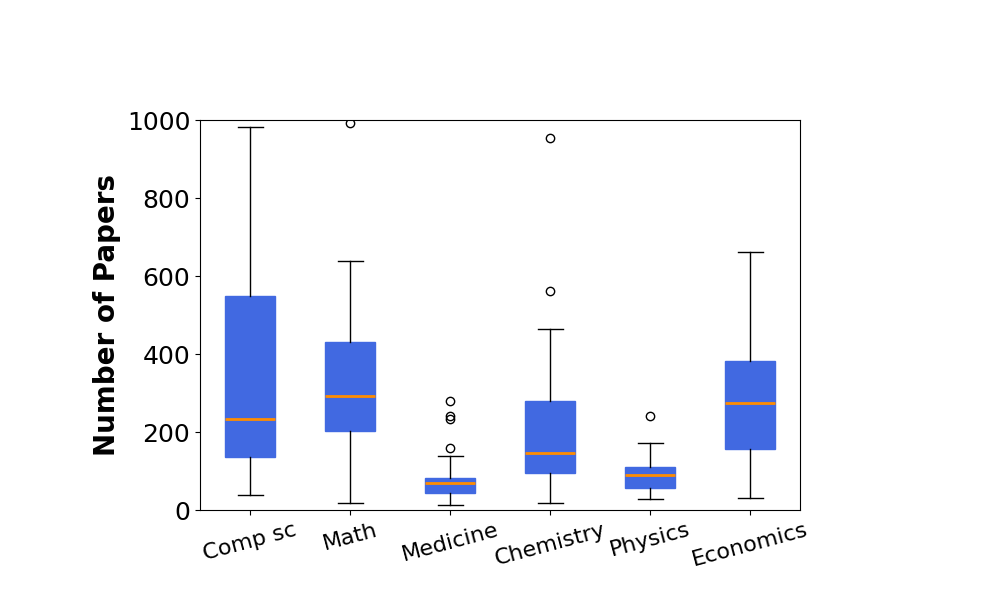
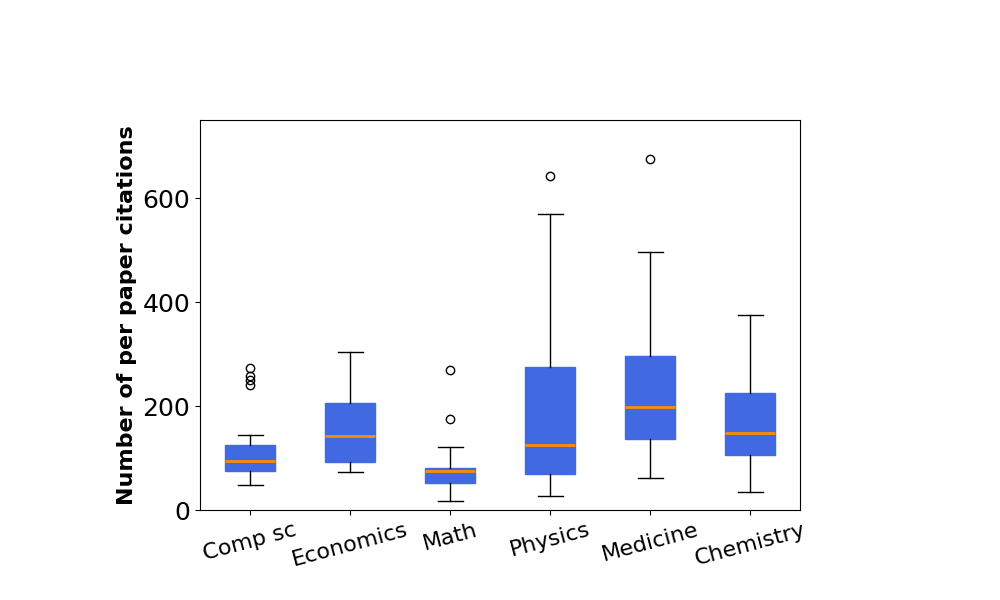
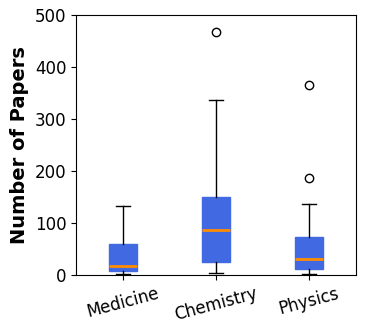
It is noted that count per scientist in mathematics is minimum whereas its D value is not so low. On the other hand, the count per scientist in computer science is maximum but its D value is the lowest. So we can say that the citation inequality of award winners in computer science is very high as compared to the other disciplines. Additionally, we observe that the diversity of papers in computer science is relatively low compared to other subjects. However, the difference in paper diversity among various other subjects is not as pronounced as the difference in citation diversity between computer science and them.
IV.2.2 Award winning scientists in old times in three principal disciplines
We now extend our analysis to examine the citation diversity in the publication of century old Nobel winning scientists in physics, chemistry and physiology/medicine. We employ the three aforementioned viewpoints to calculate diversity percentage values for each discipline across historical periods (Table 5). Fig. 7 illustrates their citation diversity and count distributions (box-plots).
| Total Citation | Total Publication | Per-paper Citation | ||||
|---|---|---|---|---|---|---|
| Disciplines | D | D | D | |||
| Physics (1901-1921) | 2270.81 | 50.27 | 37.24 | 86.63 | 46.55 | 68.47 |
| Chemistry (1901-1927) | 1159.67 | 70.83 | 131.76 | 84.02 | 9.50 | 77.91 |
| Physiology/Medicine (1901-1931) | 1979.43 | 60.39 | 63.10 | 81.70 | 19.30 | 81.27 |
It is evident that, in earlier period, the diversity values for physics were the lowest in both the total citation and per-paper citation perspectives. However, in terms of the total publication perspective, physics had the highest diversity value. This suggests that citation inequality in physics was significant in previous times, whether considering the total citations or per-paper citations of award winners in this discipline. Conversely, the number of papers in physics was more evenly distributed compared to the other two subjects in historical time, as indicated by the higher diversity value for total publications. Additionally, the average citation count for chemistry was the lowest in both total citation and per-paper citation perspectives, while for the total publication, physics had the minimum average citation count. This again demonstrates that to obtain an exhaustive understanding of citation analysis, it is essential to look at the citation diversity values along with the citation counts of the publication data.
IV.2.3 Comparing citation diversity between recent and old times award winners in three principal disciplines
We now compare the citation diversity values across three principal disciplines between recent and old times. Table 6 shows the D values for both recent and past times from 3 different viewpoints. Fig. 8 clearly illustrates a significant increase in D in recent times for all three disciplines in all cases.
| D in Recent times | D in Old times | |||||
|---|---|---|---|---|---|---|
| Disciplines | total citation | total publication | per-paper citation | total citation | total publication | per-paper citation |
| Physics | 93.91 | 92.73 | 95.41 | 50.27 | 86.63 | 68.47 |
| Chemistry | 93.38 | 92.65 | 97.14 | 70.83 | 84.02 | 77.91 |
| Physiology/Medicine | 93.52 | 91.77 | 96.20 | 60.39 | 81.70 | 81.27 |
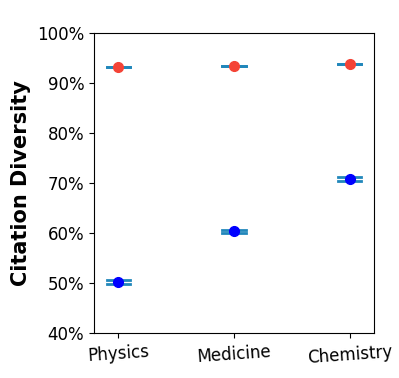
From this comparison, it is evident that diversity values have increased across all disciplines from past eras to recent times, indicating a decrease in citation inequality. Notably, the recent era shows very small differences in diversity values among the three disciplines, highlighting a more even distribution of total number of citations, total number of papers, and per-paper citations among award winners across all disciplines. In contrast, these differences were much larger in the past. Additionally, we observe that while physics had the lowest diversity for the total citation in earlier times, it now has the highest D value compared to the other two disciplines in recent times. This suggests a significant improvement in the equality of citation distribution for physics. Again Fig. 8 reveals that the confidence interval for the total citation perspective is minimal, whereas the confidence intervals for the total publication and per-paper citation are comparatively large in both the recent and past eras. Thus, we can infer that the data for the total citation is more accurate compared to the other two perspectives. Overall, this comparison reveals that the citation distribution in physics has improved markedly in recent times compared to previous times.
IV.3 Citation diversity in the publication of Individual prize winning scientists across different disciplines
We now aspire to inspect the citation diversity in the publications of the individual prize winning scientists across various scientific disciplines. We have chosen the citation data for a total of 135 eminent scholars from the aforesaid scientific disciplines. We fixed on the Nobel prize winners in physics (30), chemistry (30), physiology/medicine (30) and economics (15), Abel prize winners in mathematics (15) and Turing award winners in computer science (15).
IV.3.1 The Nobel Prize winners in Physics
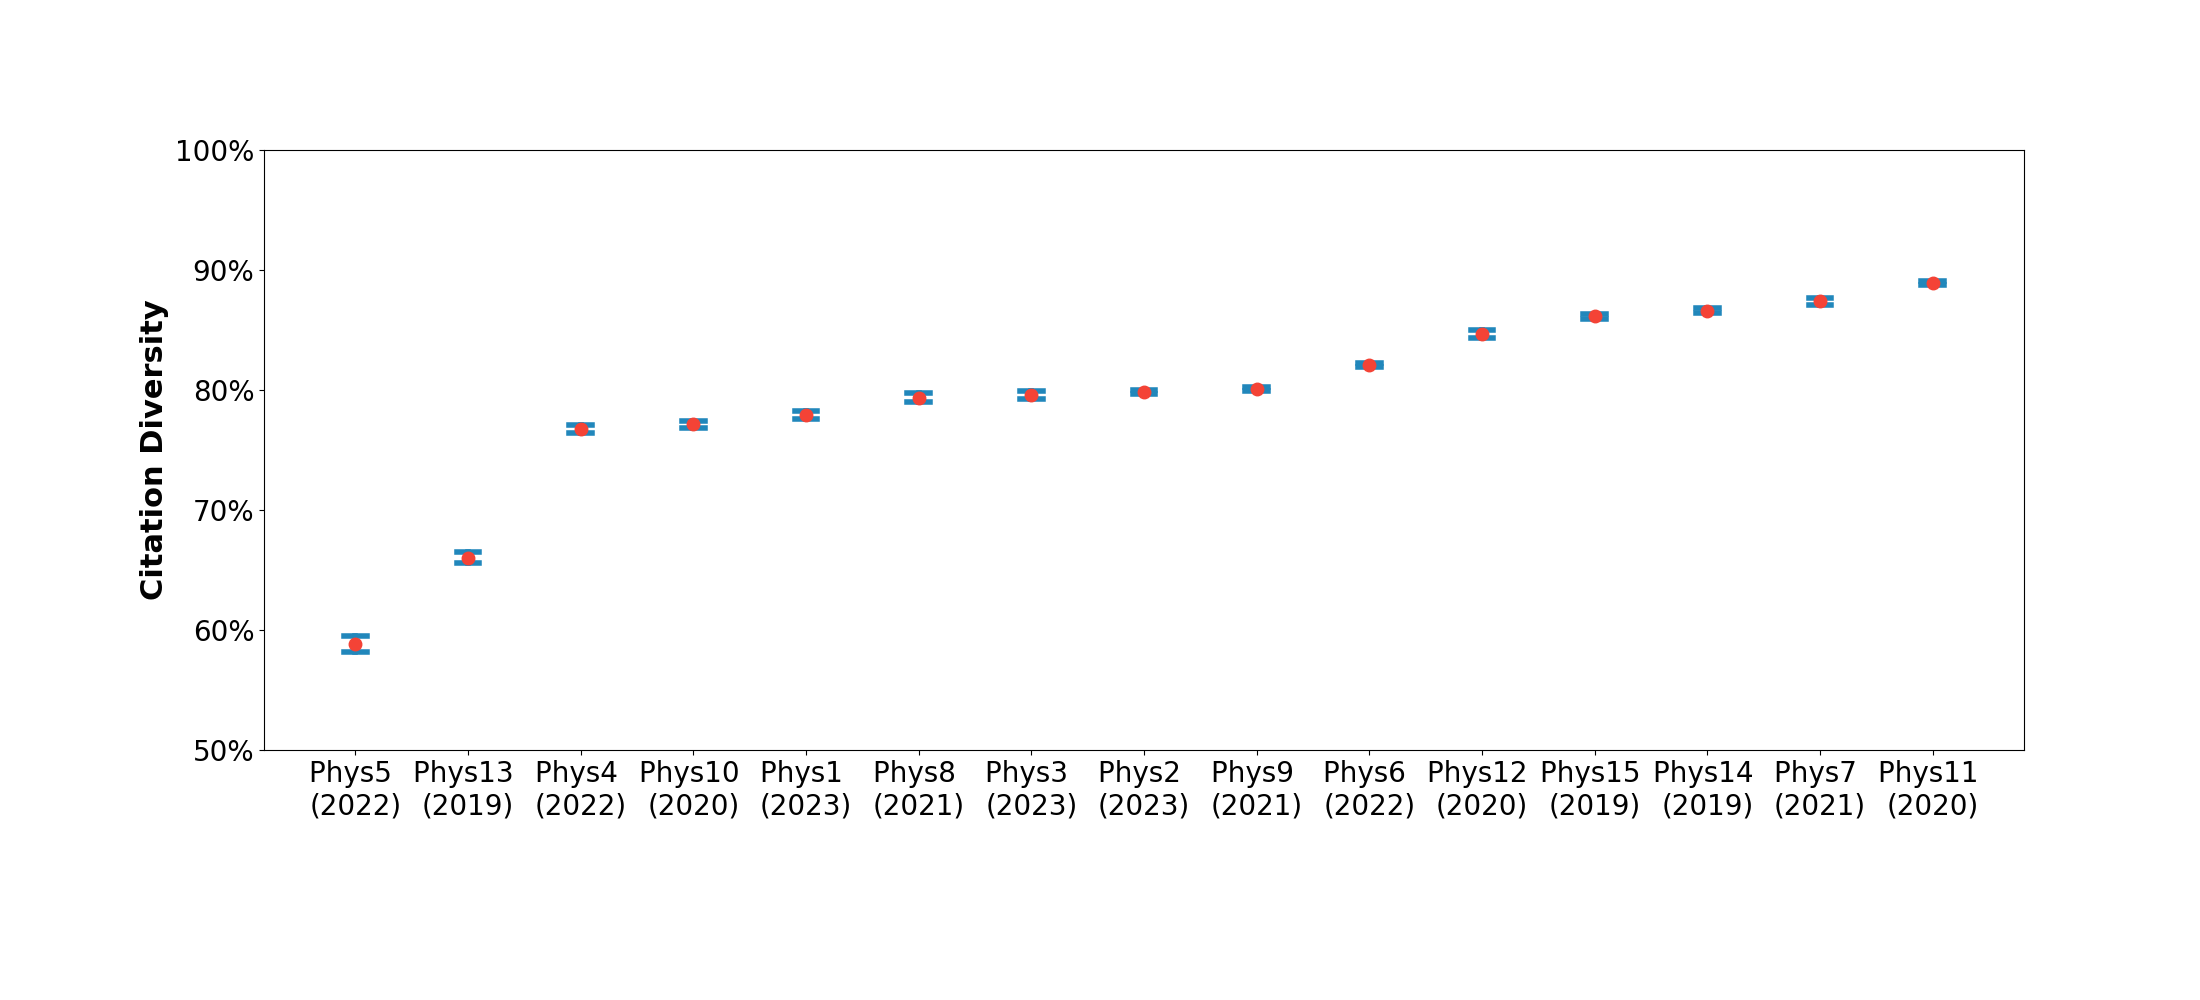
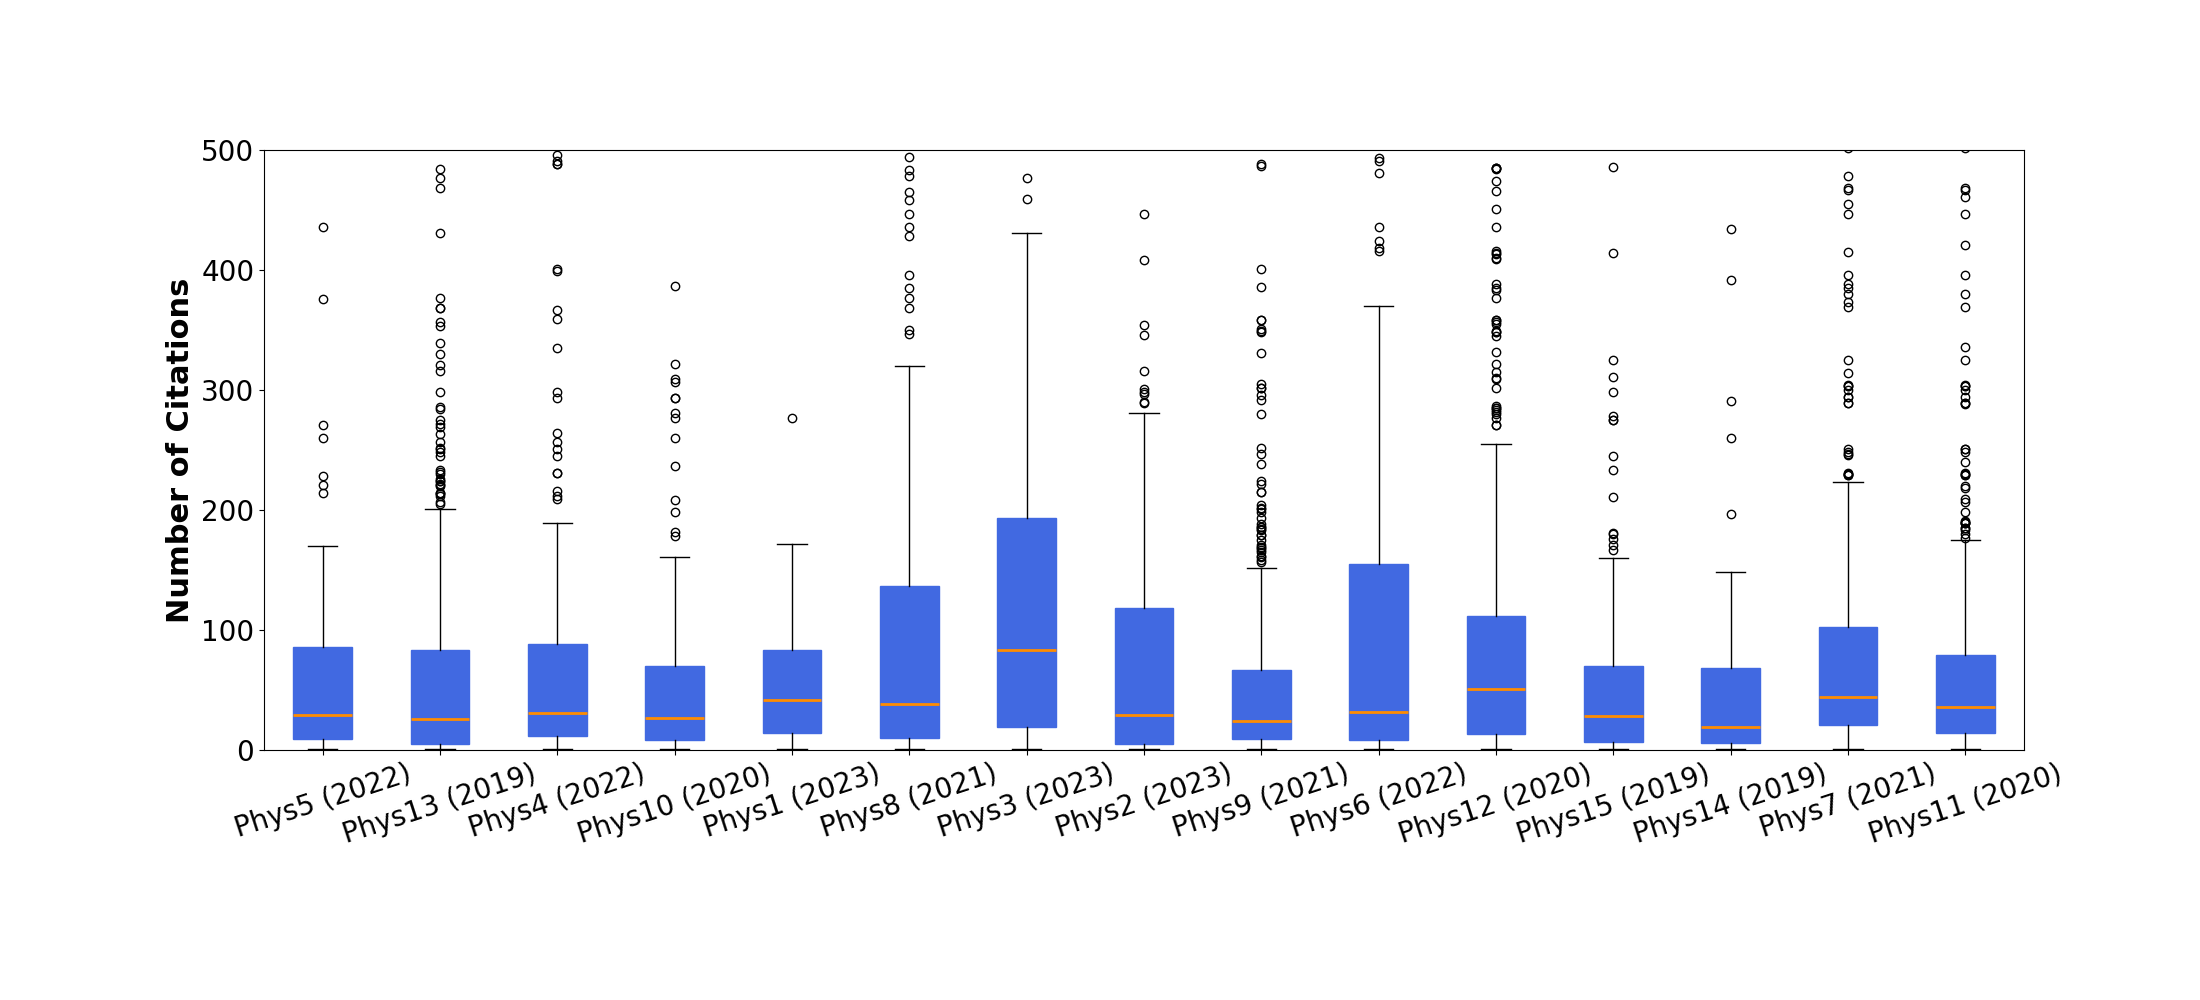
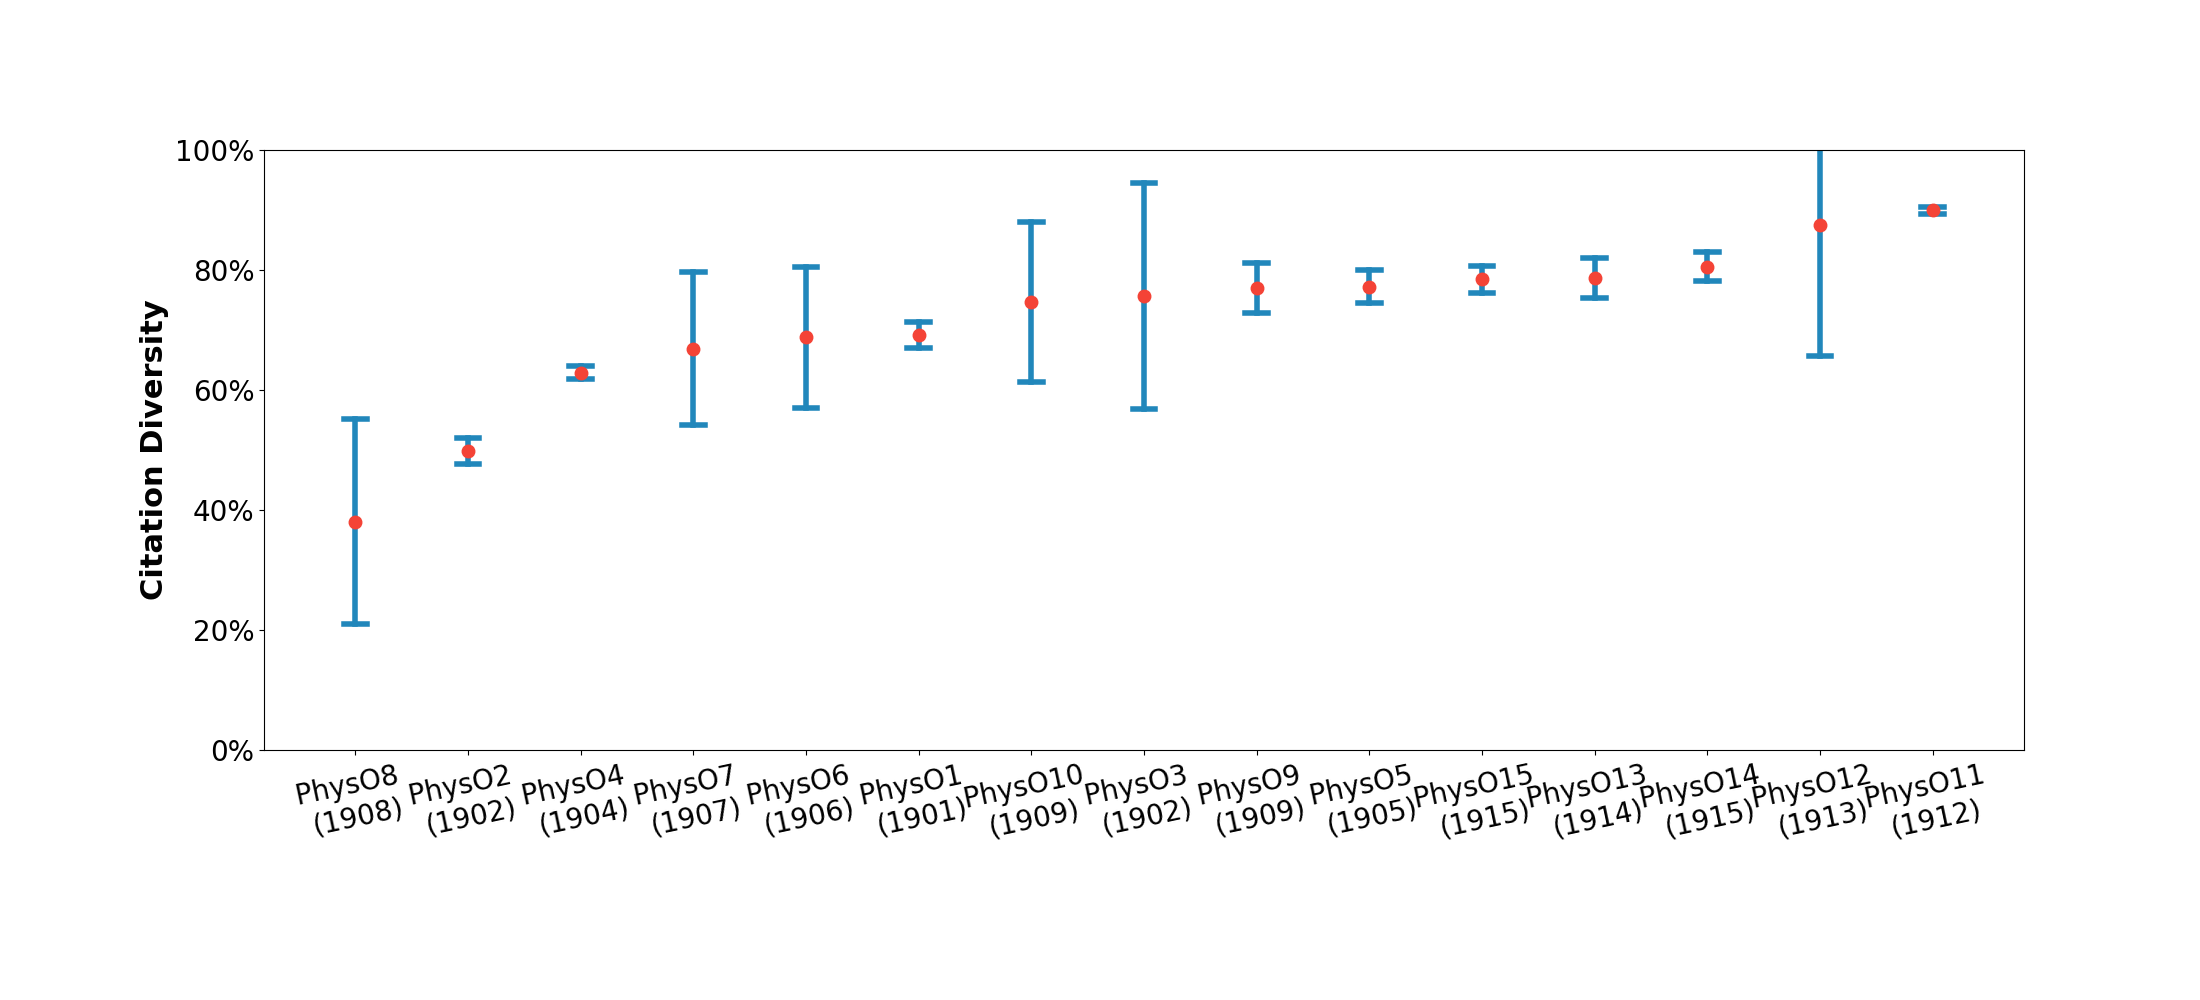
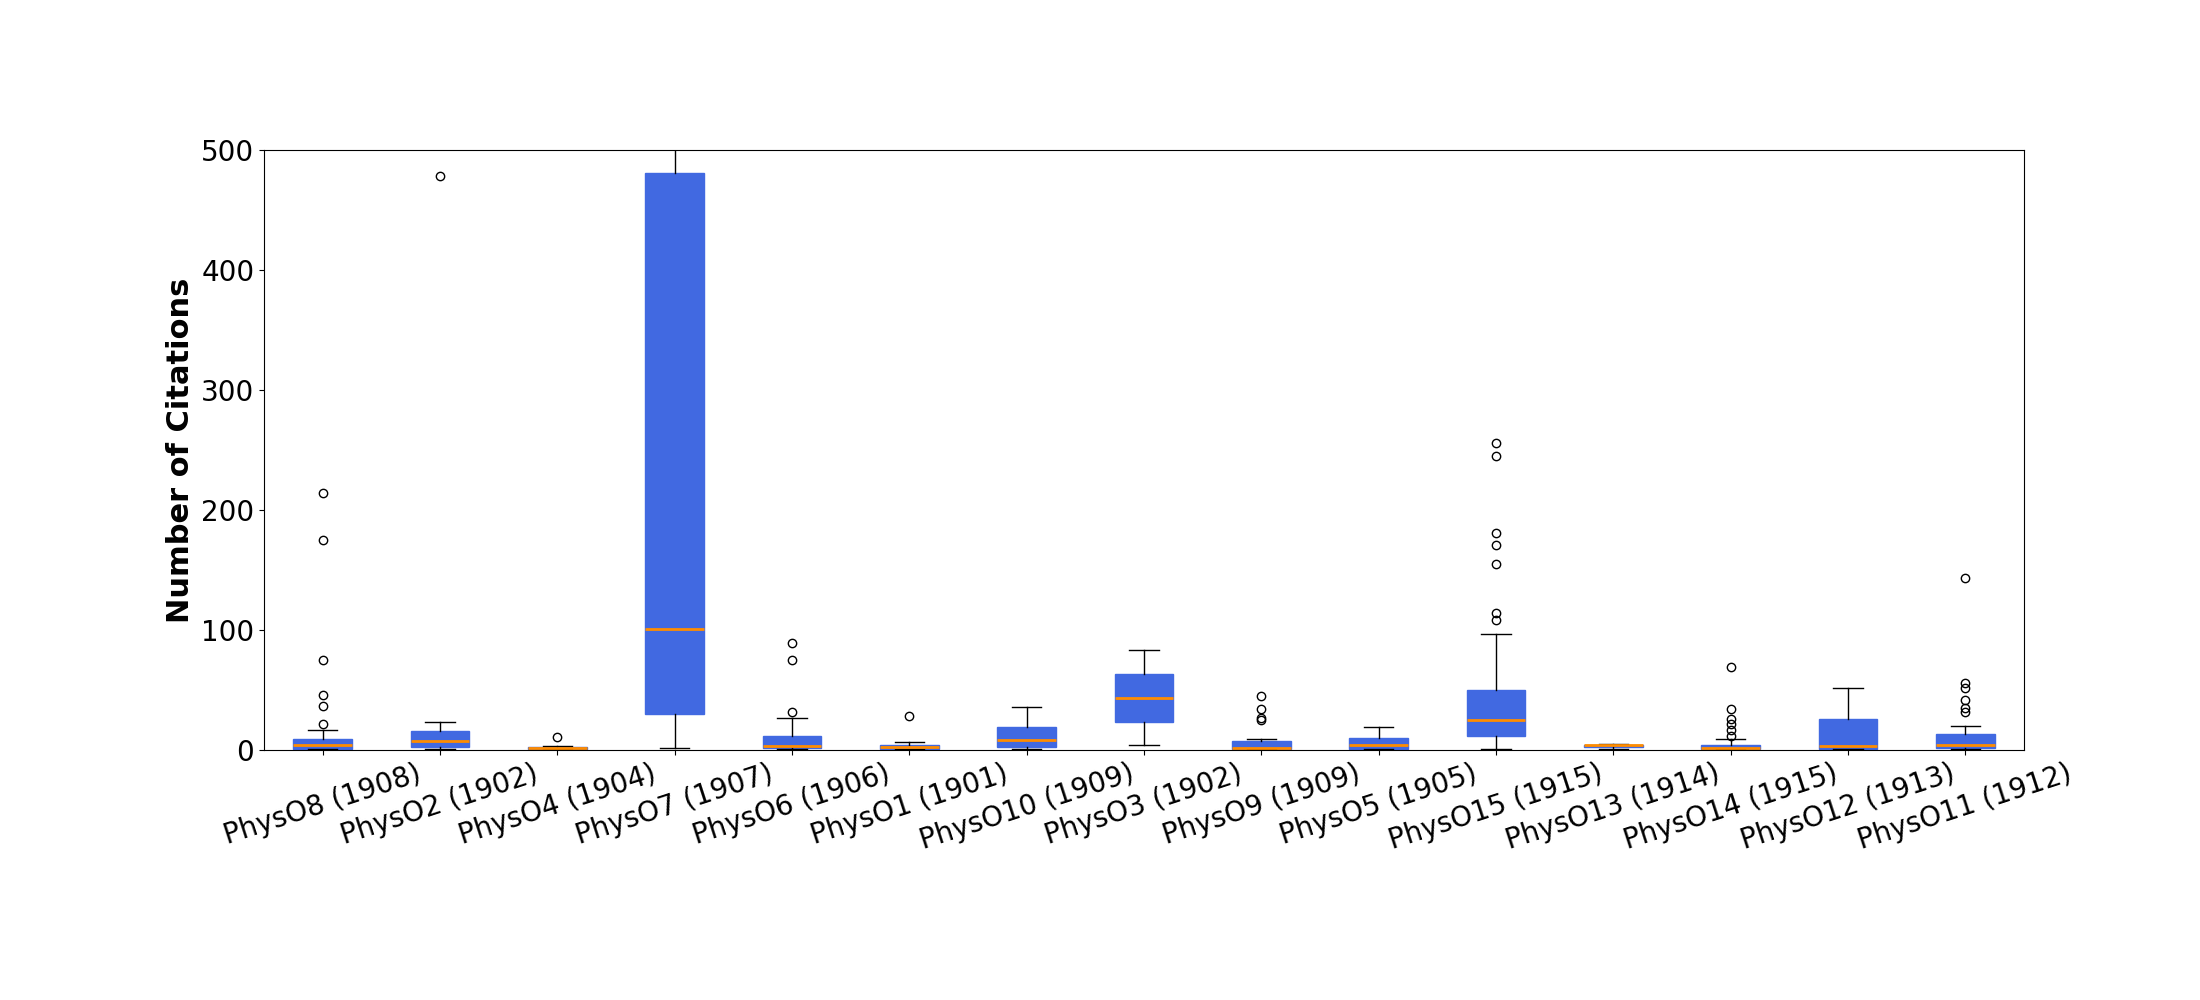
The Nobel prize in physics has been awarded to 224 individuals between 1901 and 2023. For our investigation we have explored the citation counts of 30 Nobel laureates in physics, 15 from recent times (2019-2023) and 15 from the period (1901-1915). Using this data, we calculated the citation diversity values in the publication of these scientists following the methodology outlined above in Section III. Table 7 provides the citation diversity (D) values for each scientist considered along with their average citation counts (). Fig. 9 illustrates the citation diversity values for each recent laureate, with Fig. 9(a) specifically highlighting the citation diversity of recent laureates. Notably, the confidence intervals for each point are very small, confirming the accuracy of these values. Additionally, Fig. 9(b) presents a box-plot of the citation counts of the laureates from raw citation data of their publications. The citation diversity values for the 15 recent laureates range from about 60% to 90%, with higher diversity correlating with lower average citation counts, underscoring the limitations of using average citations alone to represent a laureate’s citation distribution. Instead, the citation diversity measure offers a more precise depiction of these patterns. In Fig. 10, we observe the citation diversity values of earlier Nobel laureates, with Fig. 10(a) revealing a wide range of citation diversity from 20% to 80%. Larger confidence intervals further extend this range. Fig. 10(b) shows a box-plot based on their raw citation data, revealing that earlier laureates generally had lower citation counts but higher diversity values. This highlights how citation diversity accurately reflects citation distribution over time. Overall, the increase in diversity values from earlier to more recent laureates suggests a decline in citation inequality among Nobel laureates in physics over the years.
| Nobel Laureates | D | |
|---|---|---|
| Phys1 (2023) | 105.72 | 77.83 |
| Phys2 (2023) | 112.46 | 79.88 |
| Phys3 (2023) | 95.74 | 79.49 |
| Phys4 (2022) | 102.42 | 76.70 |
| Phys5 (2022) | 314.39 | 58.92 |
| Phys6 (2022) | 150.22 | 82.08 |
| Phys7 (2021) | 138.68 | 87.46 |
| Phys8 (2021) | 128.70 | 79.32 |
| Phys9 (2021) | 79.60 | 80.02 |
| Phys10 (2020) | 171.86 | 77.10 |
| Phys11 (2020) | 101.63 | 88.94 |
| Phys12 (2020) | 66.37 | 84.61 |
| Phys13 (2019) | 129.35 | 65.91 |
| Phys14 (2019) | 97.12 | 86.55 |
| Phys15 (2019) | 73.71 | 85.07 |
| Nobel Laureates | D | |
|---|---|---|
| PhysO1 (1901) | 19.42 | 69.21 |
| PhysO2 (1902) | 86.19 | 49.77 |
| PhysO3 (1902) | 3.17 | 75.90 |
| PhysO4 (1904) | 477.40 | 62.97 |
| PhysO5 (1905) | 11.84 | 77.17 |
| PhysO6 (1906) | 5.75 | 68.77 |
| PhysO7 (1907) | 13.50 | 67.09 |
| PhysO8 (1908) | 43.50 | 37.51 |
| PhysO9 (1909) | 8.70 | 77.11 |
| PhysO10 (1909) | 7.00 | 74.56 |
| PhysO11 (1912) | 40.85 | 90.01 |
| PhysO12 (1913) | 3.33 | 87.38 |
| PhysO13 (1914) | 6.79 | 78.61 |
| PhysO14 (1915) | 13.58 | 80.42 |
| PhysO15 (1915) | 13.43 | 78.39 |
IV.3.2 Nobel Prize winners in Chemistry
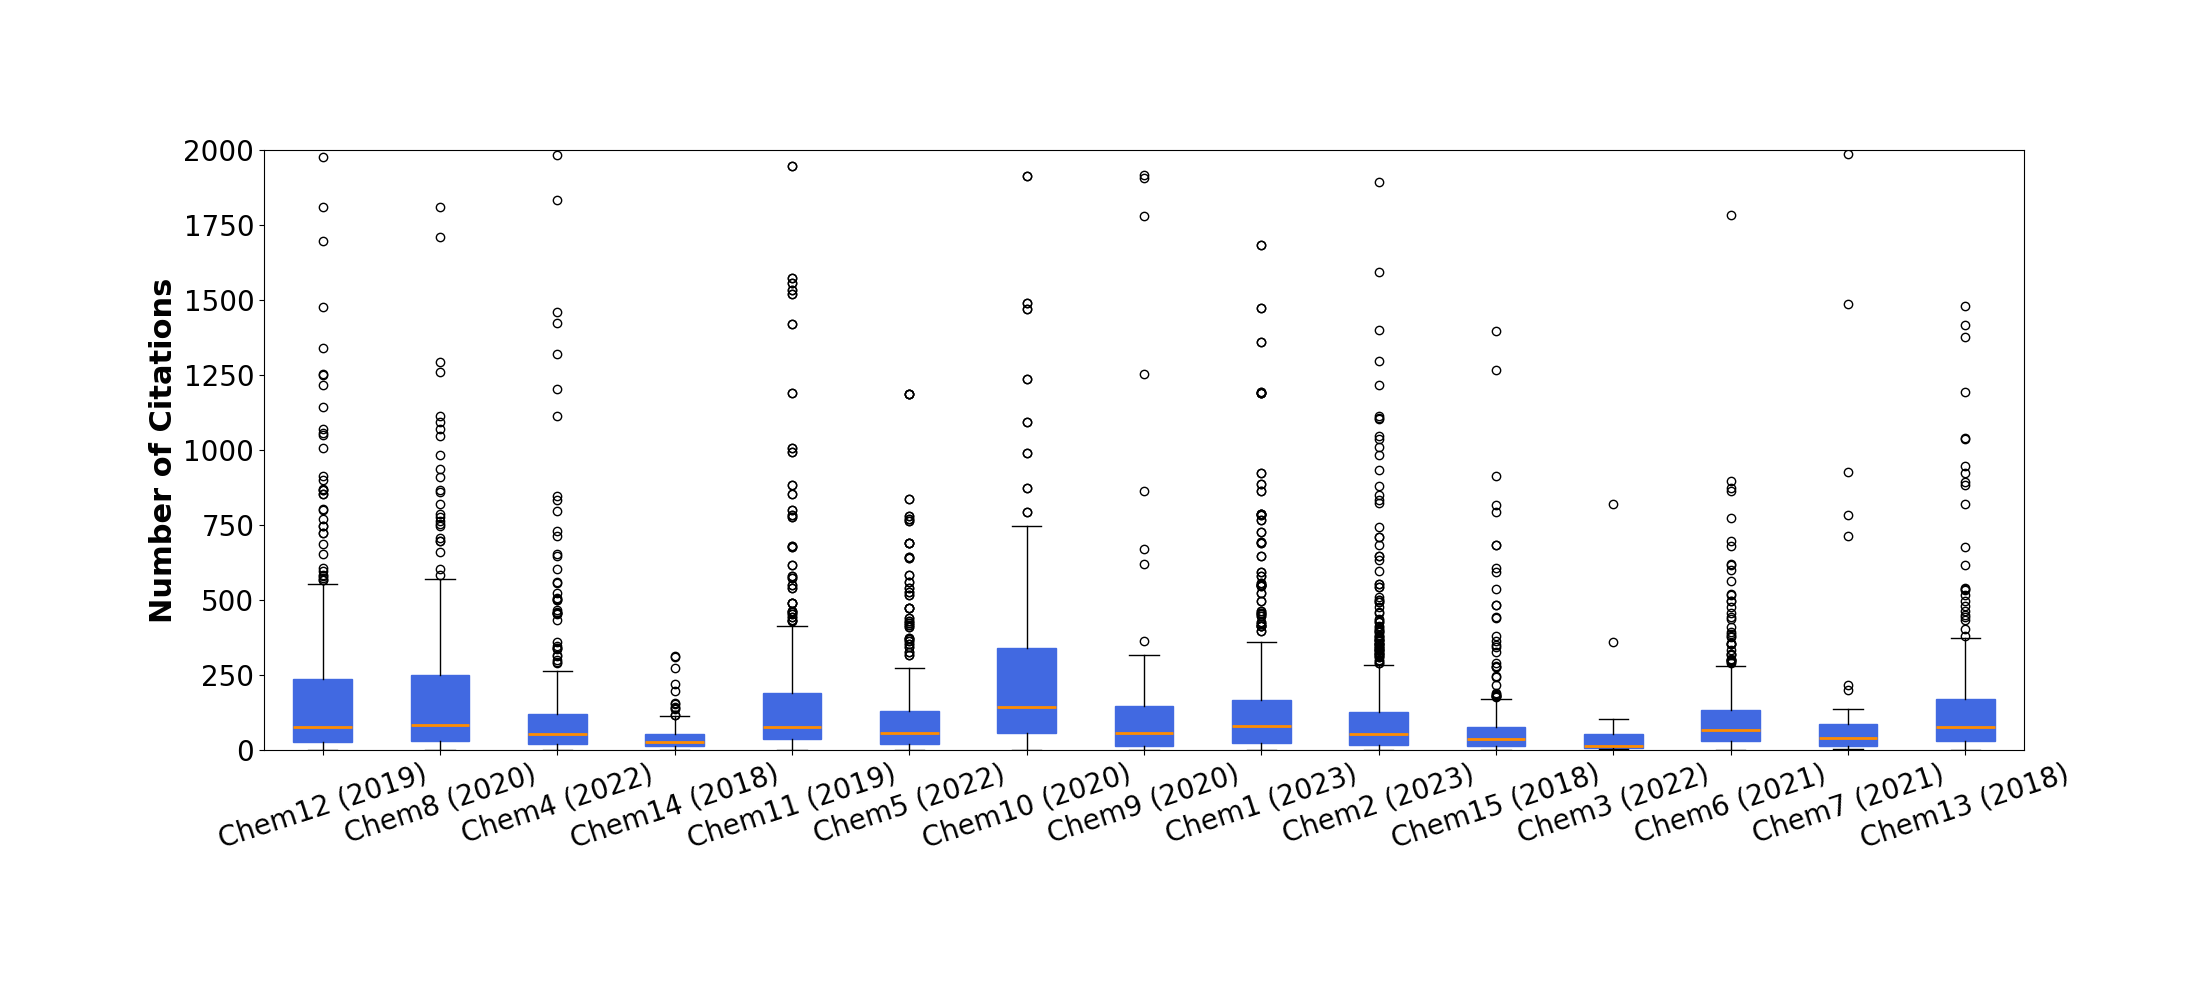
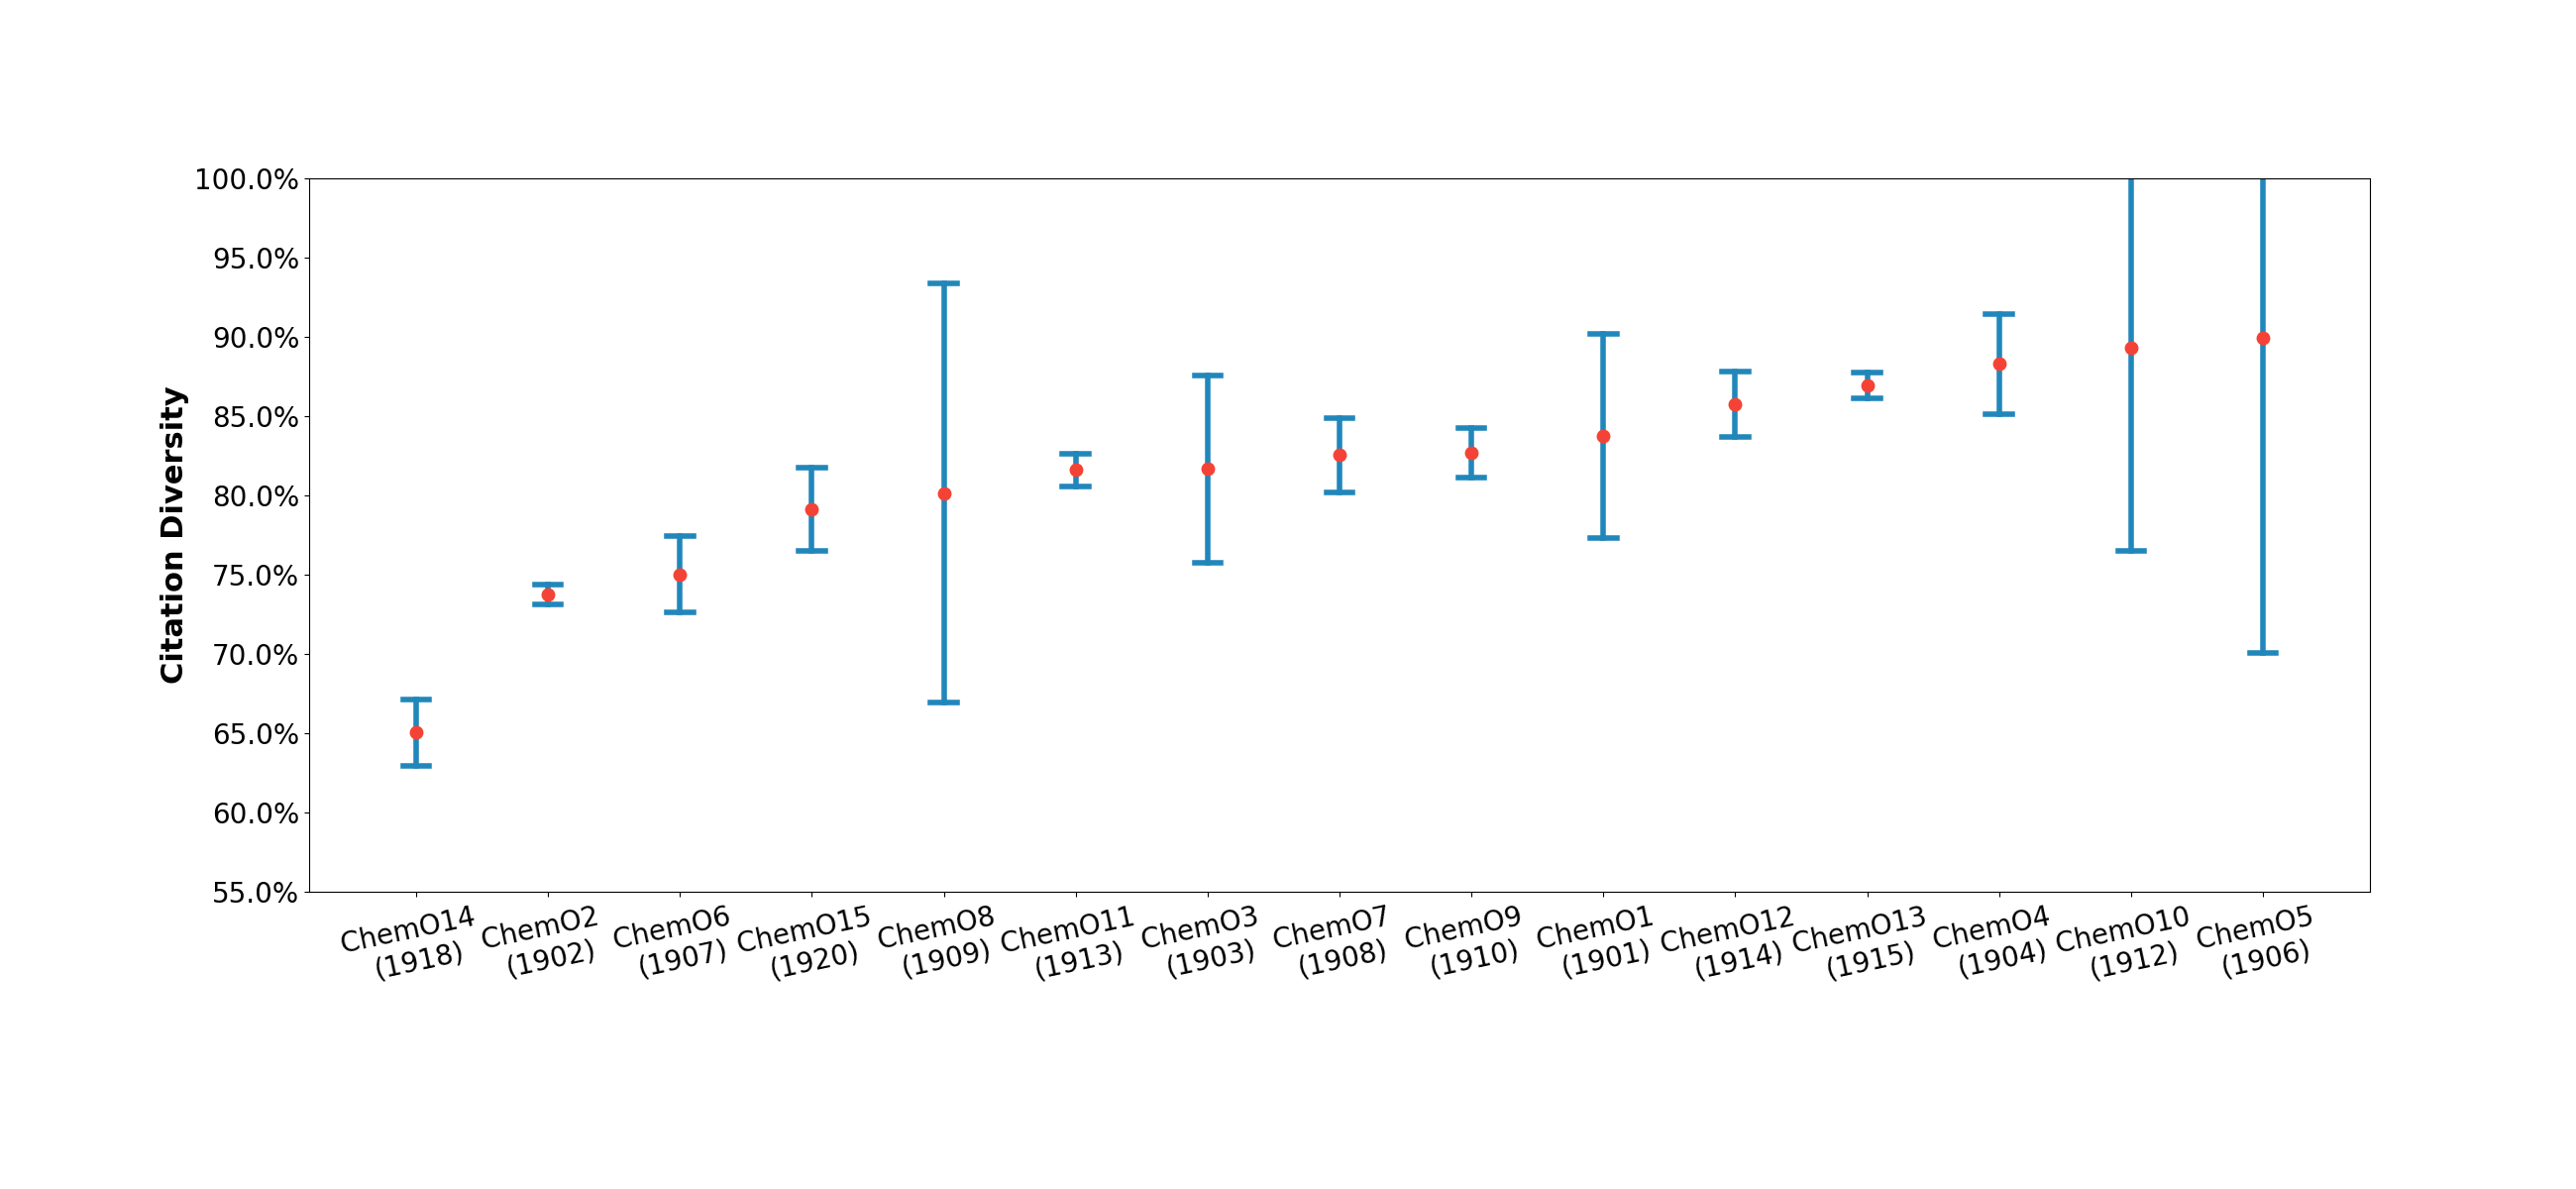
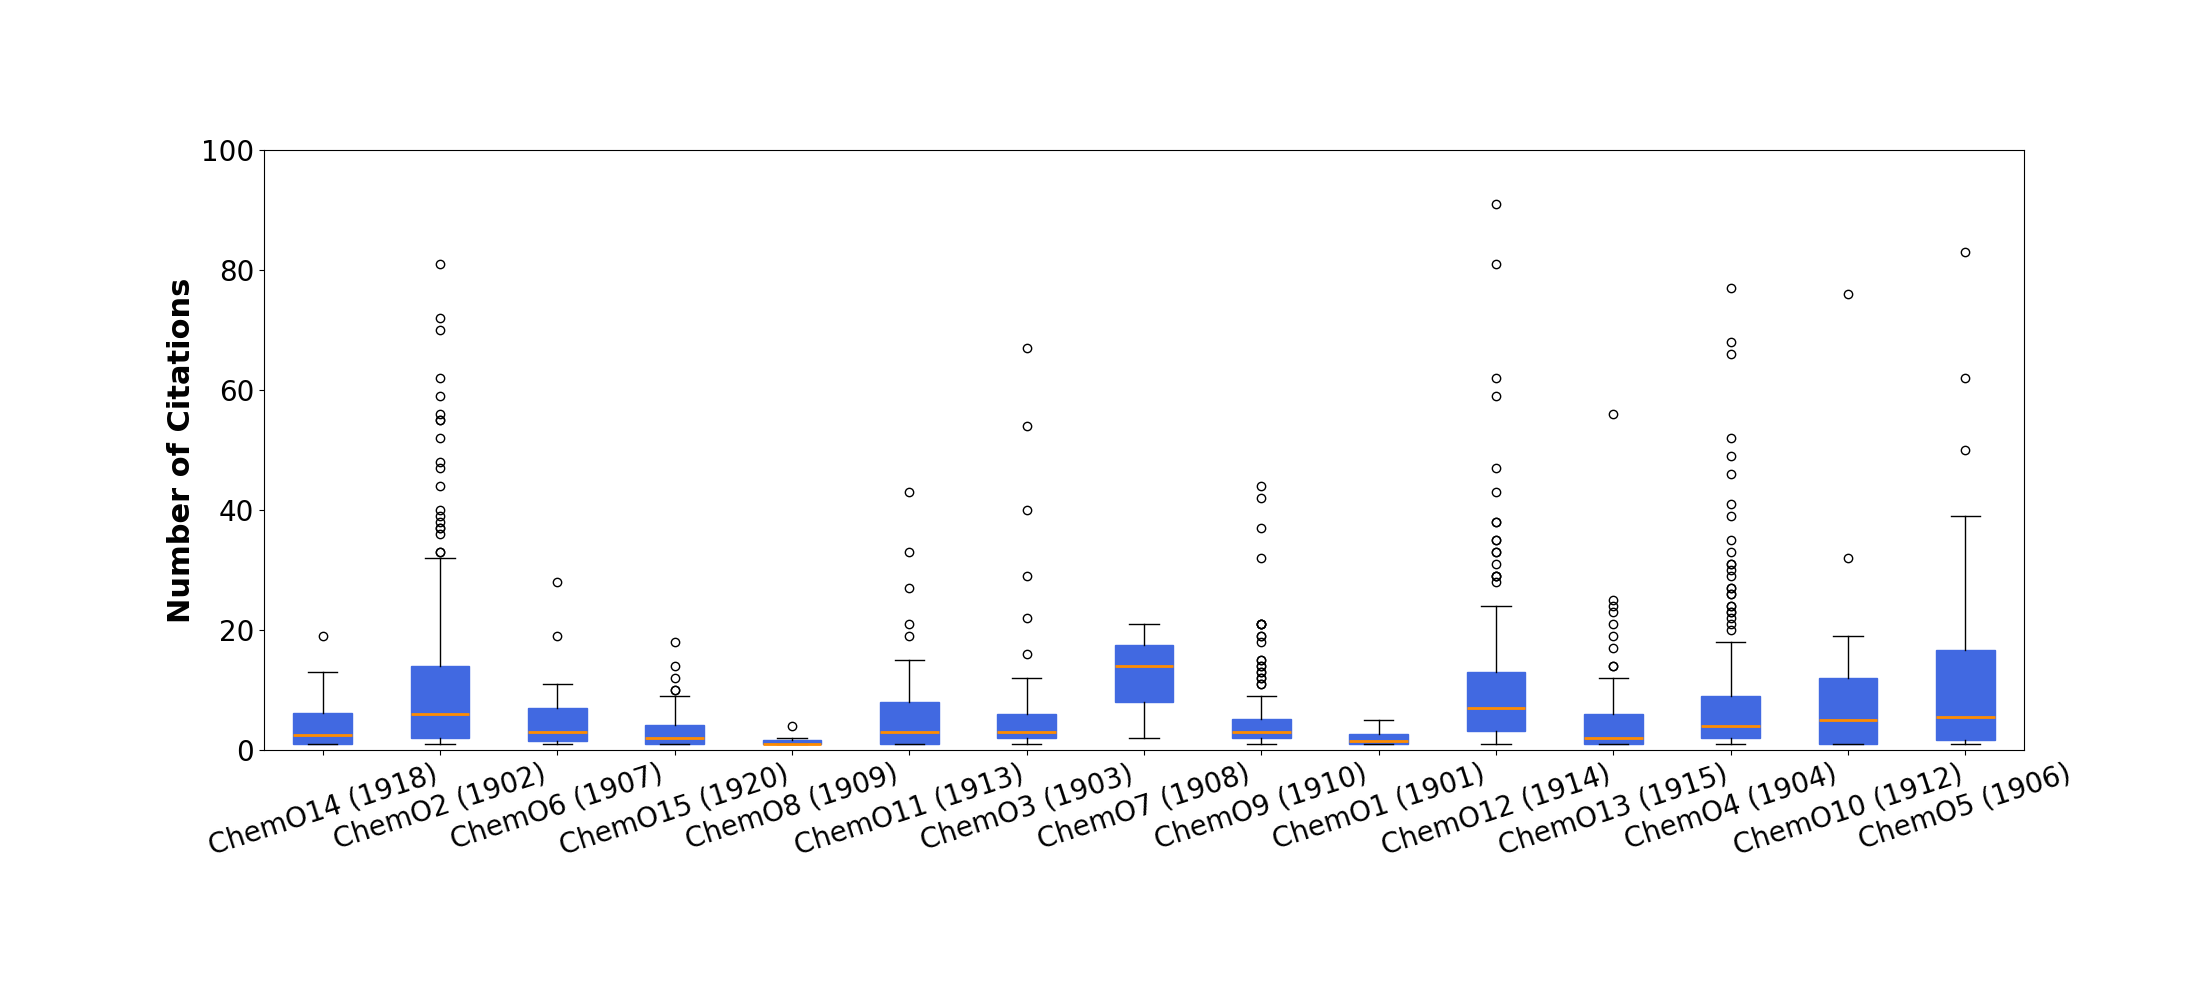
From 1901 to 2023 the Nobel prize in chemistry has been bestowed on a total of 192 individuals. For our analysis, we have picked up the citation data of 30 Nobel prize winners in chemistry, 15 during 1901-1920 and 15 between 2018-2023. Table 8 represents the calculated diversity values and average citation counts of all the listed Nobel prize winners in chemistry. In Fig. 11, we see the citation diversity of 15 recent Nobel laureates in chemistry, with diversity values ranging from 60% to 90%. Two distinct groups emerge: one containing four laureates with citation diversity between 60%-70%, indicating higher citation inequality, and another between 80%-90%, reflecting a more balanced citation distribution. The minimal confidence intervals confirm the reliability of these values. Fig. 11(b) further shows that despite similar average citation counts, diversity values differ significantly, revealing more insightful patterns in citation distribution. Meanwhile, Fig. 12 shows earlier laureates’ citation diversity ranging from 65% to 90%, though with larger confidence intervals, indicating greater variability.
| Nobel Laureates | D | |
|---|---|---|
| Chem1 (2023) | 252.39 | 83.08 |
| Chem2 (2023) | 245.78 | 84.04 |
| Chem3 (2022) | 123.02 | 86.09 |
| Chem4 (2022) | 84.05 | 68.28 |
| Chem5 (2022) | 246.29 | 80.23 |
| Chem6 (2021) | 141.49 | 86.24 |
| Chem7 (2021) | 278.57 | 86.46 |
| Chem8 (2020) | 343.90 | 65.34 |
| Chem9 (2020) | 216.42 | 81.47 |
| Chem10 (2020) | 149.54 | 81.26 |
| Chem11 (2019) | 100.96 | 78.22 |
| Chem12 (2019) | 97.19 | 62.76 |
| Chem13 (2018) | 116.60 | 90.24 |
| Chem14 (2018) | 211.82 | 69.12 |
| Chem15 (2018) | 182.06 | 86.16 |
| Nobel Laureates | D | |
|---|---|---|
| ChemO1 (1901) | 5.00 | 83.74 |
| ChemO2 (1902) | 20.07 | 73.72 |
| ChemO3 (1903) | 6.20 | 81.61 |
| ChemO4 (1904) | 3.57 | 88.26 |
| ChemO5 (1906) | 1.67 | 89.86 |
| ChemO6 (1907) | 8.65 | 75.06 |
| ChemO7 (1908) | 7.38 | 82.60 |
| ChemO8 (1909) | 12.33 | 80.10 |
| ChemO9 (1910) | 6.52 | 82.76 |
| ChemO10 (1912) | 2.25 | 89.45 |
| ChemO11 (1913) | 15.81 | 81.52 |
| ChemO12 (1914) | 5.05 | 85.77 |
| ChemO13 (1915) | 9.00 | 87.01 |
| ChemO14 (1918) | 19.61 | 65.01 |
| ChemO15 (1920) | 15.75 | 79.29 |

IV.3.3 Abel prize winners in Mathematics
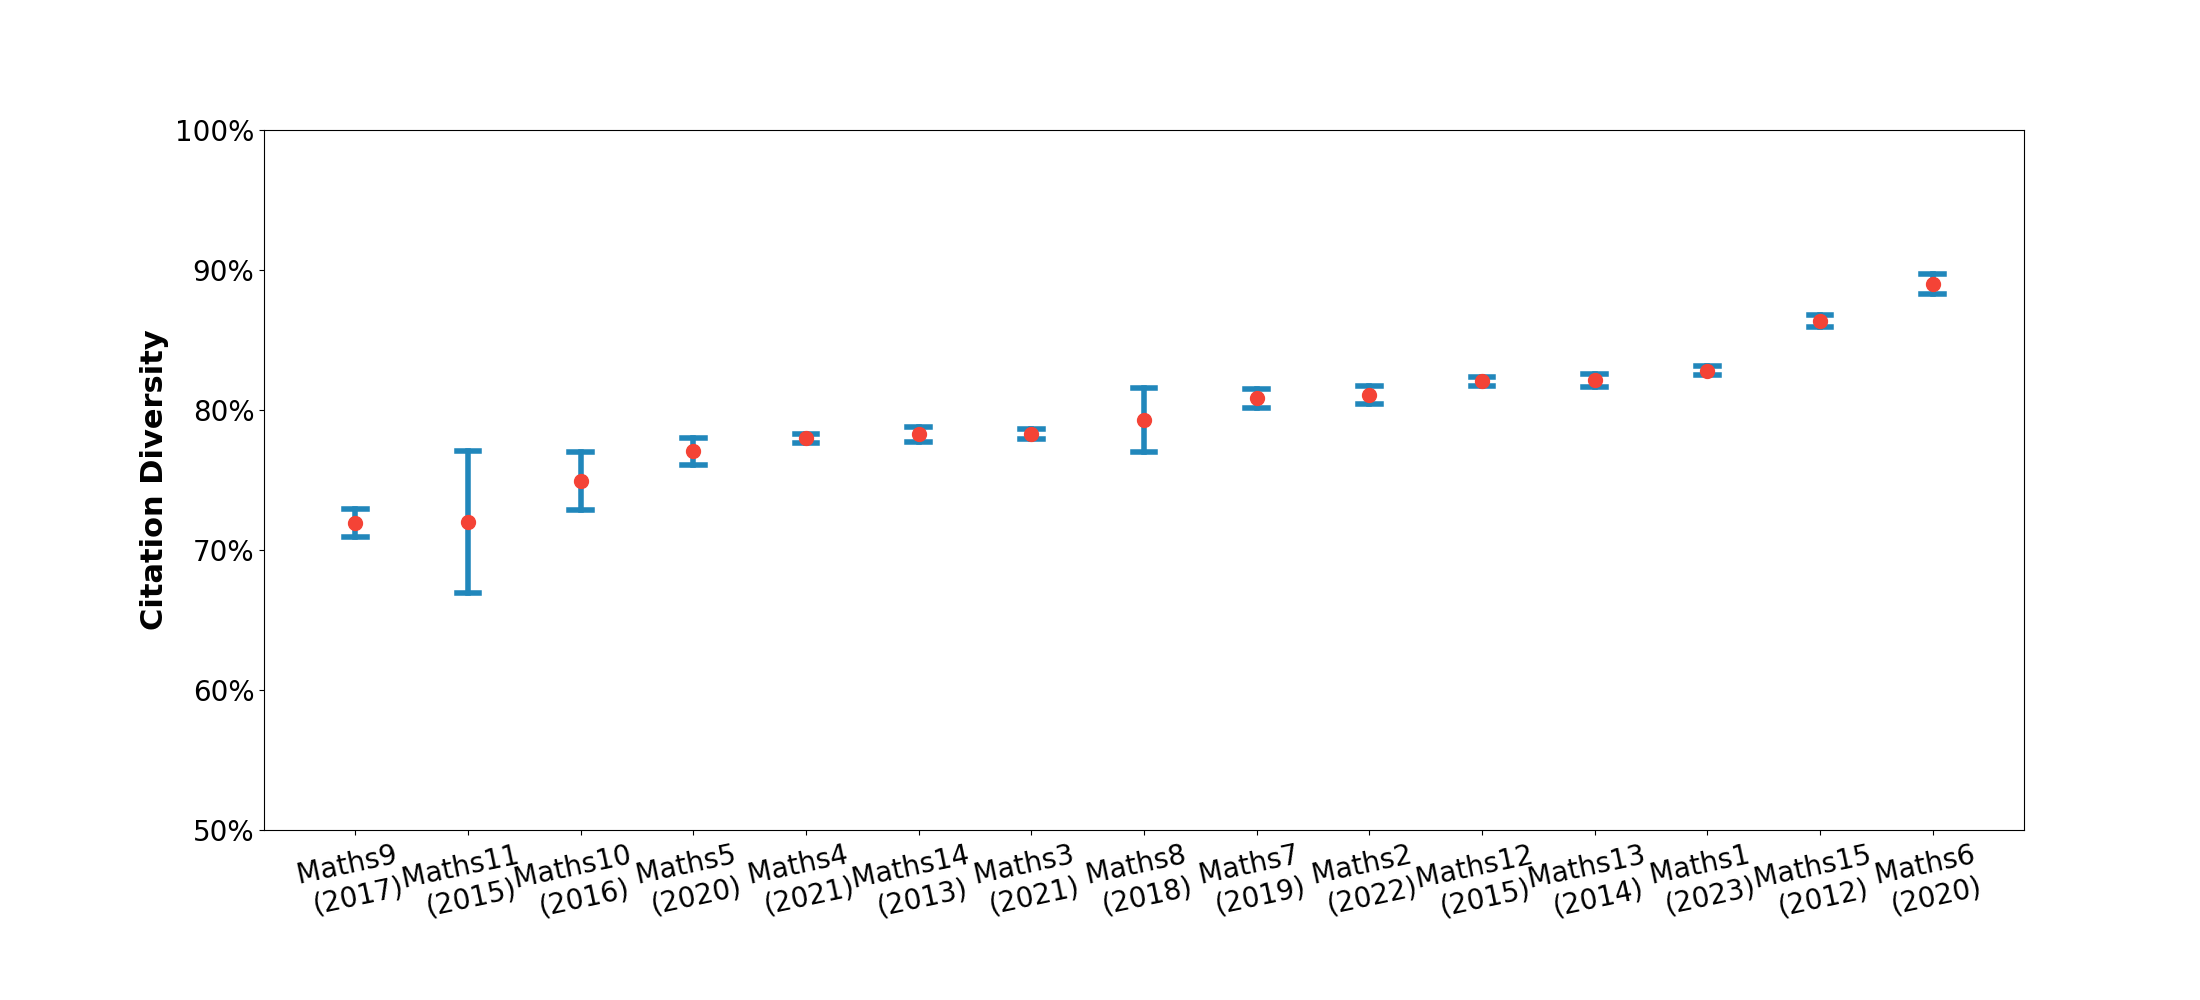
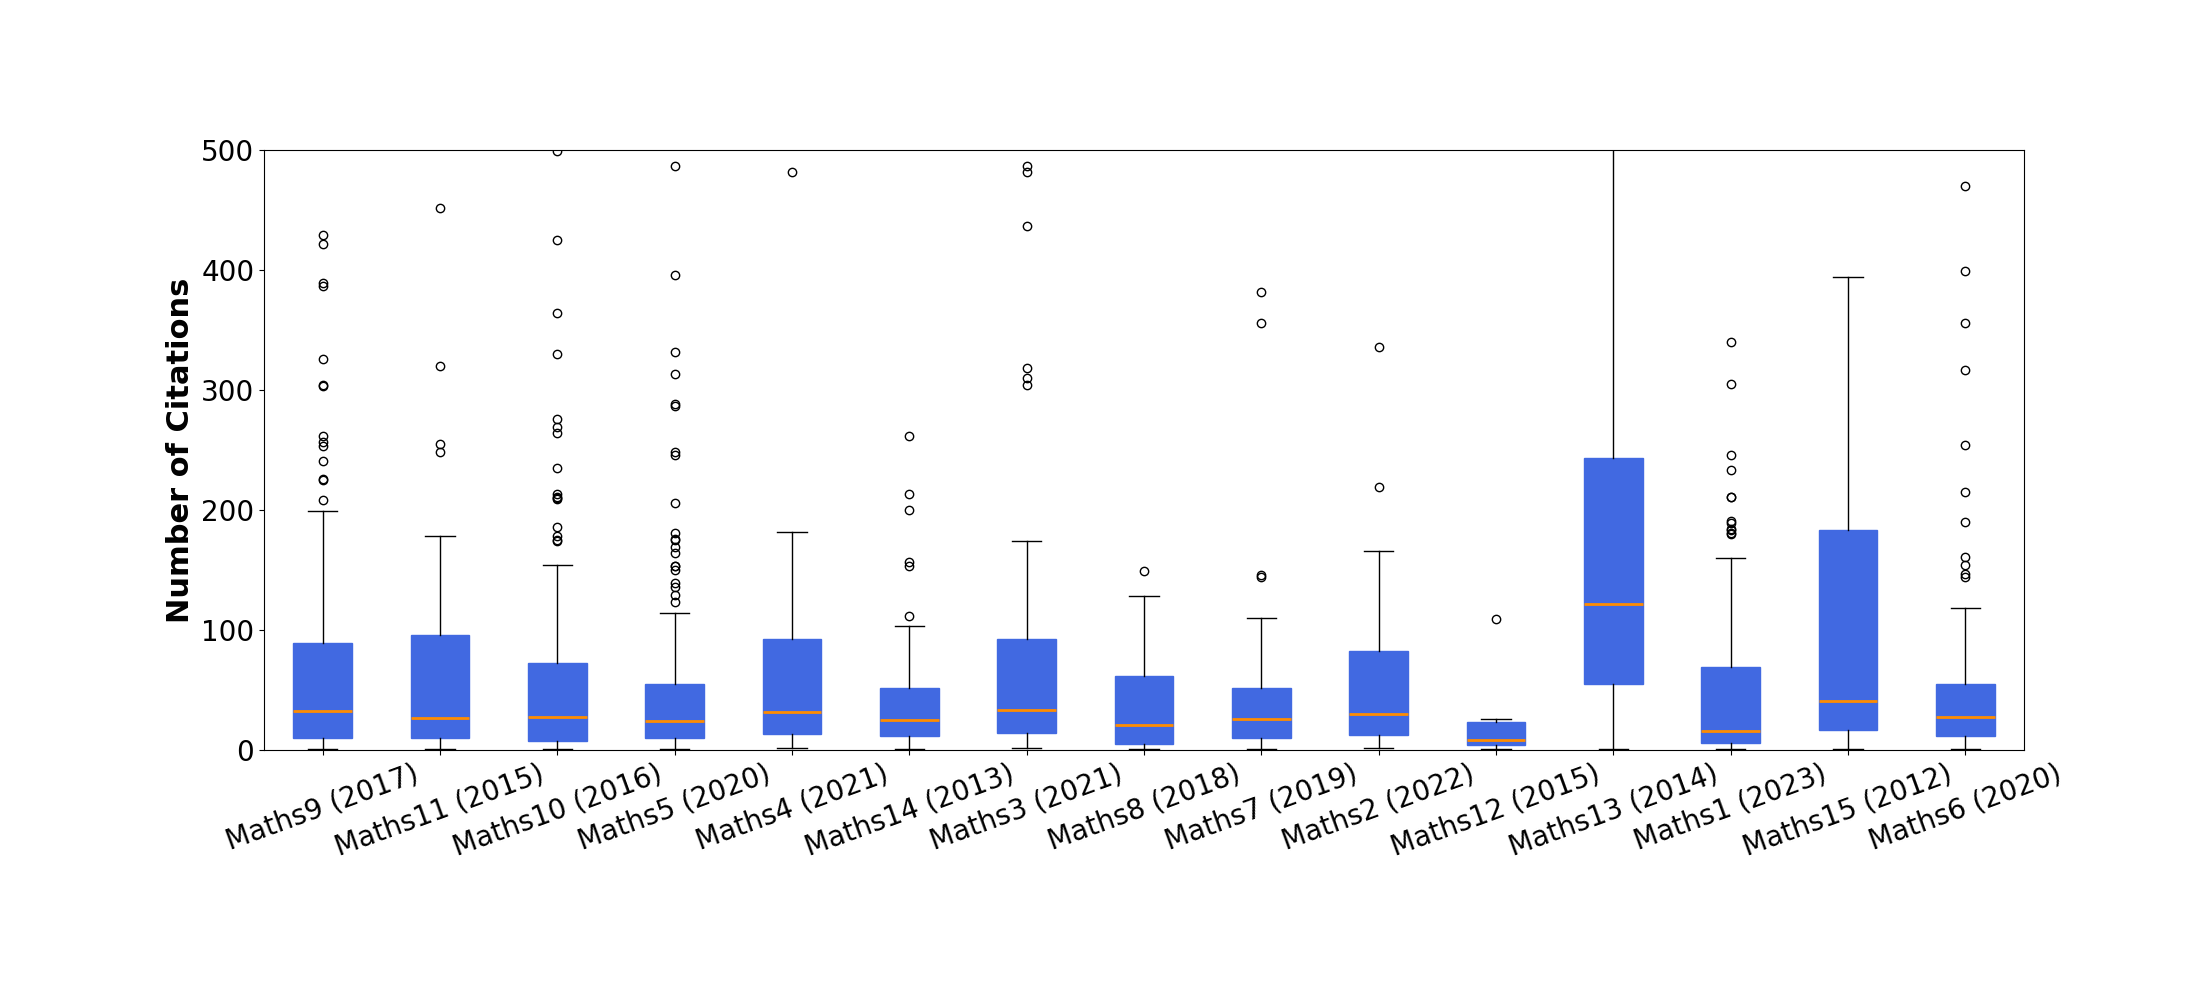
The Abel prize is awarded annually (2003 onwards) to one or more outstanding mathematicians and is widely considered the Nobel prize of mathematics. Here we consider the data for 15 Able prize winners during 2012-2023. Table 9 presents the average citation counts and diversity values for each Abel prize winner considered. In Fig. 13, we observe the citation diversity and box-plot for the citation counts of each Abel prize winner. These citation diversity values of each scientist range from 70% to 90%, indicating moderate citation inequality. The confidence intervals for most diversity values are not high, though a few have slightly higher confidence intervals. This suggests that most calculated diversity values are reliable, with some variability due to the use of publicly available data.
| Abel Prize Winners | D | |
|---|---|---|
| Maths1 (2023) | 86.14 | 82.88 |
| Maths2 (2022) | 81.47 | 81.05 |
| Maths3 (2021) | 84.41 | 78.37 |
| Maths4 (2021) | 71.79 | 77.98 |
| Maths5 (2020) | 99.16 | 77.04 |
| Maths6 (2020) | 43.90 | 88.97 |
| Maths7 (2019) | 109.15 | 80.80 |
| Maths8 (2018) | 43.69 | 79.14 |
| Abel Prize Winners | D | |
|---|---|---|
| Maths9 (2017) | 75.45 | 71.88 |
| Maths10 (2016) | 76.58 | 74.85 |
| Maths11 (2015) | 21.20 | 72.09 |
| Maths12 (2015) | 289.14 | 82.17 |
| Maths13 (2014) | 58.38 | 82.20 |
| Maths14 (2013) | 187.70 | 78.34 |
| Maths15 (2012) | 56.92 | 86.29 |
In this case, we observe that one of the 2015 Abel Prize winners has the highest value but a lower D value. Conversely, one of the 2020 Abel Prize winners has a comparatively lower but the highest D value. It is also noteworthy that, despite having similar values (with the exception of three cases), their D values vary significantly, ranging from 71% to 89%.
IV.3.4 Turing Award winners in Computer Science
The ACM A. M. Turing Award is an annual prize given by the Association for Computing Machinery (ACM) for contributions of lasting and major technical importance to computer science. Commencing in 1966, as of 2024, 77 people have been awarded the prize. We settled on the publication data of 15 highly recognized computer scientists between 2015-2023 only. Table 10 presents the calculated diversity values along with the average citation counts for each Turing prize winner.
| Turing Prize Winners | D | |
|---|---|---|
| CS 1 (2023) | 71.79 | 77.98 |
| CS 2 (2022) | 139.33 | 53.93 |
| CS 3 (2021) | 34.93 | 84.51 |
| CS 4 (2020) | 80.23 | 80.22 |
| CS 5 (2020) | 81.14 | 70.10 |
| CS 6 (2019) | 92.73 | 80.18 |
| CS 7 (2019) | 174.11 | 65.04 |
| CS 8 (2018) | 603.73 | 65.10 |
| Turing Prize Winners | D | |
|---|---|---|
| CS 9 (2018) | 1365.96 | 62.76 |
| CS 10 (2018) | 683.66 | 59.70 |
| CS 11 (2017) | 54.85 | 83.33 |
| CS 12 (2017) | 88.96 | 75.01 |
| CS 13 (2016) | 362.10 | 54.41 |
| CS 14 (2015) | 411.17 | 36.75 |
| CS 15 (2015) | 349.94 | 52.96 |
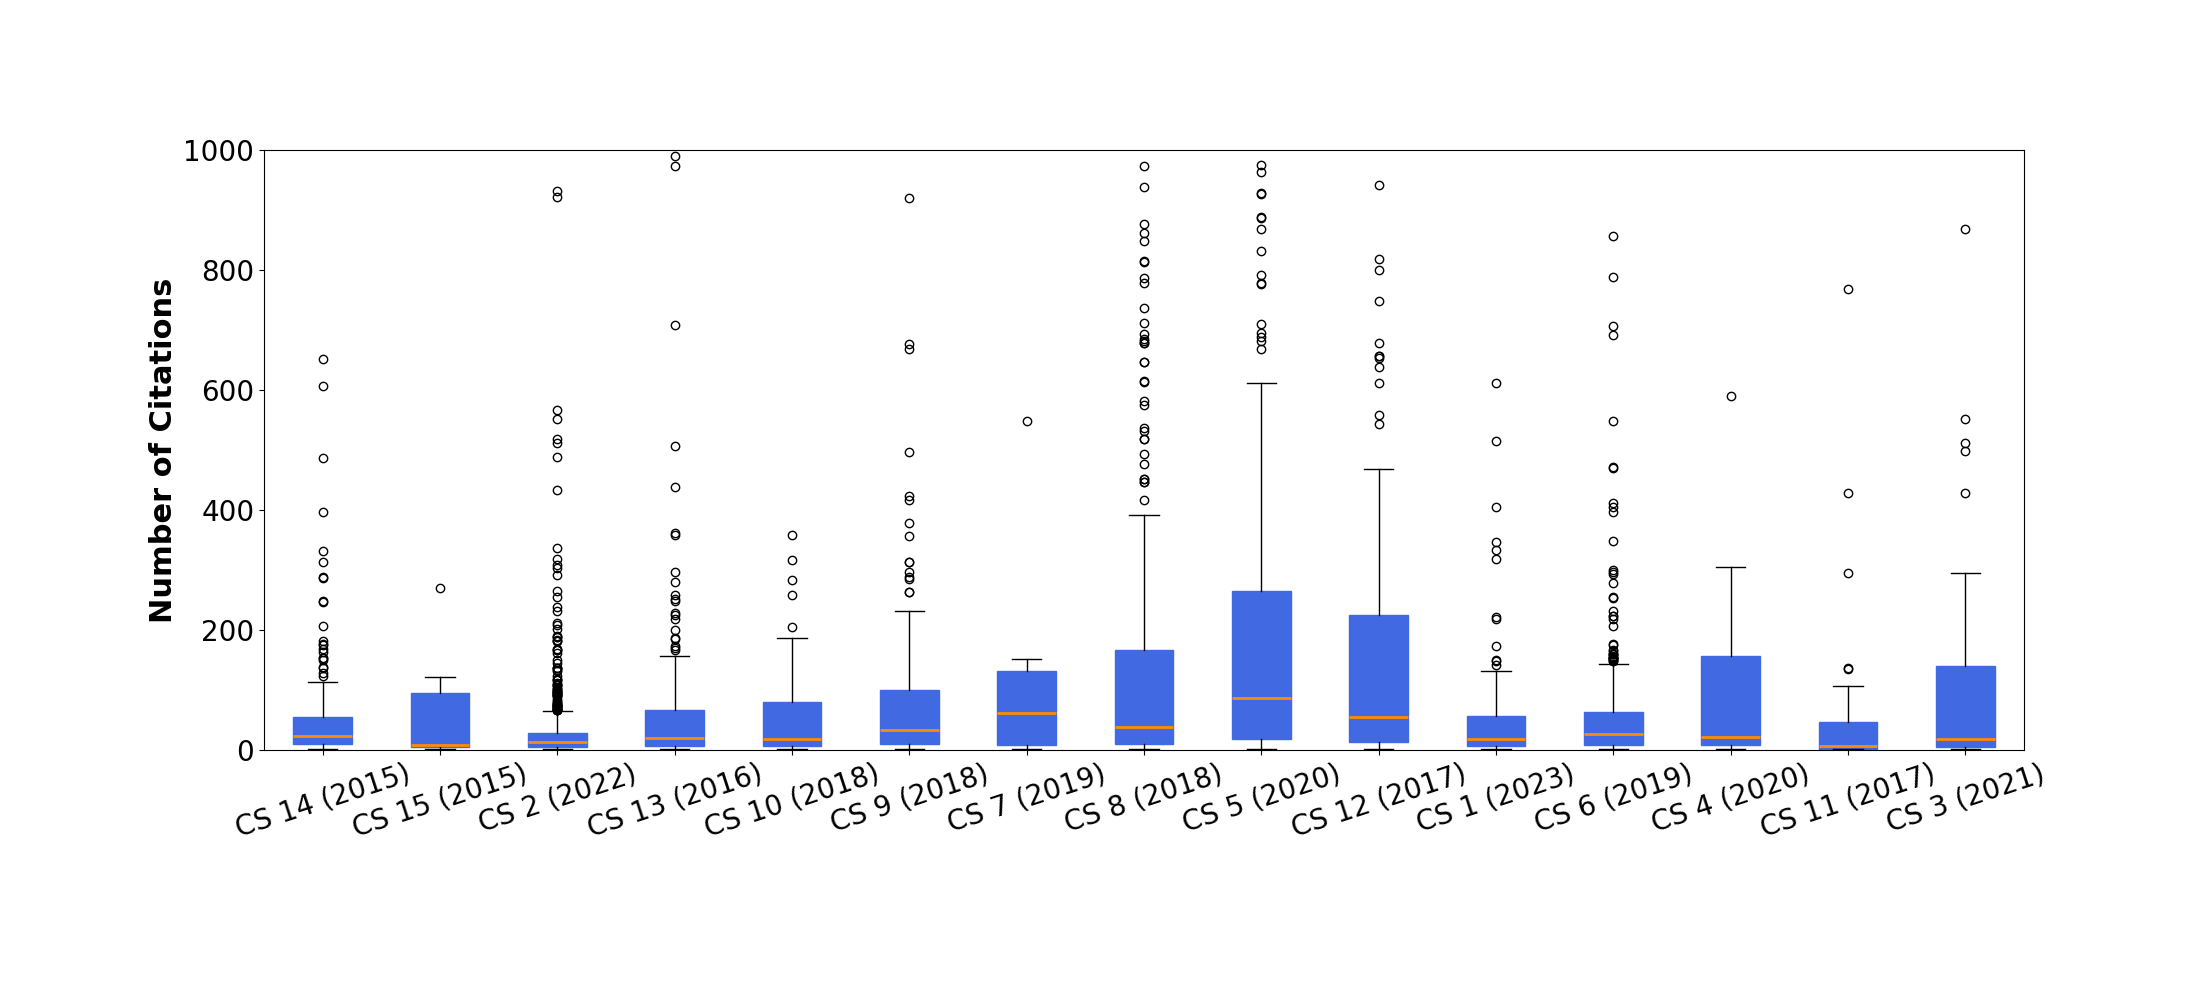
In Fig. 14, we present an overview of the diversity values and citation ranges for each Turing award winner in computer science. Notably, the diversity value of one of the 2015 Turing award winners is significantly lower compared to the others, indicating a high citation inequality for that individual. Conversely, the diversity values of the other computer scientists range between 55% and 85%, with a distinct division at 70%. Below this threshold, there are 7 Turing award winners, and above it, there are also 7 winners. This suggests that the citation inequality is higher for the 7 scientists below 70% compared to those above it. In this analysis, the confidence interval is minimal, except for two cases where it is slightly larger to increase the possibility range of that value. For better understanding, we maintain the same order of the award winners on the x-axis in Fig. 14(b) as in Fig. 14(a), where they are arranged in ascending order of diversity values. However, no meaningful pattern is observed from the total citation range in Fig. 14(b) but there is a clear pattern in diversity values of each scientists shown in Fig. 14(a).

IV.3.5 Nobel prize winners in Economics
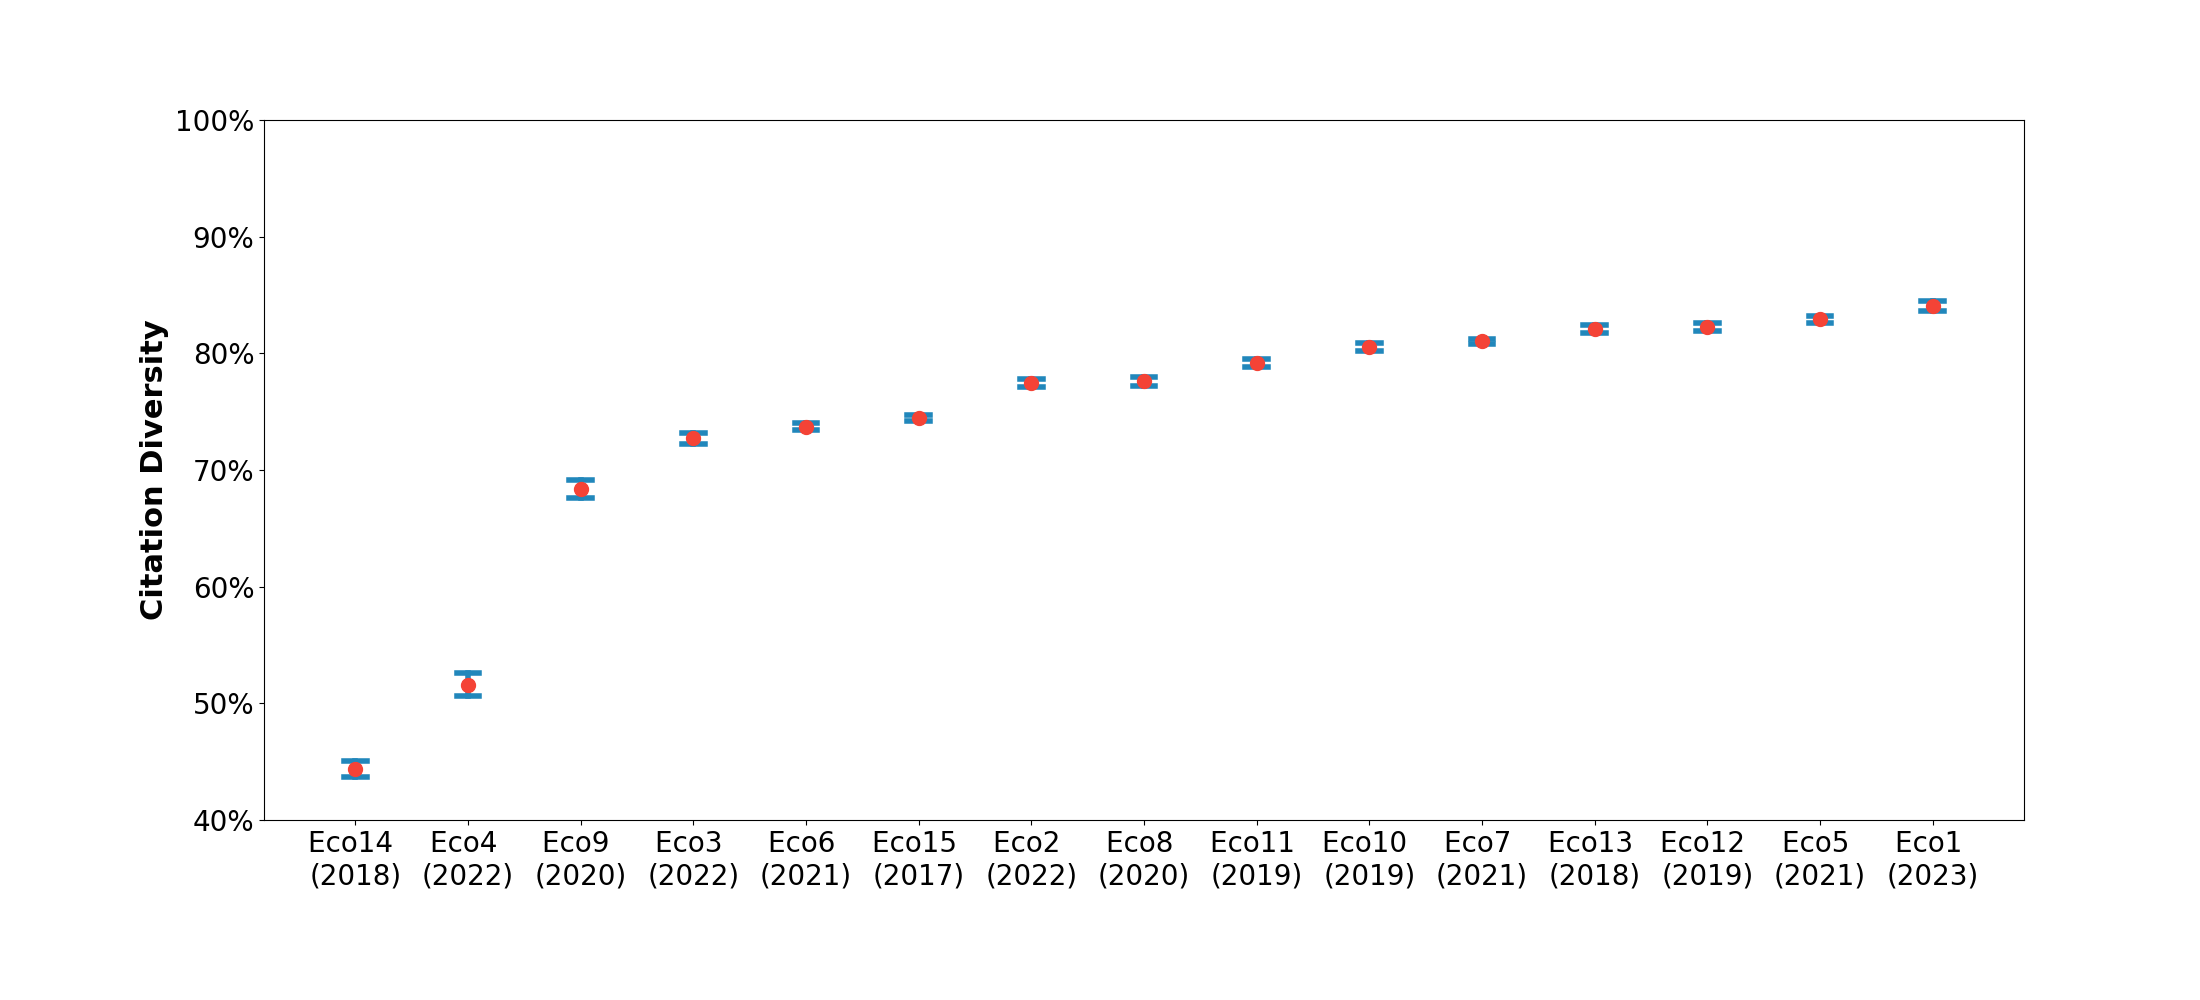
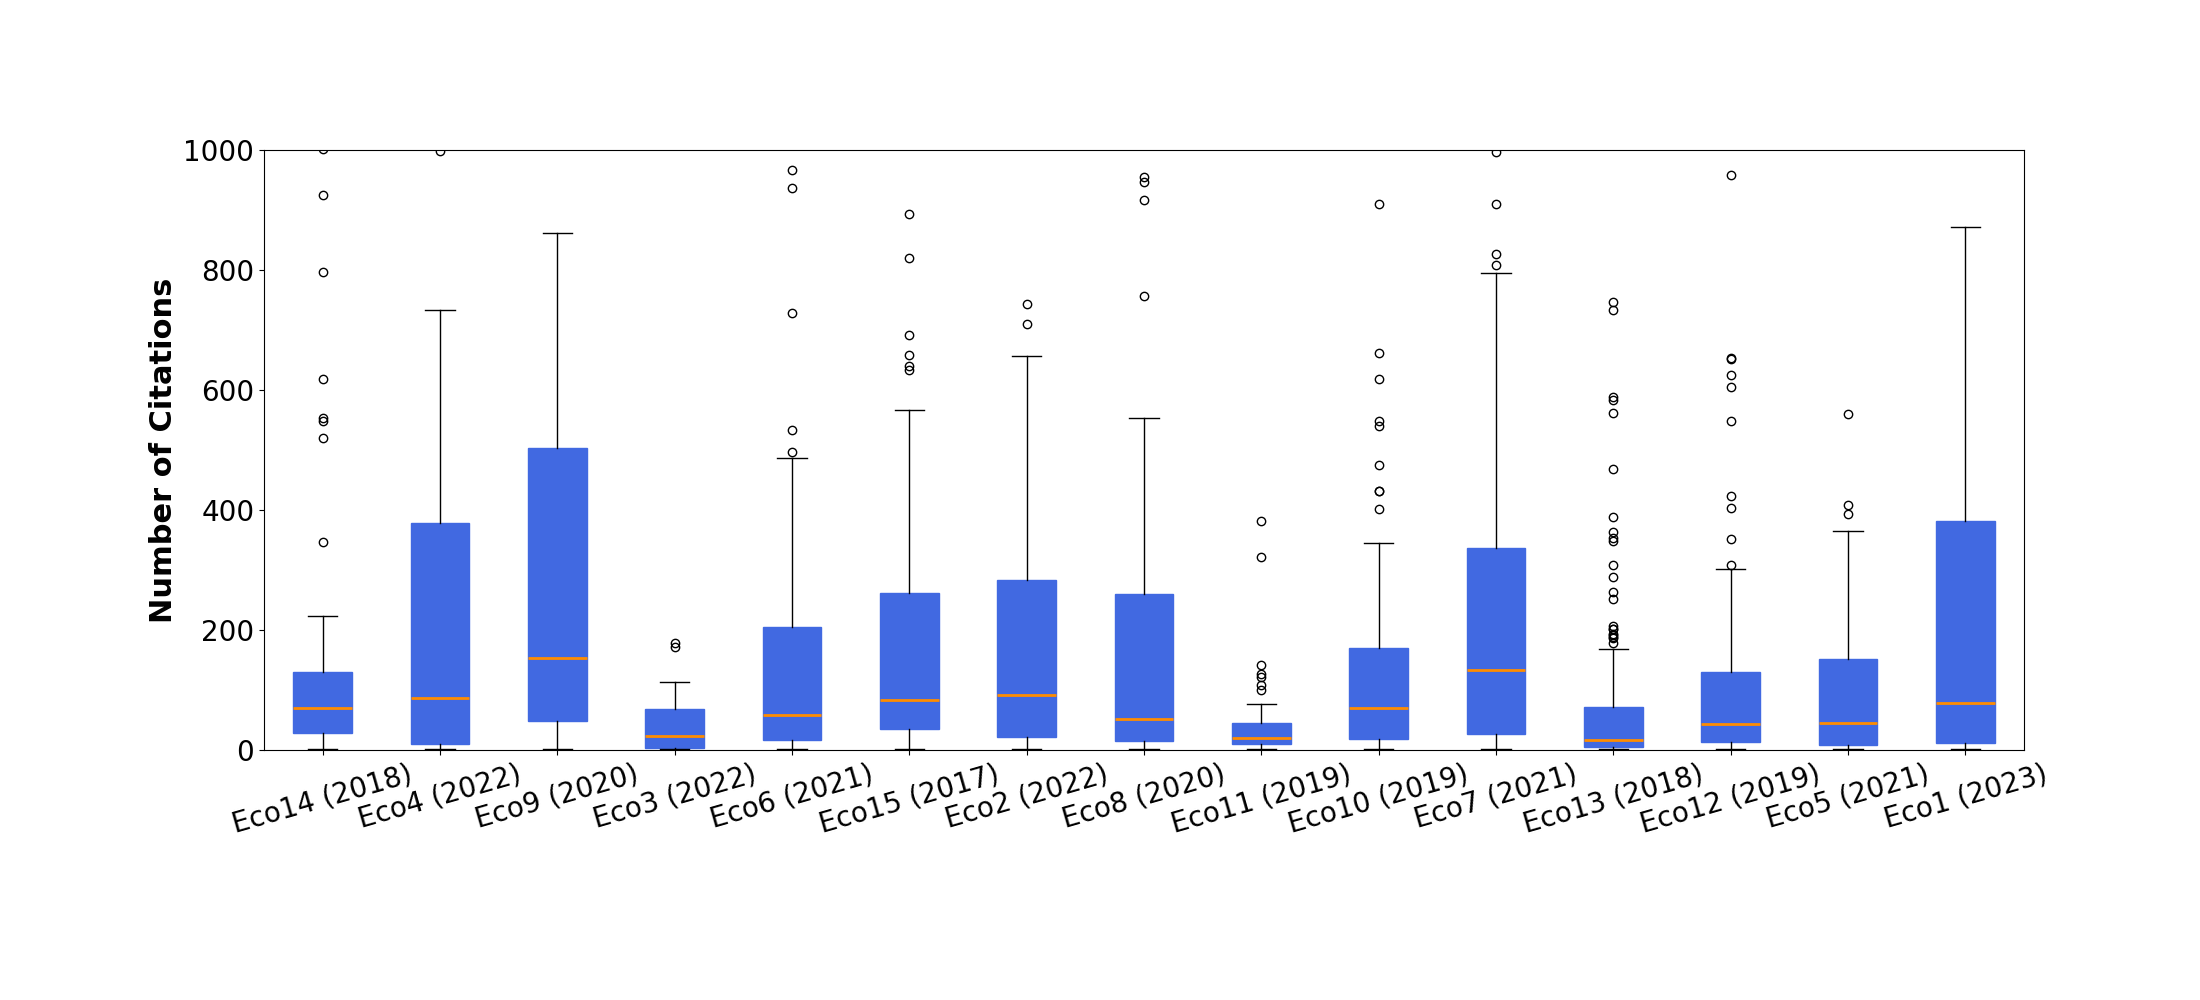
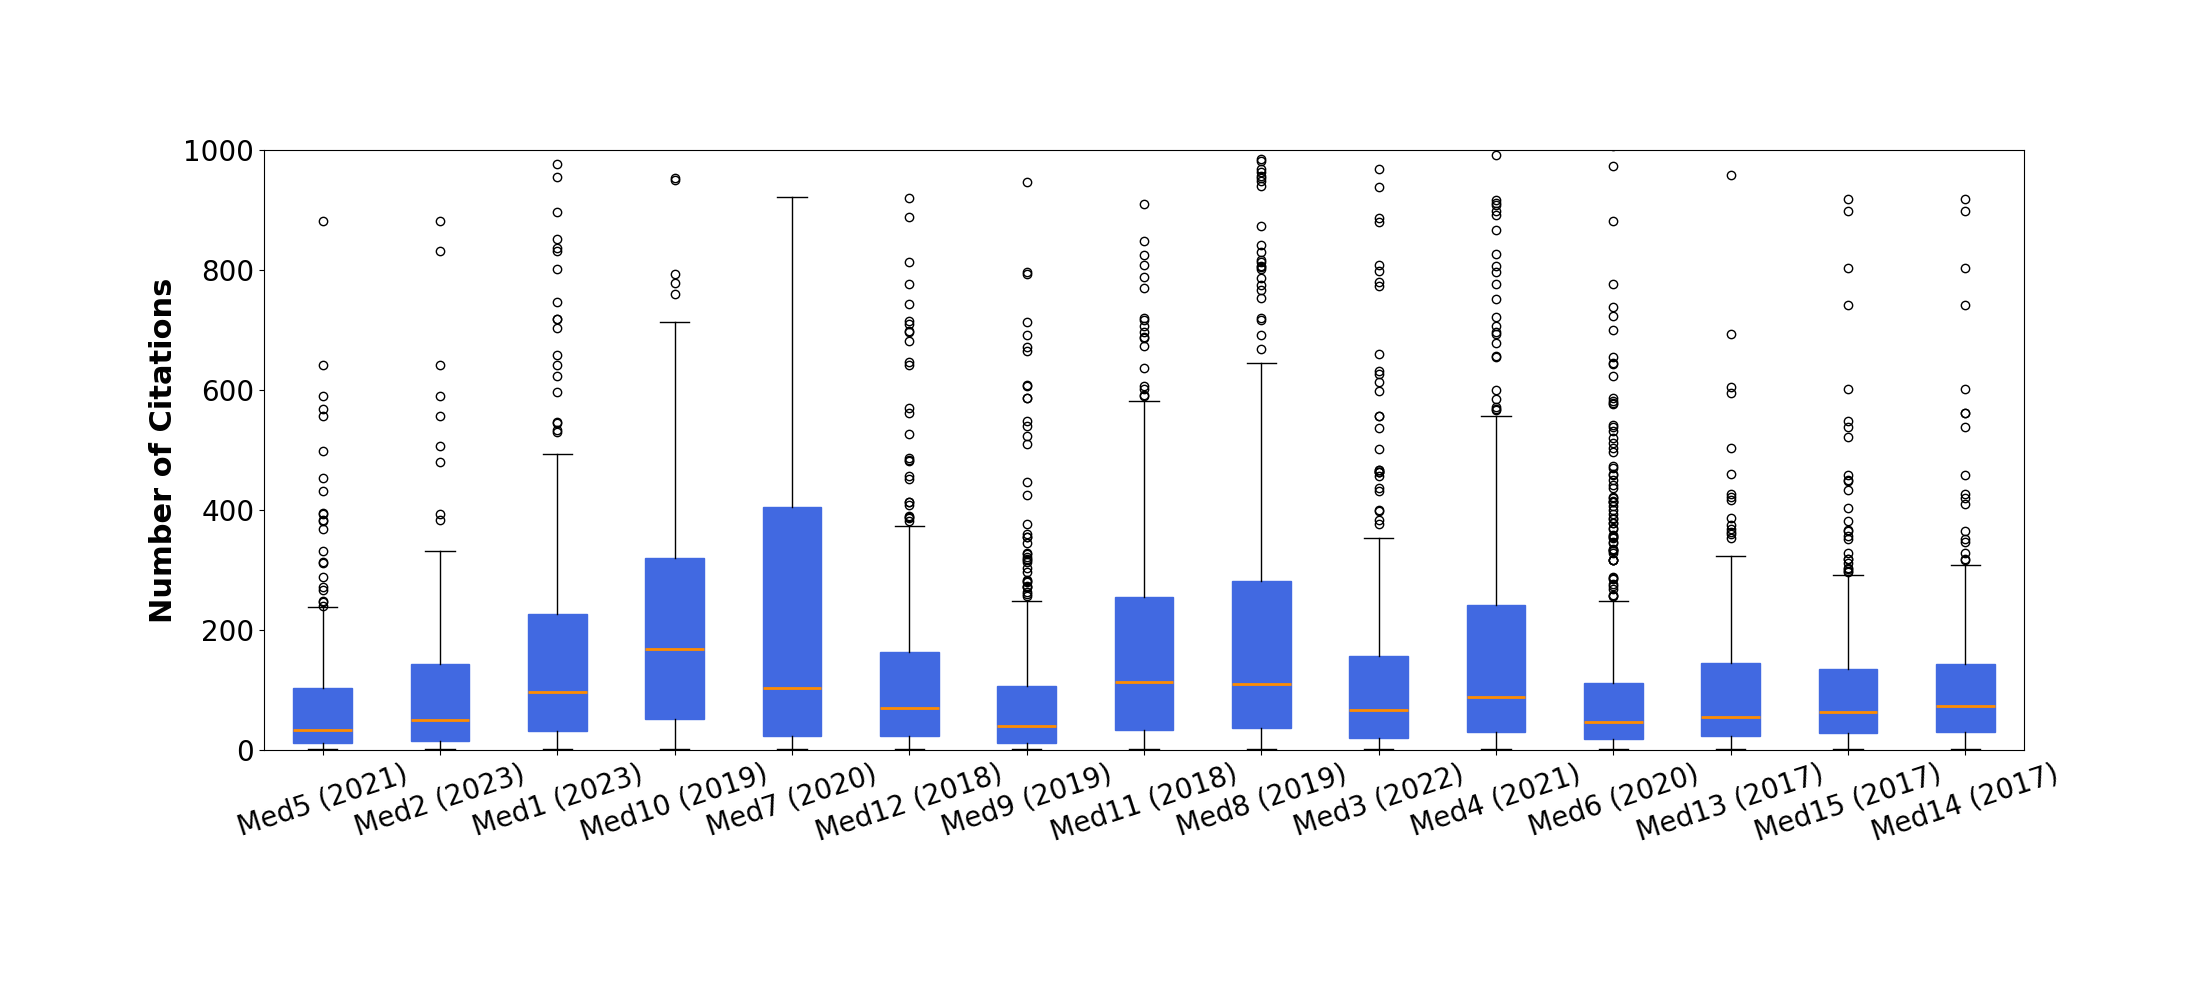
The first Nobel Memorial Prize in economic sciences was awarded in 1969. As of the awarding of the 2023 prize, 55 prizes in economic sciences have been given to 93 individuals. We considered the publication data of 15 distinguished economists between 2017-2023. Table 11 presents the diversity values and average citation counts for these 15 individual Nobel laureates in economics.
| Nobel Laureates | D | |
|---|---|---|
| Eco1 (2023) | 147.54 | 83.92 |
| Eco2 (2022) | 352.53 | 77.60 |
| Eco3 (2022) | 554.38 | 72.74 |
| Eco4 (2022) | 143.22 | 51.51 |
| Eco5 (2021) | 166.18 | 82.97 |
| Eco6 (2021) | 299.72 | 73.64 |
| Eco7 (2021) | 313.47 | 81.01 |
| Eco8 (2020) | 259.66 | 77.51 |
| Nobel Laureates | D | |
|---|---|---|
| Eco9 (2020) | 95.00 | 68.37 |
| Eco10 (2019) | 169.13 | 80.57 |
| Eco11 (2019) | 279.92 | 79.09 |
| Eco12 (2019) | 72.81 | 82.32 |
| Eco13 (2018) | 143.30 | 82.16 |
| Eco14 (2018) | 521.79 | 44.42 |
| Eco15 (2017) | 402.01 | 74.54 |
Fig. 15(a) displays the citation diversity values for each laureate, showing that two recent laureates have very low diversity, indicating high citation inequality. In contrast, citation diversity of the other laureates ranging from 70% to 85%, implying a more balanced citation distribution across their publications. The small confidence intervals for these values reinforce the accuracy of our diversity calculations. Fig. 15(b) presents a box-plot of the total citations for each laureate, maintaining the same order of laureates as in Fig. 15(a) for easy comparison. Although the total citation ranges vary among the laureates, they do not provide significant insights into citation distribution. Instead, our diversity values effectively illustrate the extent of citation inequality among these economics laureates.
IV.3.6 The Nobel Prize winners in Physiology/Medicine
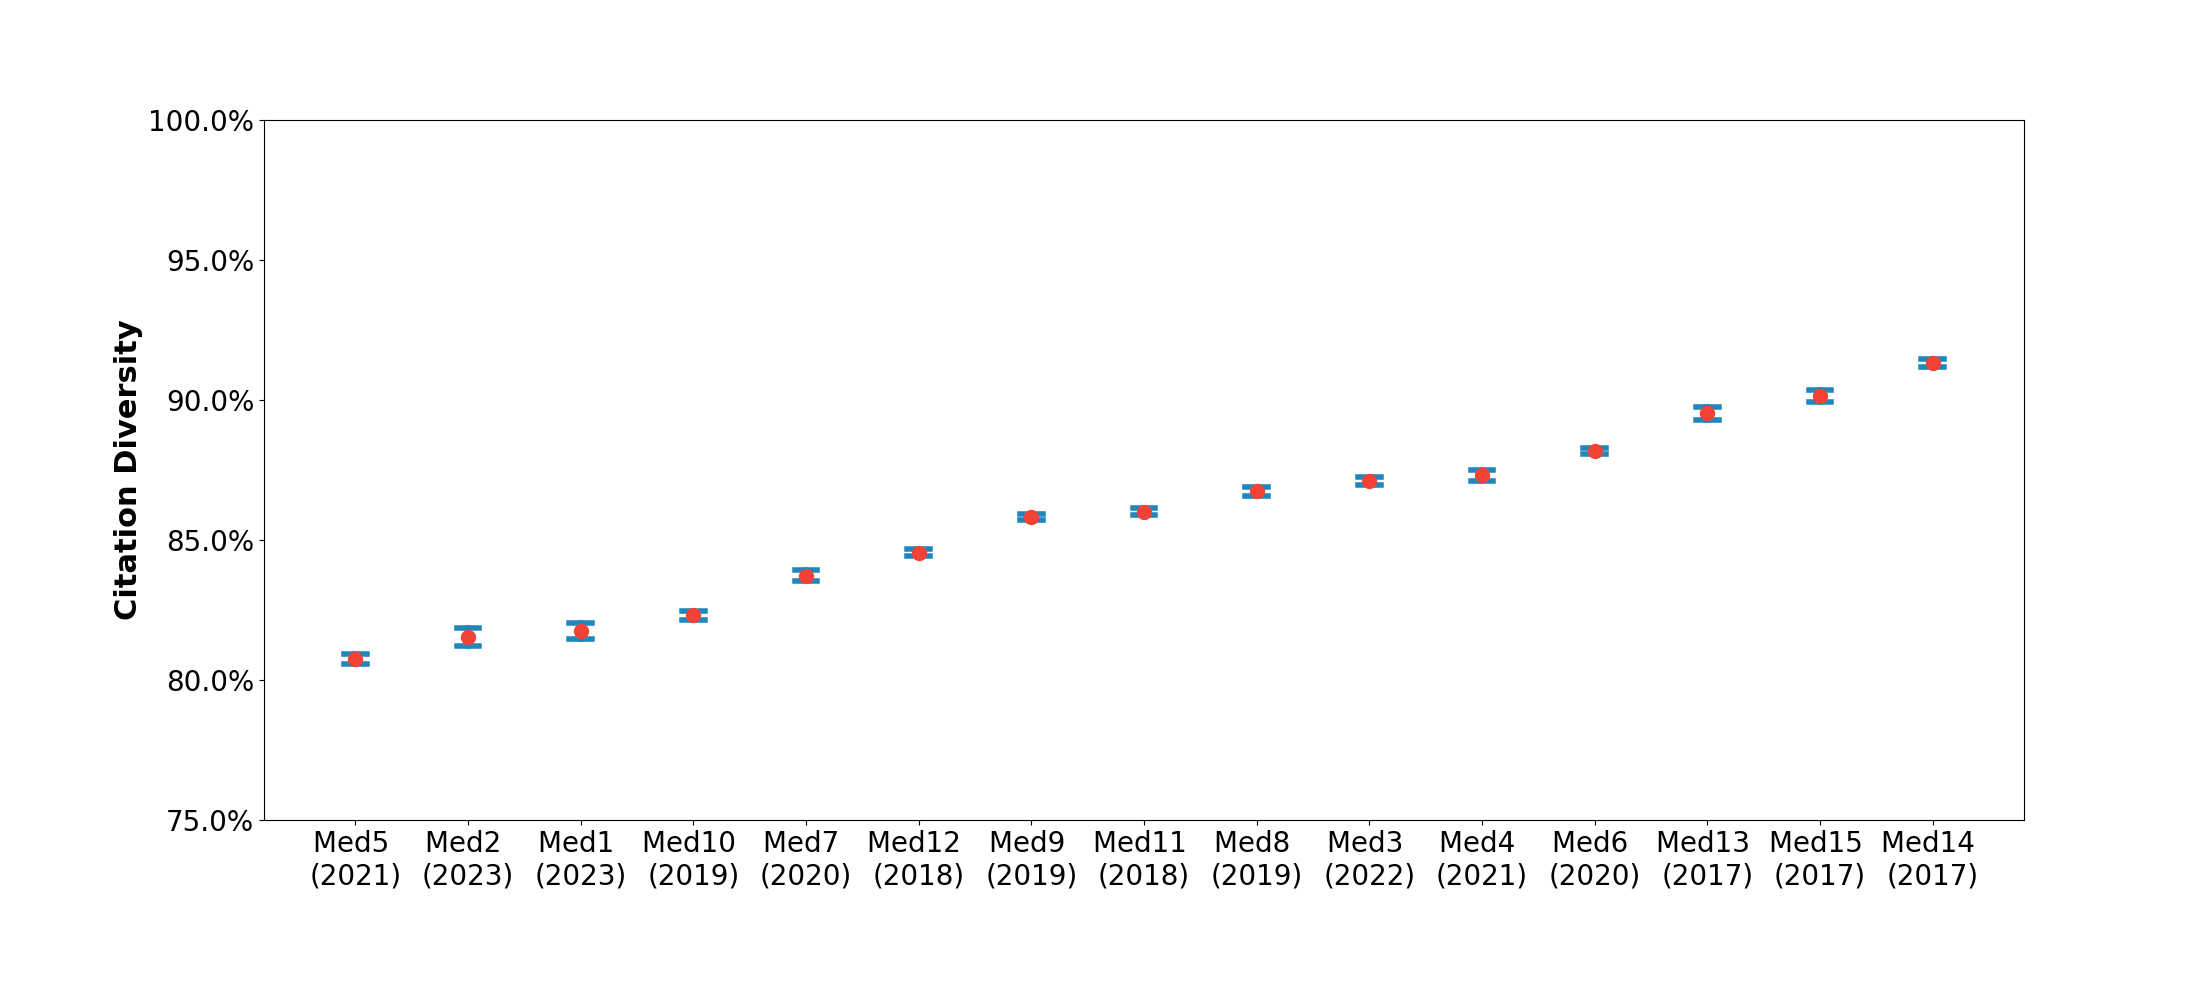
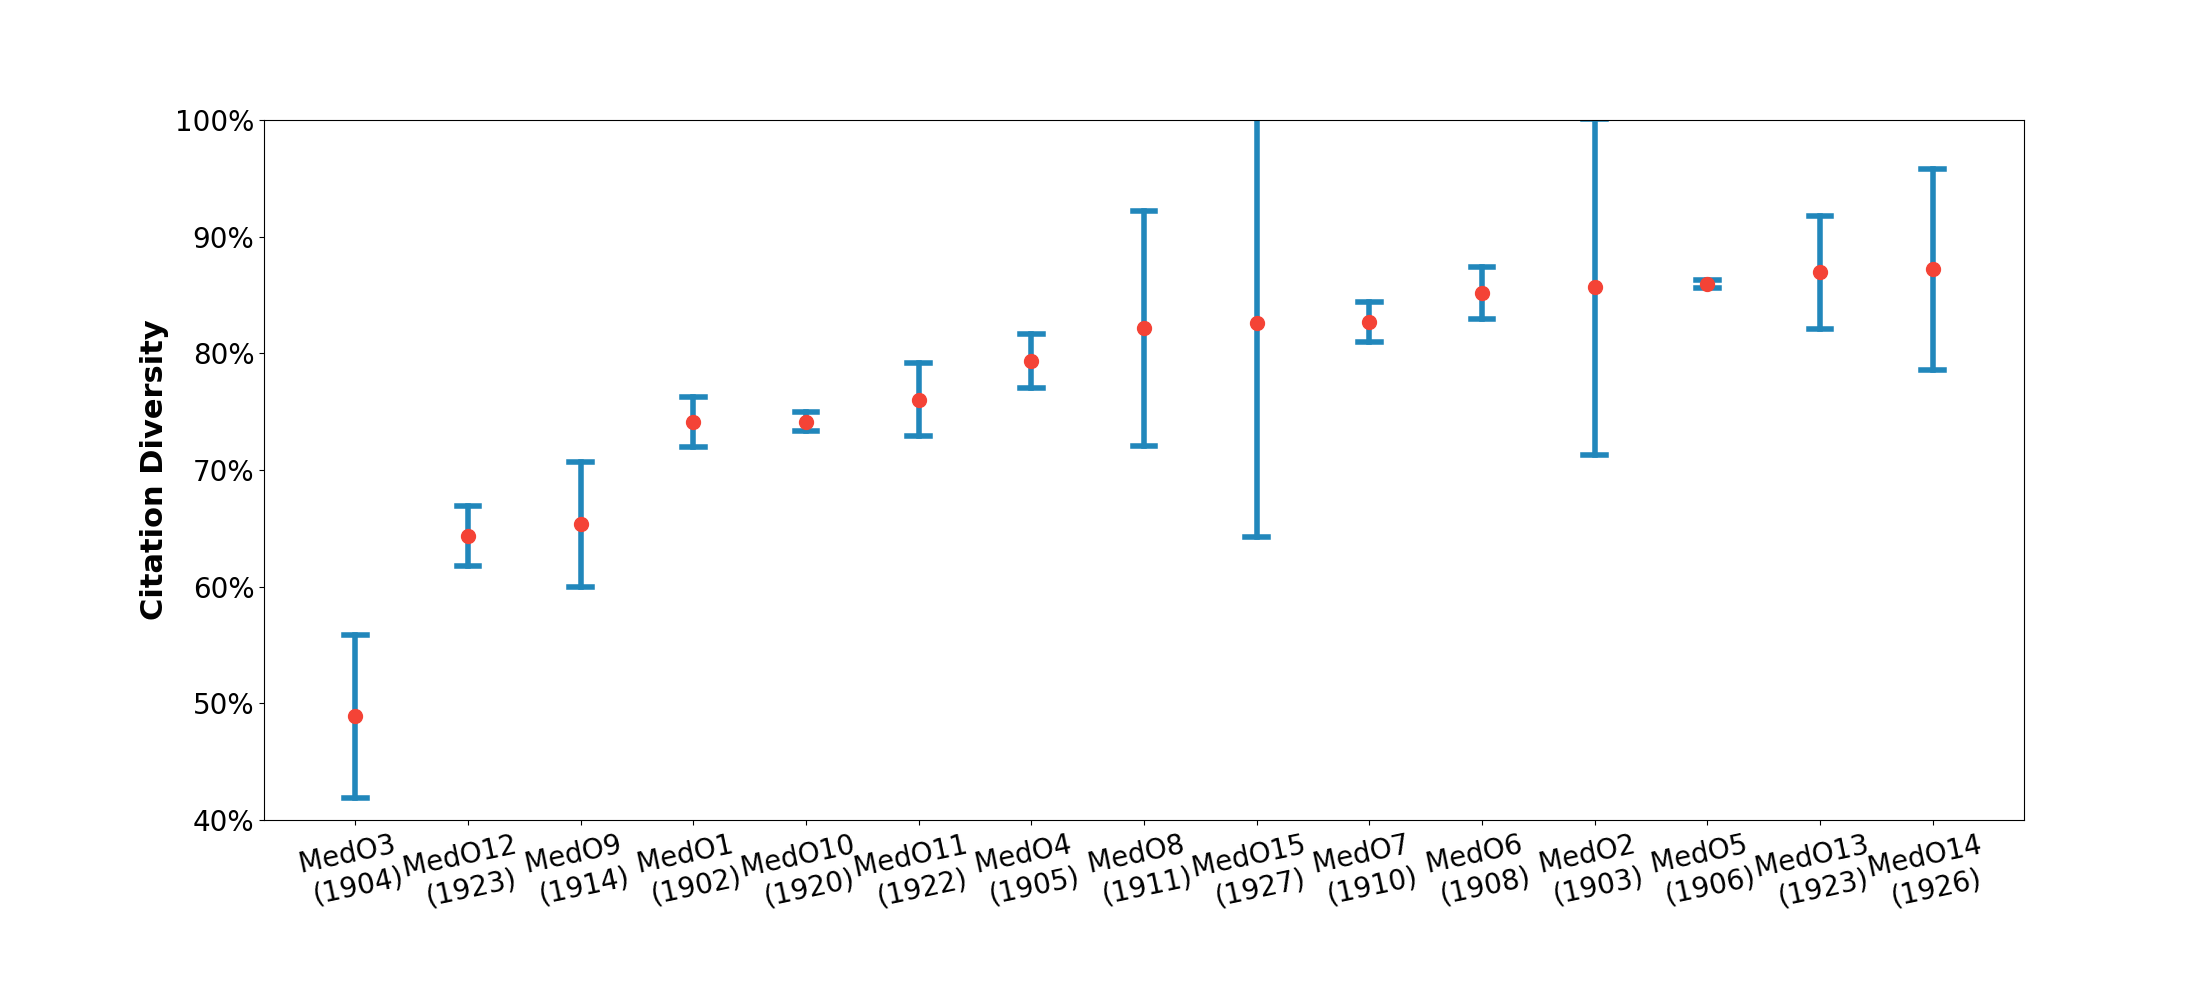
The Nobel prize in physiology/medicine has been awarded 114 times to a total of 227 laureates from 1901 to 2023. Our analysis focuses on two distinct groups: 15 laureates from the period 2017 to 2023 and another 15 from the period 1902 to 1923. Table 12 presents the citation diversity values and corresponding average citation counts for all of their publications.
| Nobel Laureates | D | |
|---|---|---|
| Med1 (2023) | 111.00 | 81.76 |
| Med2 (2023) | 160.58 | 81.65 |
| Med3 (2022) | 194.66 | 87.18 |
| Med4 (2021) | 272.42 | 87.25 |
| Med5 (2021) | 405.67 | 80.78 |
| Med6 (2020) | 152.00 | 88.11 |
| Med7 (2020) | 117.09 | 83.78 |
| Med8 (2019) | 220.28 | 86.70 |
| Med9 (2019) | 287.89 | 85.89 |
| Med10 (2019) | 182.39 | 82.40 |
| Med11 (2018) | 239.69 | 86.06 |
| Med12 (2018) | 134.80 | 84.59 |
| Med13 (2017) | 109.78 | 89.56 |
| Med14 (2017) | 106.91 | 91.27 |
| Med15 (2017) | 123.39 | 90.17 |
| Nobel Laureates | D | |
|---|---|---|
| MedO1 (1902) | 11.61 | 74.00 |
| MedO2 (1903) | 8.00 | 85.56 |
| MedO3 (1904) | 21.75 | 49.05 |
| MedO4 (1905) | 12.08 | 79.20 |
| MedO5 (1906) | 42.05 | 85.84 |
| MedO6 (1908) | 12.42 | 85.08 |
| MedO7 (1910) | 58.13 | 82.72 |
| MedO8 (1911) | 3.67 | 81.92 |
| MedO9 (1914) | 9.24 | 65.30 |
| MedO10 (1920) | 59.63 | 74.14 |
| MedO11 (1922) | 9.72 | 76.17 |
| MedO12 (1923) | 66.69 | 64.33 |
| MedO13 (1923) | 2.82 | 87.07 |
| MedO14 (1926) | 7.43 | 87.36 |
| MedO15 (1927) | 20.00 | 82.23 |
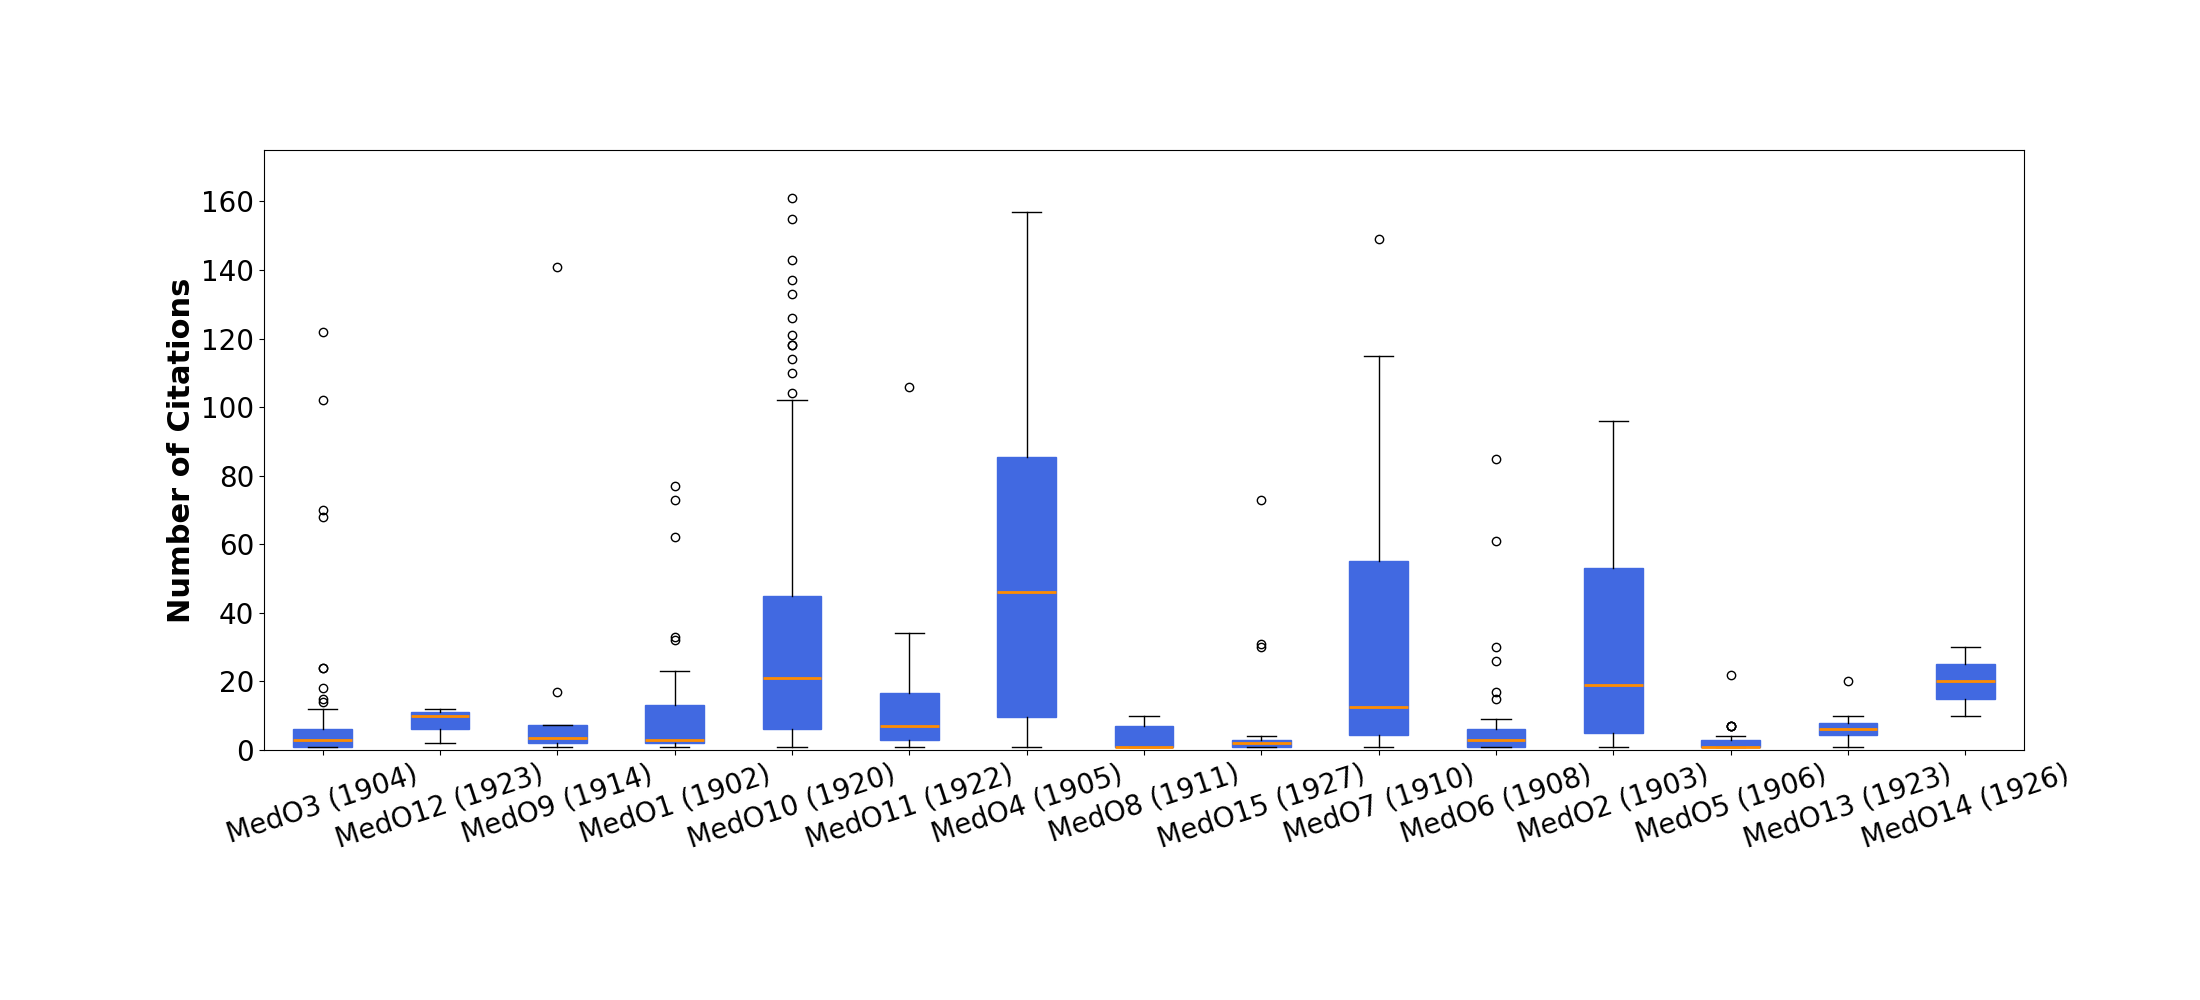
In Fig. 16, we show the diversity values and total citation ranges for 15 recent Nobel laureates in Physiology/Medicine. Fig. 16(a) categorizes them into three groups: five laureates with diversity below 85%, eight between 85%-90%, and two above 90%, indicating low citation inequality overall. The minimal confidence intervals confirm the reliability of these diversity values. In Fig. 17, we examine diversity values and citation ranges of earlier laureates, with most diversity values falling between 65%-87%, except for a laureate from 1904 who shows significant citation inequality. The broader confidence intervals for these early laureates suggest greater uncertainty in the data, unlike the more reliable and precise values seen in recent times.
In summary, this comprehensive analysis across multiple disciplines— physics, chemistry, mathematics, computer science, economics, and physiology or medicine demonstrates the significance of citation diversity values as a more insightful metric than total or average citation counts. In physics, our analysis illustrate that diversity values have risen over time, indicating decreased citation inequality among Nobel laureates. In chemistry, despite an increase in average citation counts, diversity values have remained stable, underscoring their role in revealing citation distribution. Similar findings in mathematics reinforce the relevance of this measure. For Turing award winners in computer science, our calculated diversity measure effectively captures citation distribution, providing clearer insights into citation inequality. In economics, high diversity values denote low citation inequality, offering a comprehensive understanding of laureates’ citation patterns. In physiology or medicine, diversity values have increased in recent times, indicating a more equitable distribution of citations among publications. Since the awards in mathematics, computer science and economics began relatively later we cannot provide a comparative analysis, over time, of the citation diversity values in these 3 disciplines. Our analysis advocate for the adoption of more nuanced metrics in evaluating scholarly impact, fostering a fairer assessment of academic contributions across various scientific fields.
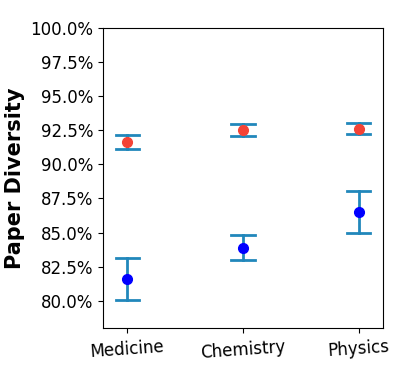
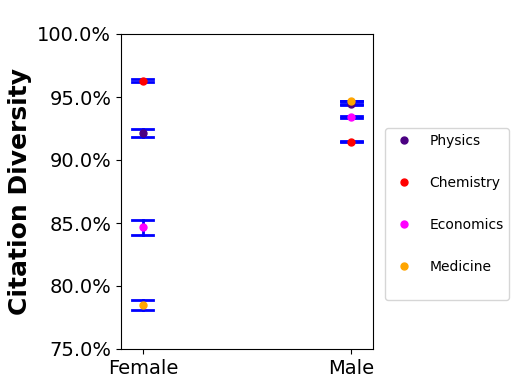
IV.4 Citation diversity in the publication of prize winning male and female scientists
Gender bias in paper citations plays a crucial role in making women’s research less visible. Some well-documented studies [31],[32] highlight the under-attribution of women’s contributions in scientific research, evidenced by a citation gap between male and female authors. However, men and women still publish at similar annual rates and have comparable career-wise impact, with career length and dropout rates explaining many disparities [33]. In an unique approach to gender-based citation analysis, our objective is to examine the uniformity in the distribution of citations of the publications of recent award-winning male and female scientists across six scientific disciplines using the citation diversity measure.
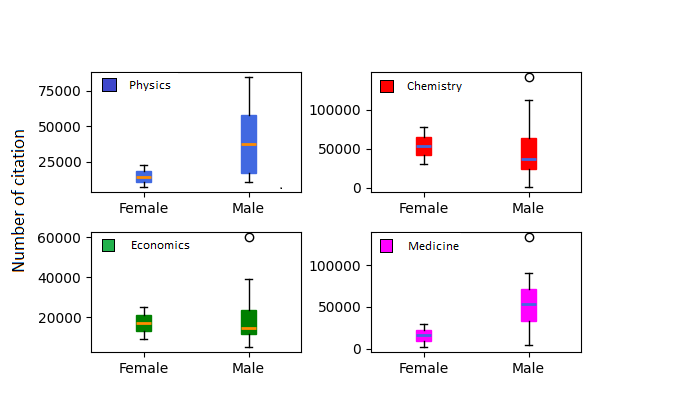
Table 13 provides detailed information on the number of male and female award-winning scientists across different scientific disciplines, along with the period of our analysis. Additionally, the table includes the average citation count per publication for all male and female award winners in different disciplines and our calculated diversity values for these scientists. It is noted that among 126 recent award winners across six disciplines, there were no female scientists in mathematics and computer science during the period under consideration. In a graphical representation, Fig. 18(a) reveals that although both male and female scientists exhibit high diversity (lower inequality) values, indicating low citation inequality, male scientists generally have higher diversity values than female scientists in physics, economics, and physiology/medicine (in physics and physiology/medicine the diversity values of male are very close). In chemistry, however, female award winners show a more even citation distribution than their male counterparts. Both male and female scientists in physics and chemistry have high diversity values (above 90%). Conversely, in economics and physiology/medicine, there is a significant difference in diversity values, with female scientists experiencing higher citation inequality. Additionally, Fig. 18(b) depicts the total citation range for male and female award winners in these four disciplines. Given the greater number of male scientists, their total citation range is higher. However, when examining the average citation count per scientist, female scientists in chemistry have a higher average, supporting the diversity value findings. While the average citation count and total citation range provide some insights, the diversity values more effectively illustrate citation distribution and inequality among male and female award winners in each discipline.
| Discipline | Period of Analysis | Number of Scientists | D | ||||
|---|---|---|---|---|---|---|---|
| Male | Female | Male | Female | Male | Female | ||
| Physics | (2017-2023) | 18 | 3 | 39509.11 | 14823.00 | 94.45 | 91.93 |
| Chemistry | (2015-2023) | 17 | 4 | 49810.94 | 54145.25 | 91.42 | 96.66 |
| Mathematics | (2007-2023) | 21 | 0 | 7117.48 | - | 89.89 | - |
| Computer Science | (2010-2023) | 21 | 0 | 54503.90 | - | 74.22 | - |
| Economics | (2013-2023) | 19 | 2 | 19687.58 | 16950.50 | 93.40 | 85.12 |
| Physiology/Medicine | (2014-2023) | 18 | 3 | 54248.83 | 16066.33 | 94.80 | 78.28 |
V Conclusion
Our extensive study on citation analysis sheds light on various aspects of global citation inequality, offering a detailed understanding of citation patterns across different countries and academic disciplines. Key highlights of our work may be summarized as follows:
-
•
Distribution pattern of citation counts: We examined the distribution of citation counts in top institutes across various countries, revealing the Pareto law nature of the upper end of the distribution with a breakdown at the lower end. We also showed how the Pareto law’s scaling exponent changes with the number of top institutes across the globe.
-
•
Novel citation diversity measure: A new log-normal entropy (LNE) based diversity measure has been introduced to measure citation inequality, enhancing the accuracy and depth of our analysis. Previous research has extensively explored diversity measures across various fields, also employing different metrics to assess citation distributions. However, this study marks the first instance of using an entropy-based diversity measure specifically to quantify citation distribution. We have utilized this innovative metric to effectively measure citation inequality, enhancing our understanding of the disparities in citation patterns.
-
•
Institutional citation diversity measure across the world: We calculated citation diversity measures with confidence intervals, grouping countries based on these measures in top institutes (10, 20, 50) worldwide. This revealed that many small countries share groups with large economic powers, and groupings shift with the number of institutes considered. Box-plots were utilized to study the total number of citations, suggesting the emergence of subgroups based on citation counts.
-
•
Discipline-wise citation diversity: We further calculated citation diversity along with total citation counts (box-plots) of award winning scientists in six disciplines (21 scientists from each discipline), uncovering the importance of measuring citation diversity of award winners across disciplines. Time evolution of the citation diversity across disciplines over the century was also studied in three main disciplines.
-
•
Citation diversity of publications of award winning individual scientists: Citation diversity measures were analyzed for publications by award winning scientists in six disciplines (from 2000-2023 with publicly available data of 15 scientists from each disciplines), showing significant variation across fields. This was also extended to individual award winners from 1901-1920 in three principal disciplines. Also the time evolution of author wise diversity measures in three disciplines provided insights into how citation patterns change over time.
-
•
Gender-based study in citation diversity: A gender-based analysis of citation diversity for male and female scientists in four disciplines highlighted areas of both low and high inequality, with a notable absence of female award winners in two disciplines during our considered period of analysis from 2007 to 2023.
This extensive study, based on the data of the top institutes or highly acclaimed elite researchers, underscores the complexity and diversity of citation practices across the scientific landscape, offering a detailed examination that considers multiple dimensions and perspectives. Our findings suggest that the new citation diversity measure serves as a vital metric for assessing citation inequality, providing exceptional insights that citation counts alone cannot achieve. As a future research project, to portray the citation diversity analysis of the entire scientific community, one may incorporate the data from a larger and more diverse group of scientists, beyond just the elite group of top award winners. Additionally, the investigation of the lower end of citation distributions, either in isolation or in conjunction with other distributional models that adequately fit the overall data, is another important open research question for future research works. This could provide deeper insights into the factors influencing lower citation counts and shed light on the dynamics governing citation inequalities. Through this, we aim to foster a more clearer understanding of scientific contributions globally.
References
- Crespo et al. [2013] J. A. Crespo, Y. Li, and J. R. Castillo, PLOS ONE 8, 1 (2013).
- Nielsen and Andersen [2021] M. W. Nielsen and J. P. Andersen, Proceedings of the National Academy of Sciences 118, e2012208118 (2021).
- Dong et al. [2021] K. Dong, J. Wu, and K. Wang, Journal of Informetrics 15, 101203 (2021).
- Banerjee et al. [2023a] S. Banerjee, S. Biswas, B. K. Chakrabarti, S. K. Challagundla, A. Ghosh, S. R. Guntaka, H. Koganti, A. R. Kondapalli, R. Maiti, M. Mitra, and D. R. S. Ram, International Journal of Modern Physics C 34, 2350048 (2023a).
- Banerjee et al. [2023b] S. Banerjee, S. Biswas, B. K. Chakrabarti, A. Ghosh, and M. Mitra, Entropy 25, 10.3390/e25050735 (2023b).
- Hirsch [2005] J. E. Hirsch, Proc Natl Acad Sci (USA) (2005).
- Yong [2014] A. Yong, Not Am Math Soc (2014).
- Ghosh et al. [2022] A. Ghosh, B. K. Chakrabarti, D. R. S. Ram, M. Mitra, R. Maiti, S. Biswas, and S. Banerjee, Frontiers in Physics 10, 10.3389/fphy.2022.1019744 (2022).
- Shorrocks [1980] A. F. Shorrocks, Econometrica 48, 613 (1980).
- Bossert et al. [2001] W. Bossert, P. K. Pattanaik, and Y. XU, The Measurement of Diversity, Cahiers de recherche 2001-17 (Universite de Montreal, Departement de sciences economiques, 2001).
- Daly et al. [2018] A. J. Daly, J. M. Baetens, and B. D. Baets, Mathematics 6, 10.3390/math6070119 (2018).
- Li et al. [2024] S. Li, X. Yan, M. A. Ai, C. Rensing, A. Hu, A. N. Tsyganov, Y. Mazei, A. Smirnov, N. Mazei, and J. Yang, mSystems (2024).
- Magurran and [eds.] A. Magurran and B. J. M. (eds.), Biological Diversity: Frontiers in Measurement and Assessment. (Oxford University Press, Oxford, 2011).
- Rajaram et al. [2017] R. Rajaram, B. Castellani, and A. N. Wilson, Complexity 2017, 10.1155/2017/8715605 (2017).
- Nsakanda et al. [2007] A. L. Nsakanda, W. L. Price, M. Diaby, and M. Gravel, European Journal of Operational Research 178, 634 (2007).
- Jost [2006] L. Jost, Oikos 113, 363 (2006).
- Ghosh and Basu [2023] A. Ghosh and A. Basu, Trends in Mathematical, Information and Data Sciences: A Tribute to Leandro Pardo, edited by N. Balakrishnan, M. Á. Gil, N. Martín, D. Morales, and M. d. C. Pardo (Springer International Publishing, Cham, 2023) pp. 199–211.
- Ghosh and Basu [2021] A. Ghosh and A. Basu, IEEE Transactions on Information Theory 67, 2141 (2021).
- [19] Available from https://web.archive.org/web/20240413201448/https://webometrics.info/en/transparent, .
- [20] Available from https://www.webometrics.info/en/transparent, .
- [21] Available from https://www.scopus.com/home.uri, .
- Rao [1982] C. Rao, Theoretical Population Biology 21, 24 (1982).
- Shannon [1948] C. E. Shannon, Bell System Technical Journal 27, 379 (1948).
- Renyi [1961] A. Renyi, University of California Press, Berkeley , 547 (1961).
- Aguillo et al. [2010] I. Aguillo, J. Bar-Ilan, and e. a. M. Levene, Scientometrics 85, 243–256 (2010).
- Bleda et al. [2014] A. M. Bleda, M. Thelwall, K. Kousha, and I. F. Aguillo, Scientometrics 101, 337 (2014).
- Gomez et al. [2022] C. J. Gomez, A. C. Herman, and P. Parigi, Nature Human Behaviour 6 (2022).
- Abramo et al. [2016] G. Abramo, C. A. D’Angelo, and A. Soldatenkova, Scientometrics (2016).
- Flegl and Vydrova [2014] M. Flegl and H. V. Vydrova, In 11th conference on “efficiency and responsibility in education”, Prague (2014).
- Gupta et al. [2005] H. M. Gupta, J. R. Campanha, and R. A. G. Pesce, Brazilian Journal of Physics 35, 981 (2005).
- Teich et al. [2022] E. G. Teich, J. Z. Kim, C. W. Lynn, S. C. Simon, A. A. Klishin, K. P. Szymula, P. Srivastava, L. C. Bassett, P. Zurn, J. D. Dworkin, and D. S. Bassett., Nature Physics 18 (2022).
- Sebo and Clair [2023] P. Sebo and C. Clair, Journal of General Internal Medicine 38 (2023).
- Huang et al. [2020] J. Huang, A. J. Gates, R. Sinatra, and A. L. Barabási, Proc Natl Acad Sci U S A. (2020).