[ type=editor, auid=000, bioid=1, orcid=0000-0002-9568-8711 ] \cormark[1]
[ ]
[ orcid=0000-0003-1460-1002 ] \cormark[1]
[cor1]Corresponding author
Phase changes of the flow rate in the vertebral artery caused by debranching thoracic endovascular aortic repair: effects of flow path and local vessel stiffness on vertebral arterial pulsation
Abstract
Despite numerous studies on cerebral arterial blood flow, there has not yet been a comprehensive description of hemodynamics in patients undergoing debranching thoracic endovascular aortic repair (dTEVAR), a promising surgical option for aortic arch aneurysms. A phase delay of the flow rate in the left vertebral artery (LVA) in patients after dTEVAR compared to those before was experimentally observed, while the phase in the right vertebral artery (RVA) remained almost the same before and after surgery. Since this surgical intervention included stent graft implantation and extra-anatomical bypass, it was expected that the intracranial hemodynamic changes due to dTEVAR were coupled with fluid flow and pulse waves in cerebral arteries. To clarify this issue, A one-dimensional model (D) was used to numerically investigate the relative contribution (i.e., local vessel stiffness and flow path changes) of the VA flow rate to the phase difference. The numerical results demonstrated a phase delay of flow rate in the LVA but not the RVA in postoperative patients undergoing dTEVAR relative to preoperative patients. The results further showed that the primary factor affecting the phase delay of the flow rate in the LVA after surgery compared to that before was the bypass, i.e., alteration of flow path, rather than stent grafting, i.e., the change in local vessel stiffness. The numerical results provide insights into hemodynamics in postoperative patients undergoing dTEVAR, as well as knowledge about therapeutic decisions.
keywords:
Intracranial blood flow, vertebral artery, 1D analysis, nonlinear wave dynamics, Riemann invariants, debranching TEVAR, computational biomechanics1 Introduction
Aortic aneurysm, which is morphologically defined as the focal dilation and structural degradation of the aorta, is an asymptomatic disease, and its rupture is a significant cause of death worldwide. For instance, in the United States of America, aortic aneurysms and dissections cause over deaths each year (Go et al., 2013; Milewicz and Ramirez, 2019). To date, thoracic endovascular aortic repair (TEVAR) is the only effective treatment for aortic aneurysm. TEVAR has been a particularly attractive surgical intervention because it is less invasive than conventional open surgical repair (Goto et al., 2019; Narita et al., 2016; Shijo et al., 2016; Shimamura et al., 2008).
The aorta is the largest conduit artery in the body, and due to its extraordinary ability to expand and contract, it serves as a reservoir that transforms the highly pressured and pulsatile heart output into a flow with moderate fluctuations (Ku, 1997). Deterioration of this buffering effect due to stiffening of the arterial wall is the main cause of hypertension (Ku, 1997; Liu and Fung, 1989). These dynamics of the aorta are also important for propagation of the pulse wave, which has been recognized as an early indicator of the health status of the cardiovascular system (Hametner et al., 2021; Laurent et al., 2006; Townsend et al., 2015). Thus, understanding the hemodynamic differences between pre- and postoperative TEVAR patients based on pulse-wave dynamics is of paramount importance, not only for surgical decision-making to achieve optimal clinical outcomes, but also for evaluating postoperative hemodynamics.
In TEVAR, the aortic arch is mapped according to the segmentation of the vertebral column or landing zone (Ishimaru, 2004), where zone ranges from the ascending aorta (AA) to the origin of the innominate artery (IA), zone ranges from the IA to the origin of the left common carotid artery (LCCA), zone ranges from the LCCA to the left subclavian artery (LSA), and zones 3 and 4 follow in the longitudinal direction. TEVAR for partial arch debranching, known as debranching TEVAR (dTEVAR), includes both stent graft implantation and extra-anatomical bypass, where the stent graft is placed from zone or with a length of several millimeters depending on the patient. This operation is most often performed in high-risk patients with thoracic aortic aneurysms (TAA) (Narita et al., 2016; Shijo et al., 2016; Shimamura et al., 2008). Currently, expanded polytetrafluoroethylene (ePTFE) and polyethylene therephthalate (PET) are the two most popular graft materials in abdominal aortic aneurysm repair due to their remarkable biocompatibility and durability. Additional supra-arch vessel reconstruction in dTEVAR is known to prevent cerebral infarction (Hajibandeh et al., 2016; Shigemura et al., 2000; Ullery et al., 2012; Yoshitake et al., 2016) and ischemia in the cerebral circulation (Cooper et al., 2009; Feezor and Lee, 2009; Patterson et al., 2014).
A previous experimental study has shown that total intracranial blood flow was preserved after dTEVAR, with significant decrease of flow in the LVA and significant increase of flow in the RVA (Goto et al., 2019). The hemodynamic mechanism of such changes in posterior cerebral circulation after dTEVAR remains uncertain yet due the technical difficulty of measurements. Thus, our primary concern here is to evaluate bilateral vertebral artery blood flows under pulsation between the patients before and after dTVEAR with axillo-axillary artery (AxA-AxA) bypass, and to clarify the hemodynamic mechanism associated with postoperative significant changes of posterior cerebral circulation. Since dTEVAR includes extra-anatomical bypass, it was expected that the intracranial hemodynamic changes due to dTEVAR would be coupled with fluid flow and pulse waves in the VA. Therefore, the objective of this study was to numerically clarify whether there exist phase differences of the flow rate in the VA, as a representative intracranial vessel, between patients before and after dTEVAR, especially in cases with one bypass from the right axillary artery (RAxA) to the left axillary artery (LAxA) and embolization at the branch point between a stent-grafted aortic arch and the LSA (see Figure 1). If phase differences of the flow rate exist, we clarify how surgery contributes to it. Hereafter, we refer to this operation as single-debranching TEVAR (dTEVAR). A one-dimensional (D) model analysis was used to numerically investigate blood flow rates in the L/RVA in pre- and postoperative patients after dTEVAR.
In a human aorta with mm radius and mm thickness, the wave speed, quantified by the traditional foot-to-foot wave velocity method, e.g., by Laurent et al. (2006), is over m/s (Latham et al., 1985). Such conventional experimental methodology, however, is still difficult to quantify the effect of pulse waves in the VA on the intracranial blood supply. Furthermore, assuming that one pulse has a duration of second, the ratio between the wave length and radius is , i.e., long wave. Numerical analysis for blood flow with long-wave pulses still involves a heavy computational load even with a two-dimensional model, although several attempts for this issue were reported, e.g., in Yokoyama et al. (2021). D model analysis is one of the most effective and practical non-invasive solutions to investigate hemodynamics with long-wave pulses (Formaggia et al., 2003; Taylor and Draney, 2004; van de Vosse and Stergiopulos, 2011). Thus, for practical purposes, 1D modeling has been widely used in circulatory systems, such as the systemic arteries (Alastruey et al., 2011; Olufsen, 1999), coronary circulation (Duanmu et al., 2019; Huo and Kassab, 2007; Mynard et al., 2014), the circle of Willis (Alastruey et al., 2007), and large vasculature, including venous systems coupled with contributions of the microcirculation modeled by lumped parameters (Alastruey et al., 2008; Duanmu et al., 2019; Huo and Kassab, 2007; Liang et al., 2009; Mynard et al., 2012, 2014). Recently, D modeling was applied to a problem involving both blood flow rate and blood oxygenation (Feiger et al., 2020). Padmos et al. (2020) used patient-specific medical imaging data on the anatomy of the circle of Willis to perform a D model analysis of intracranial blood flow assuming a steady state, coupled with three-dimensional tissue perfusion. In this study, the experimental evidence on differences in the flow rate in the L/RVA between patients before and after dTEVAR was reported. Next, using 1D numerical model, the phase difference of the flow rate in the L/RVA in pre- and postoperative patients was evaluated. Simulations were also performed for different local vessel stiffnesses and lengths of vessels that had stiffened due to stent grafting.
2 Materials and Methods
2.1 Subjects and measurements
This retrospective study was conducted in accordance with the guidelines of the Declaration of Helsinki. All experimental protocols were approved by the institutional review board of Osaka University. All subjects provided oral and written informed consent to participate in this study. A prospective analysis of blood flow in the left and right internal carotid arteries (L/RICA) and the L/RVA in 9 patients before and after dTEVAR was performed between January and January at Osaka University Hospital, where RAxA-LAxA bypass was performed (see also Figure 1B). A ringed -mm ePTFE graft (FUSION, MAQUET Getinge Group, Japan) was used in all the debranching procedures (see also (Goto et al., 2019)). Two-dimensional (D) cine phase-contrast data was acquired with T magnetic resonance imaging (MRI) (MR-T, GE Healthcare, Waukesha, WI, USA). Validations of the resolution of T MRI have been performed in in vivo studies, for instance, by Calderon-Arnulphi et al. (2011) and Zhao et al. (2007). In all patients, MRI was performed within months prior to the dTEVAR procedure and within month afterward (Goto et al., 2019).
. ID Artery Radius [mm] Length [mm] Left Ventricle (LV; inlet boundary) - Ascending Aorta (AA) Aortic Arch I Aortic Arch II Thoracic Aorta Brachiocephalic Right Subclavian (RSA) Right Axillary Right Vertebral (RVA) Right Carotid Right External Carotid (RECA) Right Internal Carotid (RICA) Left Carotid Left External Carotid (LECA) Left Internal Carotid (LICA) Left Subclavian (LSA) Left Axillary Left Vertebral (LVA) Bypass Stent-Grafted Region (–)
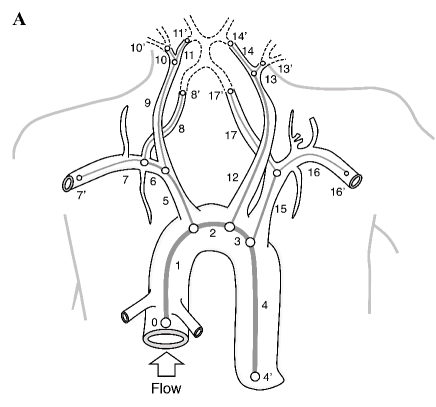
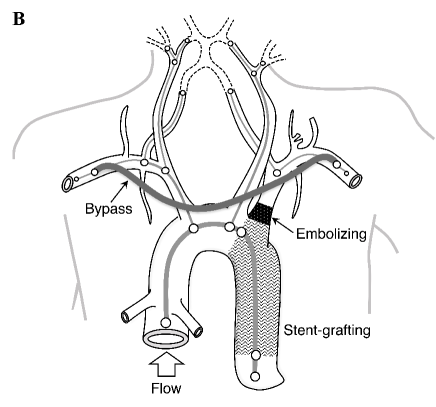
The vascular tree models of both pre- and postoperative patients were reconstructed based on geometrical parameters of vessel diameter and length between branch points, as shown in Figure 1. Arterial vascular geometries, including reference radius () and length () in a representative patient, were measured both pre- and postoperatively at Osaka University Hospital, and the data are summarized in Table 1. The diameters of the end terminals, which are denoted by the vessel ID in Figure 1(A), were determined so that the time-average flow rate became similar to that obtained with experimental measurements by Bogren and Buonocore (1994) or Goto et al. (2019) (see Figure 4). The lengths of the end terminals were uniformly set to mm. For simplicity, branch angles were uniformly set to deg. The effect of branch angle is mentioned in § 3.5. To represent arterial trees in patients after dTEVAR, The Young’s modulus was set to be almost times larger in the stent-grafted area (vessel ID ; see Table 1) than in preoperative patients, and also created a bypass from the RAxA to the LAxA (vessel ID and ) with embolization at the branch point from the stent-grafted thoracic aorta to the LSA (see Figure 1(B)). In this study, the bypass was considered to have a radius of mm and a length of mm, and the stent-grafted artery was considered to have a radius of mm and a length of mm. The diameters and lengths of end terminals were also the same as those in the preoperative vascular tree model.
2.2 Mathematical model and simulation
The D governing equations describe the conservation of mass and momentum:
| (1a) | |||
| (1b) | |||
where is the axial direction, is the area of a cross-section at and at time , is the mean volumetric flow rate across a section, is the velocity of the fluid averaged across the section, is the pressure, ( kg/m3) is the blood density, is the coefficient of the velocity profile, and () is the drag coefficient for the blood viscosity ( Pas). A flat velocity profile was assumed, and set to be (Sherwin et al., 2003). Assuming static equilibrium in the radial direction of a cylindrical tube or thin elastic shell, one can derive a pressure relationship of the form (Olufsen, 1999)
| (2) |
and
| (3) | ||||
| (4) |
where , , and are the vessel thickness, vessel radius, and sectional area, respectively, at the equilibrium state , is the Young’s modulus, is the external pressure, assumed as a constant, is the Poisson ratio, which is set to be for practical incompressibility, and (–) are the coefficients set to kg/(s2m), 1/m, and kg/(s2m) (Olufsen, 1999; Taylor and Draney, 2004). These parameter values were also used in previous 1D blood flow analyses, e.g., by Alastruey et al. (2011) and Smith et al. (2002). Since the effect of does not appear in owing to equations (3) and (4), and since the vessel stiffness is simply characterized by , which is determined mainly by the reference radius and parameters , the value of in each artery was simply assumed as one-tenth of the diameter , i.e., . Thus, the order of magnitude of the calculated Young’s modulus, referring to the values of in Table 1, was MPa, which is consistent with that of aortic elasticity in conscious dogs (Armentano et al., 1991). The Young’s modulus of the bypass was set to be times larger than that obtained with the reference radius ( mm), i.e., MPa. Given that a previous numerical analysis of ePTFE stent grafts used a Young’s modulus of MPa (Kleinstreuer et al., 2008), we set the same order of magnitude of the Young’s modulus in the stent grafted region, i.e., MPa.
The governing equations (1) can be written as an advection equation:
| (5) |
where the variable , advection term , source term , and Jacobian are written as
| (6) |
The flow and pulse wave are integrated over time by the Lax-Wendroff method with s from to . The precise descriptions are given in the Appendix.
| Symbol | Physical meaning | Value | Reference |
| Cross-sectional area at and at time | |||
| Average fluid velocity at | |||
| Pressure at | |||
| External pressure | Pa | - | |
| Maximal pressure | Pa | - | |
| Base pressure | Pa | - | |
| Wave period | s | - | |
| Blood density | kg/m3 | - | |
| Blood viscosity | Pas | - | |
| Blood kinematic viscosity () | m2/s | - | |
| Poisson ratio | - | ||
| Coefficient of the velocity profile | Sherwin et al. (2003) | ||
| Drag coefficient () | |||
| Vessel radius at | |||
| Vessel cross-sectional area () at | |||
| Young’s modulus at | |||
| () | Coefficients for | kg/(sm) | Olufsen (1999); Smith et al. (2002) |
| m-1 | Olufsen (1999); Smith et al. (2002) | ||
| kg/(sm) | Olufsen (1999); Smith et al. (2002) |
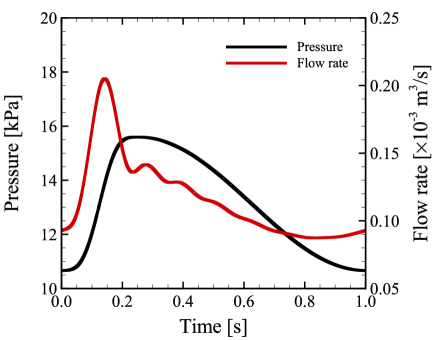
To capture the internal pressure profile in the heart during a cardiac cycle, wherein vascular pumping is accelerated in the systolic phase and attenuated in the diastolic phase (Morishita et al., 2021), the inlet pressure is given as (Yokoyama et al., 2021)
| (7) |
and
| (8) |
where ( Pa) is the amplitude from the base pressure ( Pa), ( s) is the wave period, and or is the waveform parameter (black line in Figure 2). Hereafter, the subscripts s and d denote the systolic and diastolic phases, respectively. In this study, and (Yokoyama et al., 2021) were used, so that the derivatives up to the fourth of are continuous. The waveform reflects a fast expansion during the systolic phase and a slow contraction during the diastolic phase . The parameters in our simulations and their values are shown in Table 2.
Figure 2 shows pressures and calculated flow rates during a period ( s). The model pressure given in equations equation (7) and (8) well captures the profile of human aortic pressure (Figure a in the work by van de Vosse and Stergiopulos (2011)). A no-reflection condition was applied for each outlet by a backward Riemann invariant . A more precise description of the methodology is presented in the Appendix.
3 Results
3.1 Measurements of flow rate in pre-and postoperative patients
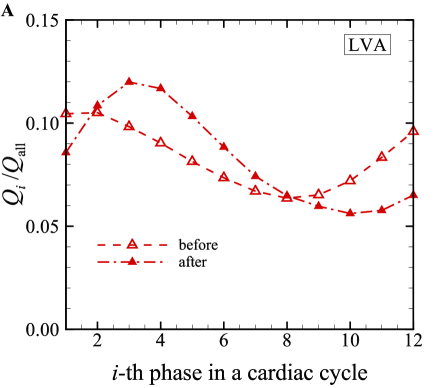
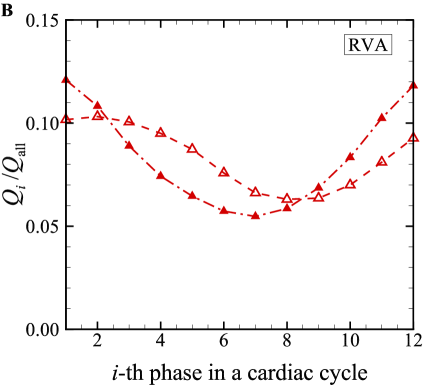
The flow rates in both the L/RVA in patients before and after dTEVAR during a single heartbeat were measured by D cine phase-contrast MRI. The mean flow rates are shown in Figure 3, where the heartbeat was divided into parts and the flow rate at the -th phase was normalized by the total flow rate in both the L/RVA during a period . The first phase (i.e., ) was defined when the pulse wave was detected by an accelerometer (GE Healthcare) with the tip of a forefinger. Compared to the peak in the second phase of the cardiac cycle (i.e., ) in the LVA of preoperative patients, the peak in postoperative patients was delayed to the third phase (i.e., ). Thus, a -period (%) phase delay in the LVA was observed between before and after surgery (Figure 3(A)). On the other hand, the peak of the flow rate ratio in the RVA (the first phase, ) remained almost the same before and after surgery (Figure 3(B)). Since the difference of flow rate ratio in the RVA between the first and second phases of the cardiac cycle was very small, we concluded that the first phase of the cardiac cycle was the time point of the peak of the flow rate ratio.
3.2 Model validation
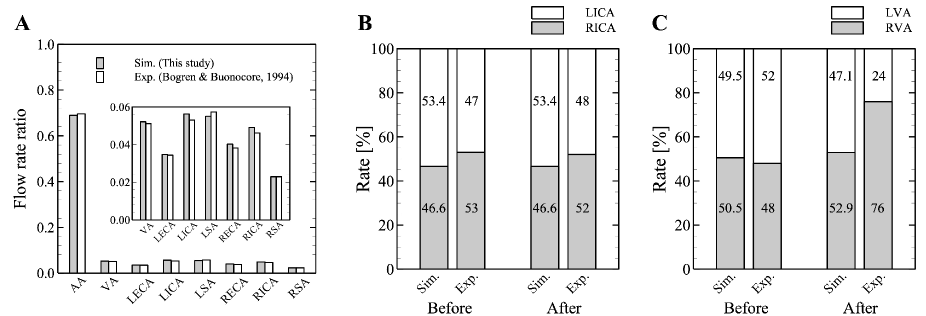
Using a preoperative vascular tree model (Figure 1), the mean flow rates in eight different arteries were investigated, specifically AA, VA ( LVA RVA), L/RICA, and L/RSA. The calculated mean flow rates were normalized by the mean inlet flow rate , and the flow rate ratio in each vessel was compared with data in a previous experimental study by Bogren and Buonocore (1994) (Figure 4A). The outlet diameters were determined so that the errors in the flow rate ratio in each vessel were uniformly less than %, i.e. , where the superscripts “sim” and “exp” denote the simulation and experiment, respectively.
Using the same preoperative vascular tree model, the flow rate ratio between the L/RICA and L/RVA was calculated. The flow rate ratio in patients after dTEVAR was also calculated with the postoperative vascular tree model (Figure 1B). The diameters of the end terminals were the same as those in the preoperative vascular tree model. The calculated flow rate ratio in each artery was compared with previous experimental measurements by Goto et al. (2019) (Figures 4B and 4C). In the experiments, although there were no large differences before and after surgery in the flow rate ratio in the L/RICA or the LVA, the flow rate ratio in the RVA increased after surgery. The numerical results qualitatively agree with these experimental measurements.
3.3 D model analysis of the flow rate in the ICA in pre-and postoperative patients
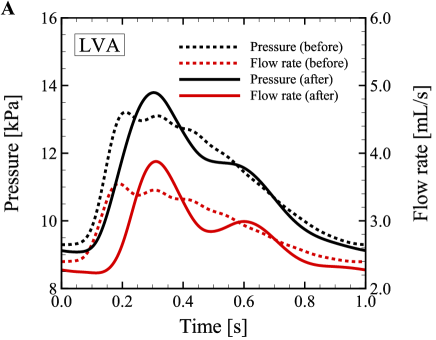
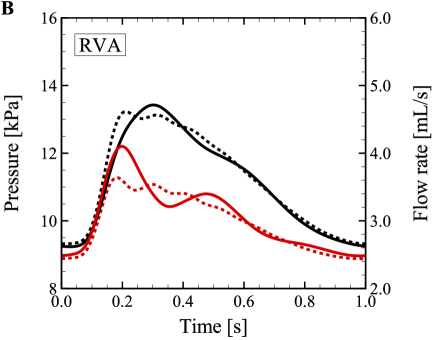
To gain insight into the mechanism of the phase difference in the LVA and the lack of such a difference in the RVA (Figure 3), D numerical simulations were performed using arterial vascular tree models before and after surgery (Figure 1). Model verifications are shown in the Appendix (see Figures A2). The time history of the pressure and flow rates in the L/RVA during a cardiac cycle are shown in Figure 5(A) and 5(B), respectively, where the results before and after surgery are superposed. Data are shown after the pressure and flow rates have reached the stable periodic phase ( s). As described regarding the experimental measurements of flow rates (Figure 3(A)), the numerical results of the flow rate waveform in the LVA were delayed, by % of a single period, which is similar to the experimental measurements (Figure 5(A)). As in experimental measurements, the phase difference was also quantified by the time point observed at the maximum flow rate. On the other hand, the numerical results of the flow rate waveform in the RVA were only slightly delayed, by % of a single period (Figure 5(B)). We concluded that our numerical results of the phase difference in the L/RVA are consistent with the experimental measurements (Figure 3(B)).
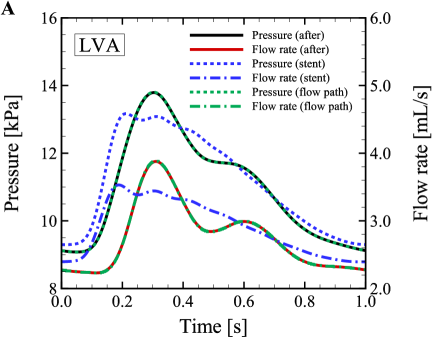
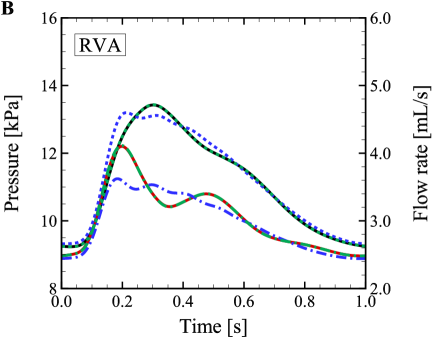
3.4 Effects of local vessel stiffness and flow path
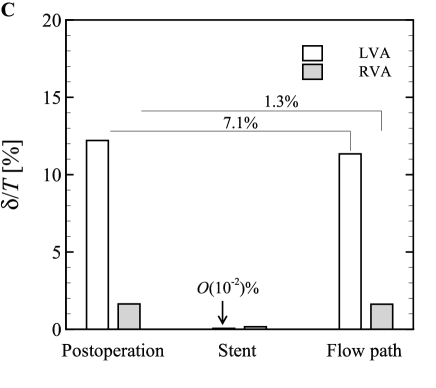
To clarify whether the flow rate waveforms in the LVA (Figure 5(A)) can be caused by the local vessel stiffness, flow path changes, or both, the effect of both of these factors on the flow rate in the L/RVA was investigated with two different additional vascular tree models. The Young’s modulus in the stent-grafted region was increased by times postoperatively compared to the preoperative state without the bypass or embolization, the so-called “stent model", while the flow path change was the same as that in the postoperative vascular tree model (i.e., new bypass and embolization) and the Young’s modulus was the same as that in the preoperative model, the so-called “flow path model". The flow rate and pressure waveforms during a cardiac cycle are shown in Figure 6(A) and 6(B). The flow rate waveforms obtained with the stent model were different from those in the postoperative vascular tree model in both the L/RVA. On the other hand, the flow rate waveforms obtained with the flow path model collapsed with those obtained with the preoperative vascular tree model. These agreements or disagreements were also commonly observed in the pressure waveforms. The phase difference of the maximum flow rate in both the L/RVA between the preoperative vascular tree model and the three aforementioned models (stent, flow path, and postoperative) are summarized in Figure 6(C), where the results were normalized by . Changing the flow path, as in the flow path model, decreased the ratio of the phase difference of the flow rate by only % in the LVA and % in the RVA relative to the ratios obtained in the postoperative model. On the other hand, changing the local Young’s modulus, as in the stent model, caused quite small phase differences, i.e., .
3.5 Effects of stent grafting and bypass angle
The effects of the local vessel stiffness (Young’s modulus) and stent-grafted length on the phase difference in the L/RVA were further investigated using the postoperative vascular tree model. Simulations were performed for different Young’s modulus valuses () in the stent-grafted artery with standard length mm, where ( MPa) was the original Young’s modulus in the stent-grafted region. The ratio of the phase difference remained almost the same (less than %) in both the L/RVA. Even when the length of the stent-grafted region increased to , the results of remained the same (less than %; data not shown), where ( mm) was the original length of the stent-grafted region.
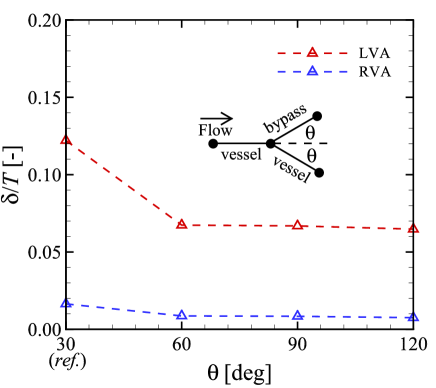
The phase delay in the LVA was also insensitive to the bypass angle , defined at the branch point between the vessel and bypass, especially for deg as shown in Figure 7. Note that the relative difference of the mean flow rate in the RVA obtained with the reference angle ( deg) and that obtained with deg at the branch angle of the bypass was smaller than 1% (data not shown). The results were obtained with the postoperative vascular tree model with a standard stent length of mm and a Young’s modulus of MPa. These results, including those shown in Figure 6(C), suggest that the phase delay of the flow rate in the VA between before and after surgery (Figure 3) arises mostly from the alteration of the flow path, i.e., by the new bypass and embolization rather than by local vessel stiffness due to stent grafting.
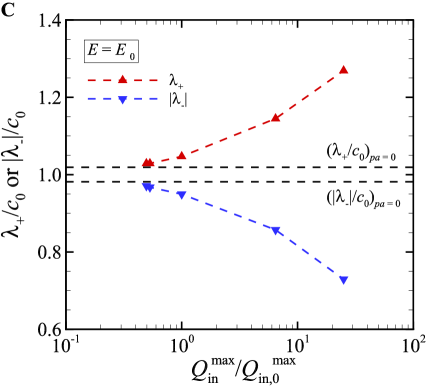
Note that the effect of the stiffness (or Young’s modulus ) of the straight tube on the fluid velocity is described in the Appendix, and the results showed that the pulse-wave speed increased with with the ratio of velocity (Figure A2D).
4 Discussion
A previous clinical study by Goto et al. (2019) showed hemodynamic changes in blood flow through the L/RVA after dTEVAR, while postoperative total intracranial blood flow was almost the same as that measured preoperatively. This might be due to systemic hemodynamic compensation causing cerebral blood flow to be strictly maintained through cerebral autoregulation (Seifert and Secher, 2011). Despite the maintained flow mass in patients after dTEVAR, experimental measurements demonstrated phase differences of the flow rate in the LVA but not in the RVA between pre- and postoperative patients undergoing dTEVAR (Figure 3). It is expected that the aforementioned hemodynamic compensation and the phase differences in the VA in postoperative patients might be due to two mechanical factors: structural alterations in flow paths due to the new bypass and embolization, and an increase of local vessel stiffness due to stent grafting. However, much is still unknown about this matter, in particular about the relative contribution of these two factors to the phase of the flow rate in the VA between pre- and postoperative patients undergoing dTEVAR. To explore this issue, A D model was used to numerically investigate flow rates in the VA, both before and after dTEVAR. Using a postoperative arterial tree model (Figure 1(B)), The numerical results demonstrated a phase delay in the LVA compared to preoperative models, as shown in Figure 5(A). Stent grafting, which is characterized by a locally increasing Young’s modulus, contributed negligibly to the phase delay in the LVA (see §3.4). Thus, the experimentally observed phase delay (Figure 3(A)) was mainly caused by alteration of the flow path, i.e., by the new bypass and embolization, rather by local vessel stiffness due to stent grafting (Figure 6).
In this simulation, branch angles were uniformly set to deg for simplicity. A previous experimental study showed that the energy loss at bifurcations was very small as reported in (Matthys et al., 2007). This is because the branch angle only affects the total pressure continuity (equations 18(b, c) and 20(b, c), see the Appendix), and the order of magnitude of the static pressure term is much greater than those of the other terms. Indeed, the relative difference of the mean flow rate in the RVA obtained with the reference angle ( deg) and that obtained with deg at the branch angle of the bypass is smaller than 1% (data not shown). Thus, at least in this model, the phase delay in the LVA was insensitive to the bypass angle . We did not consider postoperative shape deformation and diameter changes due to device placement. In the future we will perform systematic analyses of the effect of postoperative vascular configurations on the phase change.
In this study, the Young’s modulus in model vasculatures was also approximated using equation (4). Referring to previous numerical assessments of the mechanical behavior of ePTEF, we set the same order of magnitude of the Young’s modulus for the stent-grafted area (i.e., MPa), which was approximately 100 times larger than that of vessels with similar diameter. Considering different Young’s moduli of PET stent from MPa (Kan et al., 2021; Kleinstreuer et al., 2008; Ramella et al., 2022) to MPa (Ma et al., 2018; Ramella et al., 2022) in previous numerical studies, the simulations were performed for different orders of magnitude of Young’s modulus in an ePTFE-stent-grafted area (). However, the ratio of the phase difference remained almost the same (less than 0.2%) in both the L/RVA. Since model parameters in the bifurcation model ( and in equations 18(b, c) and 20(b, c), see the Appendix) and in Young’s modulus (, and in equation (4)) were fixed in this study, further precise analysis of the effects of bifurcation angles and Young’s modulus of the stent should be performed experimentally to confirm whether those mechanical factors have less impact on the phase differences.
The velocity profile was implicitly expressed as flat, derived from Newtonian and laminar fluid flow. However, it is expected that the blood flow profile, especially in a real artery, is much more complex, and therefore it is usually modeled as plug flow due to its turbulent nature and cellular dynamics. Since the Reynolds number in the aorta, estimated based on the mean flux between systolic and diastolic phases, is over 4 103, the flow should be turbulent. Furthermore, the blood velocity profile is also affected by frequency-dependent inertia. The ratio between the transient inertia force and the viscous force can be estimated by the Womersley number , where ( mm) is the radius of the artery (see Table 1), () is the angular frequency, () is the cardiac frequency that is roughly estimated as Hz, and ( m2/s) the kinematic viscosity of the blood. Thus, it is expected that a more rigorous velocity flow profile can reproduce unsteady hemodynamics in patients before and after dTEVAR. In this study, however, we focused on explaining the experimentally observed phase delay of the mean volumetric flow rate in the LVA seen in postoperative dTEVAR patients relative to that before surgery, and thus, the flow profile predominantly affecting the unit mean volumetric flow rate should not change the calculated phase delay.
In this simulation, we simply modeled arterial trees from the heart (or LV) to eight end terminals, whose diameters and lengths were determined so that the time average flow rate became similar to that obtained in experimental measurements by Bogren and Buonocore (1994) or Goto et al. (2019) (Figure 4). Even with the simplest boundary condition at the end terminals (no-reflection condition, i.e., ), our numerical model reproduced the phase delay of the flow rate in the LVA without the phase difference in the RVA in postoperative patients, and also clarified that the phase delay arose mostly from alteration of the flow path (Figure 6). Further precise boundary conditions for both the inlet (heart) and outlets will leads to patient-specific analyses preoperatively and to the evaluation of hemodynamics postoperatively, topics that we will address in the future.
Depending on the areas of TAA, different numbers of bypasses (1d, 2d, and 3d) can be selected. If phase delays of flow rate are present in the LVA of postoperative patients who have undergone different surgical operations, it is expected that the phase differences between before and after surgery are caused by the new bypasses. Quantitative analyses of hemodynamic changes caused by these surgeries should be performed in future studies. Modification of the aforementioned model factors, e.g., boundary conditions, will potentially reproduce hemodynamics in patients who undergo these various surgeries. The numerical results based on pulse-wave dynamics provide fundamental knowledge regarding hemodynamic changes between pre- and postoperative patients undergoing dTEVAR, and will be helpful not only in surgical decision-making for optimal clinical outcomes but also in evaluating hemodynamics after surgery.
5 Conclusion
A 1D model was used to numerically investigate blood flow rates, with the goal of explaining experimental evidence on the phase delay of the flow rate in the LVA but not in the RVA after dTEVAR relative to before. The numerical model can reproduce the flow distribution in the major arteries from the heart, and can capture the flow rate ratio in the L/RVA in both pre- and postoperative patients. The numerical results showed that the phase delay was mainly caused by the bypass, i.e., by alteration of the flow path, rather than by stent grafting, i.e., the change of local vessel stiffness. Bypass angles and the effects of the length and Young’s modulus of the stent were also investigated, but all were insensitive to the phase delay. We hope that our numerical results will provide fundamental knowledge about therapeutic decisions for dTEVAR.
Ethical Approval
Not required.
Declaration of Competing Interest
The authors declare that they have no known competing financial interests or personal relationships that could have appeared to influence the work reported in this paper.
Acknowledgements
The presented study was partially funded by Daicel Corporation. Last but not least, N.T. and N.Y. thank Mr. Tatsuki Shimada for his assistance in the preparation of this work.
Appendix
A1. Methodology
The variables of the th-vessel segment at specific time ( and ) in equation (5) are described as:
| (9) |
The discretized form of equation (5) is obtained with the Lax-Wendroff method:
| (10) | ||||
| (11) |
where , and is the segment length of the vessel.
The boundary values of and are determined by the Riemann invariants ( and ), which represent a forward- and backward-traveling wave at speeds and as eigen values of the Jacobian . Riemann invariants are the characteristic variables of the following hyperbolic system transformed from equation (5):
| (12) |
where , and . By choosing the reference conditions (, ), we obtain the solutions to system (12):
| (13) | ||||
| (14) | ||||
| (15) |
where is the wave speed, and is the wave speed at .
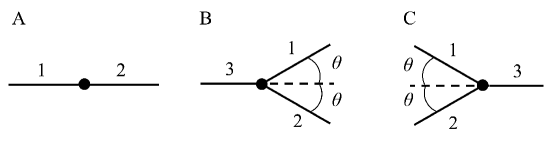
Flow conditions along the lines () (see Figure A1(A)) are described by mass conservation and total pressure continuity (Formaggia et al., 2003):
| (16a) | |||
| (16b) | |||
and and are derived from values at the previous time step at the distal end (denoted by ) and proximal end (denoted by 0) of an artery by extrapolating the outgoing Riemann invariants along the characteristic lines (Formaggia et al., 2003):
| (17a) | |||
| (17b) | |||
Flow conditions at the bifurcations () (Figure A1(B)) are described as (Formaggia et al., 2003):
| (18a) | |||
| (18b) | |||
| (18c) | |||
| (18d) | |||
| (18e) | |||
| (18f) | |||
where
| (19a) | |||
| (19b) | |||
In this study, we set , , and . At the confluences () (Figure A1(C)), we have:
| (20a) | |||
| (20b) | |||
| (20c) | |||
| (20d) | |||
| (20e) | |||
| (20f) | |||
A2. Weakly non-linear form
To verify the calculated solutions, the numerical results are compared with those obtained with a weak non-linear equation instead of the theoretical formula. When and , Equation (13) can be written as:
| (21) | ||||
| (22) |
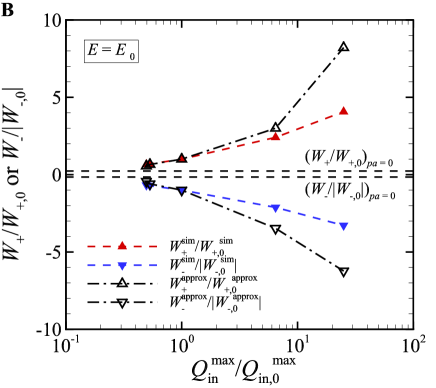
When , we finally have a weak non-linear form of the Riemann invariants (13)
| (23) |
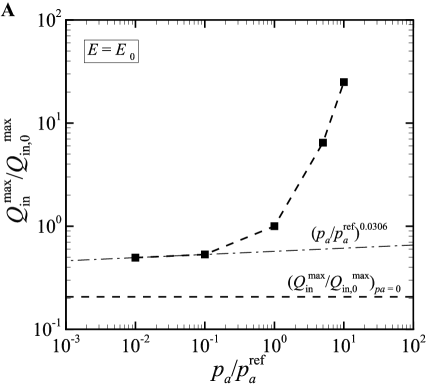
Equation (23) predicts that wave propagations, including reflective wave , are negligible for the small flow rate and small vessel contraction . Indeed, the maximum values of in the middle point of the straight tube almost collapse on those obtained with when the maximum inlet flow rate decreases (Figure A2(B)), where the tube length and reference radius are set to m and m, respectively, and the Young’s modulus is MPa, referring to the value of aortic elasticity in conscious dogs (Armentano et al., 1991). The inlet pressure wave form (7) and no-reflection condition for the outlet are also considered. The small maximum inlet inflow rate is controlled by the inlet pressure amplitude (see Figure A2(A)).
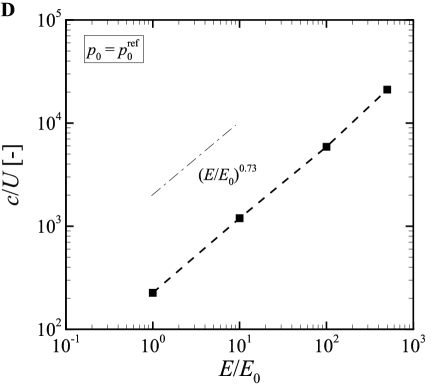
Furthermore, the aforementioned weakly non-linear formalization simultaneously leads equation (15) to be approximated as , and the results are shown in Figure A2(C). We also confirmed that the average fluid velocity increased with tube stiffness, as shown in Figure A2(D).
References
- Alastruey et al. (2007) Alastruey, J., Parker, K. H. Peiró, J., Byrd, S.M., Sherwina, S.J., 2007. Modelling the circle of willis to assess the effects of anatomical variations and occlusions on cerebral flows. J. Biomech. 40, 1794–1805. doi:10.1161/CIR.0b013e31828124ad.
- Alastruey et al. (2008) Alastruey, J., Parker, K.H., Peiró, J., Sherwin, S.J., 2008. Lumped parameter outflow models for 1-D blood flow simulations: effect on pulse waves and parameter estimation. Commun. Comput. Phys. 4, 317–336.
- Alastruey et al. (2011) Alastruey, J., W., K.A., Matthys, K.S., Segers, P., Sherwin, S.J., Verdonck, P.R., Parker, K.H., Peiro, J., 2011. Pulse wave propagation in a model human arterial network: Assessment of 1-d visco-elastic simulations against in vitro measurements. J. Biomech. 44, 2250–2258. doi:10.1016/j.jbiomech.2011.05.041.
- Armentano et al. (1991) Armentano, R.L., Levenson, J., Barra, J.G., Fischer, E.I., Breitbart, G.J., Pichel, R.H., Simon, A., 1991. Assessment of elastin and collagen contribution to aortic elasticity in conscious dogs. Am. J. Physiol. Heart Circ. Physiol.. 260, H1870–H1877. doi:10.1152/ajpheart.1991.260.6.H1870.
- Bogren and Buonocore (1994) Bogren, H.G., Buonocore, M.H., 1994. Blood flow measurements in the aorta and major arteries with MR velocity mapping. J. Magn. Reson. Imaging. 4, 119–130. doi:10.1002/jmri.1880040204.
- Calderon-Arnulphi et al. (2011) Calderon-Arnulphi, M., Amin-Hanjani, S., Alaraj, A., Zhao, M., Du, X., Ruland, S., Zhou, X.J., Thulborn, K.R., Charbel, F.T., 2011. In vivo evaluation of quantitative MR angiography in a canine carotid artery stenosis model. AJNR Am. J. Neuroradiol. 32, 1552–1559. doi:10.3174/ajnr.A2546.
- Cooper et al. (2009) Cooper, D.G., Walsh, S.R., Sadat, U., Noorani, A., Hayes, P.D., Boyle, J.R., 2009. Neurological complications after left subclavian artery coverage during thoracic endovascular aortic repair: a systematic review and meta-analysis. J. Vasc. Surg. 46, 1594–1601. doi:10.1016/j.jbiomech.2011.05.041.
- Duanmu et al. (2019) Duanmu, Z., Chen, W., Gao, H., Yang, X., Luo, X., Hill, N.A., 2019. A one-dimensional hemodynamic model of the coronary arterial tree. Front. Physiol. 10, 853. doi:10.3389/fphys.2019.00853.
- Feezor and Lee (2009) Feezor, R.J., Lee, W.A., 2009. Management of the left subclavian artery during TEVAR. Semin. Vasc. Surg. 22, 159–164. doi:10.3389/fphys.2019.00853.
- Feiger et al. (2020) Feiger, B., Kochar, A., Gounley, J., Bonadonna, D., Daneshmand, M., Randles, A., 2020. Determining the impacts of venoarterial extracorporeal membrane oxygenation on cerebral oxygenation using a one-dimensional blood flow simulator. J. Biomech. 104, 109707. doi:10.1016/j.jbiomech.2020.109707.
- Formaggia et al. (2003) Formaggia, L., Lamponi, D., Quarteroni, A., 2003. One-dimensional models for blood flow in arteries. J. Eng. Math. 47, 251–276. doi:10.1023/B:ENGI.0000007980.01347.29.
- Go et al. (2013) Go, A.S., Mozaffarian, D., Roger, V.L., Benjamin, E.J., Berry, J.D., Borden, W.B., Bravata, D.M., Dai, S., Ford, E.S., Fox, C.S., Franco, S., Fullerton, H.J., Gillespie, C., Hailpern, S.M., Heit, J.A., Howard, V.J., Huffman, M.D., Kissela, B.M., Kittner, S.J., Lackland, D.T., Lichtman, J.H., Lisabeth, L.D., Magid, D., Marcus, G.M., Marelli, A., Matchar, D.B., McGuire, D.K., Mohler, E.R., Moy, C.S., Mussolino, M.E., Nichol, G., Paynter, N.P., Schreiner, P.J., Sorlie, P.D., Stein, J., Turan, T.N., Virani, S.S., Wong, N.D., Woo, D., Turner, M.B., 2013. Heart disease and stroke statistics–2013 update: a report from the American Heart Association. Circulation 127, e6–e245. doi:10.1161/CIR.0b013e31828124ad.
- Goto et al. (2019) Goto, T., Shimamura, K., Kuratani, T., Kin, K., Shijo, T., Kudo, T., Watanabe, Y., Masada, K., Sakaniwa, R., Tanaka, H., Sawa, Y., 2019. Quantitative evaluation of blood flow in each cerebral branch associated with zone 1-2 thoracic endovascular aortic repair. Eur. J. Cardio-Thorac. Surg. 55, 1079–1085. doi:10.1023/B:ENGI.0000007980.01347.29.
- Hajibandeh et al. (2016) Hajibandeh, S., Hajibandeh, S., Antoniou, S.A., Torella, F., Antoniou, G.A., 2016. Meta-analysis of left subclavian artery coverage with and without revascularization in thoracic endovascular aortic repair. J. Endovasc. Ther. 23, 634–641. doi:10.1177/1526602816651417.
- Hametner et al. (2021) Hametner, B., Wassertheurer, S., Mayer, C.C., Danninger, K., Binder, R.K., Weber, T., 2021. Aortic pulse wave velocity predicts cardiovascular events and mortality in patients undergoing coronary angiography: a comparison of invasive measurements and noninvasive estimates. Hypertension 77, 571–581. doi:10.1161/HYPERTENSIONAHA.120.15336.
- Huo and Kassab (2007) Huo, Y., Kassab, G.S., 2007. A hybrid one-dimensional/Womersley model of pulsatile blood flow in the entire coronary arterial tree. Am. J. Physiol. Heart Circ. Physiol. 292, H2623–H2633. doi:10.1177/1526602816651417.
- Ishimaru (2004) Ishimaru, S., 2004. Endografting of the aortic arch. J. Endovasc. Ther. 11, II62–71. doi:10.1177/15266028040110S609.
- Kan et al. (2021) Kan, X., Ma, T., Lin, J., Wang, L., Dong, Z., Xu, X.Y., 2021. Patient-specific simulation of stent-graft deployment in type b aortic dissection: model development and validation. Biomech. Model. Mechanobiol. 20, 2247–2258. doi:10.1007/s10237-021-01504-x.
- Kleinstreuer et al. (2008) Kleinstreuer, C., Li, Z., Basciano, C.A., Seelecke, S., Farber, M.A., 2008. Computational mechanics of nitinol stent grafts. J. Biomech. 41, 2370–2378. doi:10.1016/j.jbiomech.2008.05.032.
- Ku (1997) Ku, D.N., 1997. Blood flow in arteries. Annu. Rev. Fluid Mech. 29, 399–434. doi:10.1146/annurev.fluid.29.1.399.
- Latham et al. (1985) Latham, R.D., Westerhof, N., Sipkema, P., Rubal, B.J., Reuderink, P., Murgo, J.P., 1985. Regional wave travel and reflections along the human aorta: a study with six simultaneous micromanometric pressures. Circulation 72, 1257–1269. doi:10.1146/annurev.fluid.29.1.399.
- Laurent et al. (2006) Laurent, S., Cockcroft, J., Van Bortel, L., Boutouyrie, P., Giannattasio, C., Hayoz, D., Pannier, B., Vlachopoulos, C., Wilkinson, I. Struijker-Boudier, H., European Network for Non-invasive Investigation of Large Arteries, 2006. Expert consensus document on arterial stiffness: methodological issues and clinical applications. Eur. Heart J. 27, 2588–2605. doi:10.1093/eurheartj/ehl254.
- Liang et al. (2009) Liang, F., Takagi, S., Himeno, R., Liu, H., 2009. Multi-scale modeling of the human cardiovascular system with applications to aortic valvular and arterial stenoses. Med. Biol. Eng. Comput. 47, 743–755. doi:10.1007/s11517-009-0449-9.
- Liu and Fung (1989) Liu, S.Q., Fung, Y.C., 1989. Relationship between hypertension, hypertrophy, and opening angle of zero-stress state of arteries following aortic constriction. J. Biomech. Eng. 111, 325–335. doi:10.1093/eurheartj/ehl254.
- Ma et al. (2018) Ma, T., Dong, Z.H., Wang, S., Meng, Z.Y., Chen, Y.Y., Fu, W.G., 2018. Computational investigation of interaction between stent graft and aorta in retrograde type A dissection after thoracic endovascular aortic repair for type B aortic dissection. J. Vasc. Surg. 68, 14S–21S. doi:10.1016/j.jvs.2018.06.008.
- Matthys et al. (2007) Matthys, K.S., Alastruey, J., Peiró, J., Khir, A.W., Segers, P., Verdonck, P.R., Parker, K.H., Sherwin, S.J., 2007. Pulse wave propagation in a model human arterial network: assessment of 1-d numerical simulations against in vitro measurements. J. Biomech. 40, 3476–3486. doi:10.1016/j.jbiomech.2007.05.027.
- Milewicz and Ramirez (2019) Milewicz, D.M., Ramirez, F., 2019. Therapies for thoracic aortic aneurysms and acute aortic dissections. Arterioscler. Thromb. Vasc. Biol. 39, 126–136. doi:10.1161/ATVBAHA.118.310956.
- Morishita et al. (2021) Morishita, T., Takeishi, N., Ii, S., Wada, S., 2021. Effects of left ventricular hypertrophy and myocardial stiffness on myocardial strain under preserved ejection fraction. Ann. Biomed. Eng. 49, 1670–1687. doi:10.1007/s10439-020-02706-7.
- Mynard et al. (2012) Mynard, J.P., Davidson, M.R., Penny, D.J., Smolich, J.J., 2012. A simple, versatile valve model for use in lumped parameter and one-dimensional cardiovascular models. Int. J. Numer. Meth. Biomed. Engng. 28, 626–641. doi:10.1002/cnm.1466.
- Mynard et al. (2014) Mynard, J.P., Penny, D.J., Smolich, J.J., 2014. Scalability and in vivo validation of a multiscale numerical model of the left coronary circulation. Am. J. Physiol. Heart Circ. Physiol. 306, H517–H528. doi:10.1152/ajpheart.00603.2013.
- Narita et al. (2016) Narita, H., Komori, K., Usui, A., Yamamoto, K., Banno, H., Kodama, A., Sugimoto, M., 2016. Postoperative outcomes of hybrid repair in the treatment of aortic arch aneurysms. Ann. Vasc. Surg. 34, 55–61. doi:10.1016/j.avsg.2015.11.041.
- Olufsen (1999) Olufsen, M.S., 1999. Structured tree outflow condition for blood flow in larger systemic arteries. Am. J. Physiol. Heart. Circ. Physiol 276, H257–H268. doi:10.1152/ajpheart.1999.276.1.H257.
- Padmos et al. (2020) Padmos, R.M., Józsa, T.I., El-Bouri, W.K., Konduri, P.R., Payne, S.J., Hoekstra, A.G., 2020. Coupling one-dimensional arterial blood flow to three-dimensional tissue perfusion models for in silico trials of acute ischaemic stroke. Interface Focus 11, 20190125. doi:10.1098/rsfs.2019.0125.
- Patterson et al. (2014) Patterson, B.O., Holt, P.J., Nienaber, C., Fairman, R.M., Heijmen, R.H., Thompson, M.M., 2014. Management of the left subclavian artery and neurologic complications after thoracic endovascular aortic repair. J. Vasc. Surg. 60, 1491–1497. doi:10.1016/j.jvs.2014.08.114.
- Ramella et al. (2022) Ramella, A., Migliavacca, F., Matas, J.F.R., Heim, F., Dedola, F., Marconi, S., Conti, M., Allievi, S., Mandigers, T.J., Bissacco, D., Domanin, M., Trimarchi, S., Luraghi, G., 2022. Validation and verification of high-fidelity simulations of thoracic stent-graft implantation. Ann. Biomed. Eng. 50, 1941–1953. doi:10.1007/s10439-022-03014-y.
- Seifert and Secher (2011) Seifert, T., Secher, N.H., 2011. Sympathetic influence on cerebral blood flow and metabolism during exercise in humans. Prog. Neurobiol. 95, 406–426. doi:10.1016/j.pneurobio.2011.09.008.
- Sherwin et al. (2003) Sherwin, S.J., Formaggia, L., Peiro, J., Franke, V., 2003. Computational modelling of 1D blood fow with variable mechanical properties and its application to the simulation of wave propagation in the human arterial system. Int. J. Numer. Meth. Fluids 43, 673–700. doi:10.1002/fld.543.
- Shigemura et al. (2000) Shigemura, N., Kato, M., Kuratani, T., Funakoshi, Y., Kaneko, M., 2000. New operative method for acute type B dissection: left carotid artery-left subclavian artery bypass combined with endovascular stent-graft implantation. J. Thorac. Cardiovasc. Surg. 120, 406–408. doi:10.1067/mtc.2000.107279.
- Shijo et al. (2016) Shijo, T., Kuratani, T., Torikai, K., Shimamura, K., Sakamoto, T., Kudo, T., Masada, K., Takahara, M., Sawa, Y., 2016. Thoracic endovascular aortic repair for degenerative distal arch aneurysm can be used as a standard procedure in high-risk patients. Eur. J. Cardiothorac. Surg. 50, 257–263. doi:10.1093/ejcts/ezw020.
- Shimamura et al. (2008) Shimamura, K., Kuratani, T., Matsumiya, G., Kato, M., Shirakawa, Y., Takano, H., Ohta, N., Sawa, Y., 2008. Long-term results of the open stent-grafting technique for extended aortic arch disease. J. Thorac. Cardiovasc. Surg. 135, 1261–1269. doi:10.1016/j.jtcvs.2007.10.056.
- Smith et al. (2002) Smith, N.P., Pullan, A.J., Hunter, P.J., 2002. An anatomically based model of transient coronary blood flow in the heart. SIAM J. Appl. Math. 62, 990–1018. doi:10.1137/S0036139999355199.
- Taylor and Draney (2004) Taylor, C.A., Draney, M.T., 2004. Experimental and computational methods in cardiovascular fluid mechanics. Annu. Rev. Fluid Mech. 36, 197–231. doi:10.1146/annurev.fluid.36.050802.121944.
- Townsend et al. (2015) Townsend, R.R., Wilkinson, I.B., Schiffrin, E.L., Avolio, A.P., Chirinos, J.A., Cockcroft, J.R., Heffernan, K.S., Lakatta, E.G., McEniery, C.M., Mitchell, G.F., Najjar, S.S., Nichols, W.W., Urbina, E.M., Weber, T., on behalf of the American Heart Association Council on Hypertension, 2015. Recommendations for improving and standardizing vascular research on arterial stiffness: a scientific statement from the American Heart Association. Hypertension 66, 698–722. doi:10.1161/HYP.0000000000000033.
- Ullery et al. (2012) Ullery, B.W., McGarvey, M., Cheung, A.T., Fairman, R.M., Jackson, B.M., Woo, E.Y., Desai, N.D., Wang, G.J., 2012. Vascular distribution of stroke and its relationship to perioperative mortality and neurologic outcome after thoracic endovascular aortic repair. J. Vasc. Surg. 56, 1510–1517. doi:10.1016/j.jvs.2012.05.086.
- van de Vosse and Stergiopulos (2011) van de Vosse, F.N., Stergiopulos, N., 2011. Pulse wave propagation in the arterial tree. Annu. Rev. Fluid Mech. 43, 467–499. doi:10.1146/annurev-fluid-122109-160730.
- Yokoyama et al. (2021) Yokoyama, N., Takeishi, N., Wada, S., 2021. Cerebrospinal fluid flow driven by arterial pulsations in axisymmetric perivascular spaces: Analogy with Taylor’s swimming sheet. J. Theor. Biol. 523, 110709. doi:10.1016/j.jtbi.2021.110709.
- Yoshitake et al. (2016) Yoshitake, A., Hachiya, T., Okamoto, K., Kitahara, H., Kawaguchi, S., Nakatsuka, S., Inoue, M., Jinzaki, M., Shimizu, H., 2016. Postoperative stroke after debranching with thoracic endovascular aortic repair. Ann. Vasc. Surg. 36, 132–138. doi:10.1016/j.avsg.2016.02.039.
- Zhao et al. (2007) Zhao, M., Amin-Hanjani, S., Ruland, S., Curcio, A.P., Ostergren, L., Charbel, F.T., 2007. Regional cerebral blood flow using quantitative MR angiography. AJNR Am. J. Neuroradiol. 28, 1470–1473. doi:10.3174/ajnr.A0582.