Snapshot: Towards Application-centered Models for Pedestrian Trajectory Prediction in Urban Traffic Environments
Abstract
This paper explores pedestrian trajectory prediction in urban traffic while focusing on both model accuracy and real-world applicability. While promising approaches exist, they are often not publicly available, revolve around pedestrian datasets excluding traffic-related information, or resemble architectures that are either not real-time capable or robust. To address these limitations, we first introduce a dedicated benchmark based on Argoverse 2, specifically targeting pedestrians in urban settings. Following this, we present Snapshot, a modular, feed-forward neural network that outperforms the current state of the art while utilizing significantly less information. Despite its agent-centric encoding scheme, Snapshot demonstrates scalability, real-time performance, and robustness to varying motion histories. Moreover, by integrating Snapshot into a modular autonomous driving software stack, we showcase its real-world applicability.
1 Introduction
The reliable prediction of pedestrian behavior is the most important aspect across various disciplines. Most prominently, it has been extensively studied to understand crowd behavior [19, 8, 29, 41, 40, 22], to replicate realistic trajectories [14, 46, 3, 37], and to enable autonomous systems to consider human motion [36, 31, 1, 5, 10]. Autonomous driving combines all of these research efforts with the goal of enhancing the safety of the vulnerable road users (VRUs) involved. As this technology integrates more and more into the intricate urban landscape where humans and vehicles closely coexist, reliably predicting pedestrian behavior has proven to be a significant challenge. Despite considerable advancements in recent years, many methods still revolve around well-established trajectory prediction benchmarks such as ETH/UCY [24, 30] and SDD [32], which primarily contain pedestrians in non-traffic settings. Although specialized datasets such as Argoverse 2 [44] or nuScenes [6] address this shortcoming, they are rarely utilized in pedestrian research due to their primary focus on vehicles or all road users combined. In addition, the developed algorithms often prioritize benchmark performance rather than reducing runtime or improving model robustness. Due to these two limitations, prediction methods can often not be integrated into real-world applications. To this end, the insights from pedestrian-centered research, such as the importance of certain features [8, 39] or approaches themselves [47, 50, 25], remain unused.
To address these shortcomings, the presented work investigates pedestrian prediction in urban traffic scenarios while combining the knowledge collected from different disciplines. We identified the most crucial features that influence prediction performance and show that both applicability and state-of-the-art prediction accuracy can be achieved with a single model. The contributions of this work can be summarized as follows:
- •
-
•
Feature Analysis: Based on our model, we evaluate different modifications alongside an ablation study to show the effectiveness of our architecture and determine the significance of individual inputs.
-
•
Benchmark: To support future research in the field, we provide a dedicated pedestrian-focused benchmark derived from Argoverse 2 [44]. It offers a specialized development platform with more than one million training, validation, and test samples.
-
•
Applicability: Lastly, we verify Snapshot’s applicability by integrating it into an autonomous driving software stack to gather insights into its real-world performance.
2 Related Work
2.1 Pedestrian Datasets
Comprehensive datasets are the foundation for every learning-based approach. Within the field of pedestrian trajectory prediction, these can be divided into two categories depicted in Fig. 1: Pedestrian-only and urban traffic environments. The first one comprises outdoor as well as indoor settings, with the ETH/UCY [24, 30] and SDD [32] dataset recorded in urban environments, whereas others like ATC [4] and Thör [33] were captured within buildings. While this category focuses on establishing a better understanding of how pedestrians move and interact with one another and their environment, the second one contains vehicles alongside pedestrians and is therefore better suited to explore the overall dynamics concerning autonomous systems. To date, the most popular datasets in this category are comprised of nuScenes [6], Argoverse 2 [44] and the Waymo Open Motion dataset [9]. All of these have in common that the prediction task is conducted based on a birds-eye view (BEV) of the scene, where the recorded tracks, as well as semantic information, are provided in a 2D plane. Since these datasets are based on real-world recordings from a vehicle perspective, common phenomena such as occlusions, tracking losses, and detection inaccuracies are contained within the data. Therefore, they provide an advantage when training networks for real-world applications [38, 15].
2.2 Prediction Approaches
Historically, pedestrian behavior has been imitated through knowledge-based methods like the Social Force Model [16] or velocity-based approaches [18]. Since then, research has shifted to data-driven models where behavior is learned based on prerecorded data [20]. While recurrent neural networks (RNNs) have initially been adopted to capture the interactions unfolding over the observed motion history of each agent [2, 14, 34, 21, 36], competitive performance has been achieved in recent years by feed-forward architectures [25, 27, 48]. Most recently, with the success in natural language processing [42] as well as computer vision [7], transformer models also have been applied to the field of pedestrian trajectory prediction with great success [46, 50, 35]. Similarly, when predicting other road users besides pedestrians, transformer architectures have since been established as state-of-the-art models which underlines their capability to effectively process heterogeneous inputs [52, 28, 49]. Despite the introduction of various methods to either improve model performance or effectiveness, such as specialized attention mechanisms [46, 51], efficient input representations [23, 43], parallel predictions [53, 27], or hybrid approaches [50, 47], no model exists that can be easily deployed to an autonomous system. As mentioned previously, reasons for that can be found in extensive preprocessing efforts, high inference times, or open-source availability. Moreover, it is often unknown how well these models can anticipate pedestrian motion. Therefore, to explore this aspect, we will evaluate our proposed method alongside the current state of the art.
2.3 Incorporated features
| Dataset | in s | in s | in Hz |
|---|---|---|---|
| ETH/UCY [24, 30] | 3.2 | 4.8 | 2.5 |
| SDD [32] | 3.2 | 4.8 | 2.5 |
| nuScenes [6] | 2 | 6 | 2 |
| Argoverse 2 [44] | 5 | 6 | 10 |
| Waymo Open Motion [9] | 1 | 8 | 10 |
Most methods consider three major aspects to accurately predict pedestrian trajectories: motion history, semantic information, and interactions [34, 36]. The motion history usually consists of the observed positional values for each agent that are used to determine an individual’s behavior. While this information is generally considered valuable, different opinions exist on how much information is necessary. This aspect is highlighted in Tab. 1, listing the observation as well as the prediction horizons for the different datasets introduced in Sec. 2.1. Within the table, it can be noted that apart from the observation length , the considered relevant prediction horizon varies between to , as does the sampling rate with values between to . Recent work suggests that at least for pedestrians, an observation sequence exceeding might not be as relevant [39], aligning with the challenge provided by the Waymo Open Motion dataset [9].
The second feature influencing the prediction accuracy is semantic or map information, where rasterized representations have been widely used in the past [25, 36, 34, 12]. This changed with the introduction of VectorNet [11], where polylines are directly encoded as vectors instead of discretizing the BEV scene through a grid. Since then, vector representations have gained increasing interest due to their efficient encoding of the environment, especially in combination with graph neural networks and transformer architectures [28, 53, 23]. Both representations initially adopted an agent-centric encoding scheme, leading to good results due to rotational and translational invariance. Regardless, this scheme usually suffers from poor scalability with an increasing number of agents to be predicted. For this reason, scene-centric approaches are being developed, allowing for improved scalability and decreased hardware utilization [52]. Recently, a third representation was introduced by the pairwise-relative encoding scheme, where a polyline is represented by one global coordinate along with local attributes describing its shape [51]. This way, only one coordinate per polyline is transformed to an agent-centric frame, making the reuse of these encodings possible.
Last but not least, interactions among road users play a crucial role in predicting one’s action [13]. Different mechanisms to consider these have been tested in the past, with pooling mechanisms [14], graph representations [36, 27] and attention mechanisms [46, 34] being the most prominent ones. Drawing inspiration from the field of interactive crowd simulation, other features exist that are believed to more closely match human interaction in the real world [29, 8]. Here, the time-to-closest-approach (ttca) and distance-to-closest-approach (dca), as well as the bearing angle are considered to avoid collisions. These approaches work seemingly well in a simulation environment but haven’t been employed in the pedestrian prediction literature to the best of our knowledge. Although trivial distance-based interaction schemes still seem to be among the most effective [51], this study will compare their influence.
3 Methodology
In this section, we formulate the problem statement and design constraints influencing the overall setup of our approach. Afterwards, details about the preprocessing are provided and the architecture of Snapshot is introduced. To its end, we define the metrics used to quantify the accuracy of the models in Sec. 4.
3.1 Problem formulation and design constraints
The problem of predicting pedestrian trajectories is framed as follows: Given a 2D map of the surrounding scene and a sequence of observed positions for agents, predict the most likely trajectory of the focal agent. Both sequences are represented by Cartesian coordinates , indicating an agent’s location within the scene at timestep . For the focal agent, a maximum of timesteps or is considered, while the observations for other agents might only be partially present. In accordance with the Argoverse 2 motion forecasting challenge, the prediction horizon is set to timesteps or .
Although pedestrian behavior is considered multimodal, we argue that for a practical application only the most likely trajectory is important in the short term, resembling whether a person is crossing in front of the ego vehicle or not. Considering the hardware constraints in automotive applications, the method should be further able to run on a single, consumer-grade GPU and predict up to 100 agents in as little as to ensure real-time operation. Lastly, to guarantee safety for the pedestrians involved, it needs to generate accurate predictions for a variable number of observed timesteps as observations are often limited in real-world applications.
3.2 Dataset and benchmark
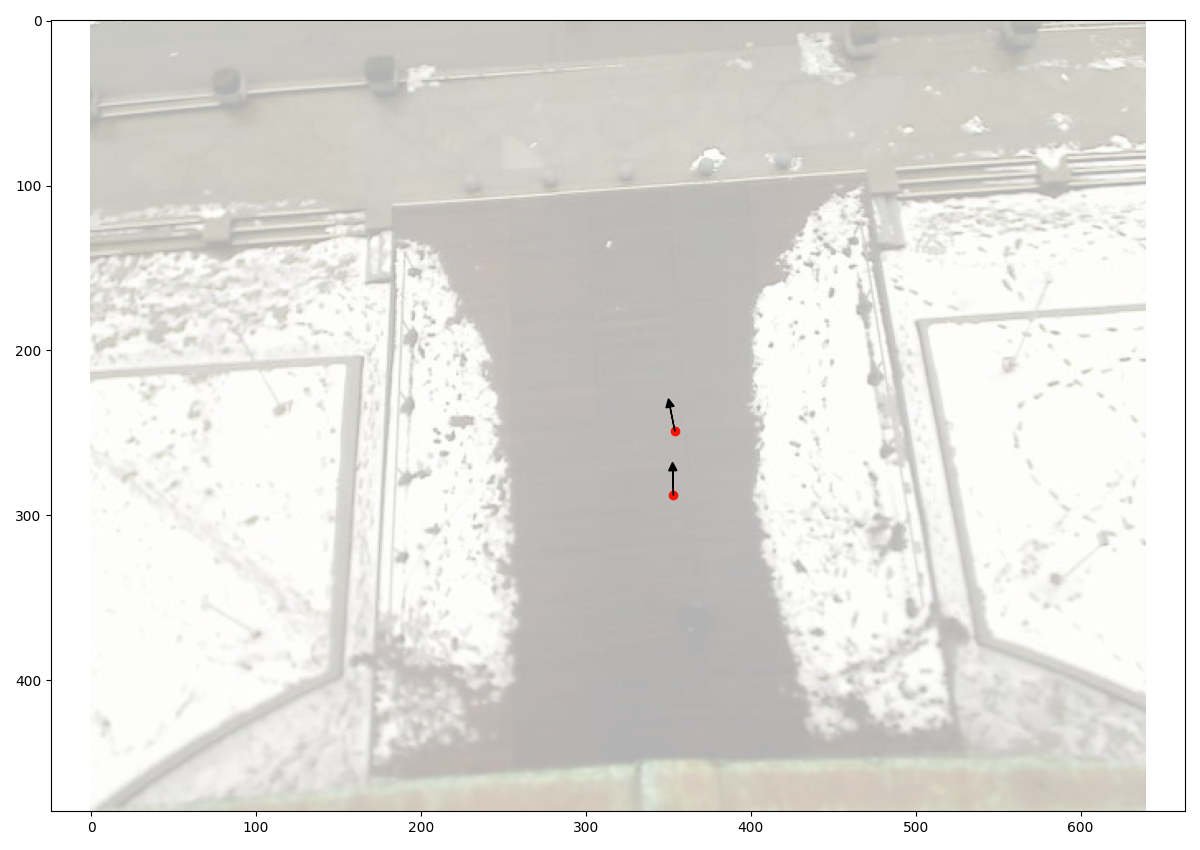
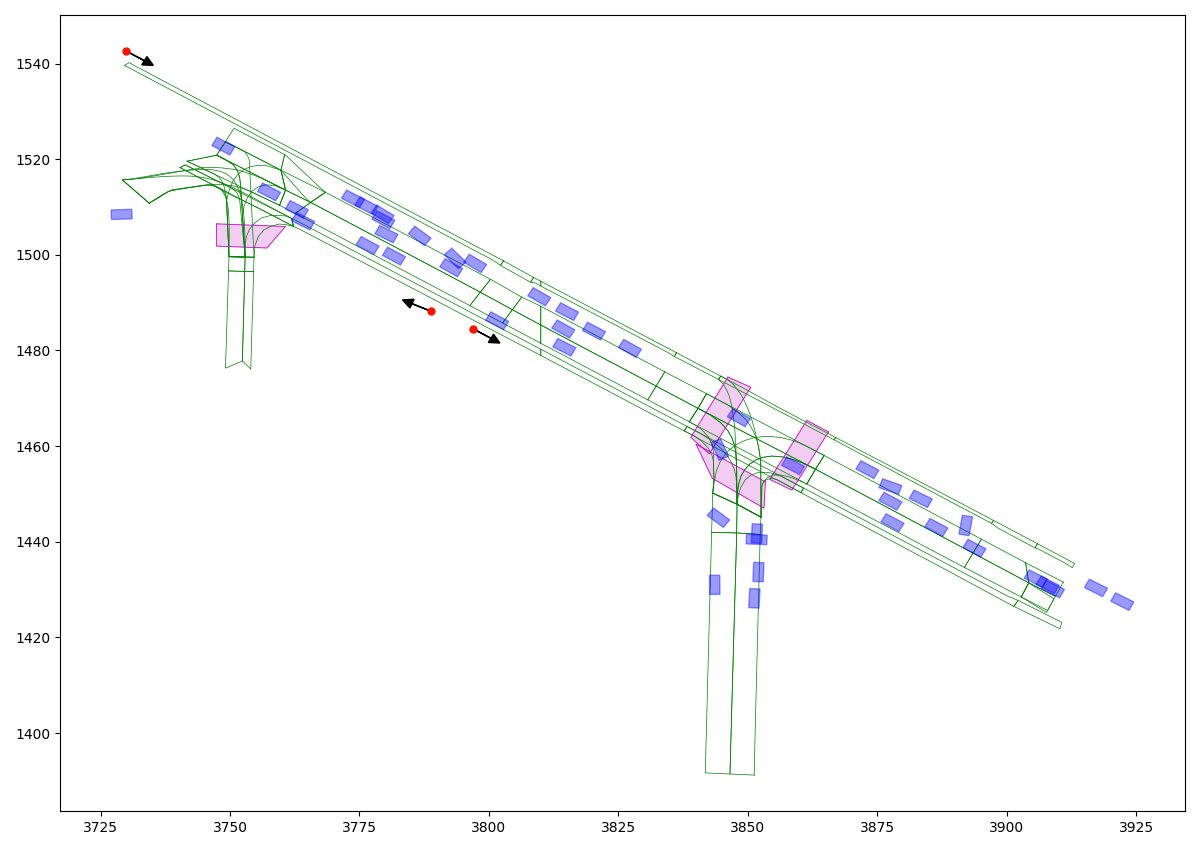
For this study, the Argoverse 2 dataset is selected as it aligns best with our requirements outlined in Sec. 2.1. Comprising over 250.000 scenes, each lasting , the dataset encompasses diverse situations and agent types, including vehicles, pedestrians, and cyclists. However, the use of the provided focal tracks for training and evaluation in the single-agent case reveals limitations. Due to the restriction to a observation length, numerous tracks are excluded from both training and validation. Therefore, only 1572 pedestrian tracks are available in the validation set. Since prior studies as well as other benchmarks indicate that observations exceeding might not be relevant for the prediction task [9, 39], was limited to that interval. This allows to utilize the provided data more effectively as a sliding window approach can be applied to generate additional samples. This is illustrated in Fig. 2 with the two displayed pedestrian tracks, which are now processed but would previously been excluded. The sampling process is visualized with the red sliding window, encompassing both observation and ground truth separated by a red, dashed line.
For our approach, pedestrian 1 is marked as predictable, while pedestrian 2 is not due to the track ending before the red sliding window. Despite this, the observable timesteps between 20 and 30 are still included for vehicle 1 and pedestrian 2 as they provide important context to model interactions. This process is performed for each scenario and a sliding interval of five timesteps, dividing it into several predictable scenes. Through this procedure, we generate over one million, long predictable pedestrian samples for the original training and validation splits combined. Given that the Argoverse 2 challenge evaluates all agent types combined, with pedestrians being only a small fraction of it, we decided to split the generated samples once more to form a dedicated pedestrian benchmark while preserving the original 80-10-10 split ratio. Since over 40% of the samples contain several pedestrian tracks, the training and evaluation of parallel prediction methods is supported. To better differentiate predictable pedestrian tracks, we adapted the original track labels for these samples. SCORED_TRACK now refers to predictable tracks while UNSCORED_TRACK represents agents still being present in the most recent timestep but either having an incomplete motion history or ground truth. All remaining ones are labeled as TRACK_FRAGMENT.
3.3 Feature representation
Based on the introduced benchmark, features are extracted to improve the model’s learning process. Starting with the social features, a matrix with dimensions is created. To align with the constraints in Sec. 3.1, the first dimension of the matrix is defined by Miller’s Law [26]. It states that individuals can only effectively process around objects within a short period of time, limiting the number of agents the focal pedestrian interacts with. Given the possibility that more than seven agents are contained within the scene, relevant ones are determined through a distance-based selection [51], choosing only the closest agents. To determine the effectiveness of this selection scheme, we compare it to an approach derived from crowd research based on collision risk [8]. As can be seen in Fig. 3, the risk is determined based on the current velocity vectors of the surrounding agents, calculating the time- and distance-to-closest-approach as well as the derivative of the bearing angle . The reasoning behind this choice is to include faster-moving objects that are further away, which otherwise might not be considered during a pure distance-based selection. For the calculation, the three parameters are given by , , and and are taken from the initial publication [8].
Besides the number of interacting agents, the second dimension in the social matrix represents the feature vector length shown in Eq. 1, containing the motion history of an agent for up to ten timesteps . As can be seen in the equation, while the first entry indicates the agent type, the remaining twenty only contain relative positional values to simplify preprocessing efforts. In addition, adopting an agent-centric encoding scheme, all agent positions are transformed according to the aligned, local map of the current scene where the origin is defined by the current position of the focal pedestrian.
| (1) |
While networks employing either agent- or scene-centric encodings can achieve similar results, the former offers better generalization capabilities due to its rotational and translational invariance [51, 53]. This effect is particularly noticeable when combined with smaller network sizes. Furthermore, since less semantic information needs to be included for individuals, faster processing times can be achieved in conjunction with a vectorized scene encoding. This approach results in a relatively small map feature vector of only , which is visualized in Fig. 4 alongside our scene representation. For each focal agent, we consider the surrounding polylines within a range, measured using the L2 distance. The lines are then ordered, and only the 100 closest ones are integrated into the feature vector. To differentiate various segments, each feature vector consists of six values. The first entry describes the semantic type of the vector, being driveable area, lane segment, crosswalk, or free space, and the second one contains the polygon id this specific line belongs to. The remaining four entries are defined by the individual start and end coordinates, aligned with the agent’s heading.
3.4 Model architecture
In this section, we present our Snapshot architecture. Similar to previous approaches, we opted for a parallel encoding strategy by employing two separate encoders for social and semantic information, as depicted in Fig. 5 [36, 23, 43]. The first encoder processes the social information by extracting relevant features resembling interactions in the scene. Since many publications demonstrate the effectiveness of employing transformer architectures for this type of information [46, 53], we adopt this approach but modeled it after the original layout [42]. For the map encoder, we use the same architecture to extract spatial features from the vector map, but exchange the self-attention module with a cross-attention one. Here, the social embedding is provided as query while using the map embedding as key and value [52]. Both encoding stages produce an output tensor of size that is concatenated along the channel dimension before being fed into the subsequent decoder. This last stage employs a CNN architecture for mainly two reasons: First, these networks show promising results particularly in pedestrian-centered research [25, 48, 27], and second, it allows for the generation of an unimodal trajectory within a single inference pass. For all three stages, we chose a Leaky ReLU activation function. With this configuration, the presented model has an overall size of just arameters.
3.5 Training procedure
To achieve robust and accurate performance across various numbers of timesteps, the training was conducted in two steps. First, to optimize for accuracy, all available timesteps were considered. In the second phase, to improve the model’s performance for missing timesteps, specific positional values are removed with a defined ratio for each batch. In both cases, we utilize the Average Displacement Error (ADE) as the loss function and upsample the model’s output to match the 60 ground truth positions. Additionally, we employ the Adam optimizer with an initial learning rate of which is automatically adjusted when a plateau during training is reached. To prevent the model from overfitting, L2 regularization with a weight decay of s employed. The training and evaluation of the model were conducted on a single NVIDIA Tesla V100 GPU with 16GB of RAM and a batch size of 256. On average, the training concluded after 60 epochs.
3.6 Metrics
The two most common metrics when evaluating trajectory predictors are the Average Displacement Error and the Final Displacement Error (FDE). In the multimodal case where several trajectories are predicted for a given agent, a Best-of-N (BoN) approach is adopted, choosing the trajectory with the smallest error compared to the ground truth sequence . For the scope of this study, only the most likely trajectory is considered to allow for a fair comparison. While the ADE describes the average Euclidean distance between the predicted trajectory and the ground truth over the prediction horizon , the FDE only considers the last positional value. Hence, the latter can be considered as a measure of the error accumulation over time. Both metrics can be calculated as shown in Eq. 2 and Eq. 3, where represents the number of predicted agents across all scenarios.
| (2) |
| (3) |
4 Results
In the following, we outline the performance of our Snapshot model by presenting the influence of different training strategies as well as comparing its overall accuracy against the current state of the art. To this end, we will demonstrate the effectiveness of our feature selection.
4.1 Training strategy
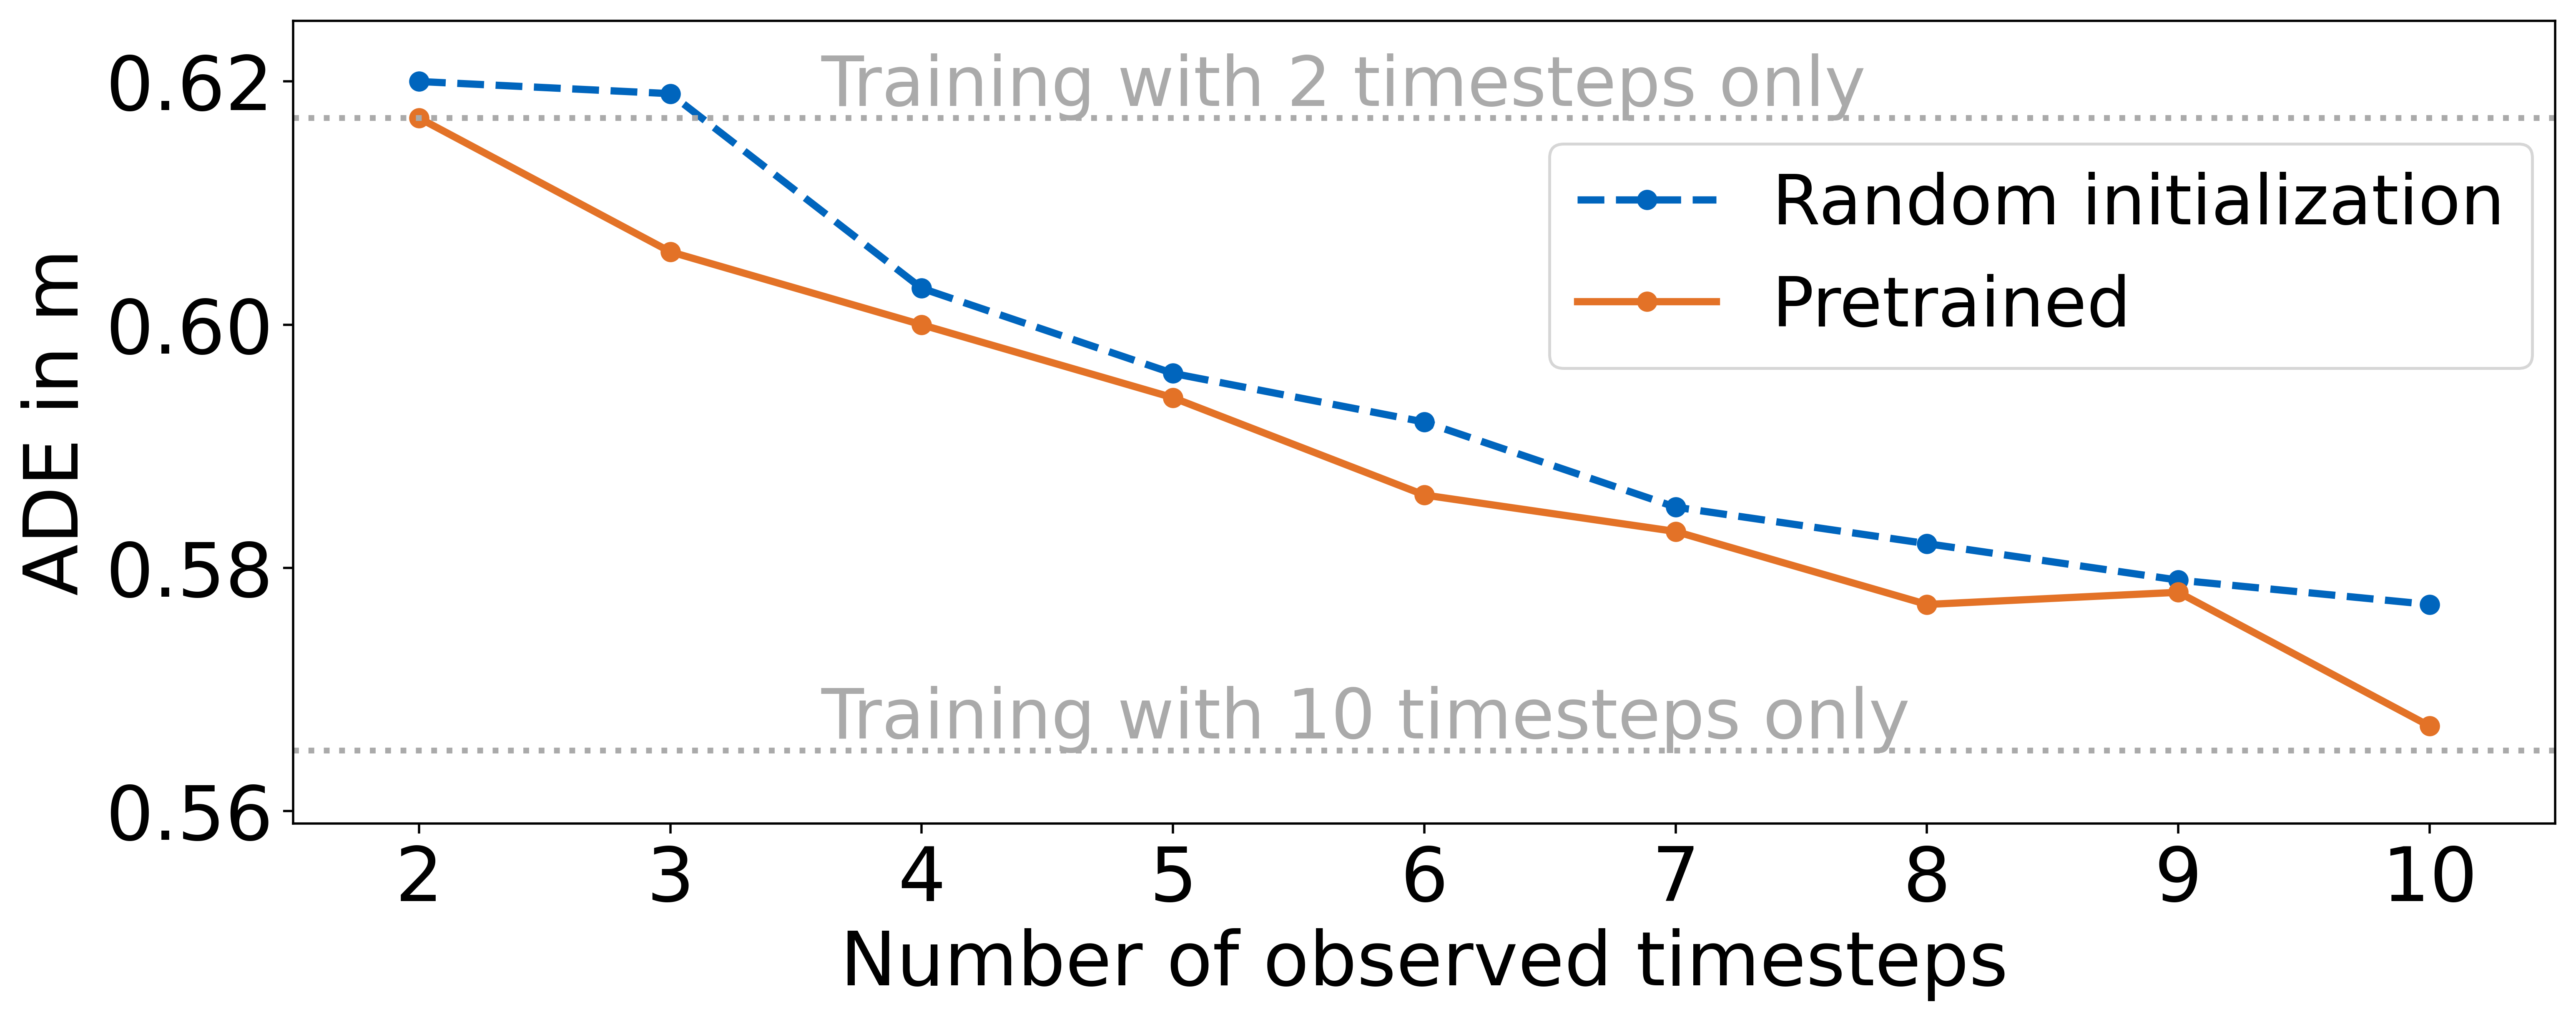
An effective training strategy is crucial for achieving robustness alongside accurate predictions as illustrated in Fig. 6. Here, we present four distinct methods with varying motion histories. The first two, depicted with dotted horizontal lines, show the accuracy of models optimized exclusively for either two or ten timesteps. These reference values represent the performance obtained when evaluating each model with the corresponding motion history employed during training. When using fewer than ten timesteps for the second, its accuracy significantly deteriorates with ADE and FDE values up to and , respectively. To enhance robustness and consider an arbitrary number of timesteps, the colored graphs resemble the remaining two strategies. The blue one illustrates the results when training with random initialization, achieving ADE values between and . However, this performance falls short of both baselines for the respective number of timesteps. To leverage previous training runs, the orange curve illustrates the results of our training strategy based on the lower baseline as described in Sec. 3.5. This approach shows a similar downward trend compared to random initialization but achieves lower ADE values across all timesteps. Moreover, it demonstrates an almost linear decline that matches both baseline scores. This difference is especially pronounced for ten timesteps, achieving an ADE of and thus maintaining the model’s performance from the previous training.
4.2 Quantitative results
To quantify the overall accuracy of Snapshot, we compare its performance against the current state of the art, represented by QCNet [52] and SIMPL [49]. As a baseline, we use the constant velocity model (CVM) which has achieved competitive results in previous studies [39]. To conduct a comprehensive evaluation, we present all scores on both, the original Argoverse 2 validation set for focal pedestrians, as well as on the test split for our proposed benchmark.
| Argoverse 2 (validation split) | Proposed benchmark (test split) | |||
|---|---|---|---|---|
| Models | ADE in m | FDE in m | ADE in m | FDE in m |
| CVM [39] | 0.719 | 1.668 | 0.793 | 1.776 |
| SIMPL [49] | 0.686 | 1.548 | 0.699 | 1.557 |
| QCNet [52] | 0.654 | 1.474 | 0.693 | 1.474 |
| Snapshot(2 timesteps) | 0.648 | 1.423 | 0.617 | 1.342 |
| Snapshot(10 timesteps) | 0.605 | 1.358 | 0.567 | 1.251 |
For the scores of the Argoverse 2 validation split listed in Tab. 2 on the left, the baseline CVM reaches an ADE of and an FDE of , the overall lowest accuracy among the investigated models. Considering both, 50 historical timesteps as well as semantic information, both SIMPL and QCNet manage to significantly improve these values, decreasing the ADE by up to and the FDE by . Nevertheless, the overall best results are achieved by Snapshot, achieving ADE and FDE values of up to and , respectively. An identical observation can be made for the results of our proposed test split, where the performance differences are even more significant. Here, relative ADE and FDE improvements of and can be noted when evaluating Snapshot against the next best model QCNet.
4.3 Effectiveness of selected features
Besides the training strategy and chosen architecture, the selection of input features is crucial to building an effective model. Therefore, this final section briefly compares the influence of various sizes for the local map and different agent selection mechanisms, as described in Sec. 3.3. Starting with the number of polylines considered per agent, the top part of Tab. 3 displays the ADE and FDE values when considering between vectors. Generally, a downward trend can be observed, leading to a decrease in accuracy with fewer polylines considered. Completely ablating the map information results in an FDE increase of about compared to the overall best result, highlighting the importance of incorporating semantic features. In contrast, using 100 instead of 200 polylines has a negligible effect as a maximum difference of is observed.
When focusing on social information, being displayed in the bottom row of Tab. 3, the distance-based selection mechanism in Snapshot is compared with the collision risk criteria and a complete ablation. It is noticeable that the results improve with the risk-based selection, achieving ADE and FDE values of and , respectively. In contrast, when ablating the positional values of the surrounding agents completely, the performance decreases by up to in FDE. These aspects highlight that social information contributes valuable cues to generate accurate predictions and that the selection of surrounding agents based on collision risk offers a slight advantage.
| Feature | Variant | ADE in m | FDE in m |
|---|---|---|---|
| 200 | 0.563 | 1.242 | |
| Number of | 100 | 0.565 | 1.246 |
| map vectors | 50 | 0.574 | 1.268 |
| 0 | 0.647 | 1.444 | |
| Agent se- | L2 Norm | 0.565 | 1.246 |
| lection | Collision Risk | 0.548 | 1.196 |
| criteria | No agents | 0.583 | 1.286 |
5 Discussion
In this final section, we will discuss the applicability aspect of Snapshot. Furthermore, we provide qualitative results to underline its performance as well as highlight some aspects that still require further research.
5.1 Applicability
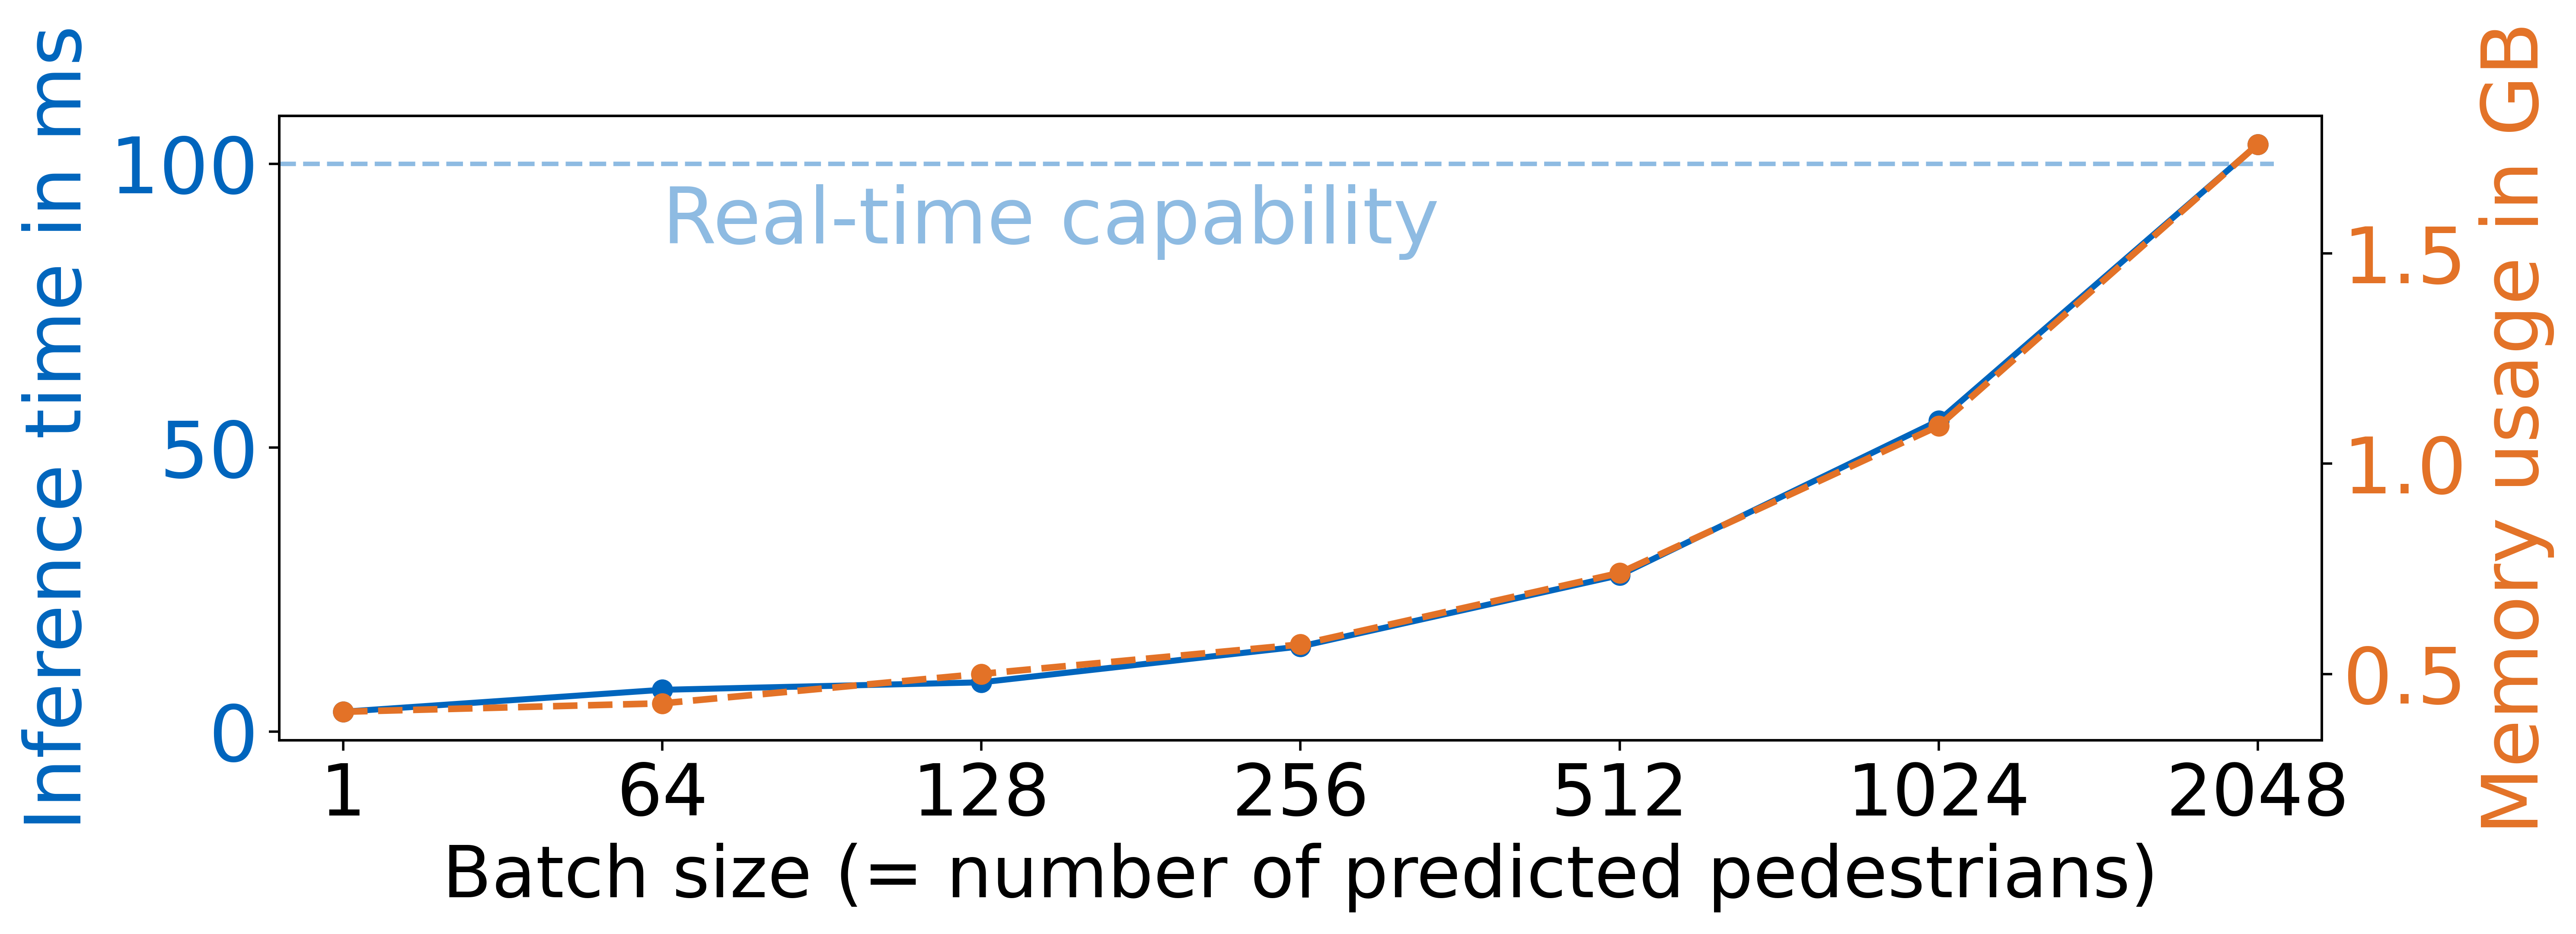
Given the hardware constraints in real-world systems, runtime and computational efficiency are significant challenges when integrating any prediction method. Neglecting the effects of parallel processing first, our model has an average inference time of with a memory utilization of , marking the lower bound of Fig. 7. Due to its relatively small model size, the batch size can be increased to 2048 before exceeding the real-time mark of , achieving an overall throughput of at . Since such agent counts are rarely relevant in the real world and this value is well above the maximum number of 73 pedestrians observed in a single Argoverse 2 scenario, a batch size of 128 represents a suitable choice, resulting in a total prediction time of . Therefore, Snapshot can be considered a real-time capable and scalable architecture.
To verify that our approach also works in a real-world application and not just in an offline setting, we integrated Snapshot into a modular autonomous driving software stack based on Autoware [17] and deployed it onto an automated vehicle. One scene encountered on the road is visualized in Fig. 8 and shows several pedestrians crossing the road over two crosswalks from a birds-eye view. While initially the model struggled to predict consistent paths due to noisy detections received from CenterPoint [45], adding a small amount of Gaussian noise to the positional observations during training significantly improved the results. The final behavior can be observed in the image as static and dynamic agents can now be reliably predict. Interestingly, although the majority of generated predictions aligns with the observed actions, the model occasionally exhibits more conservative behavior during road crossings. This phenomenon is highlighted with the yellow and orange trajectories. Nevertheless, our tests have shown that Snapshot provides a suitable tool for real-world pedestrian trajectory prediction and that depending on the object detector in use, some fine-tuning might be required. To improve accuracy even further, various data augmentation techniques or an adapted loss-function might be considered.

5.2 Model performance
Based on the analysis conducted in Tab. 3, the local context provided by the map appears to be the most influential feature. Given Snapshot’s accuracy using a simple distance-based selection scheme for both semantic polylines and surrounding agents, the relevance of more sophisticated strategies is questionable. Focusing on semantics alone, considering the closest polylines around the focal agent seems logical and sufficient, as they impact short-term decision-making the most. However, the results in Tab. 3 suggest that the impact of surrounding agents can be better assessed through collision risk, which is more effective in identifying relevant agents being further away. Although this approach offers a better classification, the distance-based selection provides a good trade-off by being less computationally demanding. Nevertheless, it highlights that networks can derive collision-based cues from positional information alone, suggesting that similar results could be achieved by increasing the number of surrounding agents considered.
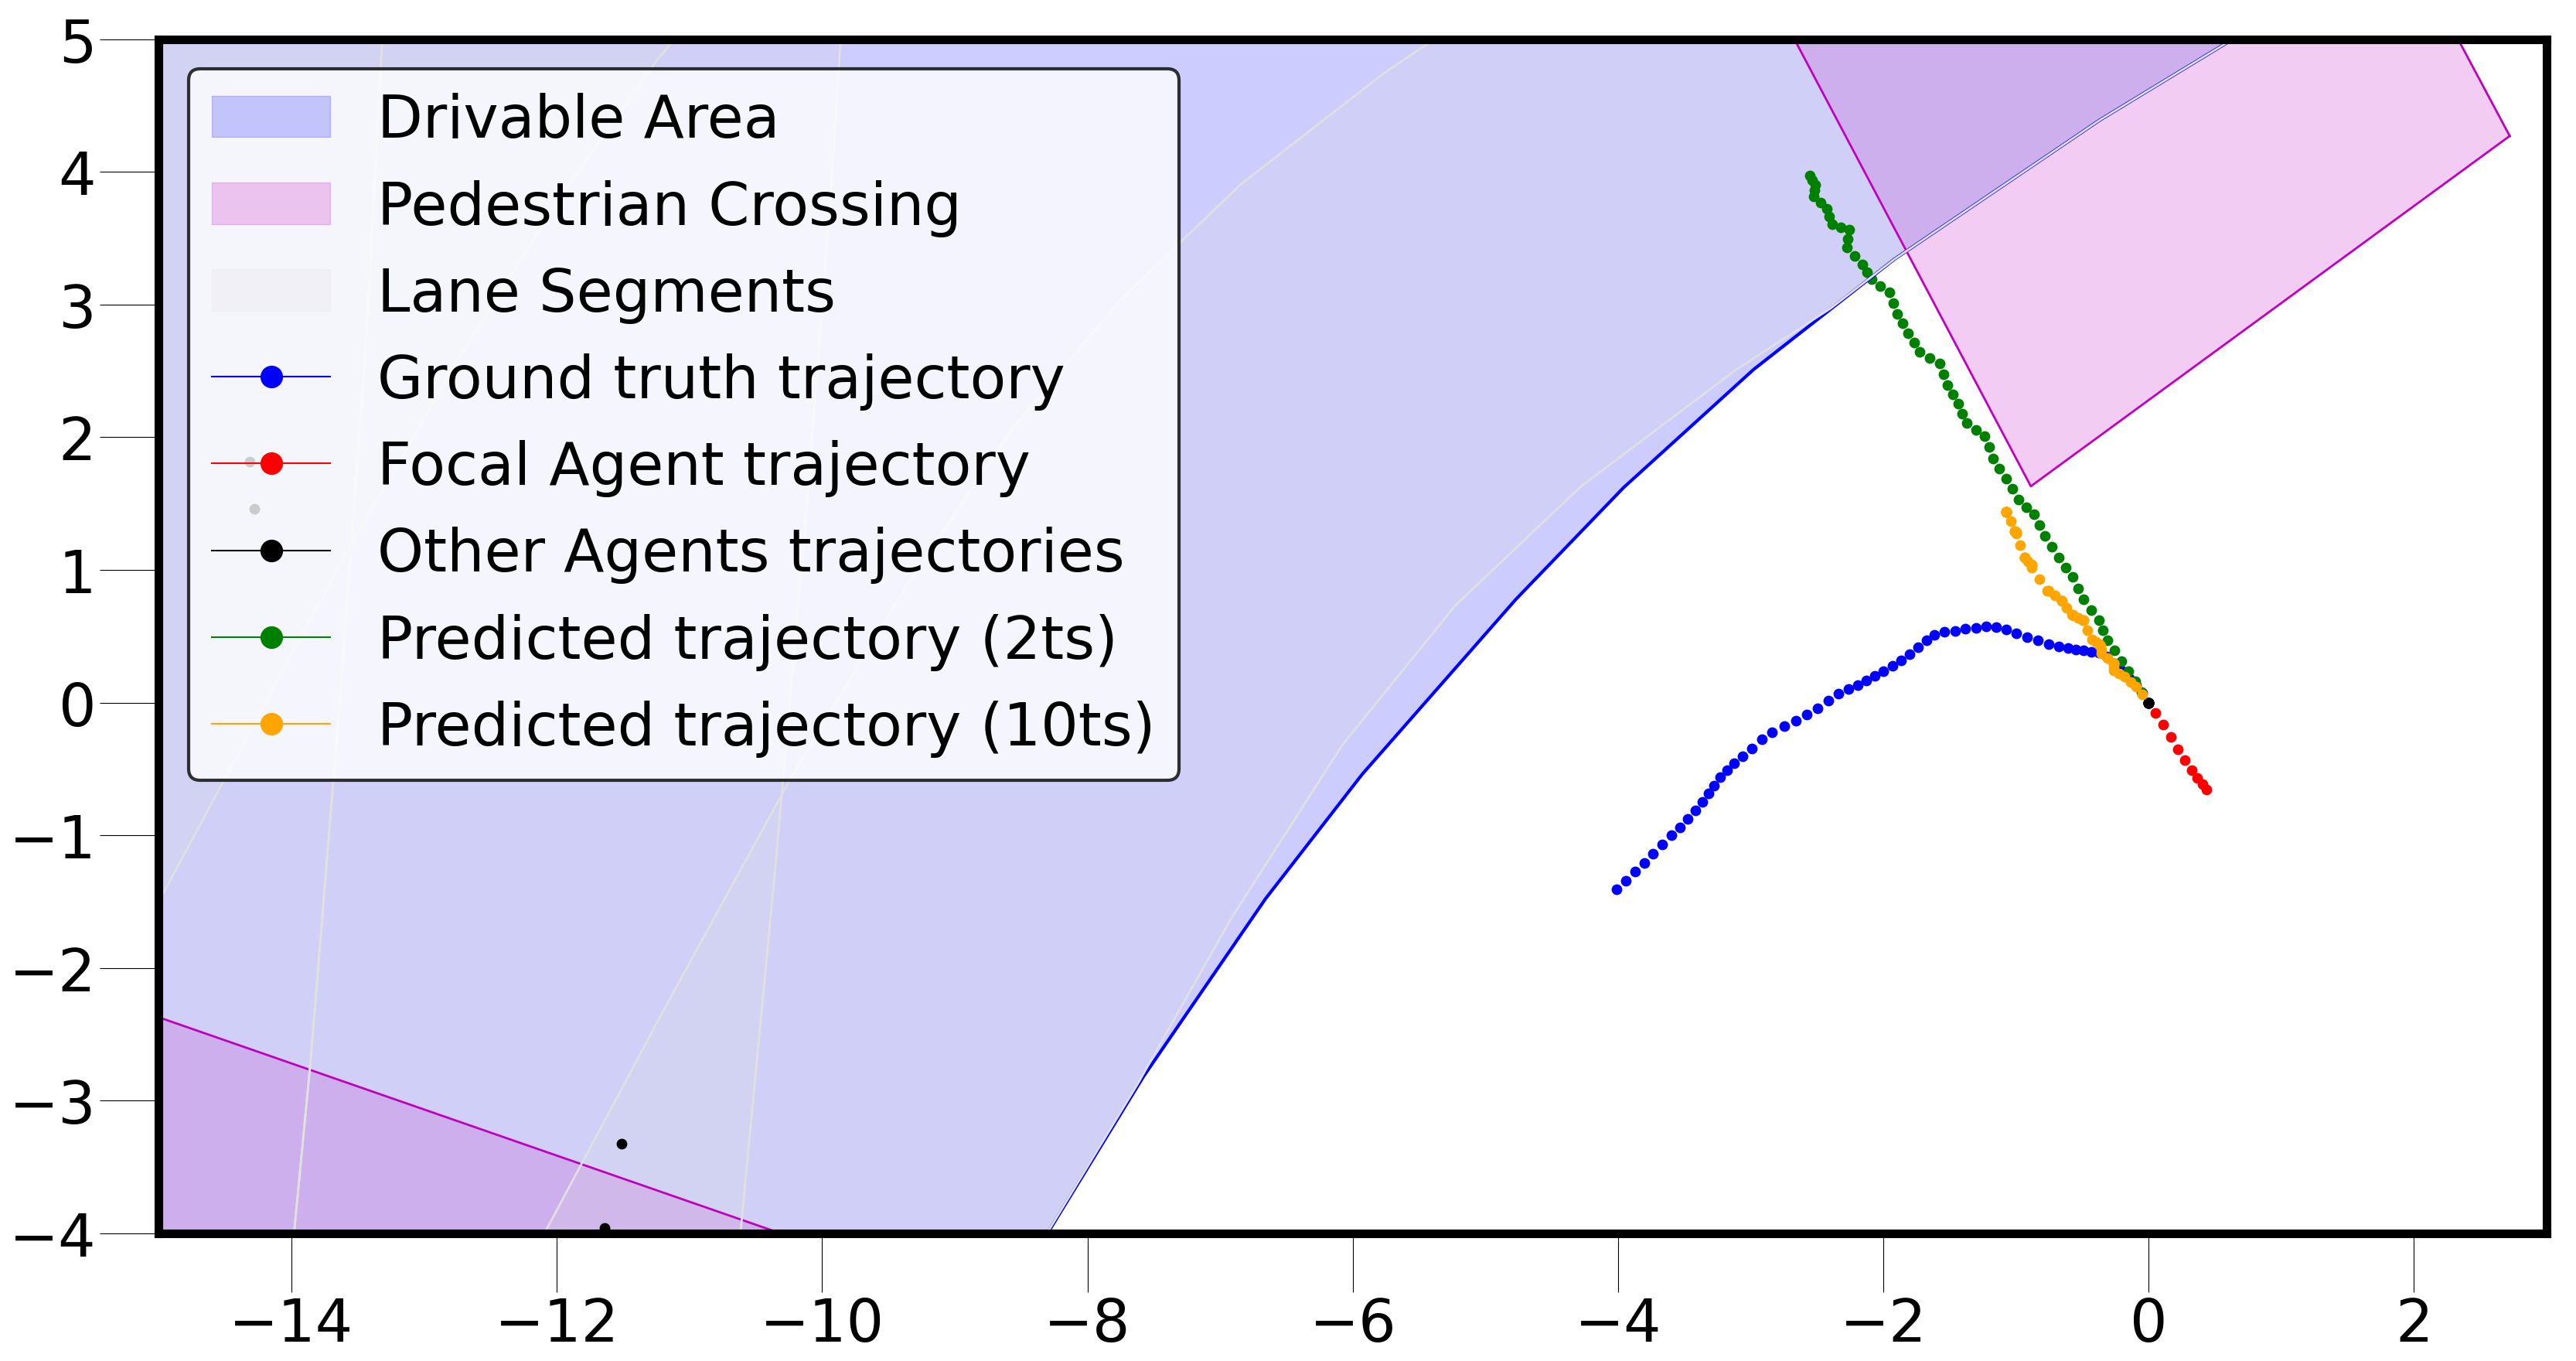
When analyzing the impact of the motion history as outlined in Fig. 6, we find that longer observations positively impact the overall accuracy. These improvements can be attributed to an enhanced scenario understanding as more timesteps provide additional cues to infer a pedestrian’s actions. This is illustrated in Fig. 9 within the top scenario, where Snapshot detects a changing movement pattern when using all ten observations. In contrast, with only two observations an anticipated crossing is predicted since only a single velocity vector can be derived. While this effect can also be observed for dynamic cases occasionally, it seems only valid for the most recent observations up to as they impact short-term actions [39]. This is supported by the values in Tab. 2 which show that Snapshot outperforms other models on the original validation split while using only a fifth of the available motion history. To improve performance further, future research might focus on extending the presented agent selection schemes or incorporating an action classification into the prediction framework.
6 Conclusion
The outlined work advances the field of pedestrian trajectory prediction by introducing Snapshot, the first model explicitly designed for real-world applications in urban traffic environments. Using an agent-centric encoding for improved generalization, we employ a simple yet effective input feature representation and a compact architecture with just arameters to create a scalable model. Notably, this model demonstrates robust performance across varying observation lengths, surpassing the current state of the art while using a five times shorter motion history. As a result, it can predict trajectories in as little as milliseconds per agent, enabling its real-world applicability that was verified in an autonomous driving stack on a vehicle.
Additionally, to address the gap in existing datasets, we provide a dedicated benchmark using Argoverse 2, which comprises over one million pedestrian tracks, offering diverse and challenging scenarios for further development and analysis. Based on our findings, future research directions include a deeper investigation of pedestrian behavior, incorporating additional cues from raw data, and exploring different model architectures.
References
- [1] Lina Achaji, Julien Moreau, Thibault Fouqueray, Francois Aioun, and Francois Charpillet. Is attention to bounding boxes all you need for pedestrian action prediction? pages 895–902. IEEE.
- [2] Alexandre Alahi, Kratarth Goel, Vignesh Ramanathan, Alexandre Robicquet, Li Fei-Fei, and Silvio Savarese. Social LSTM: Human trajectory prediction in crowded spaces. In 2016 IEEE Conference on Computer Vision and Pattern Recognition (CVPR), pages 961–971. ISSN: 1063-6919.
- [3] Javad Amirian, Jean-Bernard Hayet, and Julien Pettre. Social ways: Learning multi-modal distributions of pedestrian trajectories with GANs. 2019 IEEE/CVF Conference on Computer Vision and Pattern Recognition Workshops (CVPRW), pages 2964–2972, 2019.
- [4] Drazen Brscic, Takayuki Kanda, Tetsushi Ikeda, and Takahiro Miyashita. Person tracking in large public spaces using 3-d range sensors. 43(6):522–534.
- [5] Pablo Rodrigo Gantier Cadena, Yeqiang Qian, Chunxiang Wang, and Ming Yang. Pedestrian graph +: A fast pedestrian crossing prediction model based on graph convolutional networks. 23(11):21050–21061.
- [6] Holger Caesar, Varun Bankiti, Alex H. Lang, Sourabh Vora, Venice Erin Liong, Qiang Xu, Anush Krishnan, Yu Pan, Giancarlo Baldan, and Oscar Beijbom. nuScenes: A multimodal dataset for autonomous driving. 2020 IEEE/CVF Conference on Computer Vision and Pattern Recognition (CVPR), pages 11618–11628, 2019.
- [7] Alexey Dosovitskiy, Lucas Beyer, Alexander Kolesnikov, Dirk Weissenborn, Xiaohua Zhai, Thomas Unterthiner, Mostafa Dehghani, Matthias Minderer, Georg Heigold, Sylvain Gelly, Jakob Uszkoreit, and Neil Houlsby. An image is worth 16x16 words: Transformers for image recognition at scale.
- [8] Teófilo Dutra, Ricardo Marques, Joaquim Cavalcante-Neto, Creto Vidal, and Julien Pettre. Gradient-based steering for vision-based crowd simulation algorithms. 36.
- [9] Scott Ettinger, Shuyang Cheng, Benjamin Caine, Chenxi Liu, Hang Zhao, Sabeek Pradhan, Yuning Chai, Ben Sapp, Charles Qi, Yin Zhou, Zoey Yang, Aurelien Chouard, Pei Sun, Jiquan Ngiam, Vijay Vasudevan, Alexander McCauley, Jonathon Shlens, and Dragomir Anguelov. Large scale interactive motion forecasting for autonomous driving : The waymo open motion dataset. In 2021 IEEE/CVF International Conference on Computer Vision (ICCV), pages 9690–9699. IEEE.
- [10] David Fridovich-Keil, Andrea Bajcsy, Jaime F Fisac, Sylvia L Herbert, Steven Wang, Anca D Dragan, and Claire J Tomlin. Confidence-aware motion prediction for real-time collision avoidance1. 39(2):250–265. Publisher: SAGE Publications Ltd STM.
- [11] Jiyang Gao, Chen Sun, Hang Zhao, Yi Shen, Dragomir Anguelov, Congcong Li, and Cordelia Schmid. VectorNet: Encoding HD maps and agent dynamics from vectorized representation.
- [12] Thomas Gilles, Stefano Sabatini, Dzmitry Tsishkou, Bogdan Stanciulescu, and Fabien Moutarde. HOME: Heatmap output for future motion estimation.
- [13] Mahsa Golchoubian, Moojan Ghafurian, Kerstin Dautenhahn, and Nasser Lashgarian Azad. Pedestrian trajectory prediction in pedestrian-vehicle mixed environments: A systematic review. 24(11):11544–11567.
- [14] Agrim Gupta, Justin Johnson, Li Fei-Fei, Silvio Savarese, and Alexandre Alahi. Social GAN: Socially acceptable trajectories with generative adversarial networks.
- [15] Jeroen Hagenus, Frederik Baymler Mathiesen, Julian F. Schumann, and Arkady Zgonnikov. A survey on robustness in trajectory prediction for autonomous vehicles.
- [16] Dirk Helbing and Peter Molnar. Social force model for pedestrian dynamics. 51(5):4282–4286.
- [17] Shinpei Kato, Shota Tokunaga, Yuya Maruyama, Seiya Maeda, Manato Hirabayashi, Yuki Kitsukawa, Abraham Monrroy, Tomohito Ando, Yusuke Fujii, and Takuya Azumi. Autoware on board: Enabling autonomous vehicles with embedded systems. In 2018 ACM/IEEE 9th International Conference on Cyber-Physical Systems (ICCPS), pages 287–296, 2018.
- [18] Sujeong Kim, Stephen J. Guy, Wenxi Liu, David Wilkie, Rynson W.H. Lau, Ming C. Lin, and Dinesh Manocha. BRVO: Predicting pedestrian trajectories using velocity-space reasoning. 34(2):201–217. Publisher: SAGE Publications Ltd STM.
- [19] Wee Koh and Suiping Zhou. Modeling and simulation of pedestrian behaviors in crowded places. 21:20.
- [20] Raphael Korbmacher and Antoine Tordeux. Review of pedestrian trajectory prediction methods: Comparing deep learning and knowledge-based approaches. IEEE Transactions on Intelligent Transportation Systems, 23:24126–24144, 2021.
- [21] Vineet Kosaraju, Amir Sadeghian, Roberto Martín-Martín, Ian Reid, S. Hamid Rezatofighi, and Silvio Savarese. Social-BiGAT: Multimodal trajectory forecasting using bicycle-GAN and graph attention networks.
- [22] Parth Kothari, Sven Kreiss, and Alexandre Alahi. Human trajectory forecasting in crowds: A deep learning perspective. 23(7):7386–7400. Conference Name: IEEE Transactions on Intelligent Transportation Systems.
- [23] Zhiqian Lan, Yuxuan Jiang, Yao Mu, Chen Chen, and Shengbo Eben Li. SEPT: Towards efficient scene representation learning for motion prediction.
- [24] Alon Lerner, Yiorgos Chrysanthou, and Dani Lischinski. Crowds by example. 26(3):655–664. _eprint: https://onlinelibrary.wiley.com/doi/pdf/10.1111/j.1467-8659.2007.01089.x.
- [25] Karttikeya Mangalam, Yang An, Harshayu Girase, and Jitendra Malik. From goals, waypoints & paths to long term human trajectory forecasting. 2021 IEEE/CVF International Conference on Computer Vision (ICCV), pages 15213–15222, 2020.
- [26] G. A. Miller. The magical number seven plus or minus two: some limits on our capacity for processing information. 63(2):81–97.
- [27] Abduallah Mohamed, Deyao Zhu, Warren Vu, Mohamed Elhoseiny, and Christian Claudel. Social-implicit: Rethinking trajectory prediction evaluation and the effectiveness of implicit maximum likelihood estimation.
- [28] Nigamaa Nayakanti, Rami Al-Rfou, Aurick Zhou, Kratarth Goel, Khaled S. Refaat, and Benjamin Sapp. Wayformer: Motion forecasting via simple & efficient attention networks. In 2023 IEEE International Conference on Robotics and Automation (ICRA), pages 2980–2987.
- [29] Jan Ondrej, Julien Pettre, Anne-Hélène Olivier, and Stéphane Donikian. A synthetic-vision based steering approach for crowd simulation. 29.
- [30] S. Pellegrini, A. Ess, K. Schindler, and L. van Gool. You’ll never walk alone: Modeling social behavior for multi-target tracking. In 2009 IEEE 12th International Conference on Computer Vision, pages 261–268. ISSN: 2380-7504.
- [31] Daniela Ridel, Eike Rehder, Martin Lauer, Christoph Stiller, and Denis Wolf. A literature review on the prediction of pedestrian behavior in urban scenarios. In 2018 21st International Conference on Intelligent Transportation Systems (ITSC), pages 3105–3112. IEEE.
- [32] Alexandre Robicquet, Amir Sadeghian, Alexandre Alahi, and Silvio Savarese. Learning social etiquette: Human trajectory understanding in crowded scenes. In Bastian Leibe, Jiri Matas, Nicu Sebe, and Max Welling, editors, Computer Vision – ECCV 2016, Lecture Notes in Computer Science, pages 549–565. Springer International Publishing.
- [33] Andrey Rudenko, Tomasz P. Kucner, Chittaranjan S. Swaminathan, Ravi T. Chadalavada, Kai O. Arras, and Achim J. Lilienthal. TH\”OR: Human-robot navigation data collection and accurate motion trajectories dataset. 5(2):676–682.
- [34] Amir Sadeghian, Vineet Kosaraju, Ali Sadeghian, Noriaki Hirose, S. Hamid Rezatofighi, and Silvio Savarese. SoPhie: An attentive GAN for predicting paths compliant to social and physical constraints. 2019 IEEE/CVF Conference on Computer Vision and Pattern Recognition (CVPR), pages 1349–1358, 2018.
- [35] Tim Salzmann, Lewis Chiang, Markus Ryll, Dorsa Sadigh, Carolina Parada, and Alex Bewley. Robots that can see: Leveraging human pose for trajectory prediction. 8(11):7090–7097.
- [36] Tim Salzmann, Boris Ivanovic, Punarjay Chakravarty, and Marco Pavone. Trajectron++: Dynamically-feasible trajectory forecasting with heterogeneous data. In European Conference on Computer Vision (ECCV), 2020.
- [37] Christoph Schöller and Alois Knoll. Flomo: Tractable motion prediction with normalizing flows. 2021 IEEE/RSJ International Conference on Intelligent Robots and Systems (IROS), pages 7977–7984, 2021.
- [38] Jianhua Sun, Yuxuan Li, Liang Chai, Hao-Shu Fang, Yong-Lu Li, and Cewu Lu. Human trajectory prediction with momentary observation. 2022 IEEE/CVF Conference on Computer Vision and Pattern Recognition (CVPR), pages 6457–6466, 2022.
- [39] Nico Uhlemann, Felix Fent, and Markus Lienkamp. Evaluating pedestrian trajectory prediction methods with respect to autonomous driving. IEEE Transactions on Intelligent Transportation Systems, pages 1–10, 2024.
- [40] Jur van den Berg, Stephen J. Guy, Ming Lin, and Dinesh Manocha. Reciprocal n-body collision avoidance. In Cédric Pradalier, Roland Siegwart, and Gerhard Hirzinger, editors, Robotics Research, Springer Tracts in Advanced Robotics, pages 3–19. Springer.
- [41] Jur van den Berg, Sachin Patil, Jason Sewall, Dinesh Manocha, and Ming Lin. Interactive navigation of multiple agents in crowded environments.
- [42] Ashish Vaswani, Noam Shazeer, Niki Parmar, Jakob Uszkoreit, Llion Jones, Aidan N Gomez, Ł ukasz Kaiser, and Illia Polosukhin. Attention is all you need. In Advances in Neural Information Processing Systems, volume 30, 2017.
- [43] Xishun Wang, Tong Su, Fang Da, and Xiaodong Yang. ProphNet: Efficient agent-centric motion forecasting with anchor-informed proposals.
- [44] Benjamin Wilson, William Qi, Tanmay Agarwal, John Lambert, Jagjeet Singh, Siddhesh Khandelwal, Bowen Pan, Ratnesh Kumar, Andrew Hartnett, Jhony Kaesemodel Pontes, Deva Ramanan, Peter Carr, and James Hays. Argoverse 2: Next generation datasets for self-driving perception and forecasting. In Proceedings of the Neural Information Processing Systems Track on Datasets and Benchmarks (NeurIPS Datasets and Benchmarks 2021), 2021.
- [45] Tianwei Yin, Xingyi Zhou, and Philipp Krähenbühl. Center-based 3d object detection and tracking. 2021 IEEE/CVF Conference on Computer Vision and Pattern Recognition (CVPR), pages 11779–11788, 2020.
- [46] Ye Yuan, Xinshuo Weng, Yanglan Ou, and Kris Kitani. AgentFormer: Agent-aware transformers for socio-temporal multi-agent forecasting. 2021 IEEE/CVF International Conference on Computer Vision (ICCV), pages 9793–9803, 2021.
- [47] Jiangbei Yue, Dinesh Manocha, and He Wang. Human trajectory prediction via neural social physics. In European Conference on Computer Vision (ECCV), 2022.
- [48] Simone Zamboni, Zekarias Tilahun Kefato, Sarunas Girdzijauskas, Christoffer Norén, and Laura Dal Col. Pedestrian trajectory prediction with convolutional neural networks. 121:108252.
- [49] Lu Zhang, Peiliang Li, Sikang Liu, and Shaojie Shen. Simpl: A simple and efficient multi-agent motion prediction baseline for autonomous driving. IEEE Robotics and Automation Letters, 9(4):3767–3774, 2024.
- [50] Weicheng Zhang, Hao Cheng, Fatema T. Johora, and Monika Sester. ForceFormer: Exploring social force and transformer for pedestrian trajectory prediction. In 2023 IEEE 35th Symposium on Intelligent Vehicles (IV).
- [51] Zhejun Zhang, Alexander Liniger, Christos Sakaridis, Fisher Yu, and Luc Van Gool. Real-time motion prediction via heterogeneous polyline transformer with relative pose encoding. In Advances in Neural Information Processing Systems (NeurIPS), 2023.
- [52] Zikang Zhou, Jianping Wang, Yung–Hui Li, and Yu–Kai Huang. Query-centric trajectory prediction. In 2023 IEEE/CVF Conference on Computer Vision and Pattern Recognition (CVPR), pages 17863–17873. IEEE.
- [53] Zikang Zhou, Luyao Ye, Jianping Wang, Kui Wu, and Kejie Lu. HiVT: Hierarchical vector transformer for multi-agent motion prediction. In 2022 IEEE/CVF Conference on Computer Vision and Pattern Recognition (CVPR), pages 8813–8823. IEEE.