The SAPPHIRES collaboration
Search for sub-eV axion-like particles in a quasi-parallel stimulated resonant photon-photon collider with ”coronagraphy”
Abstract
Axion-like particles (ALPs) have been searched for with a quasi-parallel stimulated resonant photon-photon collider sensitive to the sub-eV mass range by focusing two-color near-infrared pulse lasers into a vacuum. In this work, we have developed a specialized coronagraphy to mitigate the dominant background photons from optical elements by introducing an eclipse filter. The observed number of signal-like photons was found to be consistent with residual background photons from optical elements through an additional test by degrading the focal point overlapping factor between the two lasers. We then extended the exclusion region in the relation between ALP-photon coupling, , and the ALP mass , reaching the most sensitive point at for pseudoscalar ALPs.
I Introduction
The strong CP problem is a long standing issue in the sector of quantum chromodynamics (QCD) in the Standard Model of particle physics. Peccei-Quinn introduced a new global symmetry Peccei:1977hh ; Peccei:1977ur to resolve this issue and appearance of axion is predicted as a kind of pseudo Nambu-Goldstone boson Weinberg:1977ma ; Wilczek:1977pj as a result of the symmetry breaking. Given the energy scale for the symmetry breaking higher than that of the electroweak symmetry, the coupling of axion to ordinary matter can be feeble. Thus axion can be a natural candidate for cold dark matter Preskill:1982cy ; Dine:1982ah ; Abbott:1982af . In addition to axion, more generic axion-like particles (ALPs) are also predicted in various contexts. The QCD axion model explicitly requires the proportional relation between axion mass and axion-matter couplings. In contrast ALPs do not necessarily require it. The ”classical” mass window for the QCD axion models to account for the dark matter abundance is 1-100 eV. On the other hand, topological defects may cause different predictions on the mass scale. In particular, a model for string defect in the post-inflationary scenario predicts lower mass bounds around meV Gorghetto . Furthermore, an ALP relevant to inflation predicts the mass range up to eV MIRACLE as well. So far the QCD axion benchmark models in the mass range 1-100 meV indeed have not been fully tested yet. Therefore, it is worth testing the sub-eV scale QCD axion and ALP scenarios as in general as possible.
We address the generic coupling between sub-eV ALPs and two photons for scalar () and pseudoscalar () ALPs as follows
| (1) |
where dimensionless constant for a given energy scale at which a relevant symmetry is broken, the electromagnetic field strength tensor and its dual with the Levi-Civita symbol are used.
The SAPPHIRES collaboration applied stimulated resonant photon-photon collisions (SRPC) to the general searches for ALPs SAPPHIRES00 , which were totally independent of any cosmological and astrophysical assumptions. In the quasi parallel SRPC, a single pulse laser beam (Ti:Sapphire laser) was focused in the vacuum and simultaneously another pulse laser beam (Nd:YAG laser) was commonly focused after combing the two laser beams along the same optical axis. The role of the first beam is to create an ALP resonant state via two photon collisions between stochastically selected two photons within the single focused beam. The role of the second beam is to induce decay of the produced ALP state into two photons. When momentum and polarization states of either one of two decayed photons coincide with those in the inducing beam, the decay rate is enhanced with the proportional dependence on the average number of photons in the inducing beam SAPPHIRES00 . As a result of the ALP creation and the stimulated decay, we can expect generation of a signal photon with a specific energy and direction via energy-momentum conservation between the three laser photons and the signal one. If we assume photon energies: in the creation beam and in the inducing beam, the signal photon energy becomes , which is clearly separable from the beam photon energies. It can be interpreted as four-wave mixing (FWM) in the vacuum. So this entire scattering process is also referred to as FWM in the vacuum (vFWM) in the following sections. Indeed, FWM occurs via atoms through the dipole coupling to photons because the kinematical relation between four photons can be in atomic FWM (aFWM). Therefore, residual atoms in a vacuum chamber and also optical elements to control laser beams can be natural background sources with respect to vFWM.
The SAPPHIRES00 search SAPPHIRES00 was performed with sub-mJ pulse lasers. We have established the way to evaluate the background yields from residual-gas originating aFWM (gas-aFWM), plasma generation, and other ambient noise sources. In the SAPPHIRES01 search SAPPHIRES01 , we have updated the ALP search result with laser energies that were one order of magnitude higher than those in SAPPHIRES00. In this search optical-element originating aFWM (opt-aFWM) was observed for the first time with the mJ level laser pulses. We then have introduced the new method for discriminating between the new background component and signals from vFWM. In this paper, we have further increased pulse energies up to the 10 mJ level, where opt-aFWM became too significant. Since transmissive optical elements tend to produce a huge amount of opt-aFWM, we have upgraded the entire optical design by replacing those elements with reflective ones. In addition we have developed a new method, a kind of coronagraphy, by introducing an eclipse filter, to significantly suppress the opt-aFWM component.
This paper is organized as follows. We first introduce classification on possible sources of FWM photons and how to extract vFWM based on coronagraphy. Second, we explain the upgraded experimental setup used for this search. Third, we show the measurements and results in this search. Fourth, a new exclusion region for the relation between ALP coupling with photons and ALP mass is provided based on the null result as we will see below. Finally, the conclusion is given.
II Coronagraphy in quasi-parallel SRPC
II.1 Possible background sources and extraction of FWM photons
There are known background processes in this experiment: photons from plasma formation at the focal point and atomic four-wave mixing (aFWM) processes. aFWM is composed of two processes originating from residual gas at the focal point and originating from optical elements in the path of the combined laser beams. aFWM photons are produced from the combination of two incident beams in the same way as signal photons via ALP exchanges, whereas plasma-originating photons are produced with just one laser beam focusing. In order to obtain the number of FWM photons by subtracting plasma-originating photons from observed photons, searching data are taken by requiring four beam combination patterns between creation and inducing laser pulse injections, which are define as
- S-pattern
-
both creation and inducing laser pulses are injected resulting in FWM signals
- C-pattern
-
only creation laser pulses are injected
- I-pattern
-
only inducing laser pulses are injected
- P-pattern
-
both laser pulses are absent, that is, pedestal cases.
The number of FWM photons is estimated by the following relations
| (2) |
where , , , and are the number of observed photons in the individual beam combinations. Furthermore, since includes the signal photons and background photons, is modeled as
| (3) |
where , , and represent the number of vacuum originating FWM (vFWM) photons, i.e., signal photons originating from ALP exchanges, residual-gas originating aFWM (gas-aFWM) photons, and optical-element originating aFWM (opt-aFWM) photons, respectively. vFWM photons can be discriminated from aFWM photons based on the pressure dependence and the beam cross-section dependence, respectively. The detailed summary is found in SAPPHIRES01 . In the SAPPHIRES01 search, we measured the beam cross-section dependence of the number of observed photons by changing the beam diameter of the creation laser while fixing the diameter of the inducing beam. The number of observed photons increased until the diameter of the creation laser reached that of the inducing laser and then saturated after that. Therefore, we concluded that ALP-originating signal photons, that is, vFWM photons were consistent with null.
II.2 Coronagraphy with an eclipse filter to mitigate opt-aFWM photons
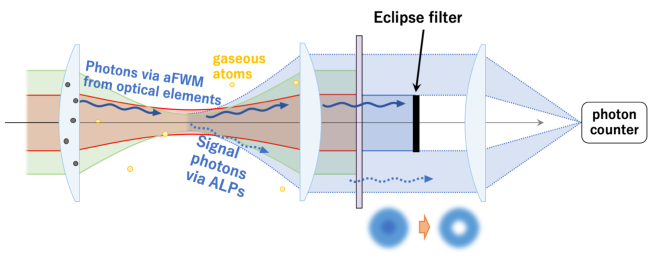
The behavior of the beam cross-section dependence of indicates that they were generated only in the overlap region between two laser beams. Since two incident beams were coaxially combined, opt-aFWM photons are kinetically predicted to propagate along the same optical path and diverge from the focal point as the including laser does. On the other hand, signal photons are expected to be also emitted outside the diverging cone of the incident beams JHEP2020 . We thus can introduce a new method to reduce opt-aFWM photons using the difference in the outgoing angular distribution between signal photons and background photons from the interaction point. The concept of the coronagraphy with an eclipse filter is illustrated in Fig. 1. After collimation by the second lens element, optical-element aFWM photons distribute in the middle region that approximately corresponds to the propagation of the inducing laser. The eclipse filter whose diameter is the same as that of inducing laser beam can block the dominant part of opt-aFWM photons. The collimated signal photons emitted in the peripheral region propagate like the solar eclipse and can be detected by a photon counter.
By this coronagraphy, in principle, the detection efficiency to vFWM photons is also diminished. However, as we discussed in detail in JHEP2020 , the efficiency reduction is minor especially in higher ALP mass region to which the quasi-parallel SRPC has a higher sensitivity thanks to inclusion of lots of combinations from asymmetric photon collisions. Therefore, even if we introduce the eclipse filter, we can keep a high signal to noise ratio for the higher mass range.
 |
III Experimental Setup
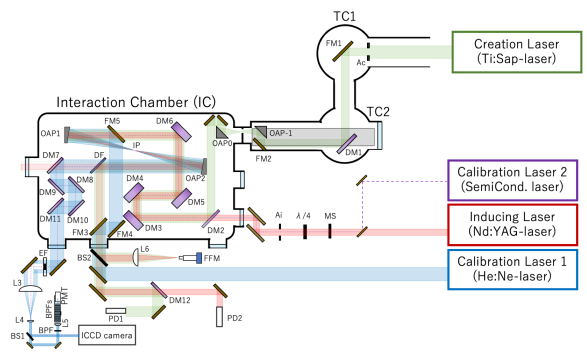 |
Figure 2 shows the schematic view of the searching setup. This setup was updated from the one used for the SAPPHIRES01 searchSAPPHIRES01 . We used a Ti:Sapphire laser, the system, available at Institute for Chemical Research in Kyoto University for the creation laser and a Nd:YAG laser for the inducing laser. The central wavelength of these lasers were 816 nm and 1064 nm, and their pulse duration were 40 fs and 9 ns, respectively. The creation laser was injected through the upstream transport chamber (TC1 and TC2), where the pressure was maintained at Pa, to the interaction chamber (IC) designed for the pressure reaching Pa. Due to the gap in the pressure values between TC1,2 and IC, we had introduced a window between the two vacuum systems in the SAPPHIRES01 search SAPPHIRES01 . In this work, however, in order to avoid the self-phase modulation by the optical nonlinear effect due to the high-intensity laser pulse incidence and also to mitigate opt-aFWM photons from the window, we introduced an orifice plate for beam transportation using off-axis parabolic mirrors (OAP-1 and OAP0). The diameter of the orifice was 10 mm, which was small enough to keep the pressure difference. Instead, we were forced to implement the new transport system so that the creation laser can be transported by focusing the field at just after the orifice location. A linear polarized creation laser (P-polarized) and a circular polarized inducing laser (left-handed) were combined at dichroic mirror (DM2) in the interaction chamber. Their diameters were selected using irises ( and ).
The central wavelength of FWM photons containing both vFWM and aFWM was expected to be nm, where and are the central wavelengths of the creation and inducing lasers, respectively. The wedged thick dichroic mirrors (DM3-DM6) were custom-made to reflect the creation laser wavelength 816 nm with 98 % and the inducing laser wavelength 1064 nm with 99 % while transmitting the signal wavelength 660 nm with 99 % to allow signal-like background photons to escape from back before reaching OAP1. The coaxially combined incident beams were focused into the interaction point (IP). The He:Ne laser, named as a calibration laser 1, was guided to OAP1 using flat mirrors (FM3-FM5) which were removed during the search. OAP2 collected signal photons, and the collimated incident beams were separated from the signal photons using a thin dichroic filter (DF) and dichroic mirrors (DM7-DM11). DM7-DM11 were identical custom-made mirrors reflecting 660 nm with greater than 95 % while transmitting around 816 nm with 99 % and 1064 nm with 95 % to pick up the signal waves among the residual creation and inducing laser beams. The DF is a 1 mm thick custom-made dichroic mirror that reflects 816 nm with 99 % and 1064 nm with 60 %, and transmits 660 nm with 98 %.
We newly introduced an eclipse filter (EF) outside the interaction chamber to block opt-aFWM photons. A semiconductor laser with the central wavelength of 450 nm was combined with the inducing laser and used as the second calibration laser to trace the path of the inducing laser. To obtain two dimensional information, a 50:50 beam splitter (BS1) was set and reflected photons were detected with an image-intensifier CCD (ICCD) camera (Princeton Instruments, PI-MAX). This camera has a sensitivity from visible to 900 nm including the central wavelength of the signal photons. Since the effective image area of ICCD was , a reduction optical system with an achromatic lens pair (L3 and L4) was implemented. The bandpass filters (BPFs) were used to absorb background photons from the residual laser beams. The signal photons transmitted through BPFs were detected with a single-photon-sensitive photomultiplier tube (PMT). In addition to the set of BPFs, a relatively narrow bandpass filter was added to accept photons in the wavelength range 650-670 nm to reduce plasma-originating photons. These BPFs were also placed in front of the ICCD camera. The time-voltage information from PMT and photodiodes (PDs) were recorded with a waveform digitizer.
IV Measurements and results
IV.1 Spatial distribution of optical-element aFWM photons and the effect of the eclipse filter
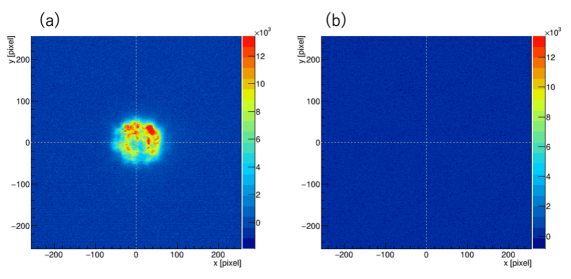
Two dimensional distributions of optical-element originating aFWM photons (opt-aFWM) were measured by the ICCD camera, which reflects the emission source area of opt-aFWM photons. Figure 3 (a) shows the spatial distribution of opt-aFWM photons summed over 500 shots of S-pattern. The x-y axes represent the camera pixels and the color contour indicates normalized ADC-channels of the ICCD camera. The image is consistent with the shape and size of the inducing laser on the surfaces of optical elements because the source area of opt-aFWM is limited by the beam cross-section of the including laser. In order to block the propagation of these opt-aFWM photons, an eclipse filter was aligned to the inducing laser position using calibration laser 2 in Fig.2. Figure 3 (b) shows the image of opt-aFWM photons after setting the eclipse filter consisting of multilayered paper seals on a thin glass plate. In this experiment, the diameter of the inducing laser was 10 mm, and the diameter of an eclipse filter was chosen to be 13 mm to reduce the effect from diffraction component of the inducing laser.
 |
IV.2 Arrival time distribution in four beam pulse combinations
To evaluate the number of FWM photons including signal photons using Eq.(2), we defined four trigger patterns on beam pulse combinations with two incident laser pulses: when two pulse lasers are incident (Signal pattern, S), when only the creation laser is incident (Creation pattern, C), when only the inducing laser is incident (Inducing pattern, I), and when no lasers are incident (Pedestal pattern, P). Searching data were accumulated by sequentially requiring sets of the four trigger pattens by setting the mechanical shutter for the inducing laser. Equation (2) was used to subtract background photons from individual beams, likely plasma-originating photons, and pedestal noises.
 |
In the previous searches SAPPHIRES00 ; SAPPHIRES01 we have applied the peak finding algorithm to time vs. voltage waveforms from the waveform digitizer. However, in this data analysis, we did not apply the peak finder to the waveforms on purpose. This is because of the higher background level due to increase of the laser intensities. Applying the finder introduces non-trivial biases when several peaks unfortunately partially overlap to each other. Since waveforms can store the falling edge information of analog signals from PMT, we simply added all waveforms per trigger pattern. Because the single photon equivalent charge is known in advance, we can count the number of photons from charge sums within the signal time window. Figure 4 shows arrival time distributions of observed photons normalized per shot each beam combination patterns at , where gas-aFWM photons are expected to be completely negligible from the known pressure scaling SAPPHIRES01 . The histograms in the upper left, upper right, lower left, and lower right show the number of observed photons in S, C, I, and P trigger pattern, respectively. Signal-like FWM photons are expected to arrive within the time interval subtended by the two red vertical lines.
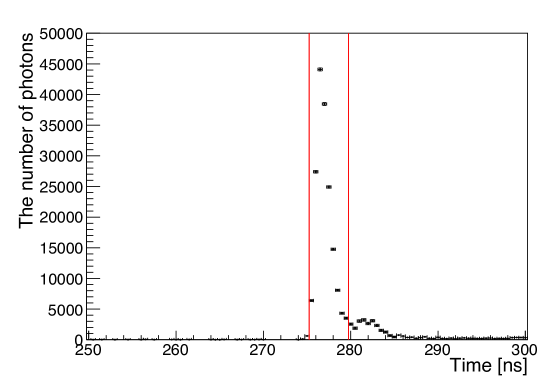 |
Figure 5 shows the arrival time distribution after subtraction using Eq.(2) with the total statistics of S-pattern. The observed FWM photons are possibly composed of signal photons and residual opt-aFWM photons. As we discuss in the following section, even if the eclipse filter was set at the proper position with the proper size, a finite amount of opt-aFWM photons could slightly contaminate. There seems to be a slow background component from plasma-originating FWM, which is also seen in the C-pattern histogram in Fig.4 due to focus by only the high-intensity Ti:Sapphire beam. Since plasma formation requires a finite time, it may causes some delay compared to the prompt emission from scattering via ALP exchanges. If charges in the formed plasma couple to the two laser photons, FWM photons may be generated with the formed plasma state. Although we need more elaboration to quantify this new background component, since the dominant part is located outside the signal timing window where the ALP exchange is expected to promptly response, we can treat this component as a new kind of background photons, which is left without being subtracted within the signal timing window.
V Investigation of the origin of signal-like FWM photons
From the pressure scaling obtained in the SAPPHIRES01 search SAPPHIRES01 , the pressure dependent FWM component, gas-aFWM, for the used pulse energies at the similar pressure value is expected to be too small to explain the observed FWM yield. Thus, there is a possibility that the observed FWM photons are indeed from the vacuum. However, we need caution. Although the eclipse filter is effective to suppress the dominant yield from opt-aFWM, the filter is not perfect because finite diffraction components of the inducing beam via apertures in the upstream may cause extension of the inducing field beyond the range of the including beam diameter on the surfaces of the optical elements. In order to judge whether the observed FWM photons are from the vacuum or optical elements, we can utilize a characteristic difference of FWM in the vacuum and in the optical elements when the two beam overlapping at the focal point is on purpose degraded. The FWM yield from the vacuum sharply depends on the beam overlapping factor at the focal point as we discuss in the following paragraphs, whereas the opt-aFWM is not so sensitive to the focal spot deviation. Since the wave vectors in diffraction of the inducing beam on the surface optical components have a diverging nature, some fraction of the diffraction components may always satisfy the phase matching condition to generate atomic FWM with the wave vectors of the creation beam on the surface even if the incident directions of the two beams are slightly different. Therefore, the beam direction dependence of the residual opt-aFWM is expected to be more gradual. In the following we have determined the origin of based on this expected feature.
From the particle physics point of view, the vFWM yield corresponds to the signal yield per pulse collision from stimulated resonant photon-photon scattering via ALP exchanges, , which is factorized as follows JHEP2020 ; SAPPHIRES00
| (4) |
and are the average numbers of photons in the creation and inducing beams, respectively. is an experimentally tuned space-time overlapping factor between the incident beams GHzMix , and is the interaction volume rate, not the interaction cross section JHEP2020 ; SAPPHIRES00 , specified in the units within [ ], which are expressed in terms of length and seconds .
Given a set of laser beam parameters , the number of ALP-originating signal photons, , as a function of mass and coupling is expressed as
| (5) |
where is a data acquisition time, is a repetition rate of pulsed beams, and is an efficiency of detecting signal photons. With respect to a set of values and an , a set of coupling can be estimated by numerically solving Eq.(5). The set of laser parameters is summarized in Table 1.
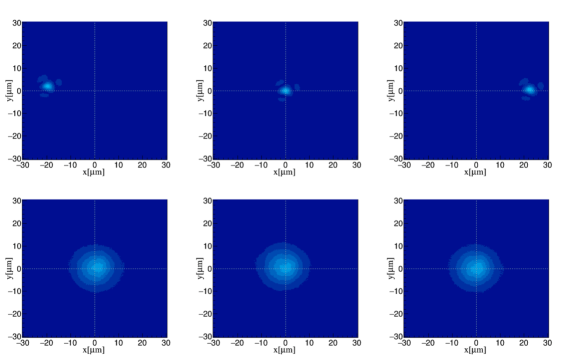 |
Figure 6 shows focal images of the creation (upper row) and inducing beams (lower row) at IP when the creation beam positions were horizontally shifted by from the best overlapping positions (center figures) with the beam waist Yariv of the inducing beam, . The focal points were horizontally shifted by using only DM1 in Fig.2, that is, OAP1 and OAP2 were kept fixed. In addition we further replaced OAP1 and OAP2 with a pair of flat mirrors in order to limit the source of FWM only to opt-aFWM because there is no focal point in this case, that is, we can completely exclude the possibility of vFWM. In order to adjust the pair of the flat mirrors, we used the far field monitor (FFM) in Fig.2 so that the two laser directions through the pair of flat mirrors can be almost identical to the laser directions when DM1 horizontally shifted positions of the focal points of the creation laser beam at IP.
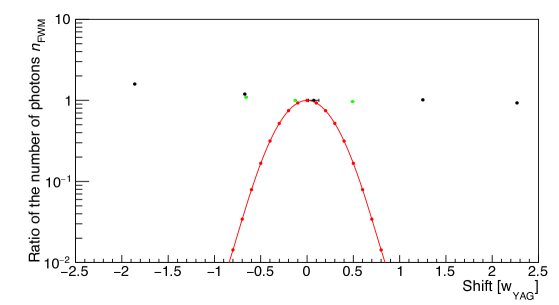 |
Figure 7 shows the comparison of focal-spot overlapping dependences between the theoretically expected yield via ALP-exchange with the ALP mass of 0.15 eV (red points) and observed as a function of horizontal focal positions of the creation beam in units of . The theoretical points are numerically calculated fixing and in Eq.(5) by additionally introducing spatial drifts of the focused creation beam to the space-time overlapping factor in Eq.(4) GHzMix based on the laser parameters in Tab.1. The black points are when OAP1 and OAP2 were used for focus and collimation, whereas green points are when the two OAPs were replaced with a pair of flat mirrors, by which we can guarantee that is composed of only opt-aFWM. All the data points are shown as the ratios normalized to the central points around zero in the individual cases. The theoretical prediction shows the steep drop even at 0.5 . In contrast, both OAP and flat mirror cases show the similar trend where no such steeply dropping behavior is seen. The asymmetric tendency in the two cases is understandable from the asymmetry of OAP geometry with respect to changes of the horizontal incident positions of the creation beam. Since the flat mirror case can completely exclude the possibility of vFWM from the focal point, we conclude that the observed FWM photons in this search is almost dominated by opt-aFWM.
| Parameter | Value |
|---|---|
| Creation pulse laser | |
| Centeral wavelength | 816 nm |
| Relative linewidth, | |
| Duration time of pulse, | 40 fs |
| Measured pulse energy per , | 29.7 mJ |
| Pulse energy fraction within 3 focal spot, | 0.6 |
| Effective pulse energy per within 3 focal spot | mJ |
| Effective number of creation photons, | photons |
| Beam diameter of pulse, | 36.5 mm |
| Polarization | linear (P-polarized state) |
| Inducing pulse laser | |
| Central wavelength, | 1064 nm |
| Relative linewidth, | |
| Duration time of pulse, | 9 ns |
| Measured pulse energy per , | mJ |
| Linewidth-based duration time of pulse, | ps |
| Pulse energy fraction within 3 focal spot, | 0.8 |
| Effective pulse energy per within 3 focal spot | J |
| Effective number of inducing photons, | photons |
| Beam diameter of pulse, | mm |
| Polarization | circular (left-handed state) |
| Focal length of off-axis parabolic mirror, | 279.1 mm |
| Single-photon detection efficiency, | 1.4 % |
| Efficiency of optical path from IP to PMT, | 12 % |
| Total number of shots in S-pattern, | shots |
| 519 |
VI Exclusion regions in ALP coupling-mass relations
From the investigation in the previous section, we can conclude that the contribution from is negligibly small and the observed FWM photons are dominated by opt-aFWM. We thus can calculate the exclusion regions in the coupling-mass relation based on the hypothesis that the background distribution is only from the opt-aFWM process. Because is obtained from subtractions between different trigger patterns whose baseline fluctuations are expected to individually follow Gaussian distributions, we can naturally assume that follows the Gaussian distribution as well.
A confidence level for excluding the null hypothesis that the observed is all from the opt-aFWM process is expressed as
| (6) |
where is the expected value of an estimator corresponding to , and is one standard deviation on the measurement of . We use the acceptance-uncorrected uncertainty for from the quadratic sum of all error components in the following result by multiplying the total statistics of 22,500 shots in S-pattern:
| (7) |
where we note that the number of photons were calculated from the measured charge sum divided by the single-photon-equivalent charge obtained from the independent calibration. The systematic error was evaluated from baseline fluctuations measured in the earlier time range than the signal time window defined by the two red lines in Fig. 5, which reflects the possibility of different pedestal distributions depending on the different time domains. For a confidence level of 95 %, with was used, where a one-sided upper limit by excluding above PDGstatistics was applied. In order to evaluate the upper limits on the coupling–mass relation, we numerically solve
| (8) |
where , and the overall efficiency , with being the optical path acceptance to the signal detector position and the single photon detection efficiency.
 |
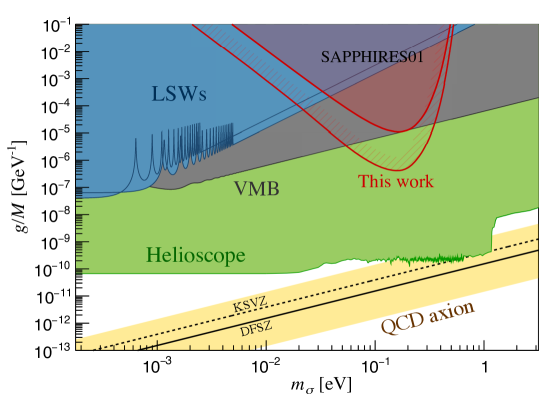 |
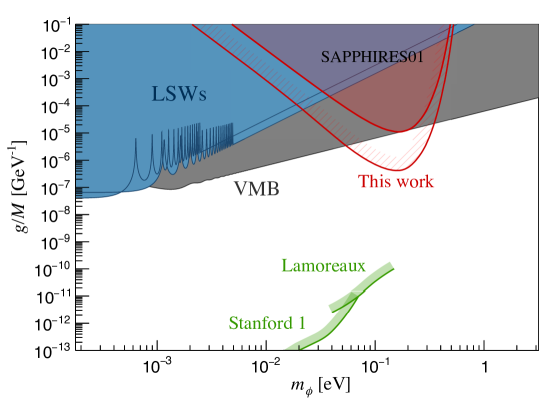
Figures 8 and 9 show the updated upper limits in the coupling–mass relations for scalar and pseudoscalar fields, respectively, at a 95 % confidence level. The red shaded areas are from this work, while the red filled areas are from previous searches SAPPHIRES01 . The ALPS alps and OSQAR osqar experiments are “Light Shining through Wall (LSW)” experiments and are filled with blue. The individual sinusoidal terms in the sensitivities from ALPS and OSQAR are simplified to 1 above and , respectively. The gray area is the region excluded by the vacuum magnetic birefringence (VMB) experiment (PVLAS pvlas ). In Fig. 8, the lines with green are excluded by the non-Newtonian force search (Stanford 1 Stanford1 ) and the Casimir force measurement (Lamoreaux Lamoreaux ). In Fig. 9, the green area is the region excluded by the helioscope experiment (CAST cast ). The yellow band is the region of the benchmark QCD axion model (KSVZ KSVZ ) with . The black dashed and solid lines are predicted by the KSVZ model with and the DFSZ DFSZ model with , respectively.
VII Conclusion
We have searched for sub-eV axion-like particles (ALPs) by focusing the creation field ( Ti:Sapphire laser) and the inducing field ( Nd:YAG laser) into the vacuum after combining them along the common optical axis. Due to the one order of magnitude higher intensity than the previous search SAPPHIRES01 , background atomic four-wave mixing (aFWM) became significant as expected from the cubic scaling of FWM with the laser intensity. In order to mitigate optical-element originating aFWM (opt-aFWM) photons in the photon counter, we have developed the specialized coronagraphy with the eclipse filter by utilizing the image intensifier camera. With respect to the residual signal-like FWM photons, we further have tested whether those photons originate from residual opt-aFWM or ALP exchanges. As a result of degrading degree of overlapping between focal spots of the two laser, we conclude that opt-aFWM photons dominate the residual FWM photons and no signal FWM is observed. We then have extended the exclusion region in the relation between ALP-photon coupling, , and the ALP mass , reaching the most sensitive point at for pseudoscalar ALPs. This result is currently the world record in this mass range among laboratory searches that are completely independent of any cosmological and astrophysical models.
Acknowledgments
The system was financially supported by the MEXT Quantum Leap Flagship Program (JPMXS0118070187) and the program for advanced research equipment platforms (JPMXS0450300521). Y. Kirita acknowledges support from the JST, the establishment of university fellowships for the creation of science technology innovation, Grant No. JPMJFS2129, and a Grant-in-Aid for JSPS fellows No. 22J13756 from the Ministry of Education, Culture, Sports, Science and Technology (MEXT) of Japan. K. Homma acknowledges the support of the Collaborative Research Program of the Institute for Chemical Research at Kyoto University (Grant Nos. 2018–83, 2019–72, 2020–85, 2021–88, 2022–101, 2023–101 and 2024–95) and Grants-in-Aid for Scientific Research Nos. 17H02897, 18H04354, 19K21880, and 21H04474 from the Ministry of Education, Culture, Sports, Science and Technology (MEXT) of Japan. The authors in ELI-NP acknowledge the support from the Romanian Government and the European Union through the European Regional Development Fund and the Competitiveness Operational Programme (No. 1/07.07.2016, COP, ID 1334), and also the support by Faza 3 (Partea II) a Proiectul Nucleu PN 23 21 01 05.
References
- (1) R. D. Peccei and H. R. Quinn, “CP Conservation in the Presence of Instantons”, Phys. Rev. Lett. 38, 1440-1443 (1977) doi:10.1103/PhysRevLett.38.1440.
- (2) R. D. Peccei and H. R. Quinn, “Constraints Imposed by CP Conservation in the Presence of Instantons”, Phys. Rev. D 16, 1791-1797 (1977) doi:10.1103/PhysRevD.16.1791.
- (3) S. Weinberg, “A New Light Boson?”, Phys. Rev. Lett. 40, 223-226 (1978) doi:10.1103/PhysRevLett.40.223.
- (4) F. Wilczek, “Problem of Strong and Invariance in the Presence of Instantons”, Phys. Rev. Lett. 40, 279-282 (1978) doi:10.1103/PhysRevLett.40.279.
- (5) J. Preskill, M. B. Wise and F. Wilczek, “Cosmology of the Invisible Axion”, Phys. Lett. B 120, 127-132 (1983) doi:10.1016/0370-2693(83)90637-8.
- (6) M. Dine and W. Fischler, “The Not So Harmless Axion”, Phys. Lett. B 120, 137-141 (1983) doi:10.1016/0370-2693(83)90639-1.
- (7) L. F. Abbott and P. Sikivie, Phys. Lett. B 120, 133-136 (1983) doi:10.1016/0370-2693(83)90638-X.
- (8) M. Gorghetto, E. Hardy and G. Villadoro, SciPost Phys. 10, no.2, 050 (2021) doi:10.21468/SciPostPhys.10.2.050 [arXiv:2007.04990 [hep-ph]].
- (9) Ryuji Daido et al., ”The ALP miracle revisited”, Journal of High Energy Physics, 02 (2018) 104, 16th February 2018.
- (10) K. Homma et al. [SAPPHIRES], JHEP 12, 108 (2021) doi:10.1007/JHEP12(2021)108 [arXiv:2105.01224 [hep-ex]].
- (11) Y. Kirita et al. [SAPPHIRES], “Search for sub-eV axion-like particles in a stimulated resonant photon-photon collider with two laser beams based on a novel method to discriminate pressure-independent components,” JHEP 10, 176 (2022) doi:10.1007/JHEP10(2022)176 [arXiv:2208.09880 [hep-ex]].
- (12) K. Homma and Y. Kirita, “Stimulated radar collider for probing gravitationally weak coupling pseudo Nambu-Goldstone bosons,” JHEP 09, 095 (2020) doi:10.1007/JHEP09(2020)095 [arXiv:1909.00983 [hep-ex]].
- (13) Amnon Yariv, Optical Electronics in Modern Communications Oxford University Press (1997).
- (14) See Appendix in K. Homma, Y. Kirita, T. Miyamaru, T. Hasada and A. Kodama, “Opening a meV mass window for Axion-like particles with a microwave-laser-mixed stimulated resonant photon collider,” [arXiv:2405.03577 [hep-ph]].
- (15) See Eq.(36.56) in J. Beringer et al. (Particle Data Group), Phys. Rev. D 86, 010001 (2012).
- (16) K. Ehret et al. (ALPS), Phys. Lett. B 689, 149 (2010).
- (17) R. Ballou et al. (OSQAR), Phys. Rev. D 92, 9, 092002 (2015).
- (18) A. Ejlli et al., Physics Reports 871 (2020) 1–74.
- (19) J. Chiaverini et al., Phys. Rev. Lett. 90, 151101 (2003).
- (20) S. K. Lamoreaux, Phys. Rev. Lett. 78, 5 (1997); 81, 5475 (1998).
- (21) E. Arik et al. (CAST), J. Cosmol. Astropart. Phys. 02, 008 (2009); M. Arik et al. (CAST), Phys. Rev. Lett. 107, 261302 (2011); M. Arik et al. (CAST), Phys. Rev. Lett. 112, 9, 091302 (2014); V. Anastassopoulos et al. (CAST), Nature Phys. 13, 584 (2017).
- (22) J. E. Kim, Phys. Rev. Lett. 43, 103 (1979); M. Shifman, A. Vainshtein, and V. Zakharov, Nucl. Phys. B166, 493 (1980).
- (23) M. Dine, W. Fischler, and M. Srednicki, Phys. Lett. 104B, 199 (1981); A. Zhitnitskii, Sov. J. Nucl. Phys. 31, 260 (1980).