Adoption of smartphones among older adults and the role of perceived threat of cyberattacks
Abstract.
Adoption of smartphones by older adults (i.e., 65+ years old) is poorly understood, especially in relation to cybersecurity and cyberthreats. In this study, we focus on the perceived threat of cyberattacks as a potential barrier to smartphone adoption and use among older adults. The study also aims at investigating the differences between users and non-users of smartphones. We conducted a quantitative cross-sectional survey of older adults in Slovenia (). The results of covariance-based structural equation modeling indicate consistent support for the associations of intention to use (ItU) with perceived usefulness (PU), subjective norm (SN) and attitude toward use (AtU), the association between ease of use (EoU) and PU, the association between hedonic motivation (HM) and AtU, and the association between smartphone technology anxiety (STA) and fear of use (FoU). Even though the negative association between perceived threat (PT) and ItU was significant in the full sample, the non-user and the not aware subsamples, its role in adoption of smartphones among older adults remains puzzling. We uncovered significant positive associations between PT and AtU (except in the not aware subsample), and PT and PU which we could not fully explain in our study. The results of our study provide some insights on how campaigns promoting adoption of smartphones among older adults, workshops, training and informal teaching might be improved.
1. Introduction
Older adults (i.e., people aged 65 or older) represent a population that is growing rapidly worldwide. In EU countries, this number is increasing from 90.5 million at the start of 2019 to a projected 129.8 million in 2050 (Eurostat, 2020). With the global increase in the aging population, older adults are progressively using more and more different technologies, especially smartphones (Mihelič et al., 2022), driven by the desire to improve their quality of life and participate in various activities, such as entertainment, healthcare and social interaction (Huang, 2023b; Yeh et al., 2024). In the US, for example, over three quarters of older adults (76%) own the smartphone (Bazen, 2023). Hence, it is not surprising that non-use of smartphones in this population may lead to digital exclusion and unequal treatment (Zhu and Cheng, 2024).
This high rate of smartphone use by older adults poses a serious and subtle problem as it exposes this population to various cyberthreats which is particularly dangerous given the increasing number of older adults and the proportion of smartphone users in this population (McCosker et al., 2018; Mihelič and Žvanut, 2022; Tsatsou, 2021). Older adults are also more vulnerable to cyberthreats due to declining cognitive abilities associated with aging (Mihelič and Žvanut, 2022). Additionally, older adults face data and security issues with 49% of mobile applications designed for them lacking any security or data protection measures (Portenhauser et al., 2021). Both users and non-users of smartphones and other smart devices among older adults often view inadequate security and data protection measures as a significant obstacle to their adoption and use (Harris et al., 2022; Kim, 2021; Kruse et al., 2017; LaMonica et al., 2021; Rasche et al., 2018). They also lack awareness of information leakage and telecom fraud (Zhu et al., 2023). In the literature, there is a plethora of studies related to the adoption and use of smartphones by older adults. However, only a few studies investigate the issue of cybersecurity. There is a noticeable gap in the literature regarding the consideration of security concerns, particularly the perceived threat of cyberattacks, as a factor influencing the adoption and use of smartphones among older adults. This gap is significant because older adults’ perceptions of cyberthreats might significantly influence their willingness to adopt and use smartphones.
This study investigates the perceived threat of cyberattacks as a potential barrier to smartphone adoption and use among older adults. This study has three key objectives: 1) to study adoption of smartphones among older adults from new perspectives, 2) to study the role of perceived threat of cyber attacks in adoption of smartphones among older adults, and 3) to study the differences between users and non-users of smartphones. The study thus aims to provide a more comprehensive understanding of the factors that affect the adoption and use of smartphones in this demographic by considering not only the well-studied barriers, such as technology anxiety, but also the element of security concerns. The focus of this study is driven by the need to understand how concerns related to cybersecurity influence technology adoption among older adults. Our study also investigates the differences between older adults who use smartphones and those who do not, as well as the differences between those who are aware of smartphones and those who are not. These comparisons provide insights into the varying attitudes, behaviors, and challenges faced by older adults in the context of digital technology adoption.
2. Theoretical background
2.1. Technology adoption
Our study strongly leans on the technology acceptance model (TAM) (Davis et al., 1989; Venkatesh and Davis, 1996) as the baseline research model. TAM aims to identify the key factors that influence new technology acceptance and helps to predict user behavior for different technologies and different user groups. Originally, TAM consisted of four key constructs: perceived usefulness (PU), ease of use (EoU), attitude toward use (AtU), and intention to use (ItU) (Davis et al., 1989). PU and EoU are determinants of AtU, and AtU and PU are determinants of ItU (Davis et al., 1989). TAM was later revised. Excluding AtU resulted in a more parsimonious TAM in which ItU is determined by PU and EoU (Davis et al., 1989; Lenz et al., 2023).
To overcome the limitations of the original and the revised TAM and to better understand the determinants of technology acceptance and use, Venkatesh and Davis (Venkatesh and Davis, 2000) developed TAM2 which provides a more sophisticated framework that takes into account the complexity of technology adoption in different contexts by providing a more comprehensive understanding of the factors that influence technology acceptance. Notably, subjective norm (SN) was introduced into TAM2 even though it was purposefully excluded from TAM (Venkatesh and Davis, 2000). SN is included in TAM2 as a predictor of both PU and ItU (Venkatesh and Davis, 2000). Additionally, three more predictors of PU were introduced in TAM2: image, job relevance, and result demonstrability (Venkatesh and Davis, 2000).
2.2. Technology adoption by older adults
Technology adoption by older adults is well studied. It should be noted that the literature defines varying age limits for older adults, the lower bound ranging from 50 to 65 years old. In this study we focus on older adults that are 65 or more years old. Nevertheless, we also reviewed the literature that defines older adults more broadly to cover a greater diversity of the published literature. Several theoretical models were used in the studies on technology acceptance, such as TAM (Conci et al., 2009; Guner and Acarturk, 2020; Huang et al., 2023; Huang, 2023b; Nayak et al., 2010; Ren and Klausen, 2024; Yeh et al., 2024; Zhu and Cheng, 2024), TAM3 (Domingos et al., 2022), the unified theory of acceptance and use of technology (UTAUT) (Aranha et al., 2024; Yang et al., 2023), UTAUT2 (Huang, 2023a), and the senior TAM (STAM) (Chen and Chan, 2014; Revollo Sarmiento et al., 2024). These studies focused on adoption of different technologies and services, such as generic information and communication technology (ICT) (Guner and Acarturk, 2020), the internet (Nayak et al., 2010) but also mobile phones (Conci et al., 2009; Revollo Sarmiento et al., 2024), smartphones (Huang et al., 2023; Huang, 2023b; Ren and Klausen, 2024; Yeh et al., 2024; Zhu and Cheng, 2024; Yang et al., 2023), mobile applications and services (Aranha et al., 2024; Huang, 2023a), smart devices (Domingos et al., 2022), and gerontechnology (Chen and Chan, 2014).
The published literature identifies several relevant constructs as direct predictors of ItU technology by older adults. TAM constructs that have been found to be directly associated with ItU are PU (Conci et al., 2009; Huang, 2023b; Huang et al., 2023; Revollo Sarmiento et al., 2024; Yeh et al., 2024) and its UTAUT alternative performance expectancy (Aranha et al., 2024; Huang, 2023a; Yang et al., 2023), EoU (Conci et al., 2009; Huang, 2023b; Jarvis et al., 2020; Revollo Sarmiento et al., 2024) and its UTAUT alternative effort expectancy (Aranha et al., 2024; Huang, 2023a; Yang et al., 2023), and SN (Huang, 2023b) and its UTAUT alternative social influence (Conci et al., 2009; Huang, 2023a; Yang et al., 2023). Although AtU was excluded from the revised TAM and its later versions, it was re-introduced in several studies among older adults (Chen et al., 2021; Guner and Acarturk, 2020; Huang et al., 2023; Jarvis et al., 2020; Nayak et al., 2010; Ren and Klausen, 2024; Revollo Sarmiento et al., 2024; Yeh et al., 2024; Zhu and Cheng, 2024). Notably, some studies called for including both PU and AtU in studies among older adults (Yeh et al., 2024). The results however appear inconsistent since some studies found none (Chen and Chan, 2014; Revollo Sarmiento et al., 2024), either PU (Revollo Sarmiento et al., 2024) or AtU (Guner and Acarturk, 2020; Nayak et al., 2010; Revollo Sarmiento et al., 2024), or both being significant (Huang et al., 2023; Nayak et al., 2010; Yeh et al., 2024) which raises some questions about the mechanism of technology adoption in this population.
2.3. The role of cybersecurity in technology adoption
Adoption constructs can predict ItU smartphones in the older adult population relatively well (Cerda Díez et al., 2023; Yeh et al., 2024). Nevertheless, some studies suggest that cybersecurity plays an important role in the adoption of ICT (Conci et al., 2009; Lai, 2016; Mihelič and Žvanut, 2022). This may be exacerbated by various issues, such as mobile apps for older adults with serious security flaws (Portenhauser et al., 2021).
Several constructs related to cybersecurity have been associated with adoption or actual use of ICT in the literature: perceived safety (Conci et al., 2009), perceived security (Lai, 2016), perceived risk (Jena, 2023; Zhao et al., 2018), and perceived trust (Jena, 2023; Murko and Vrhovec, 2019). Nevertheless, the protection motivation theory (PMT) remains one of the key theories in the cybersecurity domain (Vrhovec et al., 2023). In the technology adoption domain, non-adoption of a technology can be considered as a protection measure which is conceptually in line with the technology threat avoidance theory (TTAT) (Liang and Xue, 2010). PMT includes two processes, namely threat and coping appraisal. According to PMT, individuals assess their vulnerability to a threat and its severity during threat appraisal which in turn influences their motivation to engage in protective actions (Burns et al., 2017; Huang, 2023a; Maddux and Rogers, 1983). There is support in literature for the mediating role of perceived threat (PT) in associations of protection motivation with perceived vulnerability and perceived severity (Liang and Xue, 2010; Vrhovec and Mihelič, 2021; Fujs et al., 2019). Research suggests that PT may be a more accurate predictor of protection motivation than fear as individuals tend to rely on cognitive strategies rather than emotions when coping with threats (Johnston et al., 2019; Vrhovec and Mihelič, 2021). In recent PMT studies, PT has been positively associated with both fear and protection motivation (Vrhovec and Mihelič, 2021), particularly in predicting older adults’ fear of use of tablet computers (Mihelič et al., 2023). The literature shows mixed support for the role of cybersecurity in technology adoption. For example, perceived risk was found to be both significant (Jena, 2023; Zhao et al., 2018) and non-significant (Talukder et al., 2021; Lutolli and Vrhovec, 2019) in the published literature. Similarly, perceived privacy has rarely been associated with adoption which can be attributed to the privacy paradox (Aranha et al., 2024; Lenz et al., 2023) – the trade-off between losing a certain degree of privacy due to using a certain technology, and gaining some benefits from using it (Lenz et al., 2023). Nevertheless, information sensitivity seems to play a moderating role in technology adoption (Jelovčan et al., 2020). While perceived trust has been associated with adoption on technology (Talukder et al., 2021; Murko and Vrhovec, 2019), there is little support for a direct association between PT and ItU in the literature (Murko and Vrhovec, 2019).
Only a few studies focused on older adults that were 65 or more years old which is the most widely accepted lower boundary for the age of older adults (Aranha et al., 2024; Conci et al., 2009; Frishammar et al., 2023; Talukder et al., 2021; Vrhovec et al., 2024). A few more studies focused on older adults that were 60 or more years old (e.g., (Jena, 2023)) while the rest mostly focus on the general population (e.g., (Lai, 2016; Murko and Vrhovec, 2019)). These insights indicate that the relationship between technology adoption and cybersecurity constructs remains unclear, especially in the older adult population.
3. Research model and hypotheses development
The developed research model is presented in Fig. 1.
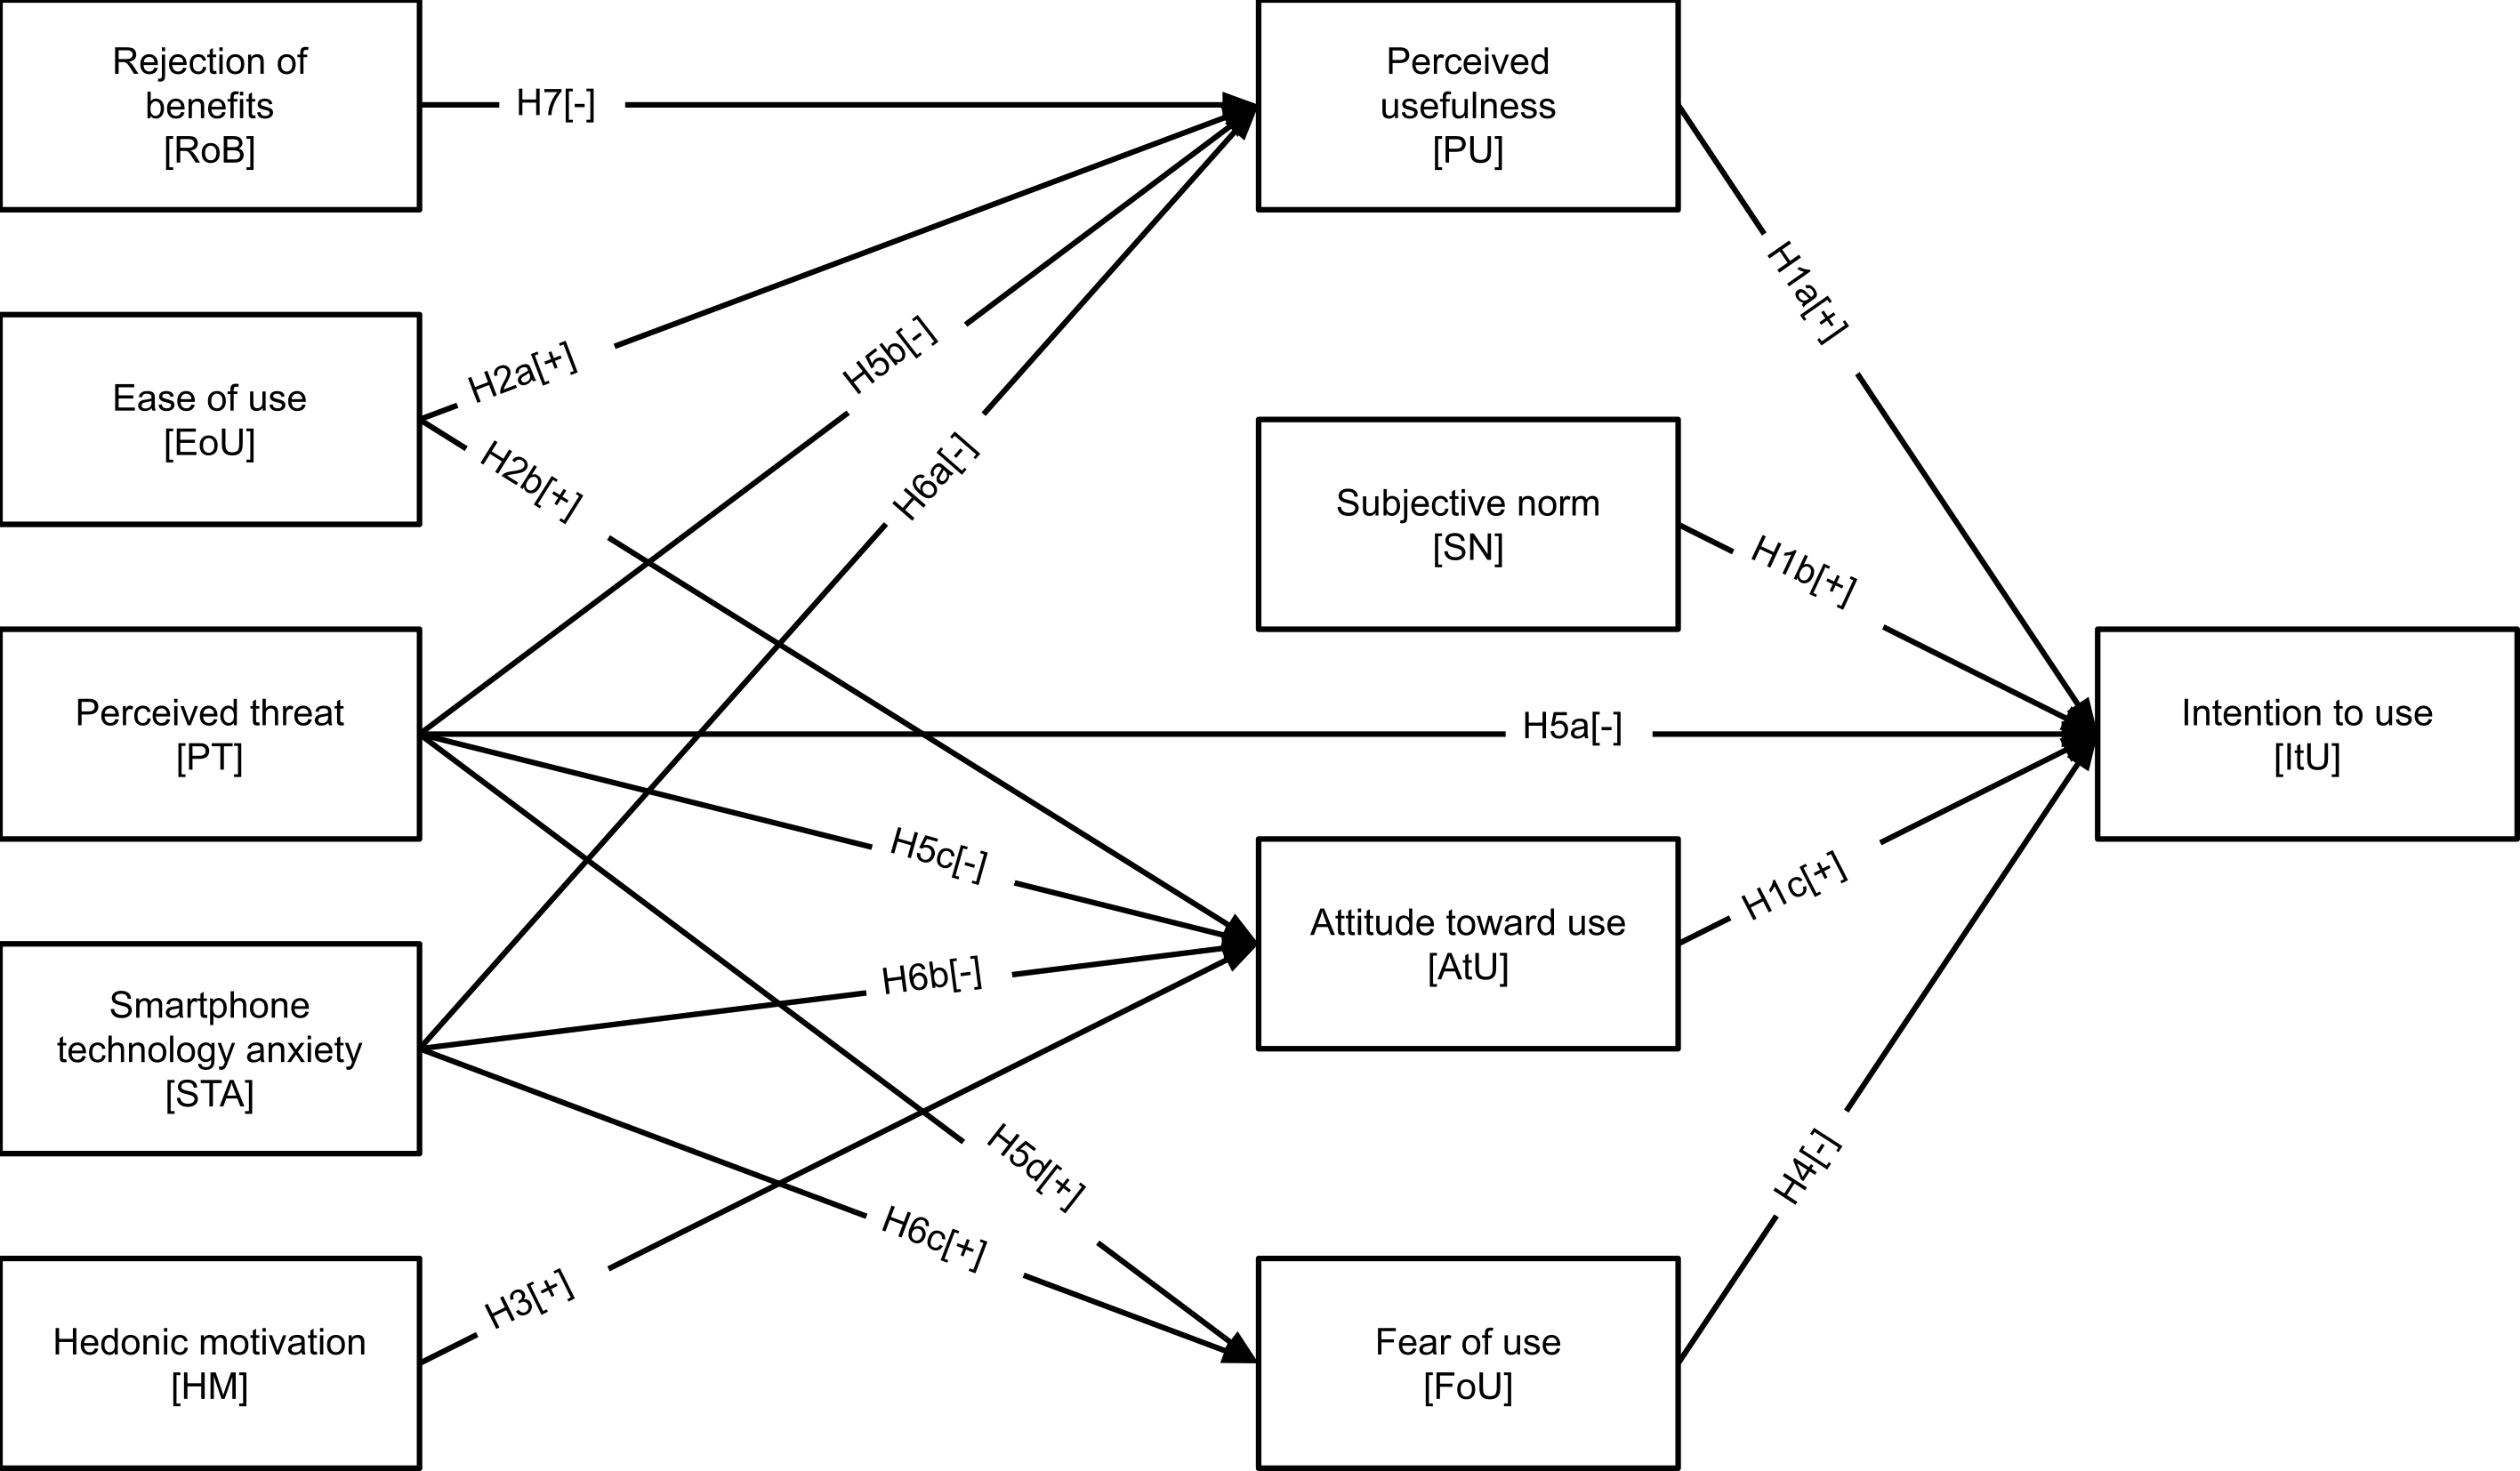
According to TAM2, PU, SN and EoU are directly associated with ItU (Venkatesh and Davis, 2000). The association between PU and ItU was confirmed among older adults in several studies, such as (Conci et al., 2009; Huang, 2023b; Huang et al., 2023; Mihelič et al., 2023; Yeh et al., 2024). SN has also been found to have an association with ItU among the older adult population (Huang, 2023b). Studies on older adults also indicate an association between AtU and ItU (Chen et al., 2021; Guner and Acarturk, 2020; Huang et al., 2023; Jarvis et al., 2020; Yeh et al., 2024; Zhu and Cheng, 2024). Even though AtU was excluded in favor of PU from the revised TAM and later versions (Davis et al., 1989; Lenz et al., 2023), there is some support for including both AtU and PU as predictors of ItU among older adults (Yeh et al., 2024). Accordingly, we pose the following group of hypotheses:
-
H1a:
PU is positively associated with ItU.
-
H1b:
SN is positively associated with ItU.
-
H1c:
AtU is positively associated with ItU.
The original TAM predicted associations of EoU with PU and AtU (Davis et al., 1989). While later versions of TAM, such as the revised TAM (Davis et al., 1989) and TAM2 (Venkatesh and Davis, 2000), exclude AtU from the model and directly associate EoU with ItU in addition to its association with PU, the results among older adults show poor support for these refinements. For example, there is mixed support for the direct association between EoU and ItU (significant (Conci et al., 2009; Huang, 2023b; Revollo Sarmiento et al., 2024), non-significant (Chen and Chan, 2014; Guner and Acarturk, 2020; Huang et al., 2023; Nayak et al., 2010; Revollo Sarmiento et al., 2024)). There is also support in the published literature for including AtU in research models when studying older adults (Yeh et al., 2024), and associating it with EoU (Chen and Chan, 2014; Guner and Acarturk, 2020; Huang et al., 2023; Jarvis et al., 2020; Yeh et al., 2024). There are however several studies supporting the association between EoU and PU as predicted by all versions of TAM (Chen and Chan, 2014; Conci et al., 2009; Guner and Acarturk, 2020; Huang, 2023b; Huang et al., 2023; Jarvis et al., 2020; Yeh et al., 2024; Zhu and Cheng, 2024). Therefore, we develop the following set of hypotheses:
-
H2a:
EoU is positively associated with PU.
-
H2b:
EoU is positively associated with AtU.
UTAUT2 introduced hedonic motivation (HM) as a predictor of ItU (Venkatesh et al., 2012; Lenz et al., 2023). HM is defined as the pleasure or fun stemming from using a technology, and is closely related to other constructs, such as enjoyment (Venkatesh et al., 2012) and playfulness (Huang et al., 2023). There is poor support for a direct association between HM and ItU for older adults (Huang, 2023a). Enjoyment has been associated with EoU and PU in studies on older adults (Conci et al., 2009). Similarly, playfulness has been associated with PU but also AtU (Huang et al., 2023). We assume that HM primarily shapes someone’s AtU hence we hypothesize:
-
H3:
HM is positively associated with AtU.
Adoption of smart devices among older adults may be hindered by their fear that something might go wrong while using them (Mihelič et al., 2023). There are very few studies on the role of FoU in adoption of technology, especially among older adults (Mihelič et al., 2023). Therefore, we hypothesize:
-
H4:
FoU is negatively associated with ItU.
PT has been directly associated with ItU (Liang and Xue, 2010; Fujs et al., 2019; Vrhovec and Mihelič, 2021; Burns et al., 2017) as well as fear (Vrhovec and Mihelič, 2021; Burns et al., 2017; Vrhovec et al., 2023). Even though fear primarily entails the fear induced by a certain threat, such as cyberattacks, PT may induce a more specific kind of fear, namely FoU. Studies among older adults indicate support for this association (Mihelič et al., 2023). PT has also been indirectly associated with AtU through fear as a mediator (Vrhovec et al., 2023). These findings do not exclude a direct association between PT and AtU. Older adults may have a poorer AtU of smartphones if they perceive that they would be vulnerable to the threat of cyberattacks. PT may be similarly associated with PU since older adults may deem smartphones less useful if their use would make them prone to cyberattacks. Based on these considerations, we pose the following set of hypotheses:
-
H5a:
PT is negatively associated with ItU.
-
H5b:
PT is negatively associated with PU.
-
H5c:
PT is negatively associated with AtU.
-
H5d:
PT is positively associated with FoU.
STA has been associated with ItU in studies among older adults (Chen and Chan, 2014; Huang, 2023b, a) even though the association is not always significant (e.g., (Chen et al., 2021; Ellis et al., 2021). We assume that the association between STA and ItU is indirect through AtU and PU. There is some support in existing literature for both associations with AtU (Chen et al., 2021) and PU (Huang, 2023b; Zhu and Cheng, 2024). Additionally, studies indicate that STA is associated with FoU (Mihelič et al., 2023). Thus, we develop the following set of hypotheses:
-
H6a:
STA is negatively associated with PU.
-
H6b:
STA is negatively associated with AtU.
-
H6c:
STA is positively associated with FoU.
RoB appears to be relevant for a noticeable share of older adults however it has been rarely studied in the literature (Mihelič et al., 2023). By assuming that older adults who purposefully reject the benefits of smartphone use also perceive smartphones as less useful, we posit the final hypothesis:
-
H7:
RoB is negatively associated with PU.
4. Research methodology
4.1. Research design
We employed a cross-sectional research design to study the hypothesized associations. The survey was conducted among older adults (i.e., 65 or more years old) in Slovenia to determine factors associated with adoption to use smartphones (ItU), PU, AtU, and FoU. This research design also enabled us to determine differences between users and non-users of smartphones. The questionnaire was distributed in Slovenian which is the primary language of the studied population.
4.2. Ethical considerations
This study involved human participants. Therefore, the study proposal was submitted into consideration to an institutional review board. The study proposal was deemed as ethically acceptable and in compliance with the Code of Ethics and Integrity for Researchers at the University of Maribor by the Research Ethics Committee at the Faculty of Criminal Justice and Security at the University of Maribor on 27 February 2023 [2702A-2023]. Written informed consent was obtained from the participants.
4.3. Measurement instrument
Table 1 presents the operational definitions of measured constructs. Most items were adapted to the context of our study from previously validated research. The three items for ItU were adapted from (Vrhovec et al., 2023), (Li et al., 2019) and (Pan and Jordan-Marsh, 2010) each. Two items for PU were adapted from (Chen and Chan, 2014), and the third one from (Zhu and Cheng, 2024). Two items for SN were adapted from (Macedo, 2017), one item from (Li et al., 2019), and one item was additionally developed for this study. One item for AtU was adapted from (Vrhovec et al., 2023), and two items from (Chen et al., 2021). Three items for EoU were adapted from (Macedo, 2017), and a fourth was additionally developed for this study. Items for HM were adapted from (Macedo, 2017). Two items for FoU were adapted from (Vrhovec et al., 2023), and a third one from (Moody et al., 2018). Two items for PT were adapted from (Vrhovec et al., 2023), and a third one from (Liang and Xue, 2010). Items for STA were adapted from (Ellis et al., 2021) while items for RoB were adapted from (Moody et al., 2018). All items were measured on a 5-point Likert item scale from 1 strongly disagree to 5 strongly agree.
| Theoretical construct | Operational definition |
|---|---|
| Intention to use [ItU] | The level of individual’s motivation to use or continue to use a smartphone. |
| Perceived usefulness [PU] | The degree to which an individual believes that using a smartphone will enhance their daily activities. |
| Subjective norm [SN] | The perception of social approval from important others regarding the use of a smartphone. |
| Attitude toward use [AtU] | An individual’s positive or negative feelings about using smartphones. |
| Ease of use [EoU] | The degree to which an individual perceives that using a smartphone is free from effort. |
| Hedonic motivation [HM] | Fun or pleasure derived from using a smartphone. |
| Fear of use [FoU] | The level of an individual’s fear of using smartphones. |
| Perceived threat [PT] | The perceived extent of threats to the individual posed by cyberattacks. |
| Smartphone technology anxiety [STA] | The level of an individual’s anxiety related to the use of smartphones. |
| Rejection of benefits [RoB] | The degree to which an individual rejects the benefits of using a smartphone. |
We measured the use of smartphones with the question Are you using a smartphone? on a 3-point scale: Yes (Use), No, but I have one (Do not use), and No, and I don’t have one (Do not have). We measured awareness of smartphones with the question Before taking this survey, how aware were you of smartphones? on a 4-point scale: I am very familiar with smartphones and what they are (Very familiar with smartphones), I have heard about smartphones previously and am somewhat familiar with them (Somewhat familiar with smartphones), I have heard mention of smartphones before but am largely unfamiliar with them (Largely unfamiliar with smartphones), and I was not aware of smartphones before today (Not aware of smartphones). This question was adapted from (Vrhovec and Markelj, 2024).
4.4. Data collection
We collected data from 2 Mar 2023 to 19 Apr 2023. Respondents were recruited by students who were instructed to invite their grandparents, neighbors, acquaintances and random individuals from their hometowns to take part in the study. They were also instructed to help respondents with taking the survey if needed which involved making sure that the respondents understood the details about the survey that were provided on the survey introduction page, and the core concepts found in the survey (notably, smartphones and cyberattacks). The students were also trained in how to determine the most appropriate answer in case the respondents had trouble choosing an answer (e.g., agreement with a sentence on a 5-point scale). Each student recruited between one and 16 respondents. Students received a minor bonus in a course for their efforts.
We collected a total of 568 responses. After excluding respondents less than 65 years old, with missing or unrealistically high age (e.g., 194 years old), responses with over 10 percent missing values, and responses indicating respondent non-engagement, we were left with 535 useful responses which were used in further analysis. Sample characteristics are presented in Table 2.
| Frequency | Percent | Population | |
|---|---|---|---|
| Gender | |||
| Female | 319 | 59.6% | 56.4% |
| Male | 216 | 40.4% | 43.6% |
| Age | |||
| 65-69 | 206 | 38.5% | 30.5% |
| 70-74 | 129 | 24.1% | 25.8% |
| 75-79 | 90 | 16.8% | 17.2% |
| 80-84 | 62 | 11.6% | 13.9% |
| 85+ | 48 | 9.0% | 12.6% |
| Formal education | |||
| Finished high school or less | 349 | 65.2% | 84.7% |
| Achieved Bachelor’s degree | 124 | 23.2% | 11.2% |
| Achieved Master’s degree | 46 | 8.6% | 3.5% |
| Achieved PhD degree | 15 | 2.8% | 0.7% |
| N/A | 1 | 0.2% | |
| Living environment | |||
| Urban | 259 | 48.4% | |
| Rural | 276 | 51.6% | |
| Smartphone use | |||
| Use | 313 | 58.8% | |
| Do not use | 74 | 13.8% | |
| Do not have | 148 | 27.7% | |
| Awareness of smartphones | |||
| Very familiar with smartphones | 174 | 32.5% | |
| Somewhat familiar with smartphones | 192 | 35.9% | |
| Largely unfamiliar with smartphones | 156 | 29.2% | |
| Not aware of smartphones | 13 | 2.4% |
Note: Demographic characteristics of the Slovenian older adult population in 2023 according to the Statistical Office of the Republic of Slovenia (Statistical Office of the Republic of Slovenia, 2024).
When comparing the demographic characteristics of our sample with the population (Statistical Office of the Republic of Slovenia, 2024), we can see that it fits fairly well the population gender and age. Males are slightly overrepresented in our sample at the expense of females. Older adults 65-69 years of age are a tad overrepresented while older adults 85 years of age or older are slightly underrepresented. Older adults with the lowest levels of formal education are most underrepresented in our sample. This may be due to the recruiting strategy since students primarily recruited family members who may had a higher education than the population of older adults in Slovenia. When excluding older adults with finished high school or less, the shares of respondents who achieved Bachelor’s degree (67.0%), achieved Master’s degree (24.9%), and achieved PhD degree (8.1%), are more comparable to the population of older adults in Slovenia (72.9%, 22.6%, and 4.5%, respectively). Older adults who achieved Bachelor’s degree are slightly underrepresented, while older adults who achieved PhD degree are overrepresented. Overall, the respondents in our sample seem to have higher formal education than the population of older adults in Slovenia.
4.5. Data analysis
We used covariance-based structural equation modeling (CB-SEM) to analyze the data. Data was analyzed with R version 4.4.1 with packages lavaan version 0.6-18 and semTools version 0.5-6. Missing values (0.16 percent) were imputed with medians before analyzing the data with CB-SEM. We evaluated whether the data fit the measurement and structural models well with a set of model fit measures. We used comparative fit index (CFI), standardized root mean square residual (SRMR), root mean square error of approximation (RMSEA). CFI values above the 0.95 threshold were considered excellent, and values above the 0.90 threshold were considered acceptable. SRMR values below the 0.05 threshold were considered excellent, and values below the 0.08 threshold were deemed acceptable. RMSEA values below the 0.06 threshold were deemed excellent, and values below the 0.10 threshold were considered acceptable.
Before testing the hypothesized associations, we conducted a confirmatory factor analysis (CFA) to validate the measurement instrument. We assessed the reliability of the measurement instrument with composite reliability (CR) and Cronbach’s alpha (CA) coefficients. Values above the threshold value of 0.80 were considered excellent while values above the threshold value of 0.70 were considered acceptable. Convergent validity was assessed with average variance extracted (AVE). Values above the threshold value of 0.50 were considered acceptable. Additionally, factor loadings above the 0.50 threshold provide further support for convergent validity. Discriminant validity was assessed with heterotrait-monotrait ratio of correlations (HTMT) analysis. Values below the conservative 0.85 threshold are deemed acceptable. For conceptually similar theoretical constructs, values below the 0.90 threshold are considered acceptable.
After establishing adequate validity and reliability of the measurement instrument, we developed a structural model for testing the hypothesized associations. We calculated effect sizes for all hypothesized associations. To calculate effect sizes without changing the structural model, we calculated changes directly from the covariance matrix (Hayes, 2021). Effect sizes above the 0.02, 0.15 and 0.35 thresholds were considered small, medium and large, respectively. The structural model was first applied to the full sample to test the hypothesized associations. Next, we split the sample into two subsamples, namely users and non-users of smartphones, and applied the structural model to both. To achieve this, we created two groups according to the use of smartphones. In the user group, we included respondents who were using smartphones. In the non-user group, we included respondents who either did not have a smartphone or had a smartphone but did not use it. This enabled us to compare differences in effect sizes and between users and non-users of smartphones. Finally, we split the sample according to the awareness of smartphones. We created two groups similar to (Vrhovec and Markelj, 2024) to improve the reliability of this single-item construct and the interpretability of the results. In the aware group, we included respondents who were at least somewhat familiar with smartphones. In the not aware group, we included respondents who were largely unfamiliar with smartphones or were not aware of smartphones before taking the survey. This enabled us to compare differences in effect sizes and between respondents who were aware of smartphones and those who were not.
5. Results
5.1. Instrument validation
Model fit indices indicate that the measurement model fits the data well (, , , , , ). Measures for assessing validity and reliability of the measurement instrument are presented in Table 3.
| Construct | CA | CR | AVE | 1 | 2 | 3 | 4 | 5 | 6 | 7 | 8 | 9 |
|---|---|---|---|---|---|---|---|---|---|---|---|---|
| 1: SN | 0.912 | 0.913 | 0.725 | |||||||||
| 2: PT | 0.888 | 0.895 | 0.743 | 0.119 | ||||||||
| 3: HM | 0.929 | 0.930 | 0.817 | 0.564 | 0.141 | |||||||
| 4: EoU | 0.940 | 0.941 | 0.799 | 0.498 | 0.090 | 0.698 | ||||||
| 5: STA | 0.872 | 0.872 | 0.695 | 0.383 | 0.106 | 0.504 | 0.533 | |||||
| 6: PU | 0.914 | 0.914 | 0.781 | 0.622 | 0.212 | 0.723 | 0.757 | 0.461 | ||||
| 7: ItU | 0.971 | 0.973 | 0.922 | 0.649 | 0.046 | 0.693 | 0.736 | 0.561 | 0.819 | |||
| 8: FoU | 0.885 | 0.888 | 0.728 | 0.438 | 0.087 | 0.533 | 0.573 | 0.753 | 0.514 | 0.606 | ||
| 9: RoB | 0.893 | 0.894 | 0.738 | 0.237 | 0.175 | 0.417 | 0.353 | 0.372 | 0.500 | 0.378 | 0.304 | |
| 10: AtU | 0.929 | 0.930 | 0.815 | 0.579 | 0.183 | 0.734 | 0.636 | 0.498 | 0.833 | 0.740 | 0.545 | 0.426 |
Notes: CA – Cronbach’s alpha, CR – composite reliability, AVE – average variance extracted, HTMT – heterotrait-monotrait ratio of correlations; SN – subjective norm, PT – perceived threat, HM – hedonic motivation, EoU – ease of use, STA – smartphone technology anxiety, PU – perceived usefulness, ItU – intention to use, FoU – fear of use, RoB – rejection of benefits, AtU – attitude toward use.
CA and CR values ranged from 0.872 to 0.971 and from 0.872 to 0.973, respectively, suggesting excellent reliability. AVE ranged from 0.695 to 0.922 indicating adequate convergent validity. Also, item loadings ranged from 0.737 to 0.983 providing further support for this. Questionnaire items with loadings are presented in Table 4. HTMT analysis suggests that discriminant validity was adequate with values ranging from 0.046 to 0.833.
| Construct | Loading | Item | Source |
|---|---|---|---|
| SN | 0.843 | SN1. People who are important to me think that I should use a smartphone. | (Macedo, 2017) |
| 0.850 | SN2. People whose opinions I value prefer that I use a smartphone. | (Macedo, 2017) | |
| 0.863 | SN3. My family and friends [support / would support] my decision to use a smartphone. | (Li et al., 2019) | |
| 0.853 | SN4. People who care for me [support / would support] my decision to use a smartphone. | Self-developed | |
| PT | 0.737 | PT1. My smartphone [is / would be] threatened by cyberattacks. | (Vrhovec et al., 2023) |
| 0.911 | PT2. Cyberattacks [are / would be] a danger to my smartphone. | (Vrhovec et al., 2023) | |
| 0.914 | PT3. Cyberattacks [pose / would pose] a threat to my smartphone. | (Liang and Xue, 2010) | |
| HM | 0.920 | HM1. Using a smartphone [is / would be] fun. | (Macedo, 2017) |
| 0.889 | HM2. Using a smartphone [is / would be] enjoyable. | (Macedo, 2017) | |
| 0.902 | HM3. Using a smartphone [is / would be] entertaining. | (Macedo, 2017) | |
| EoU | 0.891 | EoU1. I find smartphones easy to use. | (Macedo, 2017) |
| 0.895 | EoU2. My interaction with smartphones [is / would be] clear and understandable. | (Macedo, 2017) | |
| 0.857 | EoU3. Learning how to use a smartphone [is / would be] easy for me. | (Macedo, 2017) | |
| 0.927 | EoU4. I can easily handle smartphones. | Self-developed | |
| STA | 0.759 | STA1. Using a smartphone makes me nervous. | (Ellis et al., 2021) |
| 0.874 | STA2. Smartphones [make / would make] me feel uncomfortable. | (Ellis et al., 2021) | |
| 0.870 | STA3. I get a sinking feeling when I think of using a smartphone. | (Ellis et al., 2021) | |
| PU | 0.897 | PU1. Using a smartphone [makes / would make] my life more convenient. | (Chen and Chan, 2014) |
| 0.897 | PU2. I [find / would find] a smartphone useful in my life. | (Chen and Chan, 2014) | |
| 0.857 | PU3. Using a smartphone [makes / would make] my daily activities easier to do. | (Zhu and Cheng, 2024) | |
| ItU | 0.983 | ItU1. I will use a smartphone in the near future. | (Vrhovec et al., 2023) |
| 0.979 | ItU2. I intend to use a smartphone in the near future. | (Li et al., 2019) | |
| 0.915 | ItU3. I am interested in using a smartphone in the near future. | (Pan and Jordan-Marsh, 2010) | |
| FoU | 0.893 | FoU1. I am afraid of using a smartphone. | (Vrhovec et al., 2023) |
| 0.844 | FoU2. Using a smartphone is frightening. | (Vrhovec et al., 2023) | |
| 0.810 | FoU3. Something terrible will happen if I use a smartphone. | (Moody et al., 2018) | |
| RoB | 0.838 | RoB1. The benefits of using smartphones are not realistic. | (Moody et al., 2018) |
| 0.876 | RoB2. The benefits of using smartphones are overly exaggerated. | (Moody et al., 2018) | |
| 0.860 | RoB3. The benefits of using smartphones are overstated. | (Moody et al., 2018) | |
| AtU | 0.883 | AtU1. Using a smartphone is beneficial. | (Vrhovec et al., 2023) |
| 0.913 | AtU2. Using a smartphone is a good idea. | (Chen et al., 2021) | |
| 0.911 | AtU3. I like the idea of using a smartphone. | (Chen et al., 2021) |
Notes: SN – subjective norm, PT – perceived threat, HM – hedonic motivation, EoU – ease of use, STA – smartphone technology anxiety, PU – perceived usefulness, ItU – intention to use, FoU – fear of use, RoB – rejection of benefits, AtU – attitude toward use.
The results of CFA indicate that the measurement instrument adequately fits all criteria for establishing its validity and reliability which enables us to proceed to hypothesis testing.
5.2. Hypothesis testing
We first applied the structural model to the full sample. Model fit indices indicate that the model fits the data well (, , , , , ). The results of hypothesis testing on the full sample are presented in Fig. 2.
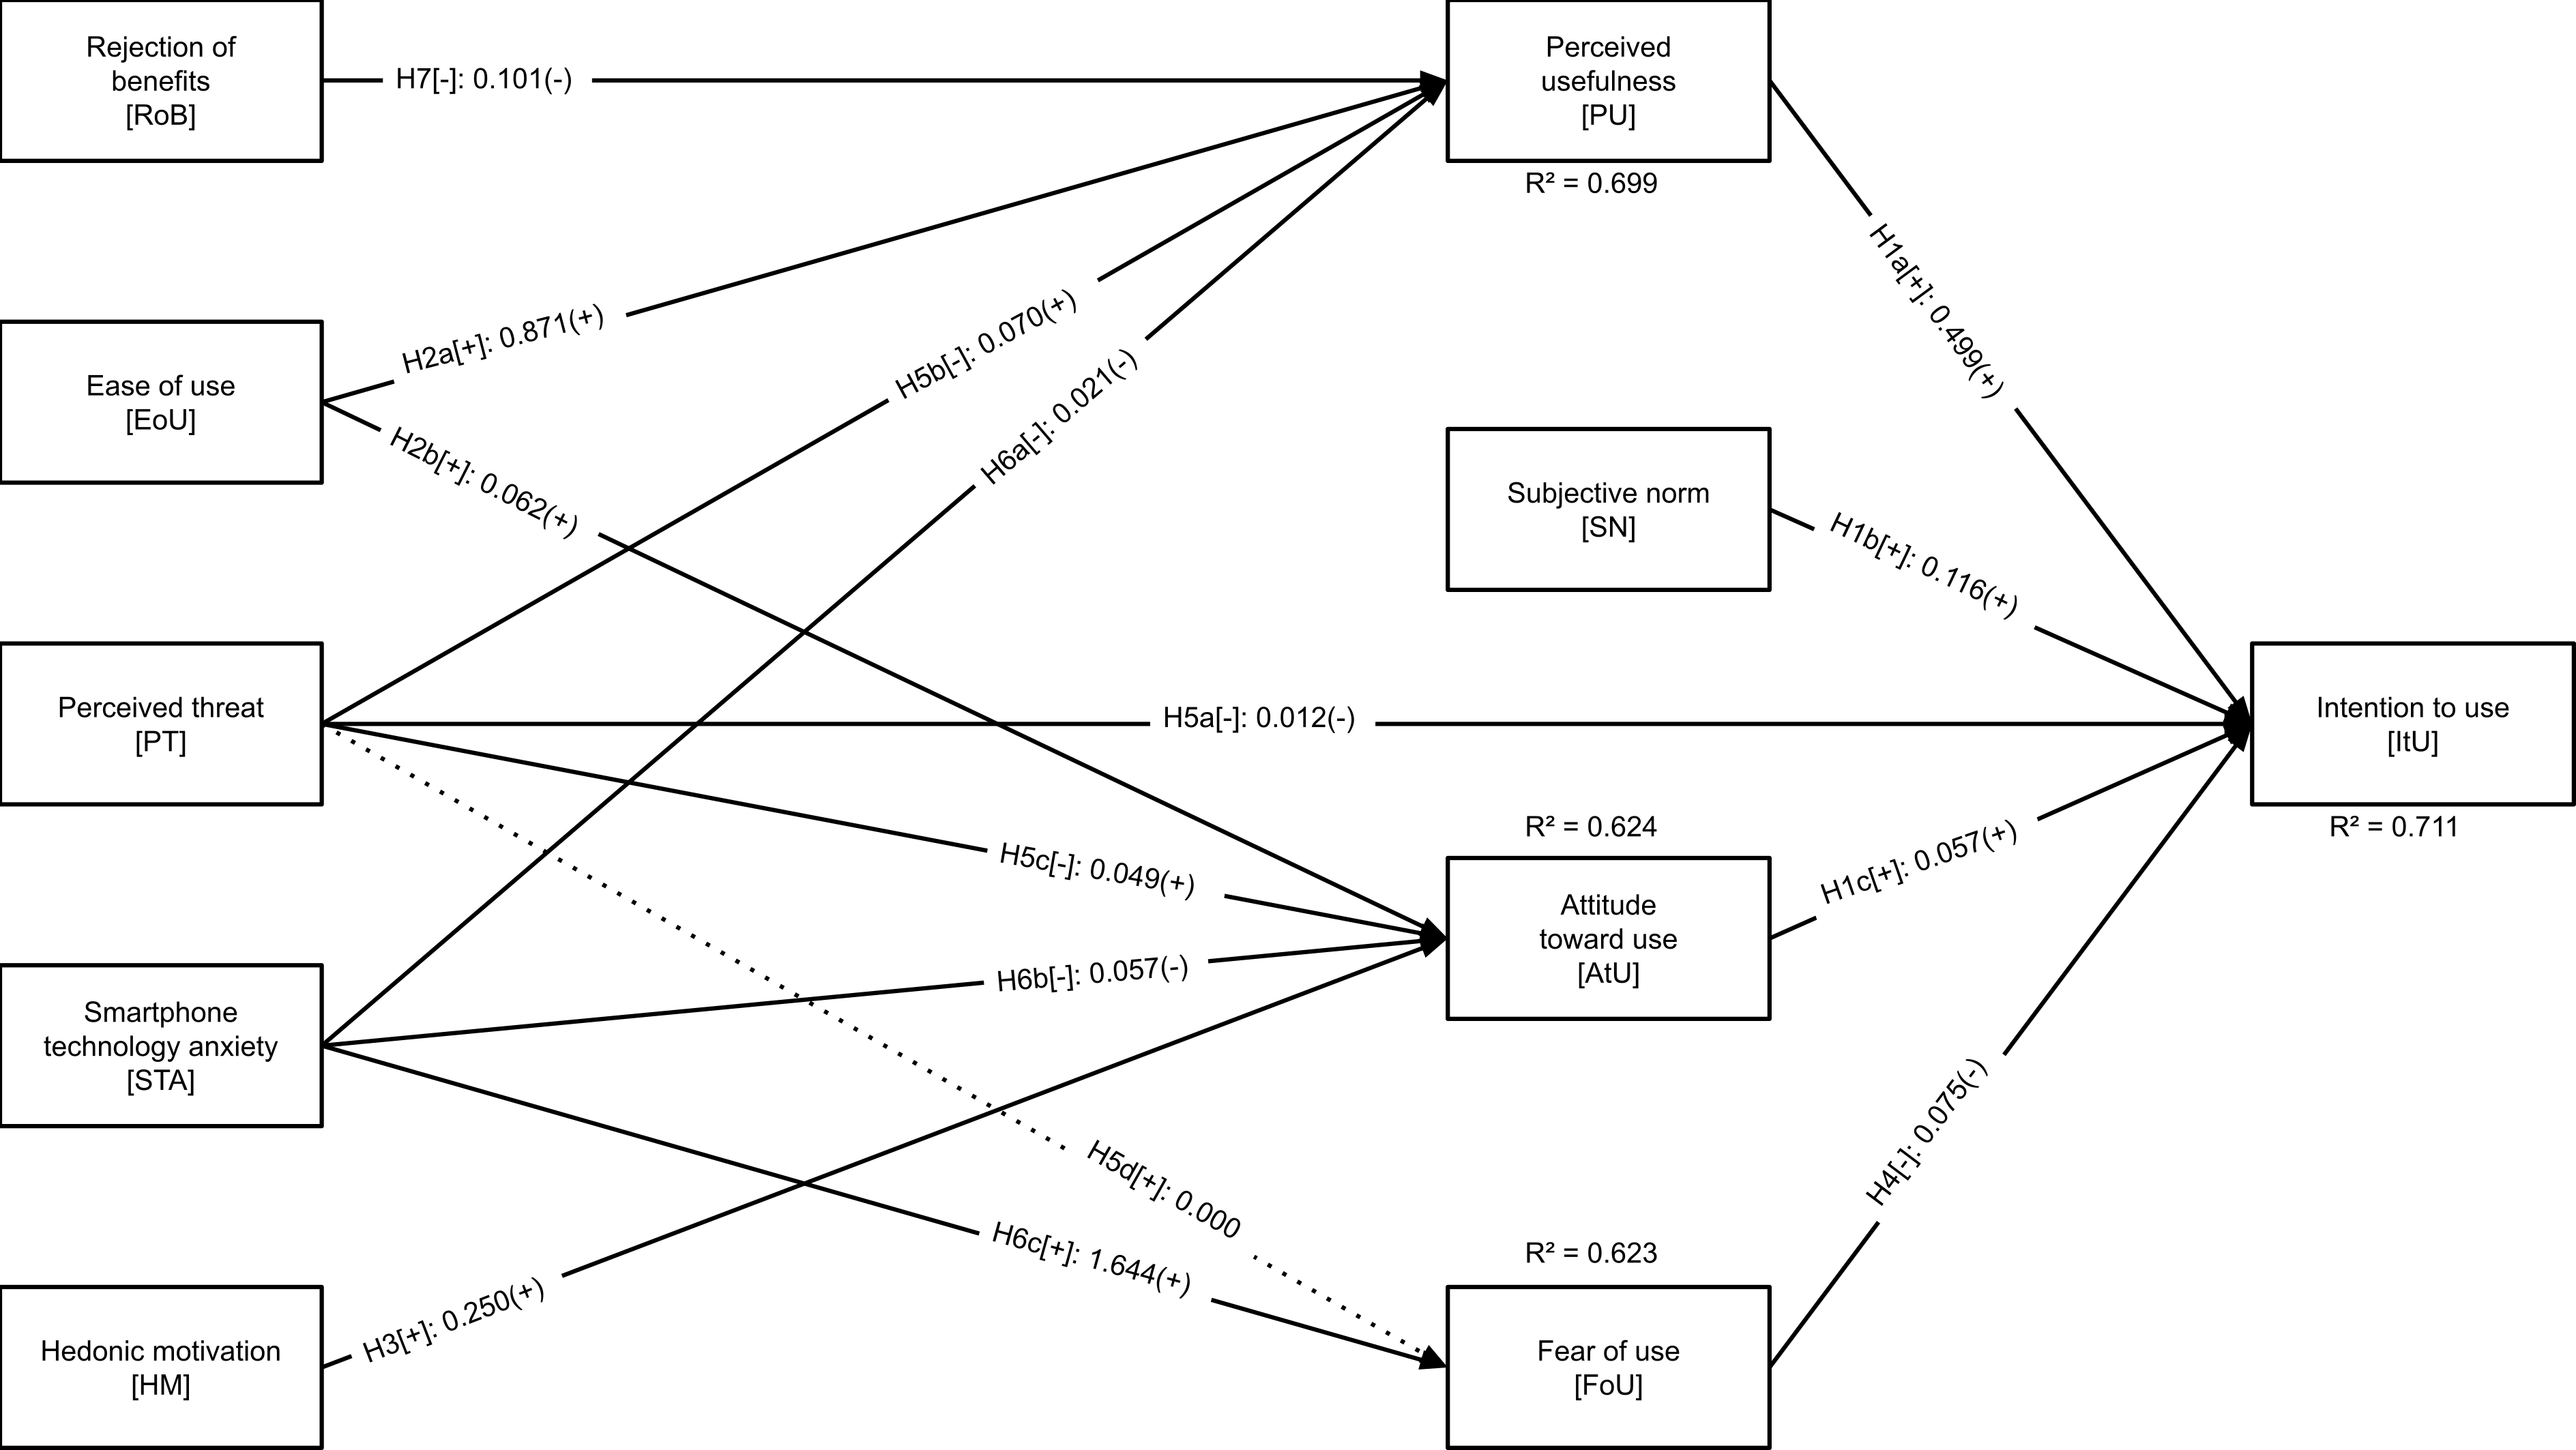
The structural model appears to explain very well all dependent variables with ranging from 0.623 to 0.711. The results indicate support for hypotheses H1a (, ), H1b (, ), H1c (, ), H2a (, ), H2b (, ), H3 (, ), H4 (, ), H5a (, ), H6a (, ), H6b (, ), and H6c (, ). Contrary to our expectations, the results indicate support for rejecting hypotheses H5b (, ) and H5c (, ). There was no support for hypothesis H5d (, ).
The association between ItU and PU has a large effect size while the effect sizes of associations of ItU with SN, AtU and FoU are small. Even though the association between ItU and PT is significant, its effect size appears to be negligible which diminishes support for hypothesis H5a. The association between PU and EoU has a large effect size while the associations of PU with STA, RoB and PT have small effect sizes. The association with PT is positive contrary to the posed hypothesis. The association between AtU and HM has a medium effect size while the effect sizes of the associations of AtU with EoU, STA and PT have small effect sizes. Again, the association with PT is positive contrary to the respective hypothesis. The association between FoU and STA has a large effect size while the effect size of the non-significant association between PT and FoU is negligible.
Next, we applied the structural model to the user and non-user subsamples. Model fit indices suggest that the model fits well the data from both subsamples. The results of hypothesis testing on user and non-user subsamples are presented in Table 5.
| Users of smartphones | Non-users of smartphones | |||
|---|---|---|---|---|
| Model fit | ||||
| CFI | ||||
| SRMR | ||||
| RMSEA | ||||
| ItU | ||||
| PU | ||||
| AtU | ||||
| FoU | ||||
| Effect size | ||||
| ItU | PU | |||
| SN | ||||
| AtU | ||||
| FoU | ||||
| PT | ||||
| PU | EoU | |||
| PT | ||||
| STA | ||||
| RoB | ||||
| AtU | EoU | |||
| HM | ||||
| PT | ||||
| STA | ||||
| FoU | PT | |||
| STA |
Notes: ; CFI – comparative fit index, SRMR – standardized root mean square residual, RMSEA – root mean square error of approximation; SN – subjective norm, PT – perceived threat, HM – hedonic motivation, EoU – ease of use, STA – smartphone technology anxiety, PU – perceived usefulness, ItU – intention to use, FoU – fear of use, RoB – rejection of benefits, AtU – attitude toward use.
Both structural models appear to explain well all dependent variables with ranging from 0.367 to 0.594 for the subsample of smartphone users, and ranging from 0.419 to 0.521 for non-users of smartphones. Nevertheless, for ItU, PU and AtU are significantly lower in both subsamples than in the full sample (, 95% CI , , 95% CI , , 95% CI ). Also, for FoU is significantly lower in the non-user subsample than in the full sample (, 95% CI ). Compared to each other, the model explains FoU significantly better in the user subsample () than in the non-user subsample ().
There are six differences in the significance of associations between both subsamples. The associations between ItU and FoU, PU and STA, PU and RoB, and AtU and STA are significant in the user subsample but not in the non-user subsample. The differences in effect size are however only significant for the associations between PU and RoB, and AtU and STA. The former association has a medium effect size in the user subsample and a small effect size in the non-user subsample. The latter association has a medium effect size in the user subsample while the effect size in the non-user subsample is negligible. The associations between ItU and PT, and AtU and EoU are significant in the non-user subsample but not in the user subsample. The differences in effect size are only significant for the latter association. Its effect size is small in the non-user subsample while the effect size in the user subsample is negligible.
There are three more significant differences in effect sizes for associations that are significant in both subsamples. First, the effect size of the association between ItU and PU is small in the user subsample and large in the non-user subsample. Second, the effect size of the association between PU and EoU is medium in the user subsample and large in the non-user subsample. Third, the effect size of the association between FoU and STA is large in both subsamples albeit larger in the user subsample which can be likely attributed to a significantly higher in the user subsample.
Finally, we applied the structural model to the subsamples according to awareness of smartphones. Model fit indices suggest that the model fits well the data from both subsamples. The results of hypothesis testing on aware and not aware subsamples are presented in Table 6.
| Aware of smartphones | Not aware of smartphones | |||
|---|---|---|---|---|
| Model fit | ||||
| CFI | ||||
| SRMR | ||||
| RMSEA | ||||
| ItU | ||||
| PU | ||||
| AtU | ||||
| FoU | ||||
| Effect size | ||||
| ItU | PU | |||
| SN | ||||
| AtU | ||||
| FoU | ||||
| PT | ||||
| PU | EoU | |||
| PT | ||||
| STA | ||||
| RoB | ||||
| AtU | EoU | |||
| HM | ||||
| PT | ||||
| STA | ||||
| FoU | PT | |||
| STA |
Notes: ; CFI – comparative fit index, SRMR – standardized root mean square residual, RMSEA – root mean square error of approximation; SN – subjective norm, PT – perceived threat, HM – hedonic motivation, EoU – ease of use, STA – smartphone technology anxiety, PU – perceived usefulness, ItU – intention to use, FoU – fear of use, RoB – rejection of benefits, AtU – attitude toward use.
Both structural models explain well all dependent variables. ranged from 0.583 to 0.622 in the aware subsample. These were not significantly lower than in the full sample. In the not aware subsample, ranged from 0.417 to 0.559. for ItU, PU and AtU are significantly lower than in the full sample (, 95% CI , , 95% CI , , 95% CI ). Nevertheless, there were no significant differences between the two subsamples when compared to each other.
There are five differences in the significance of associations between the two subsamples. The associations between ItU and FoU, PU and STA, PU and RoB, and AtU and PT are only significant in the aware subsample. The association between ItU and PT is however only significant in the not aware subsample. There were no significant differences in effect sizes though. We present a summary of hypothesis testing results in Table 7.
| Hypothesis | Evidence | Result |
|---|---|---|
| H1a[+] PU ItU | • Significant positive association, large effect size (full sample, non-user and not aware subsamples) | Supported |
| • Significant positive association, small effect size (user subsample) | ||
| • Significant positive association, medium effect size (aware subsample) | ||
| H1b[+] SN ItU | • Significant positive association, small effect size | Supported |
| H1c[+] AtU ItU | • Significant positive association, small effect size | Supported |
| H2a[+] EoU PU | • Significant positive association, large effect size (full sample, non-user, aware and not aware subsamples) | Supported |
| • Significant positive association, medium effect size (user subsample) | ||
| H2b[+] EoU AtU | • Significant positive association, small effect size (full sample, non-user, aware and not aware subsamples) | Partially supported |
| • Non-significant association (user subsample) | ||
| H3[+] HM AtU | • Significant positive association, medium effect size (full sample, user, non-user and aware subsamples) | Supported |
| • Significant positive association, small effect size (not aware subsample) | ||
| H4[-] FoU ItU | • Significant negative association, small effect size (full sample, user and aware subsamples) | Partially supported |
| • Non-significant association (non-user and not aware subsamples) | ||
| H5a[-] PT ItU | • Significant negative association, negligible effect size (full sample) | Partially supported |
| • Significant negative association, small effect size (non-user and not aware subsamples) | ||
| • Non-significant association (user and aware subsamples) | ||
| H5b[-] PT PU | • Significant positive association, small effect size | Rejected |
| H5c[-] PT AtU | • Significant positive association, small effect size (full sample, user, non-user and aware subsamples) | Partially rejected |
| • Non-significant association (not aware subsample) | ||
| H5d[+] PT FoU | • Non-significant association | Not supported |
| H6a[-] STA PU | • Significant negative association, small effect size (full sample, user and aware subsamples) | Partially supported |
| • Non-significant association (non-user and not aware subsamples) | ||
| H6b[-] STA AtU | • Significant negative association, small effect size (full sample, aware and not aware subsamples) | Partially supported |
| • Significant negative association, medium effect size (user subsample) | ||
| • Non-significant association (non-user subsample) | ||
| H6c[+] STA FoU | • Significant positive association, large effect size | Supported |
| H7[-] RoB PU | • Significant negative association, small effect size (full sample and aware subsample) | Partially supported |
| • Significant negative association, medium effect size (user subsample) | ||
| • Non-significant association (non-user and not aware subsamples) |
Notes: SN – subjective norm, PT – perceived threat, HM – hedonic motivation, EoU – ease of use, STA – smartphone technology anxiety, PU – perceived usefulness, ItU – intention to use, FoU – fear of use, RoB – rejection of benefits, AtU – attitude toward use.
6. Discussion
6.1. Theoretical and practical implications
This study makes several theoretical contributions. First, this study provides new insights into adoption of smartphones by older adults. Even though adoption of smartphones by older adults has been studied extensively in existing literature, this study incorporates new associations into the theoretical framework. The results of this study confirmed associations of ItU with PU and SN further supporting the findings found in the existing literature (Conci et al., 2009; Huang, 2023b; Yang et al., 2023). The results also provide additional support for literature that indicates the association between ItU and AtU should be included in addition to the association between ItU and PU in technology adoption studies among older adults (Nayak et al., 2010; Yeh et al., 2024). This is in line with the original TAM (Davis et al., 1989), and contrary to its later versions, such as the revised TAM (Davis et al., 1989) and TAM2 (Venkatesh and Davis, 2000). The results of this study also confirm the existing literature by providing support for associations of PU with EuO (Conci et al., 2009; Huang, 2023b), and STA (Huang, 2023b; Zhu and Cheng, 2024). The results of this study further support the current literature by indicating support for associations of AtU with EoU (Chen and Chan, 2014; Guner and Acarturk, 2020; Jarvis et al., 2020), and STA (Ellis et al., 2021). AtU is also associated with HM supporting the literature indicating that playfulness (a conceptually related construct) is associated with AtU (Huang et al., 2023).
For the purposes of this study, we uncovered an association between RoB and PU albeit with a small effect size. This association is also non-significant in the non-user and not aware subsamples indicating that rejection of benefits plays a more important role for users of smartphones with a medium effect size, and older adults who are aware of smartphones even though with a small effect size. The results of this study also indicate that FoU plays an important role in adoption of smartphones by older adults albeit with a small effect size. Similarly to the association between RoB and PU, this association is also non-significant in the non-user and not aware subsamples indicating that fear of using smartphones plays a more important role for users of smartphones and older adults who are aware of smartphones. We finally found that FoU is associated with STA suggesting that older adults fear the use of smartphones due to their technological anxiety. These findings contribute to the literature on adoption of smartphones among older adults. Future studies on adoption of smartphones among older adults may thus include RoB and FoU in their research models.
Second, this study is one of the first to study the role of perceived threat of cyberattacks in adoption of smartphones by older adults. The significant negative association between ItU and PT in the full sample, and the non-user and not aware subsamples provides some support for the existing literature which predicts either a direct (Lai, 2016) or indirect (Conci et al., 2009; Lai, 2016) association between the two. This is also in line with the protection motivation theory (PMT) which posits that higher perceived threat (e.g., of cyberattacks) results in higher protection motivation (e.g., avoidance of smartphone use) (Burns et al., 2017; Vrhovec et al., 2023). The negligible effect size of this association indicates that perceived threat of cyberattacks in the full sample and non-significant association in the user and aware subsamples suggest that PT plays a more important role in adoption of smartphones for non-users of smartphones and older adults who are less aware of them.
PT appears to be associated with both PU and AtU. However, surprisingly these associations are positive which is contrary to what we hypothesized. We assumed that older adults who perceive a higher threat of cyberattacks would perceive less usefulness and would have a poorer attitude toward use. The results however indicate that this is not the case. This is also not in line with existing literature which predicts a negative association between PU and PT (Conci et al., 2009; Lai, 2016). A possible explanation for positive associations could be awareness. Older adults with a better attitude toward the use of smartphones and who are more aware of their usefulness may be also more aware of cyberthreats. We could also switch the perspective by saying that older adults who feel less threatened by cyberattacks are also less likely to grasp the usefulness of smartphones and have poorer attitude towards their use due to their poor awareness of the abilities of smartphones and cyberthreats. In our study, we measured awareness of smartphones which might be related to other kinds of awareness mentioned before. Even though we found no significant differences between respondents who were aware of smartphones and those who are not, the association between AtU and PT is non-significant in the not aware subsample indicating some support for this potential explanation. Finally, it is surprising that the association between FoU and PT was non-significant suggesting that older adults do not fear using smartphones because they would feel threatened by cyberattacks. This finding is consistent with the assumption that the unexpected positive associations of PT with PU and AtU may be due to poor awareness of cyberthreats. Overall, the role of PT, and more broadly cybersecurity, in adoption of smartphones by older adults has not been sufficiently explained yet. Future studies, such as studies including other kinds of awareness, would be needed to provide further insights.
Third, this study is one of the first to study differences between users and non-users of smartphones. The results of our study indicate that PU plays a more important role in adoption of smartphones by non-users of smartphones. EoU plays similarly a more important role in shaping PU and AtU among non-users. Even though these associations have been confirmed before, this study is among the first to suggest the greater importance of EoU among non-users of smartphones therefore contributing to the literature on adoption of smartphones by older adults. Contrary, STA appears to play a more important role in shaping PU and AtU among users of smartphones. This study is among the first to indicate the greater importance of STA among users of smartphones which may seem counter-intuitive. Studies however suggest that STA is associated with EoU (Cimperman et al., 2016) thus indirectly affecting adoption of smartphones. This explanation is consistent with our findings. The studied constructs explain significantly better FoU in the user than in the non-user subsample. Since STA is the only significant construct associated with FoU, these results suggest the existence of other related factors that were not accounted for in our research model. Future studies may explore additional factors that shape the fear of using smartphones among older adults who are not using smartphones.
Finally, this study has some practical implications. It indicates that campaigns promoting adoption of smartphones among older adults should primarily emphasize the usefulness of smartphones since it has the largest effect size among all constructs associated with ItU. Among non-users of smartphones, EoU plays the strongest role in shaping both PU and AtU and could thus be emphasized to achieve this outcome. Among smartphone users, efforts to lower STA may achieve the same. As older adults age, their abilities generally decrease, and they may feel more anxiety as their age progresses. Regular workshops, training and informal teaching and/or refreshing of knowledge and skills may help to keep their STA low or lower it.
A practical implication may also stem from the surprising rejection of hypotheses H5b and H5c indicating positive associations of PT with PU and AtU, respectively. We assumed that raising the awareness of cyberthreats could hinder the adoption of smartphones among older adults. These results however suggest the opposite. Incorporating cybersecurity materials and/or training in campaigns promoting adoption of smartphones among older adults, workshops, training and informal teaching may have a side-effect of indirectly improving adoption of smartphones. The readers should nevertheless exercise caution when implementing such improvements since more research is needed to further confirm our findings, possibly involving these activities.
6.2. Limitations and future work
This study has some limitations that the readers should note. First, the sample is not representative since the respondents in our sample seem to have higher formal education than the population of older adults in Slovenia. Notably, older adults with the lowest levels of formal education are underrepresented in the sample. Caution should be exercised when generalizing the results of our study to the population of older adults in Slovenia. Next, the study was conducted in a single cultural context. Even though the results may be applicable to similar cultural contexts, such as other EU countries, they may not be universally generalizable. Future studies comparing the results in varying cultural contexts may thus be beneficial in determining whether the findings are applicable to other cultural contexts. Finally, this study provides some insights into the role of awareness of smartphones in explaining the surprising positive associations of PT with PU and AtU. Future studies measuring other kinds of awareness, such as awareness of cyberthreats, or other factors may help to better explain these.
Acknowledgements.
This work was partially funded by the Slovenian Research and Innovation Agency [grant number J5-3111] and [grant number L5-50163]. The funders had no role in study design, data collection and analysis, decision to publish, or preparation of the manuscript.References
- (1)
- Aranha et al. (2024) Mathew Aranha, Jonah Shemie, Kirstyn James, Conor Deasy, and Ciara Heavin. 2024. Behavioural intention of mobile health adoption: A study of older adults presenting to the emergency department. Smart Health 31 (2024), 100435. https://doi.org/10.1016/j.smhl.2023.100435
- Bazen (2023) Alexus Bazen. 2023. Cell phone statistics 2024. https://www.consumeraffairs.com/cell_phones/cell-phone-statistics.html
- Burns et al. (2017) A.J. Burns, Clay Posey, Tom L. Roberts, and Paul Benjamin Lowry. 2017. Examining the relationship of organizational insiders’ psychological capital with information security threat and coping appraisals. Computers in Human Behavior 68 (2017), 190–209. https://doi.org/10.1016/j.chb.2016.11.018
- Cerda Díez et al. (2023) Maria Fernanda Cerda Díez, María Del Pilar Ureta, Isabel Pavez, Cristóbal Benavides, Ignacio Inostroza-Quezada, and Leonardo D. Epstein. 2023. Access, use and attitudes regarding information and communication technologies among older adults during the COVID-19 pandemic. REVISTA ESPAÑOLA DE COMUNICACIÓN EN SALUD 14, 2 (2023), 7–20. https://doi.org/10.20318/recs.2023.7375
- Chen and Chan (2014) Ke Chen and Alan Hoi Shou Chan. 2014. Gerontechnology acceptance by elderly Hong Kong Chinese: a senior technology acceptance model (STAM). Ergonomics 57, 5 (2014), 635–652. https://doi.org/10.1080/00140139.2014.895855
- Chen et al. (2021) Ke Chen, Vivian Wei Qun Lou, and Selina Siu Ching Lo. 2021. Exploring the acceptance of tablets usage for cognitive training among older people with cognitive impairments: A mixed-methods study. Applied Ergonomics 93 (2021), 103381. https://doi.org/10.1016/j.apergo.2021.103381
- Cimperman et al. (2016) Miha Cimperman, Maja Makovec Brenčič, and Peter Trkman. 2016. Analyzing older users’ home telehealth services acceptance behavior—applying an Extended UTAUT model. International Journal of Medical Informatics 90 (2016), 22–31. https://doi.org/10.1016/j.ijmedinf.2016.03.002
- Conci et al. (2009) Mario Conci, Fabio Pianesi, and Massimo Zancanaro. 2009. Useful, Social and Enjoyable: Mobile Phone Adoption by Older People. In Human-Computer Interaction – INTERACT 2009, Tom Gross, Jan Gulliksen, Paula Kotzé, Lars Oestreicher, Philippe Palanque, Raquel Oliveira Prates, and Marco Winckler (Eds.). Vol. 5726. Springer Berlin Heidelberg, Berlin, Heidelberg, 63–76. https://doi.org/10.1007/978-3-642-03655-2_7
- Davis et al. (1989) Fred D. Davis, Richard P. Bagozzi, and Paul R. Warshaw. 1989. User Acceptance of Computer Technology: A Comparison of Two Theoretical Models. Management Science 35, 8 (1989), 982–1003. https://doi.org/10.1287/mnsc.35.8.982
- Domingos et al. (2022) Célia Domingos, Patrício Costa, Nadine Correia Santos, and José Miguel Pêgo. 2022. Usability, Acceptability, and Satisfaction of a Wearable Activity Tracker in Older Adults: Observational Study in a Real-Life Context in Northern Portugal. Journal of Medical Internet Research 24, 1 (2022), e26652. https://doi.org/10.2196/26652
- Ellis et al. (2021) Michael E. Ellis, James P. Downey, Alexander N. Chen, and Hsin-Ke Lu. 2021. Why taiwanese seniors use technology. Asia Pacific Management Review 26, 3 (2021), 149–159. https://doi.org/10.1016/j.apmrv.2021.01.001
- Eurostat (2020) Eurostat. 2020. Ageing Europe - statistics on population developments. https://ec.europa.eu/eurostat/statistics-explained/index.php?title=Ageing_Europe_-_statistics_on_population_developments#Older_people_.E2.80.94_population_overview
- Frishammar et al. (2023) Johan Frishammar, Anna Essén, Frida Bergström, and Tilda Ekman. 2023. Digital health platforms for the elderly? Key adoption and usage barriers and ways to address them. Technological Forecasting and Social Change 189 (2023), 122319. https://doi.org/10.1016/j.techfore.2023.122319
- Fujs et al. (2019) Damjan Fujs, Anže Mihelič, and Simon Vrhovec. 2019. Social Network Self-Protection Model:What Motivates Users to Self-Protect? Journal of Cyber Security and Mobility 8, 4 (2019), 467–492. https://doi.org/10.13052/jcsm2245-1439.844
- Guner and Acarturk (2020) Hacer Guner and Cengiz Acarturk. 2020. The use and acceptance of ICT by senior citizens: a comparison of technology acceptance model (TAM) for elderly and young adults. Universal Access in the Information Society 19, 2 (2020), 311–330. https://doi.org/10.1007/s10209-018-0642-4
- Harris et al. (2022) Maurita T. Harris, Kenneth A. Blocker, and Wendy A. Rogers. 2022. Older Adults and Smart Technology: Facilitators and Barriers to Use. Frontiers in Computer Science 4 (2022), 835927:1–13. https://doi.org/10.3389/fcomp.2022.835927
- Hayes (2021) Timothy Hayes. 2021. R-squared change in structural equation models with latent variables and missing data. Behavior Research Methods 53, 5 (2021), 2127–2157. https://doi.org/10.3758/s13428-020-01532-y
- Huang et al. (2023) Menghua Huang, Yingxue Ren, Xu Wang, Xinzhe Li, and Li Li. 2023. What affects the use of smartphones by the elderly? A hybrid survey from China. National Accounting Review 5, 3 (2023), 245–260. https://doi.org/10.3934/NAR.2023015
- Huang (2023a) Tianyang Huang. 2023a. Expanding the UTAUT2 framework to determine the drivers of mobile shopping behaviour among older adults. PLOS ONE 18, 12 (2023), e0295581. https://doi.org/10.1371/journal.pone.0295581
- Huang (2023b) Tianyang Huang. 2023b. Using SOR framework to explore the driving factors of older adults smartphone use behavior. Humanities and Social Sciences Communications 10, 1 (2023), 690. https://doi.org/10.1057/s41599-023-02221-9
- Jarvis et al. (2020) Mary-Ann Jarvis, Benn Sartorius, and Jennifer Chipps. 2020. Technology acceptance of older persons living in residential care. Information Development 36, 3 (2020), 339–353. https://doi.org/10.1177/0266666919854164
- Jelovčan et al. (2020) Luka Jelovčan, Damjan Fujs, Simon Vrhovec, and Anže Mihelič. 2020. The role of information sensitivity in adoption of E2EE communication software. In Proceedings of the European Interdisciplinary Cybersecurity Conference. ACM, Rennes France, 1–2. https://doi.org/10.1145/3424954.3424967
- Jena (2023) Rabindra Jena. 2023. Factors Impacting Senior Citizens’ Adoption of E-Banking Post COVID-19 Pandemic: An Empirical Study from India. Journal of Risk and Financial Management 16, 9 (2023), 380. https://doi.org/10.3390/jrfm16090380
- Johnston et al. (2019) Allen C. Johnston, Merrill Warkentin, Alan R. Dennis, and Mikko Siponen. 2019. Speak their Language: Designing Effective Messages to Improve Employees’ Information Security Decision Making. Decision Sciences 50, 2 (2019), 245–284. https://doi.org/10.1111/deci.12328
- Kim (2021) Sunyoung Kim. 2021. Exploring How Older Adults Use a Smart Speaker–Based Voice Assistant in Their First Interactions: Qualitative Study. JMIR mHealth and uHealth 9, 1 (2021), e20427. https://doi.org/10.2196/20427
- Kruse et al. (2017) Clemens Scott Kruse, Michael Mileski, and Joshua Moreno. 2017. Mobile health solutions for the aging population: A systematic narrative analysis. Journal of Telemedicine and Telecare 23, 4 (2017), 439–451. https://doi.org/10.1177/1357633X16649790
- Lai (2016) P C Lai. 2016. Design and Security impact on consumers’ intention to use single platform E-payment. Interdisciplinary Information Sciences 22, 1 (2016), 111–122. https://doi.org/10.4036/iis.2016.R.05
- LaMonica et al. (2021) Haley M. LaMonica, Tracey A. Davenport, Anna E. Roberts, and Ian B. Hickie. 2021. Understanding Technology Preferences and Requirements for Health Information Technologies Designed to Improve and Maintain the Mental Health and Well-Being of Older Adults: Participatory Design Study. JMIR Aging 4, 1 (2021), e21461. https://doi.org/10.2196/21461
- Lenz et al. (2023) Julia Lenz, Zdravko Bozakov, Steffen Wendzel, and Simon Vrhovec. 2023. Why people replace their aging smart devices: A push–pull–mooring perspective. Computers & Security 130 (2023), 103258. https://doi.org/10.1016/j.cose.2023.103258
- Li et al. (2019) Junde Li, Qi Ma, Alan Hs. Chan, and S.S. Man. 2019. Health monitoring through wearable technologies for older adults: Smart wearables acceptance model. Applied Ergonomics 75 (2019), 162–169. https://doi.org/10.1016/j.apergo.2018.10.006
- Liang and Xue (2010) Huigang Liang and Yajiong Xue. 2010. Understanding Security Behaviors in Personal Computer Usage: A Threat Avoidance Perspective. Journal of the Association for Information Systems 11, 07 (2010), 394–413. https://doi.org/10.17705/1jais.00232
- Lutolli and Vrhovec (2019) Egzona Lutolli and Simon Vrhovec. 2019. Adoption of smarthome devices: Blinded by benefits, ignoring the dangers? Elektrotehniški vestnik / Electrotechnical Review 86, 5 (2019), 267–273.
- Macedo (2017) Isabel Maria Macedo. 2017. Predicting the acceptance and use of information and communication technology by older adults: An empirical examination of the revised UTAUT2. Computers in Human Behavior 75 (2017), 935–948. https://doi.org/10.1016/j.chb.2017.06.013
- Maddux and Rogers (1983) James E Maddux and Ronald W Rogers. 1983. Protection motivation and self-efficacy: A revised theory of fear appeals and attitude change. Journal of Experimental Social Psychology 19, 5 (1983), 469–479. https://doi.org/10.1016/0022-1031(83)90023-9
- McCosker et al. (2018) Anthony McCosker, Diana Bossio, Indigo Holcombe-James, Hilary Davis, Max Schleser, and Jessamy Gleeson. 2018. 60+ online: Engaging seniors through social media and digital stories. Technical Report. Swinburne University of Technology. 37p pages. https://doi.org/10.4225/50/5ACAC04852868
- Mihelič et al. (2023) Anže Mihelič, Igor Bernik, and Simon Vrhovec. 2023. Older adults and tablet computers: Adoption and the role of perceived threat of cyber attacks. In European Interdisciplinary Cybersecurity Conference. ACM, Stavanger Norway, 189–190. https://doi.org/10.1145/3590777.3590814
- Mihelič et al. (2022) Anže Mihelič, Simon Vrhovec, Igor Bernik, Andrej Domej, Damjan Fujs, Tomaž Hovelja, Sanja Kerznar Osolnik, Patrik Pucer, Damjan Vavpotič, Boštjan Žvanut, and Kaja Prislan. 2022. Use of smart devices by the elderly: Nursing home residents in Slovenia. Journal of Wireless Mobile Networks, Ubiquitous Computing, and Dependable Applications 13, 3 (2022), 68–80. https://doi.org/10.22667/JOWUA.2022.09.30.068
- Mihelič and Žvanut (2022) Anže Mihelič and Boštjan Žvanut. 2022. (In)secure Smart Device Use Among Senior Citizens. IEEE Security & Privacy 20, 1 (2022), 62–71. https://doi.org/10.1109/MSEC.2021.3113726
- Moody et al. (2018) Gregory D. Moody, Mikko Siponen, and Seppo Pahnila. 2018. Toward a Unified Model of Information Security Policy Compliance. MIS Quarterly 42, 1 (2018), 285–311. https://doi.org/10.25300/MISQ/2018/13853
- Murko and Vrhovec (2019) Aleksander Murko and Simon L. R. Vrhovec. 2019. Bitcoin adoption: Scams and anonymity may not matter but trust into Bitcoin security does. In Proceedings of the Third Central European Cybersecurity Conference. ACM, Munich Germany, 1–6. https://doi.org/10.1145/3360664.3360679
- Nayak et al. (2010) Laxman U. S. Nayak, Lee Priest, and Allan P. White. 2010. An application of the technology acceptance model to the level of Internet usage by older adults. Universal Access in the Information Society 9, 4 (2010), 367–374. https://doi.org/10.1007/s10209-009-0178-8
- Pan and Jordan-Marsh (2010) Shuya Pan and Maryalice Jordan-Marsh. 2010. Internet use intention and adoption among Chinese older adults: From the expanded technology acceptance model perspective. Computers in Human Behavior 26, 5 (2010), 1111–1119. https://doi.org/10.1016/j.chb.2010.03.015
- Portenhauser et al. (2021) Alexandra A. Portenhauser, Yannik Terhorst, Dana Schultchen, Lasse B. Sander, Michael D. Denkinger, Michael Stach, Natalie Waldherr, Dhayana Dallmeier, Harald Baumeister, and Eva-Maria Messner. 2021. Mobile Apps for Older Adults: Systematic Search and Evaluation Within Online Stores. JMIR Aging 4, 1 (2021), e23313. https://doi.org/10.2196/23313
- Rasche et al. (2018) Peter Rasche, Matthias Wille, Christina Bröhl, Sabine Theis, Katharina Schäfer, Matthias Knobe, and Alexander Mertens. 2018. Prevalence of Health App Use Among Older Adults in Germany: National Survey. JMIR mHealth and uHealth 6, 1 (2018), e8619. https://doi.org/10.2196/mhealth.8619
- Ren and Klausen (2024) Puxiang Ren and Søren Harnow Klausen. 2024. Smartphone use, intergenerational support and older adults’ wellbeing. Current Psychology 43 (2024), 407–424. https://doi.org/10.1007/s12144-023-04309-6
- Revollo Sarmiento et al. (2024) Elsa Araceli Revollo Sarmiento, Deisy Krzemien, Maria Celeste López Moreno, and Leticia Vivas. 2024. Perceptions of older people about the use of cell phones in Argentina: a contribution from the gerontotechnological perspective. Quality in Ageing and Older Adults 25, 2 (2024), 109–121. https://doi.org/10.1108/QAOA-06-2023-0042
- Statistical Office of the Republic of Slovenia (2024) Statistical Office of the Republic of Slovenia. 2024. SiStat Database. https://pxweb.stat.si/SiStat/en
- Talukder et al. (2021) Md. Shamim Talukder, Samuli Laato, A.K.M. Najmul Islam, and Yukun Bao. 2021. Continued use intention of wearable health technologies among the elderly: an enablers and inhibitors perspective. Internet Research 31, 5 (2021), 1611–1640. https://doi.org/10.1108/INTR-10-2020-0586
- Tsatsou (2021) Panayiota Tsatsou. 2021. Aging: The Two Faces of Janus in Digital Inclusion? International Journal of Communication 15 (2021), 1309–1329.
- Venkatesh et al. (2012) Venkatesh, Thong, and Xu. 2012. Consumer Acceptance and Use of Information Technology: Extending the Unified Theory of Acceptance and Use of Technology. MIS Quarterly 36, 1 (2012), 157. https://doi.org/10.2307/41410412
- Venkatesh and Davis (1996) Viswanath Venkatesh and Fred D. Davis. 1996. A Model of the Antecedents of Perceived Ease of Use: Development and Test. Decision Sciences 27, 3 (1996), 451–481. https://doi.org/10.1111/j.1540-5915.1996.tb01822.x
- Venkatesh and Davis (2000) Viswanath Venkatesh and Fred D. Davis. 2000. A Theoretical Extension of the Technology Acceptance Model: Four Longitudinal Field Studies. Management Science 46, 2 (2000), 186–204. https://doi.org/10.1287/mnsc.46.2.186.11926
- Vrhovec et al. (2024) Simon Vrhovec, Igor Bernik, Damjan Fujs, and Damjan Vavpotič. 2024. Cybersecurity competence of older adult users of mobile devices. In European Interdisciplinary Cybersecurity Conference. ACM, Xanthi, Greece, 221–223. https://doi.org/10.1145/3655693.3656551
- Vrhovec et al. (2023) Simon Vrhovec, Igor Bernik, and Blaž Markelj. 2023. Explaining information seeking intentions: Insights from a Slovenian social engineering awareness campaign. Computers & Security 125 (2023), 103038. https://doi.org/10.1016/j.cose.2022.103038
- Vrhovec and Markelj (2024) Simon Vrhovec and Blaž Markelj. 2024. We need to aim at the top: Factors associated with cybersecurity awareness of cyber and information security decision-makers. arXiv:2404.04725 [cs].
- Vrhovec and Mihelič (2021) Simon Vrhovec and Anže Mihelič. 2021. Redefining threat appraisals of organizational insiders and exploring the moderating role of fear in cyberattack protection motivation. Computers & Security 106 (2021), 102309. https://doi.org/10.1016/j.cose.2021.102309
- Yang et al. (2023) Cheng-Chia Yang, Cheng Liu, and Yi-Shun Wang. 2023. The acceptance and use of smartphones among older adults: differences in UTAUT determinants before and after training. Library Hi Tech 41, 5 (2023), 1357–1375. https://doi.org/10.1108/LHT-12-2021-0432
- Yeh et al. (2024) Te-Feng Yeh, Yu-Chia Chang, Shang-Yu Yang, and Cheng-Chia Yang. 2024. Effect of Successful Aging on Technology Acceptance: The Moderating Role of Selection, Optimization, and Compensation Strategies. Social Science Computer Review (2024), 08944393241258218. https://doi.org/10.1177/08944393241258218
- Zhao et al. (2018) Yang Zhao, Qi Ni, and Ruoxin Zhou. 2018. What factors influence the mobile health service adoption? A meta-analysis and the moderating role of age. International Journal of Information Management 43 (2018), 342–350. https://doi.org/10.1016/j.ijinfomgt.2017.08.006
- Zhu et al. (2023) Jieting Zhu, Huiting Weng, Peng Ou, and Lezhi Li. 2023. Use and Acceptance of Smart Elderly Care Apps Among Chinese Medical Staff and Older Individuals: Web-Based Hybrid Survey Study. JMIR Formative Research 7, 1 (2023), e41919. https://doi.org/10.2196/41919
- Zhu and Cheng (2024) Xiaowen Zhu and Xianping Cheng. 2024. Staying connected: smartphone acceptance and use level differences of older adults in China. Universal Access in the Information Society 23, 1 (2024), 203–212. https://doi.org/10.1007/s10209-022-00933-4