baptiste.sorin@inrae.fr B. SORIN-DUPONT]baptiste.sorin@inrae.fr
Individual or collective treatments: how to target antimicrobial use to limit the spread of Mannheimia haemolytica among beef cattle?
Abstract
The overuse of antibiotics has become a major global concern due to its role in diminishing treatment effectiveness and positively selecting antibiotic-resistant bacterial strains. This issue is particularly important in the beef cattle sector, where Bovine Respiratory Diseases (BRD) impose significant economic and welfare burdens. BRD are complex, multifactorial conditions primarily affecting young calves and feedlot cattle, caused by a combination of viral and bacterial pathogens, environmental factors, and stressors. Despite efforts to reduce antimicrobial use (AMU), the cattle production system remains heavily reliant on antibiotics to control BRD, often through the implementation of collective treatments to prevent outbreaks.
This study aimed at evaluating the impact of various treatment practices on the spread of BRD, specifically focusing on criteria for implementing collective treatments. Using a mechanistic stochastic model, we simulated the spread of Mannheimia haemolytica in a multi-pen fattening operation under sixteen different scenarios, considering pen composition, individual risk levels, and treatment strategies. Our findings suggest that an alternative criterion for collective treatments based on the speed of the disease spread, could reduce BRD incidence and AMU more effectively than conventional methods. This research highlights the importance of responsible treatment practices and the potential benefits of novel criteria for collective treatment strategies in improving animal health. Moreover, it emphasizes the need for transparency on the exposure to risk factors along the production chain.
keywords:
Stochastic modeling, Epidemiology, Bovine Respiratory Disease, Collective treatmentIntroduction
The general overuse of antibiotics is of growing concern worldwide as it is thought to decrease treatment effectiveness ([24, 9]) . Indeed, excessive and inappropriate use of antimicrobials can select for resistant bacterial strains, making it harder to treat infections in both animals and humans ([41, 8]).
Bovine respiratory diseases (BRD) pose a significant burden on the global livestock industry, causing considerable economic losses and welfare concerns for cattle ([10]). BRD are complex multifactorial respiratory conditions primarily affecting young calves and feedlot cattle ([17]). They are caused by a combination of viral and bacterial pathogens, environmental factors, and stressors ([23]). The bovine respiratory syncytial virus (BRSV) or the parainfluenza-3 (IPV-3) are frequently reported viral agents whereas common bacteria include Pasteurella multocida, Mannheimia haemolytica or Mycoplasma spp. ([7, 38, 18]). They lead to reduced feed efficiency, growth rates, and overall productivity, resulting in substantial financial losses for producers ([16, 6]). Additionally, they cause significant suffering in affected animals, characterized by symptoms such as coughing, fever, and respiratory distress ([19]). The prevention and management of BRD are crucial for maintaining animal health, welfare, and sustainable livestock production ([19]).
Despite considerable progress made in the livestock sector to reduce antimicrobial use (AMU) ([5, 40]) the cattle production system is still heavily reliant on this method to control BRD ([30, 1]). Individual treatment when animals show signs of disease is mostly used to care for affected animals, but collective treatments are also widely embraced to prevent BRD outbreaks and minimize economic losses ([28, 31]). The latter involves the administration of appropriate medications, such as antibiotics or anti-inflammatory drugs, to affected animals as well as the entire group to prevent additional cases ([25, 20]). This solution is motivated by poor sensitivity of current BRD field diagnostic methods, typical pathogenesis of BRD, and labor issues ([20]). As a result, a trade-off exists between antimicrobial use and bovine respiratory disease (BRD) occurrence. This trade-off highlights the need for responsible antimicrobial use practices, such as targeted collective treatment strategies. Yet, to this day, such strategies have not been proposed. Indeed, the relevant criteria and associated threshold to implement collective treatments are still questioned ([11]).
Modeling is used to better understand complex infection dynamics and compare scenarios and rank interventions ([12]). In the case of BRD, a model ranking treatment practices at pen level has been published ([32]). It simulates the circulation of an average pathogen in conditions mimicking contrasted farming contexts such as small versus large pens (considered as isolated from other pens) and low versus high risk of contracting BRD at pen level. The authors concluded on a bigger BRD circulation in large pens composed of high risk individuals and discussed which pens could get the highest benefit from collective treatments. A second model compares the impact of farm management practices on the spread of three causal pathogens of BRD in multi-pen farms featuring several individual risk levels of contracting BRD ([35]). This study highlighted that sorting animals in pens in accordance with their individual risk level of developing BRD participates in limiting the spread of the most contagious pathogens. However, no model integrating novel criteria for triggering collective treatments has been proposed so far.
This study aimed at evaluating the impact of treatment practices on the spread of a bovine respiratory pathogen in contrasted farming scenarios. More specifically, the objective was to evaluate criteria for implementing collective treatments in order to identify the best criterion. To that end, we used a mechanistic stochastic model of the spread of Mannheimia haemolytica in a multi-pen fattening operation. This choice of pathogen was motivated by the fact that M. haemolytica is commonly reported during BRD episodes in the field ([22, 36]). Furthermore, its response to antimicrobials is well characterized, making it a good candidate for a pathogen specific model investigating treatment strategies ([29]). We investigated sixteen contrasted scenarios reflecting farming practices in fattening operations, based on pen composition, individual risk level distribution, and individual vs. collective treatments based on conventional and original criteria. We compared scenario outputs regarding case occurrence, severity, and AMU.
Material and methods
Model processes and assumptions
We modeled the spread of M. haemolytica in a multi-pen fattening farm and the treatment of associated BRD. We extended our stochastic and mechanistic individual-based model previously published ([35]) for studying the circulation of specific pathogens involved in BRD, including M. haemolytica, within a fattening farm building, by including the possibility of collective treatments based on conventional and original criteria. Our model enabled pathogen transmission in a building containing several pens, i.e., groups of animals sharing a same closed indoor space. We worked under the assumption that an animal in a given pen was mainly exposed to infectious animals within its pen while also being exposed to the animals in the other pens in the building, albeit to a lesser extent. Our model monitored 6 individual characteristics. First, the model featured individual risk status of developing BRD, which referred to an individual qualitative information (low, medium, high) summarizing the level of stressors predisposing to BRD that the animal had been exposed to prior to its arrival. The model also featured hyperthermia (either due to BRD or unspecific), health status (susceptible, asymptomatic carrier, infectious), clinical status (asymptomatic, or with mild or severe clinical signs), detection status (detected or not), and treatment status (treated or not treated). Hereafter, we detail how treatments are triggered in this new version of the model. A graphic overview of the model and details on other (unchanged) processes and transitions can be found in SI1 and SI2.
The treatment process represented a standard antimicrobial treatment protocol during the fattening period. Similarly to previous models, animals could be detected upon exhibition of clinical signs or hyperthermia. Severe clinical signs were detected with a sensitivity of 1, while the sensitivity for mild clinical signs detection was averaged to 0.5 ([21]). We assumed a clinical check-up at every time step (12 h, in agreement with farmers’ herd monitoring frequency ([37]). After detecting the first case through visual appraisal, all hyperthermic animals were identified using rectal temperature measured at the next feeding time, 12 hours later. ([32, 35]). Any animals detected as affected, either though visual detection or hyperthermia, received one antibiotic dose, assumed to be effective after duration . Animals still exhibiting clinical signs after this duration were treated again (same duration), the number of treatments per episode being limited (). Transitions from T to NT occurred in three cases: (1) the animal recovered after duration due to the treatment success with probability ; (2) the end of the infectious period occurred while under treatment but was not caused by it; (3) the animal still expressed clinical signs but was already treated maxT times, thus was not treated again (treatment failure).
In this new model version, in addition to individual treatment of detected animals, we also considered the possibility to trigger a collective treatment at pen scale, based on three different criteria as detailed below. Once one of the criterion was reached, all animals not already under treatment in the pen received an antimicrobial dose, and were then followed individually according to the rules described above.
Collective treatment criteria
As a first criterion for triggering a collective treatment (conventional criterion), we tested the cumulative incidence in detected BRD cases in the pen, a collective treatment being performed once this criterion reached a fixed threshold. Such a threshold has been conventionally used for a long time in French fattening operations and continues to be employed in this manner, with values usually around 10% of the pen size ([27]), although these values are not backed up by dedicated field or experimental observations.
The second criterion (severity criterion) consisted in triggering a collective treatment based on a severity function. A collective treatment was triggered when this function reached a threshold, which selection is defined in SI3. The proposed function is a weighted sum of the number of animals detected as having mild or severe clinical signs. Mathematically, this translates to equation (1):
| (1) |
with the number of animals detected as having mild clinical signs, and the number of animals detected as having severe clinical signs. The weight parameter was smaller than 0.5 to allow an emphasis on severe cases. The process for selecting a relevant value for is detailled in SI3.
The third criterion (slope criterion) considered to trigger a collective treatment was based on the speed of case appraisal. A collective treatment was triggered when this function reached a threshold, which selection is defined in SI3. The slope at time t in pen i represented the ratio of the cumulative incidence of detected BRD cases in pen i divided by the time since the first case appraisal in pen i. This translates to equation (2):
| (2) |
where is the cumulative number of individuals detected as affected in pen , being the starting time of an episode (i.e. the date of the first detected case), and the current time. In all these cases, a collective treatment can be performed only once per pen over the simulation time.
Model implementation
To code the model, we used the open-source EMULSION framework ([33]), which defines models in human-readable structured text files then processed by a simulation engine coded in Python. Such a modeling framework facilitates model co-development and revisions by modelers, clinicians, and epidemiologists all together. EMULSION also supports individual-based stochastic modeling, enabling simulations of small groups characterized by a high variability in biological processes. The framework allows a detailed breakdown of the modeled events and processes. Processes are articulated as finite state machines, a formalism widely employed in computer science to depict states and transitions.
Scenarios and outputs
We investigated sixteen scenarios of BRD treatment in a building of 200 young beef animals, distributed in 10 pens of 20 animals each, during 40 days, as BRD typically occurs in the first few weeks of fattening ([38, 3]). These scenarios were defined by one of the four treatment strategies, applied in 2 possible farm-scale proportions of individual risk status of developing BRD and two ways of assigning animals to pens. The four treatment strategies were: (1) individual treatment administered upon detection of clinical signs (Individual); (2) collective treatment triggered when the pen-scale cumulative incidence of BRD cases reached the standard threshold, in addition to individual treatment (Conventional); (3) collective treatment triggered when the weighted severity reached the defined threshold, in addition to individual treatment (Severity); and (4) collective treatment triggered when the slope function reached the defined threshold, in addition to individual treatment (Slope). The two possible individual risk level distributions in the building were: (1) 30%, 40%, and 30% of low, medium, and high risk individuals respectively (HR30); and (2) 10%, 0% and 90% of low, medium and high risk individuals respectively (HR90) ([2]). Since having a majority of low risk individuals in the building would not feature enough cases to trigger a collective treatment, it was thus left out of this study. Finally, animals could either be assigned into pens randomly (Random) or according to their individual risk level (Sorted).
Each scenario had 200 stochastic replicates. At the building scale (i.e. grouping the 10 pens), we observed the distribution and the median of the cumulative incidence of BRD cases and the average time spent with severe clinical signs per affected animal (in hours) with regards to the total AMU in the building. We also computed the treatment False Discovery Rate (FDR) for each scenario. This measure corresponds to the ratio of false positives over predicted positives, i.e in our case the ratio between the number of doses given to healthy animals over the total AMU. Furthermore, we observed the delay between the detection of the first BRD case and the collective treatment implementation. We also observed the delay between the infection and the administration of the first dose of antimicrobial on an individual scale. Finally, for the sorted scenario, we counted the proportion of pens of each risk level that triggered a collective treatment. For each of these outputs, all applicable scenarios were compared. As we could neither assume the normality of the distributions or the homogeneity of variances across the scenarios for most of the outputs, our analysis was limited to trends as assumptions for statistical tests were not verified.
Results
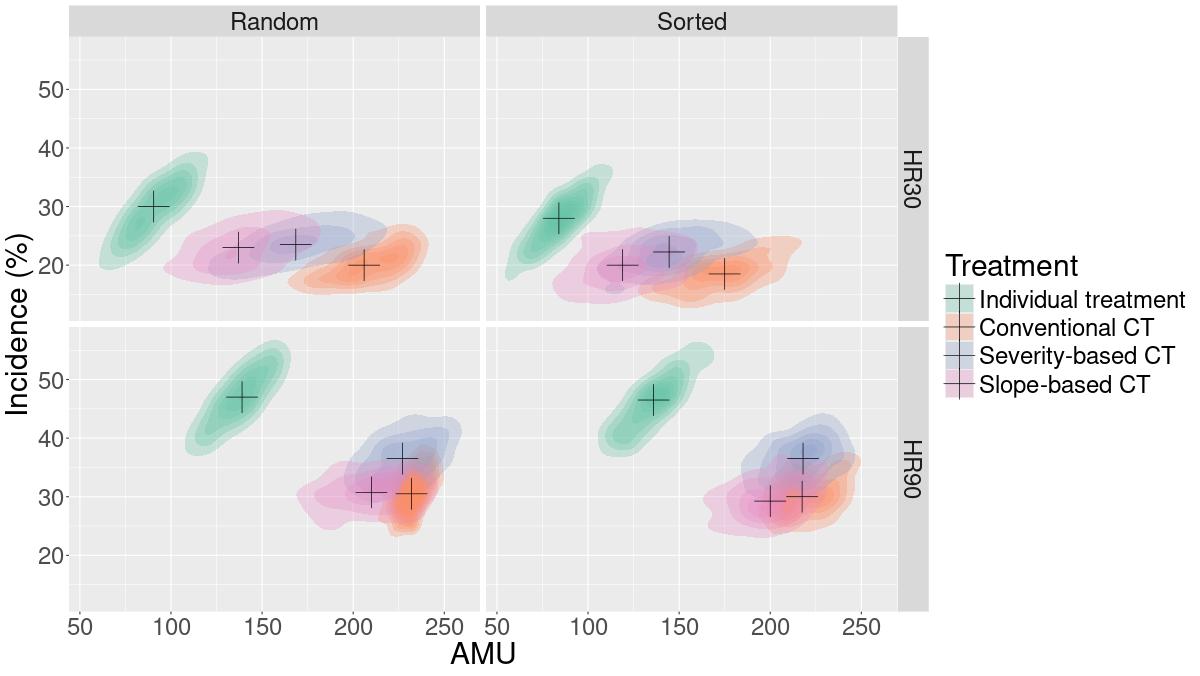
Every scenario using a collective treatment yielded a lower cumulative incidence of BRD cases than their counterpart scenario using individual treatment only, while displaying as expected larger AMU (Figure 1). The difference in cumulative incidence of BRD cases between using individual treatments and collective treatments was however lower in HR30 than in HR90. In HR30, each collective treatment displayed roughly an equal median cumulative incidence of BRD cases. However, the one triggered by the slope criterion had 18 to 33% lower AMU than the other two criteria. In HR90, the scenario using the slope criterion and the conventional collective treatment displayed a lower median cumulative incidence of BRD cases than the severity criterion. However, the scenario with the slope-based criterion yielded a 10% lower AMU than the conventional collective treatment for a roughly equivalent cumulative incidence. Scenarios with sorted pens tended to yield smaller AMU than their random counterparts.
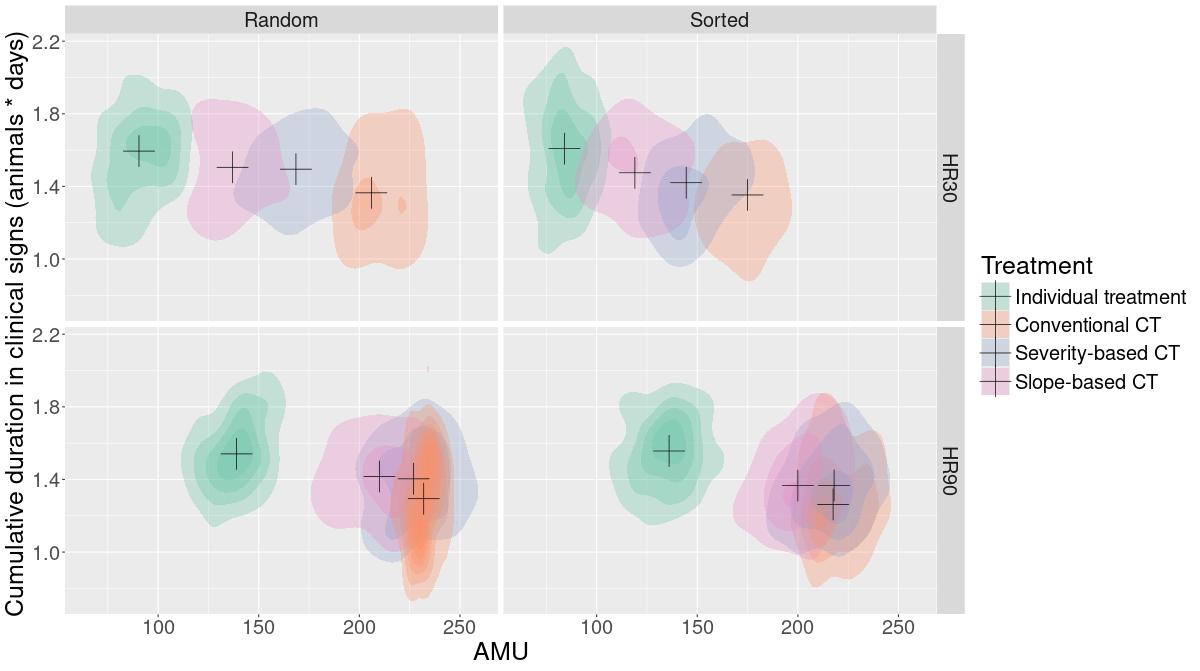
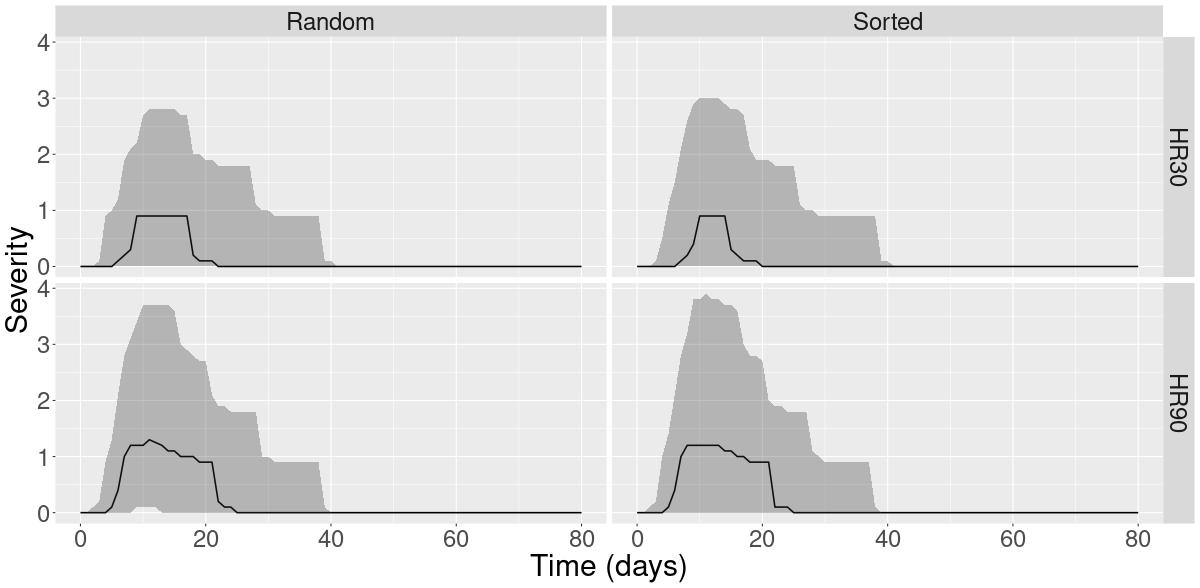
The treatments appeared to have only a limited impact on the average duration of severe clinical signs (Figure 2). Indeed, in most scenarios, we observed an important overlap of the distributions on the y-axis.
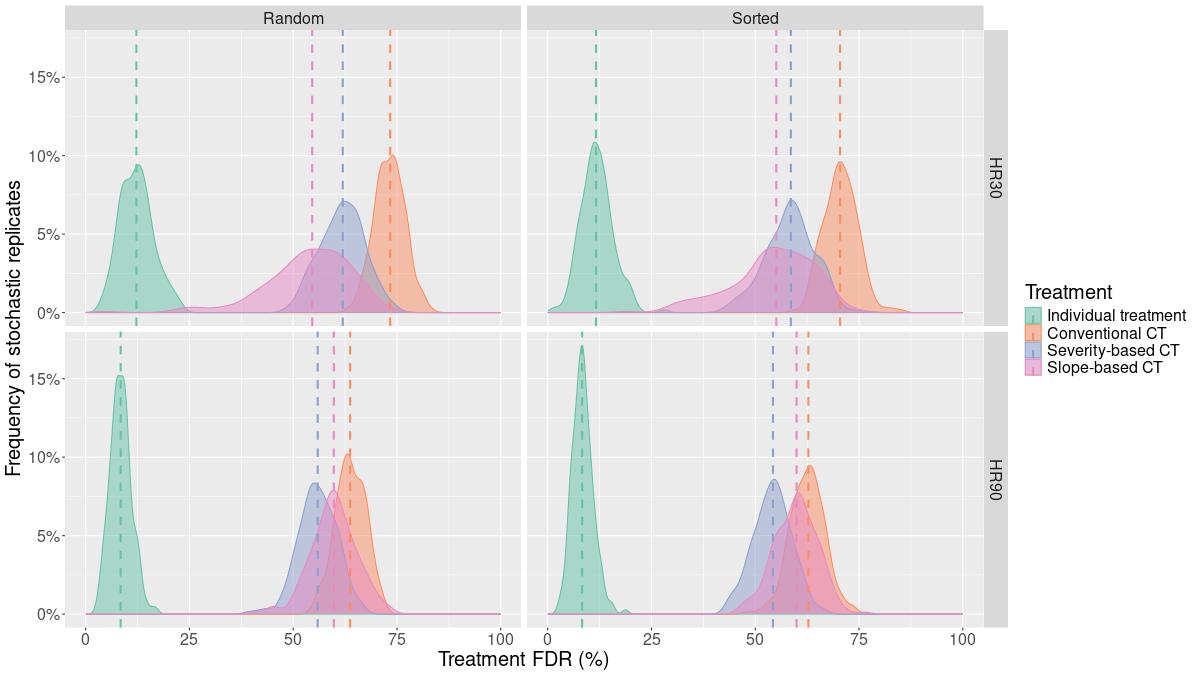
The treatment false discovery rate (FDR) was very low when only individual treatments were used and way higher for all collective treatments (Figure 3). In HR30, the median FDR of collective treatments was between 50 and 75%. The collective treatment with the lowest FDR appeared to be the one triggered by the slope criterion. Sorting pens did not appear to have a major effect on treatment FDR. Conversely, with HR90, the conventional collective treatment had the highest FDR and the one triggered by the severity criterion had the lowest.
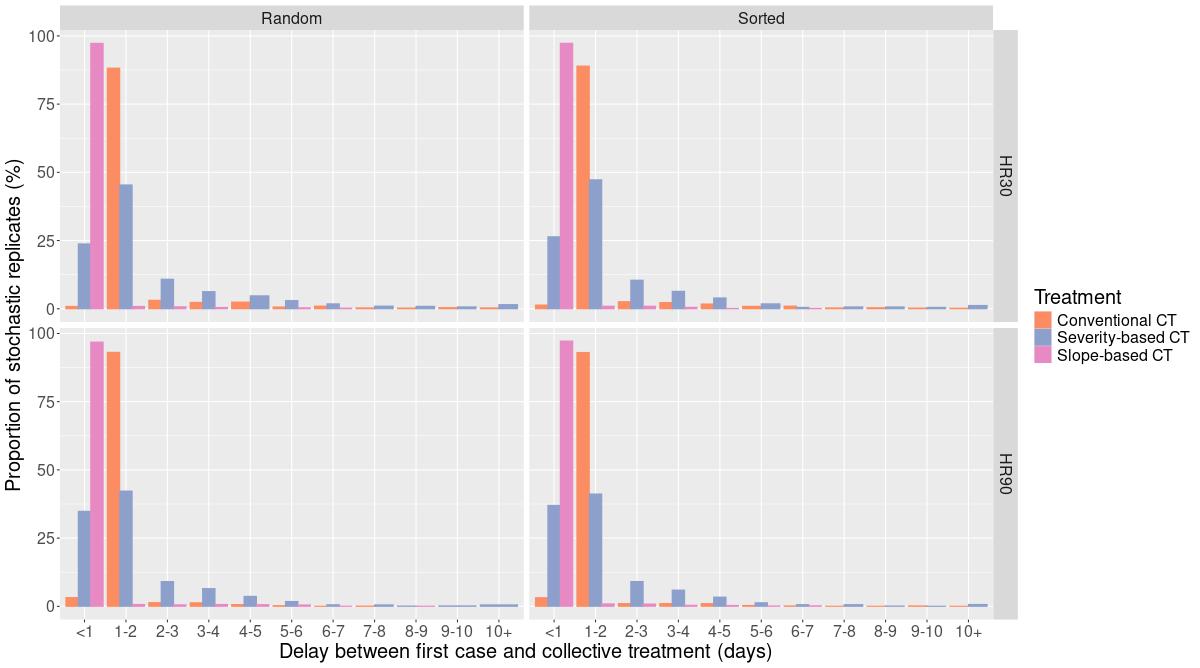
The criterion for triggering a collective treatment affected the delay between the detection of the first BRD case and the collective treatment (Figure 4). Indeed, when collective treatments where triggered with the slope criterion, the delay between the first case and the collective treatment was shorter than a day in the majority of the stochastic replicates, whereas this delay was more often between one and two days for the conventional criterion. Collective treatment triggered by the severity criterion were triggered in less than a day between 26% and 37% of the replicates with collective treatment. In around 43% of the cases, it was triggered between one and two days after the first case in the pen.
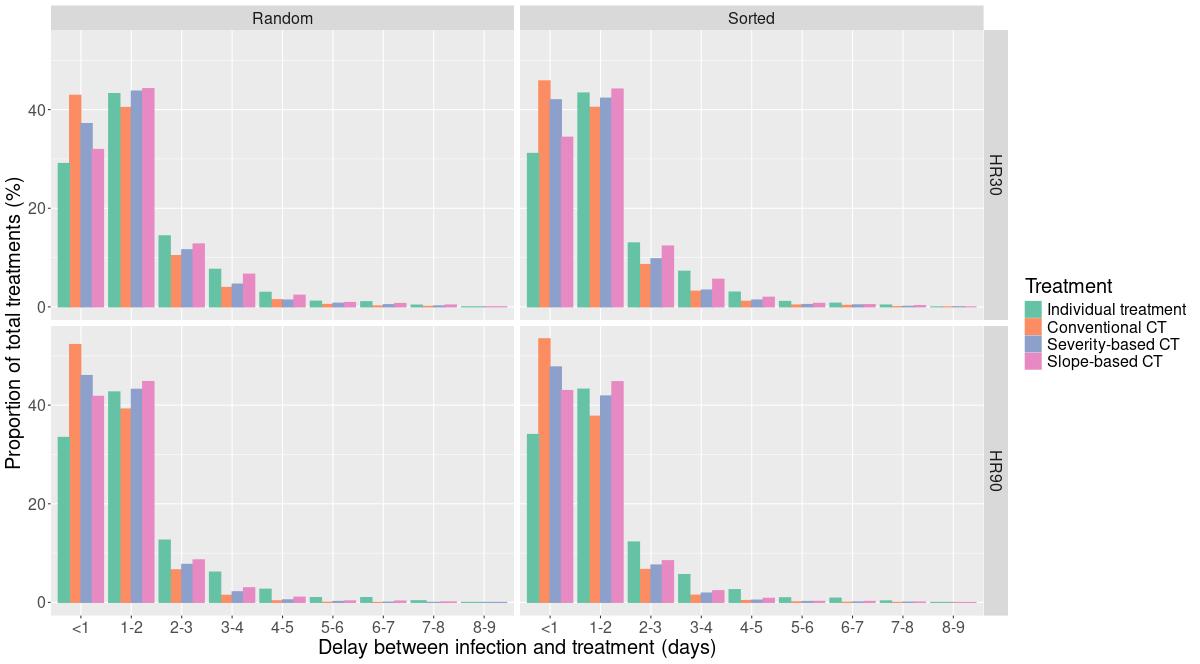
On an individual level, collective treatments shortened the delay between the infection and the treatment 5. The delay exceeded 2 days in less than 20% of the replicates in scenarios with collective treatments, while delays up to 9 days were observed in scenarios with individual treatments. Among collective treatment criteria, the conventional criterion yielded the biggest proportions of delays shorter than a day (up to 52 % in HR90 scenarios), while the other two criteria yielded similar results.
Pens containing animals of the same individual risk level were grouped together across the simulations to observe proportions of triggered collective treatment in each specific group (Table 1). A collective treatment was triggered in the most of the pens composed of animals with high risk of respiratory disease, irrespective of the criterion. The conventional criterion had the highest proportion of triggered collective treatments in pens composed of medium risk individuals (87%), while the severity criterion triggered a collective treatment in 58% of these pens and the slope criterion only triggered a collective treatment in 33% of them. In pens composed of low risk individuals, collective treatments triggered by the conventional criterion happened in 37% of the pens, while collective treatments based on the severity and slope criteria only happened in 14 and 4% of the pens respectively.
| Treatment strategy | Proportion of pens having triggered a collective treatment (%) | ||
| Low-risk pens | Medium-risk pens | High-risk pens | |
| Conventional CT | 35.9 | 83.9 | 99.7 |
| Slope-based CT | 5.5 | 33.8 | 85.6 |
| Severity-based CT | 12.6 | 58.1 | 91.8 |
Discussion
This study aimed at modeling the impact of triggering collective antimicrobial treatments according to three different criteria on the spread of M. haemolytica in multi-pens fattening systems while accounting for the multi-pen structure, individual risk of being affected by BRD and farming practices in terms of pens composition. We computed the cumulative incidence and the average duration of severe clinical signs. We put these outputs in balance with the AMU and treatment precision for each scenario. We also computed the delay between the beginning of an episode and the beginning of the treatment and calculated the proportion of pens triggering collective treatments based on each criterion. We proposed that a novel criterion, based on the speed of the spread rather than on a proportion of detected individuals, could yield a better trade-off between BRD cases incidence and AMU than the conventional way of implementing collective treatment. This result could have interesting operational implications on the decision-making regarding collective treatment in fattening farms.
We showed that collective treatment could efficiently reduce the incidence of bacterial respiratory disease in population with high individual risk of BRD. The positive impact on animal health and welfare balanced the supplementary cost in antimicrobial doses. This compromise in favour of reducing BRD impact was particularly relevant and valuable for high-risk individuals. This finding is consistent with a previous simulation study which implemented collective treatments on an âaverage pathogenâ with less strict thresholds ([32]). In American systems, medication of at-risk cattle is frequent at feedlot entry after their idenfication and the implementation of preconditionning programs ([15]). These programs has been studied in Europe, but the results remained inconclusive regarding their positive impact on animal health and welfare ([39]). The study however concluded that the cattle sector should focus its effort on bettering husbandry practices. This suggestion aligns with the use of a selective criterion for the implementation of curative collective treatments.
However, the supplementary cost in antimicrobial was less desirable when the general risk was lower in the population, as the reduction in incidence and severity thanks to collective treatment was less substantial. This suggests that a characterization of the risk level of the population could be beneficial for making the best decision regarding treatment and herd management ([11]).
Our model allowed us to identify a beneficial novel criterion for collective treatment. Indeed, instead of a threshold of detected animals in a pen, basing a collective treatment decision on the speed of the spread of the disease has proved to reduce the incidence and AMU. A field meta-analysis of randomized clinical trials showed that the risk reduction of BRD varied drastically with the criterion for collective treatment ([4]). The routine criterion is 10% of morbidity for two consecutive days, however, there is no evidence based studies proving the relevance of this threshold ([34]). Perspectives of this study include the investigation of the novel treatment strategies in broader contexts in order to translate the thresholds used into operative indicators.
Collective treatments based on the speed of the spread of the pathogen proved to be triggered sooner than with the other criteria. This precocity was key for the reduction of the incidence and severity of the disease, especially in high-risk populations. It also showed to target more specifically high-risk groups than the other criteria, as it reduced the proportion of low-risk pens having received collective treatments. On an individual level, the delay between the infection and the administration of the first dose of treatment was also characterized. This delay was shortened by the implementation of collective treatment strategies, particularly for the conventional criterion. These are original findings with clear practical implications, especially with regards to the need for a better knowledge by farmers of individual risk of animals developing BRD, in order to account for this information when constituting pens.
Our model simulated scenarios assuming the circulation of only one bacterial pathogen. BRD is essentially a multi-pathogen disease, and synergies between viruses and bacteria have been reported to change the disease dynamics and severity ([14])
. Further investigations of the effect of treatment strategies could be conducted in a context with mixed infections. However, quantifying the treatment response in such context is still a pending question ([13]).
Our study advocates for more transparency on the individual risk level for BRD in the cattle production system. Such a characterization could allow mindful investments for the farmers as well as more adequate control measures regarding housing and treatment. Indeed, our novel collective treatment criterion proved to be able to target at-risk pens while not applying treatments to lower risk pens.
This model provides a solid basis for testing these new criteria for triggering collective treatments vs. keeping only individual ones on other known respiratory pathogens or a combination thereof, in order to identify potential new operational recommendations on treatment strategies. Future work could also test the inclusion of automated tools for decision making regarding treatment.
Acknowledgements
We thank our colleagues from the BIOEPAR Dynamo team for their comments and advice on this work. We are most grateful to the INRAE MIGALE bioinformatics facility ([26]), for the use of their computing resources.
Fundings
This work has received funding from the European Union’s Horizon 2020 research and innovation program under grant agreement No. 101000494 (DECIDE) and from the French region Pays de Loire. This work was also supported by the French region Pays de la Loire (PULSAR grant).
Conflict of interest disclosure
The authors declare that they comply with the PCI rule of having no financial conflicts of interest in relation to the content of the article.
Data, script and code availability
The complete code for the model model can be found on this git repository: https://forgemia.inra.fr/dynamo/brd-models/brd-public/-/tree/PCI_animal_science2024. The version of the model used for this work is tagged under pci_animal_science_2024.
Annexe A SI1: Model graphic overview
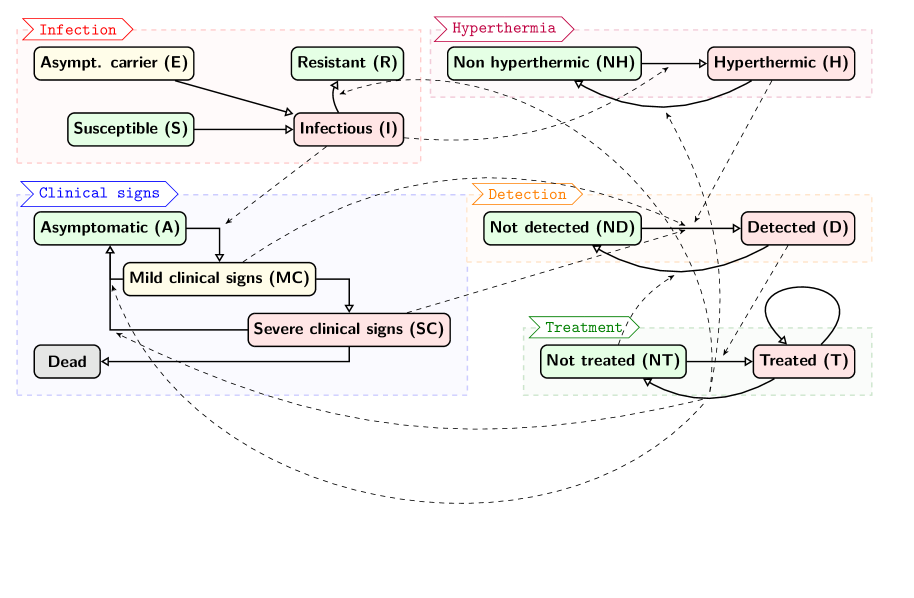
This supplementary information provides graphic overview of the states and processes of the model. We propose a formalism featuring the transitions from one state to another as well as the regulatory links existing between transitions. In this formalism, full arrows represent a transition from one state to another whereas the dashed lines represent regulatory links. Let be a regulator (state or transition) of transition . This will be represented by a dashed arrow starting from and targeting .
A.1 Model overview for M.haemolytica
Annexe B SI2: Model processes
B.1 Processes of the model
In the model, five processes drive the states of individuals: infection, hyperthermia, clinical signs, detection and treatment. They are represented by a formalism broadly used in computer science, finite state machines, which is close to flow diagrams used by epidemiologists, with a higher expressiveness. Their textual description in the YAML format in the model file is easy to read and can be automatically converted in a graphical representation by EMULSION. The model can be found on a git repository, accessible by following this link: https://forgemia.inra.fr/spicault/brd-withinherd-emulsion.git. The version of the model used for this work is tagged under pci_animal_science_2024.
To help understand the state machine diagrams, we present how the diagram summarising the infection process relates to the state machine specification, extracted from the whole model. More details on how state machines differ from flow diagrams are available in the documentation: https://sourcesup.renater.fr/www/emulsion-public/pages/Modelling_principles.html. The following subsections are directly drawn from Sorin-Dupont et al. 2023 [35] as they describe processes and transitions that remained unchanged from this previous version of the model.
B.2 Hyperthermia
Hyperthermia was composed of two states: hyperthermic (H) and non-hyperthermic (NH). NH animals could transition to H with probability attributed to non-infectious factors. Once in state H, they remained there for a period sampled from a Beta distribution adjusted using observed data, before reverting to NH. Additionally, the transitions from NH to H and back could result from the infection process.
B.3 Infection and clinical signs status
Four health statuses were considered: susceptible (S), asymptomatic carrier (E), infectious (I) and resistant (R) animals. Asymptomatic carriers could spontaneously turn I with probability and could also be infected by surrounding infectious individuals (I). Three actions were triggered when entering the state I: (1) the individual exhibited mild clinical signs for a duration drawn from a Beta distribution calibrated from observed data, (2) the animal changed from NH to H state, (3) a random draw with probability drove whether the individual would display severe clinical signs at the end of its mild clinical signs. If displaying severe clinical signs, a boolean deciding on the survival of the individual was drawn from a binomial law of probability . Death occurred at the end of the severe clinical signs duration (). If the individual did not die from infection, it then recovered and became resistant (R). Recovery occurred after duration drawn from a gamma distribution according to the given bacterial pathogen. Theoretically, is longer than . However, could exceed . In that case, the infectious period was . When transitioning to R state, animals changed from H to NH.
B.4 Detection status
Two detection methods were used. The first detection relied on visual on-farm appraisal of clinical signs, assuming lethargy was the most significant sign to calibrate the delay () between infection and severe sign occurrence. Severe clinical signs were detected with a sensitivity of 1, while the sensitivity for mild clinical signs detection was assumed to be 0.5. The model assumed a clinical check-up at every time step (12 hours). Following the detection of the first case through visual appraisal, all hyperthermic animals were identified and transitioned frome undetected state to detected using rectal temperature measured at the next feeding time, 12 hours later.
B.5 Treatment status
Each animal detected as diseased or hyperthermic, or in the context of collective treatment transitioned from not treated (NT) to treated (T). Treated animals received one antibiotic dose, assumed to be effective after a certain duration . If animals still exhibited clinical signs after this duration, they would be treated again for the same duration, but the number of treatments per individual per episode was limited (). Transitions from T to NT occurred in three cases: (1) recovery after due to successful treatment with probability , (2) the end of the infectious period occurred while under treatment but was not caused by it, (3) treatment failure after doses. A treatment success triggered the transition from I to R, consequently trigerring transitions driven by the end of the infectious state i.e. the transitions to non-hyperthermic and to asymptomatic states.
Annexe C SI3: Threshold selection for the Novel criteria for collective treatment
C.1 Method
In scenarios featuring collective treatment triggered by slope and severity criteria, the collective treatment was implemented when the respective criterion went above a certain threshold. Such a threshold thus had to be defined as a preliminary step of our study.
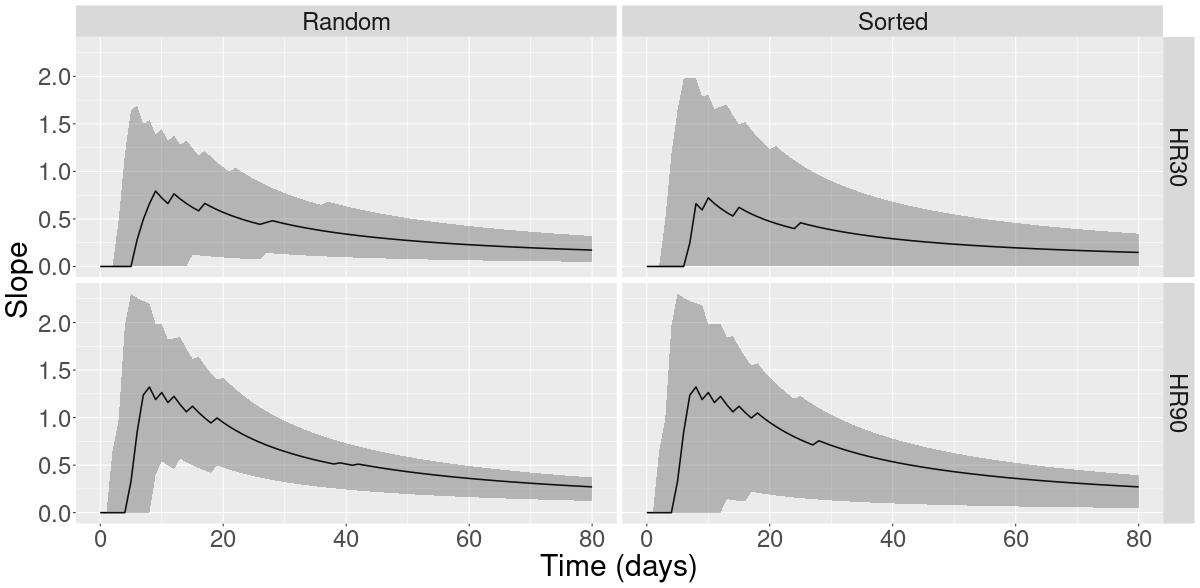
In order to determine the relevant threshold for intervention, we defined a range of viable threshold values. We thus plotted both criteria on baseline scenarios (without any collective treatments). This baseline scenarios was repeated along 200 stochastic replicates in order to obtain a distribution of values for each time step. For each time step, the median value, the 5th and 95th percentiles were recorded, thus resulting in three time series for each criterion and each scenario (Figures 7,8).
The interval was extracted from the HR30 Random scenario for both criteria. The upper bound was defined as the maximum point of the 95% quantile time series and the lower bound was defined by the maxium point of the median time series. The rationale behind this was to exclude values that would either be too low or too likely while also excluding any values that would be too high or too unlikely. Indeed, HR30 Random represents a baseline scenario and our selection allowed us to select only the higher half of the maximum values in this scenario. Thus, we obtained a credible range of for the severity criterion, discretized with intervals of 0.2. This criterion is also characterized by parameter , assumed strictly lower than 0.5 to emphasize the number of individuals with severe clinical signs. This parameter was assigned a credible range of with intervals of 0.1.
We used the same rationale for the selection of a credible range for the slope criterion. We thus selected a range encompassing the maxium value of the median run in the HR30-Random scenario and the maxium of the 95% quantile of this scenario. For the slope criterion, the credible range was thus , discretized by intervals of 0.05.
We tested each threshold value in scenarios defined by 3 possible farm-scale proportions of individual risk status of developing BRD and two ways of assigning animals to pens.
-
—
90%, 0% and 10% of low, medium and high risk respectively (HR10). This scenario was used as a ’best case scenario’, that should not be triggering collective treatment, thus allowing to discriminate thresholds that would be too sensitive.
-
—
30%, 40%, and 30% of low, medium, and high risk respectively (HR30)
-
—
10%, 0% and 90% of low, medium and high risk respectively (HR90)
Additionally, animals could be randomly assigned into pens (Random) or be assigned according to their individual risk level (Sorted).
For each threshold value in each scenario, we computed the median cumulative incidence and AMU in order to identify which threshold value had the best trade-off between case incidence and AMU.
C.2 Results
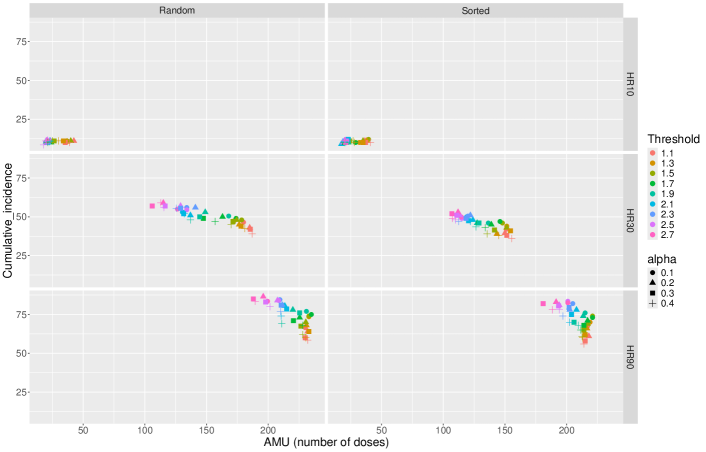
Lower thresholds were associated with higher AMU for every scenario, whatever the criterion. We chose to adopt a threshold that does not raise the AMU too greatly in a Low risk situation (HR10). Thus for the severity criterion, thresholds below 1.5 were exluded (Figure 9, top row). Among the included thresholds, 1.5 gave the lowest cumulative incidence with an value of 0.4 in the HR30 and HR90 scenarios. We thus selected this threshold and parameter value (Figure 9, middle and bottom rows).
The threshold values for the slope criterion did not have a meaningful impact on the AMU in the HR10 scenarios. We thus chose to exclude values leading to a meaningful increase in AMU in the HR30 scenarios, which led to exclude values below 1 (Figure 10, middle row). We chose 1 as a threshold because it decreased the cumulative incidence in a satisfactory way while not blowing up the AMU when compared to higher threshold values.
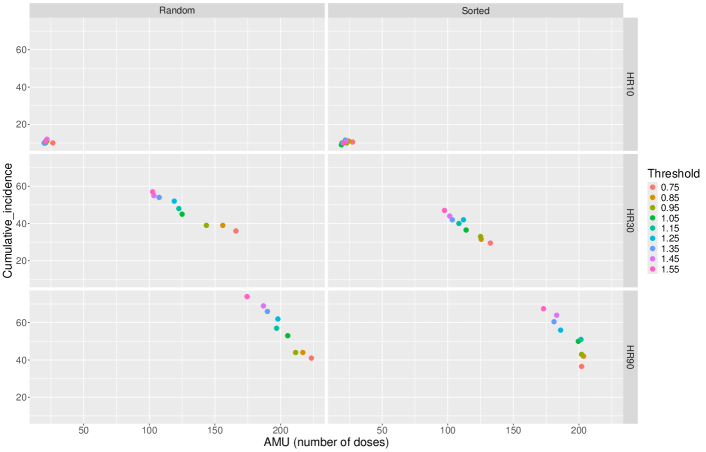
Threshold for the slope criterion: 1
Threshold for the severity criterion: 1.5
1
-
eng 1
-
en 1
-
en 1
-
English 1
-
en 1
-
en 1
-
en 1
-
en 1
-
en 1
-
en 1
-
en 1
-
eng 1
-
en 1
-
en 1
-
eng 1
-
en 1
-
eng 1
-
eng 1
-
Philadelphia 1
-
Saunders Philadelphia 1
-
eng 1
-
en 1
-
en
Références
- [1] K.. Abell, M.. Theurer, R.. Larson, B.. White and M. Apley “A mixed treatment comparison meta-analysis of metaphylaxis treatments for bovine respiratory disease in beef cattle” In Journal of Animal Science 95.2, 2017, pp. 626–635 DOI: 10.2527/jas.2016.1062
- [2] David E. Amrine, Jiena G. McLellan, Brad J. White, Robert L. Larson, David G. Renter and Mike Sanderson “Evaluation of three classification models to predict risk class of cattle cohorts developing bovine respiratory disease within the first 14â¯days on feed using on-arrival and/or pre-arrival information” In Computers and Electronics in Agriculture 156, 2019, pp. 439–446 DOI: 10.1016/j.compag.2018.11.035
- [3] S. Assié, H. Seegers, B. Makoschey, L. Désiré-Bousquié and N. Bareille “Exposure to pathogens and incidence of respiratory disease in young bulls on their arrival at fattening operations in France” Number: 7 In Veterinary Record 165.7, 2009, pp. 195–199 DOI: 10.1136/vr.165.7.195
- [4] Keith Edward Baptiste and Niels Christian Kyvsgaard “Do antimicrobial mass medications work? A systematic review and meta-analysis of randomised clinical trials investigating antimicrobial prophylaxis or metaphylaxis against naturally occurring bovine respiratory disease” In Pathogens and Disease 75.7, 2017, pp. ftx083 DOI: 10.1093/femspd/ftx083
- [5] Ken G. Bateman, S. Martin, Patricia E. Shewen and Paula I. Menzies “An evaluation of antimicrobial therapy for undifferentiated bovine respiratory disease” In The Canadian Veterinary Journal 31.10, 1990, pp. 689–696 URL: https://www.ncbi.nlm.nih.gov/pmc/articles/PMC1480842/
- [6] Claudia Blakebrough-Hall, Paul Hick, T J Mahony and Luciano A González “Factors associated with bovine respiratory disease case fatality in feedlot cattle” In Journal of Animal Science 100.1, 2022, pp. skab361 DOI: 10.1093/jas/skab361
- [7] Jeff L. Caswell, Ken G. Bateman, Hugh Y. Cai and Fernanda Castillo-Alcala “Mycoplasma bovis in Respiratory Disease of Feedlot Cattle” Number: 2 Publisher: Elsevier In Veterinary Clinics: Food Animal Practice 26.2, 2010, pp. 365–379 DOI: 10.1016/j.cvfa.2010.03.003
- [8] Shih-Yu Chen, Pedro Negri Bernardino, Erik Fausak, Megan Van Noord and Gabriele Maier “Scoping Review on Risk Factors and Methods for the Prevention of Bovine Respiratory Disease Applicable to CowâCalf Operations” Number: 3 Publisher: Multidisciplinary Digital Publishing Institute In Animals 12.3, 2022, pp. 334 DOI: 10.3390/ani12030334
- [9] Johann F Coetzee, Drew R Magstadt, Pritam K Sidhu, Lendie Follett, Adlai M Schuler, Adam C Krull, Vickie L Cooper, Terry J Engelken, Michael D Kleinhenz and Annette M OâConnor “Association between antimicrobial drug class for treatment and retreatment of bovine respiratory disease (BRD) and frequency of resistant BRD pathogen isolation from veterinary diagnostic laboratory samples” Number: 12 Publisher: Public Library of Science San Francisco, CA USA In PloS one 14.12, 2019, pp. e0219104
- [10] Alexis Delabouglise, Andrew James, Jean-François Valarcher, Sara Hagglünd, Didier Raboisson and Jonathan Rushton “Linking disease epidemiology and livestock productivity: The case of bovine respiratory disease in France” Number: 12 In PLOS ONE 12.12, 2017, pp. e0189090 DOI: 10.1371/journal.pone.0189090
- [11] T.A. Edwards “Control Methods for Bovine Respiratory Disease for Feedlot Cattle” In Veterinary Clinics of North America: Food Animal Practice 26.2, 2010, pp. 273–284 DOI: 10.1016/j.cvfa.2010.03.005
- [12] P. Ezanno, M. Andraud, G. Beaunée, T. Hoch, S. Krebs, A. Rault, S. Touzeau, E. Vergu and S. Widgren “How mechanistic modelling supports decision making for the control of enzootic infectious diseases” In Epidemics 32, 2020, pp. 100398 DOI: 10.1016/j.epidem.2020.100398
- [13] Robert W. Fulton, K. Blood, Roger J. Panciera, Mark E. Payton, Julia F. Ridpath, Anthony W. Confer, Jeremiah T. Saliki, Lurinda T. Burge, Ronald D. Welsh, Bill J. Johnson and Amy Reck “Lung Pathology and Infectious Agents in Fatal Feedlot Pneumonias and Relationship with Mortality, Disease Onset, and Treatments” Publisher: SAGE Publications Inc In Journal of Veterinary Diagnostic Investigation 21.4, 2009, pp. 464–477 DOI: 10.1177/104063870902100407
- [14] Maria Gaudino, Brandy Nagamine, Mariette F. Ducatez and Gilles Meyer “Understanding the mechanisms of viral and bacterial coinfections in bovine respiratory disease: a comprehensive literature review of experimental evidence” Number: 1 In Veterinary Research 53.1, 2022, pp. 70 DOI: 10.1186/s13567-022-01086-1
- [15] J.. González-MartÃn, L. Elvira, M. Cerviño LÃ^3pez, N. Pérez Villalobos, E. Calvo LÃ^3pez-Guerrero and S. Astiz “Reducing antibiotic use: Selective metaphylaxis with florfenicol in commercial feedlots” In Livestock Science 141.2, 2011, pp. 173–181 DOI: 10.1016/j.livsci.2011.05.016
- [16] Dee Griffin “Bovine Pasteurellosis and Other Bacterial Infections of the Respiratory Tract” Number: 1 In Veterinary Clinics of North America: Food Animal Practice 26.1, 2010, pp. 57–71 DOI: 10.1016/j.cvfa.2009.10.010
- [17] Dee Griffin “The monster we don’t see: subclinical BRD in beef cattle” Number: 2 Publisher: Cambridge University Press In Animal health research reviews 15.2, 2014, pp. 138–141
- [18] G.P. Grissett, B.J. White and R.L. Larson “Structured Literature Review of Responses of Cattle to Viral and Bacterial Pathogens Causing Bovine Respiratory Disease Complex” Number: 3 In Journal of Veterinary Internal Medicine 29.3, 2015, pp. 770–780 DOI: 10.1111/jvim.12597
- [19] W. Hilton “BRD in 2014: where have we been, where are we now, and where do we want to go?” Number: 2 Publisher: Cambridge University Press In Animal Health Research Reviews 15.2, 2014, pp. 120–122 DOI: 10.1017/S1466252314000115
- [20] Samuel E. Ives and John T. Richeson “Use of Antimicrobial Metaphylaxis for the Control of Bovine Respiratory Disease in High-Risk Cattle” In The Veterinary Clinics of North America. Food Animal Practice 31.3, 2015, pp. 341–350\bibrangessepv DOI: 10.1016/j.cvfa.2015.05.008
- [21] William C Kayser, Gordon E Carstens, Kirby S Jackson, William E Pinchak, Amarnath Banerjee and Yu Fu “Evaluation of statistical process control procedures to monitor feeding behavior patterns and detect onset of bovine respiratory disease in growing bulls” In Journal of Animal Science 97.3, 2019, pp. 1158–1170 DOI: 10.1093/jas/sky486
- [22] Cassidy L Klima, Trevor W Alexander, Steve Hendrick and Tim A McAllister “Characterization of Mannheimia haemolytica isolated from feedlot cattle that were healthy or treated for bovine respiratory disease”, 2012, pp. 8
- [23] Egle Kudirkiene, Anne Katrine Aagaard, Louise M.. Schmidt, Potjamas Pansri, Kenneth M. Krogh and John E. Olsen “Occurrence of major and minor pathogens in calves diagnosed with bovine respiratory disease” In Veterinary Microbiology 259, 2021, pp. 109135 DOI: 10.1016/j.vetmic.2021.109135
- [24] Ramanan Laxminarayan, Adriano Duse, Chand Wattal, Anita KM Zaidi, Heiman FL Wertheim, Nithima Sumpradit, Erika Vlieghe, Gabriel Levy Hara, Ian M Gould and Herman Goossens “Antibiotic resistanceâthe need for global solutions” Number: 12 Publisher: Elsevier In The Lancet infectious diseases 13.12, 2013, pp. 1057–1098
- [25] Peter Lees and Fariborz Shojaee Aliabadi “Rational dosing of antimicrobial drugs: animals versus humans” In International Journal of Antimicrobial Agents 19.4, 2002, pp. 269–284 DOI: 10.1016/s0924-8579(02)00025-0
- [26] “Migale platform | Migale” URL: https://migale.inrae.fr/
- [27] Espinasse J. Mornet P. “Le Veau : Anatomie, physiologie, élevage, alimentation, production”, 1977
- [28] Jason S. Nickell and Brad J. White “Metaphylactic Antimicrobial Therapy for Bovine Respiratory Disease in Stocker and Feedlot Cattle” In Veterinary Clinics of North America: Food Animal Practice 26.2, Bovine Respiratory Disease, 2010, pp. 285–301 DOI: 10.1016/j.cvfa.2010.04.006
- [29] N.. Noyes, K.. Benedict, S.. Gow, C.. Booker, S.. Hannon, T.. McAllister and P.. Morley “Mannheimia haemolytica in feedlot cattle: prevalence of recovery and associations with antimicrobial use, resistance, and health outcomes” Number: 2 In Journal of Veterinary Internal Medicine 29.2, 2015, pp. 705–713 DOI: 10.1111/jvim.12547
- [30] Annette M. OâConnor, Johann F. Coetzee, Natalia Silva and Chong Wang “A mixed treatment comparison meta-analysis of antibiotic treatments for bovine respiratory disease” In Preventive Veterinary Medicine 110.2, 2013, pp. 77–87 DOI: 10.1016/j.prevetmed.2012.11.025
- [31] TL Ollivett “BRD treatment failure: clinical and pathologic considerations” Number: 2 Publisher: Cambridge University Press In Animal Health Research Reviews 21.2, 2020, pp. 175–176
- [32] Sébastien Picault, Pauline Ezanno, Kristen Smith, David Amrine, Brad White and Sébastien Assié “Modelling the effects of antimicrobial metaphylaxis and pen size on bovine respiratory disease in high and low risk fattening cattle” Number: 1 In Veterinary Research 53.1, 2022, pp. 77 DOI: 10.1186/s13567-022-01094-1
- [33] Sébastien Picault, Yu-Lin Huang, Vianney Sicard, Sandie Arnoux, Gaël Beaunée and Pauline Ezanno “EMULSION: transparent and flexible multiscale stochastic models in human, animal and plant epidemiology” Number: 9 Publisher: Public Library of Science San Francisco, CA USA In PLoS computational biology 15.9, 2019, pp. e1007342
- [34] O.. Radostits “Herd health : food animal production medicine” Section: xi, 884 pages : illustrations ; 29 cm, 2001
- [35] Baptiste Sorin-Dupont, Sebastien Picault, Bart Pardon, Pauline Ezanno and Sebastien Assié “Modeling the effects of farming practices on bovine respiratory disease in a multi-batch cattle fattening farm” In Preventive Veterinary Medicine 219, 2023, pp. 106009 DOI: 10.1016/j.prevetmed.2023.106009
- [36] Putu Eka Sudaryatma, Kimika Nakamura, Hirohisa Mekata, Satoshi Sekiguchi, Meiko Kubo, Ikuo Kobayashi, Mawar Subangkit, Yoshitaka Goto and Tamaki Okabayashi “Bovine respiratory syncytial virus infection enhances Pasteurella multocida adherence on respiratory epithelial cells” In Veterinary microbiology 220, 2018, pp. 33–38 DOI: 10.1016/j.vetmic.2018.04.031
- [37] Stephanie A. Terry, John A. Basarab, Le Luo Guan and Tim A. McAllister “Strategies to improve the efficiency of beef cattle production” Publisher: NRC Research Press In Canadian Journal of Animal Science 101.1, 2021, pp. 1–19 DOI: 10.1139/cjas-2020-0022
- [38] E. Timsit, H. Christensen, N. Bareille, H. Seegers, M. Bisgaard and S. Assié “Transmission dynamics of Mannheimia haemolytica in newly-received beef bulls at fattening operations” Number: 3-4 In Veterinary Microbiology 161.3-4, 2013, pp. 295–304 DOI: 10.1016/j.vetmic.2012.07.044
- [39] E. Vanbergue, S. Assie, B. Mounaix, M. Guiadeur, F. Robert, D. Andrieu, N. Cebron, G. Meyer, A. Philibert and G. Foucras “Comparison between a complete preconditioning programme and conventional conduct on behaviour, health and performance of young bulls from small cow-calf herds” In animal 18.6, 2024, pp. 101169 DOI: 10.1016/j.animal.2024.101169
- [40] Jeffrey L. Watts and Michael T. Sweeney “Antimicrobial Resistance in Bovine Respiratory Disease Pathogens: Measures, Trends, and Impact on Efficacy” In Veterinary Clinics of North America: Food Animal Practice 26.1, 2010, pp. 79–88 DOI: 10.1016/j.cvfa.2009.10.009
- [41] Amelia R. Woolums, Brandi B. Karisch, Jonathan G. Frye, William Epperson, David R. Smith, John Blanton, Frank Austin, Ray Kaplan, Lari Hiott, Tiffanie Woodley, Sushim K. Gupta, Charlene R. Jackson and Michael McClelland “Multidrug resistant Mannheimia haemolytica isolated from high-risk beef stocker cattle after antimicrobial metaphylaxis and treatment for bovine respiratory disease” In Veterinary Microbiology 221, 2018, pp. 143–152 DOI: 10.1016/j.vetmic.2018.06.005
-
-
-
-
-
-
-
-
-
-
-
-
-
-
-
-
-
-
-
-
-
-