[a, b]Oscar Macias,
Reconstruction of highly inclined extensive air showers in GRAND
Abstract
The Giant Radio Array for Neutrino Detection (GRAND) aims to detect highly inclined extensive air showers (EAS) with down-going and up-going trajectories. Several working groups in the GRAND collaboration are developing methods to reconstruct the incoming direction, core position, primary energy, and composition of the showers. The reconstruction pipeline—currently under development in the France/IAP working group—relies on a model of spherical wavefront emission for arrival times, which is possible because the radio signals are generated far away from the antenna stations. The amplitude distribution of the signals at the antenna level is described by an Angular Distribution Function that considers various asymmetries in the data, including geomagnetic effects. In this contribution, we present preliminary results from testing our EAS reconstruction procedure using realistic mock observations.
1 Introduction
To enable neutrino astronomy, it is essential to determine their arrival direction with high accuracy. An angular resolution of would allow us to differentiate between nearby sources (e.g., [10]). This sensitivity is also crucial for directly distinguishing extensive air showers (EAS) caused by neutrinos from those caused by cosmic rays or gamma rays, as none of the latter are expected to originate from below the horizon [6, 8]. Moreover, reconstructing the arrival direction is crucial in determining the characteristics of EAS, such as the species and energy of the primary particle.
The Giant Radio Array for Neutrino Detection (GRAND) [2, 13] is a planned ultra-high-energy (UHE) observatory with extensive exposure at UHEs and exquisite angular sensitivity. The GRAND collaboration is developing and testing new reconstruction methods specialized for highly inclined EASs. Specifically, the collaboration is focused on three main tasks: (1) Creating a library of highly realistic air shower simulations, including signals with realistic noise—both instrumental and astrophysical in origin—that can be used to develop and test the new reconstruction pipelines. (2) Employing empirical and physics-informed models for reconstruction, as well as (3) advancing various electric field reconstruction methods based on first principles, measured polarization, and denoising algorithms. See Table 1 for an overview. In the following, we will highlight some preliminary results and advances on these topics.
| Reconstruction of highly-inclined Air Showers (conventional + ML methods) |
| 1. Realistic Data Simulation libraries | 1.1 Use both ZHAireS and CoREAS. 1.2 Include Galactic noise + antenna response + RF chain + GPS jitter |
|---|---|
| 2. Reconstruction of Air Showers | 2.1 Plane Wavefront (PWF) using timing and antenna positions [8] 2.2 Fitting empirical and Physics informed [11] models for the Angular Distribution Function (ADF) [6] 2.3 Empirical fitting of lateral distribution function 2.4 Graph Neutral Networks for EAS studies |
| 3. Electric field reconstruction and triggering algorithms | 3.1 Novel trigger algorithms [14, 5] 3.2 E-field reconstruction with CNNs 3.3 Direction reconstruction based on polarization 3.4 Denoising of E-field/ADC using ML methods |
 |
 |
2 Realistic Data Simulation Libraries
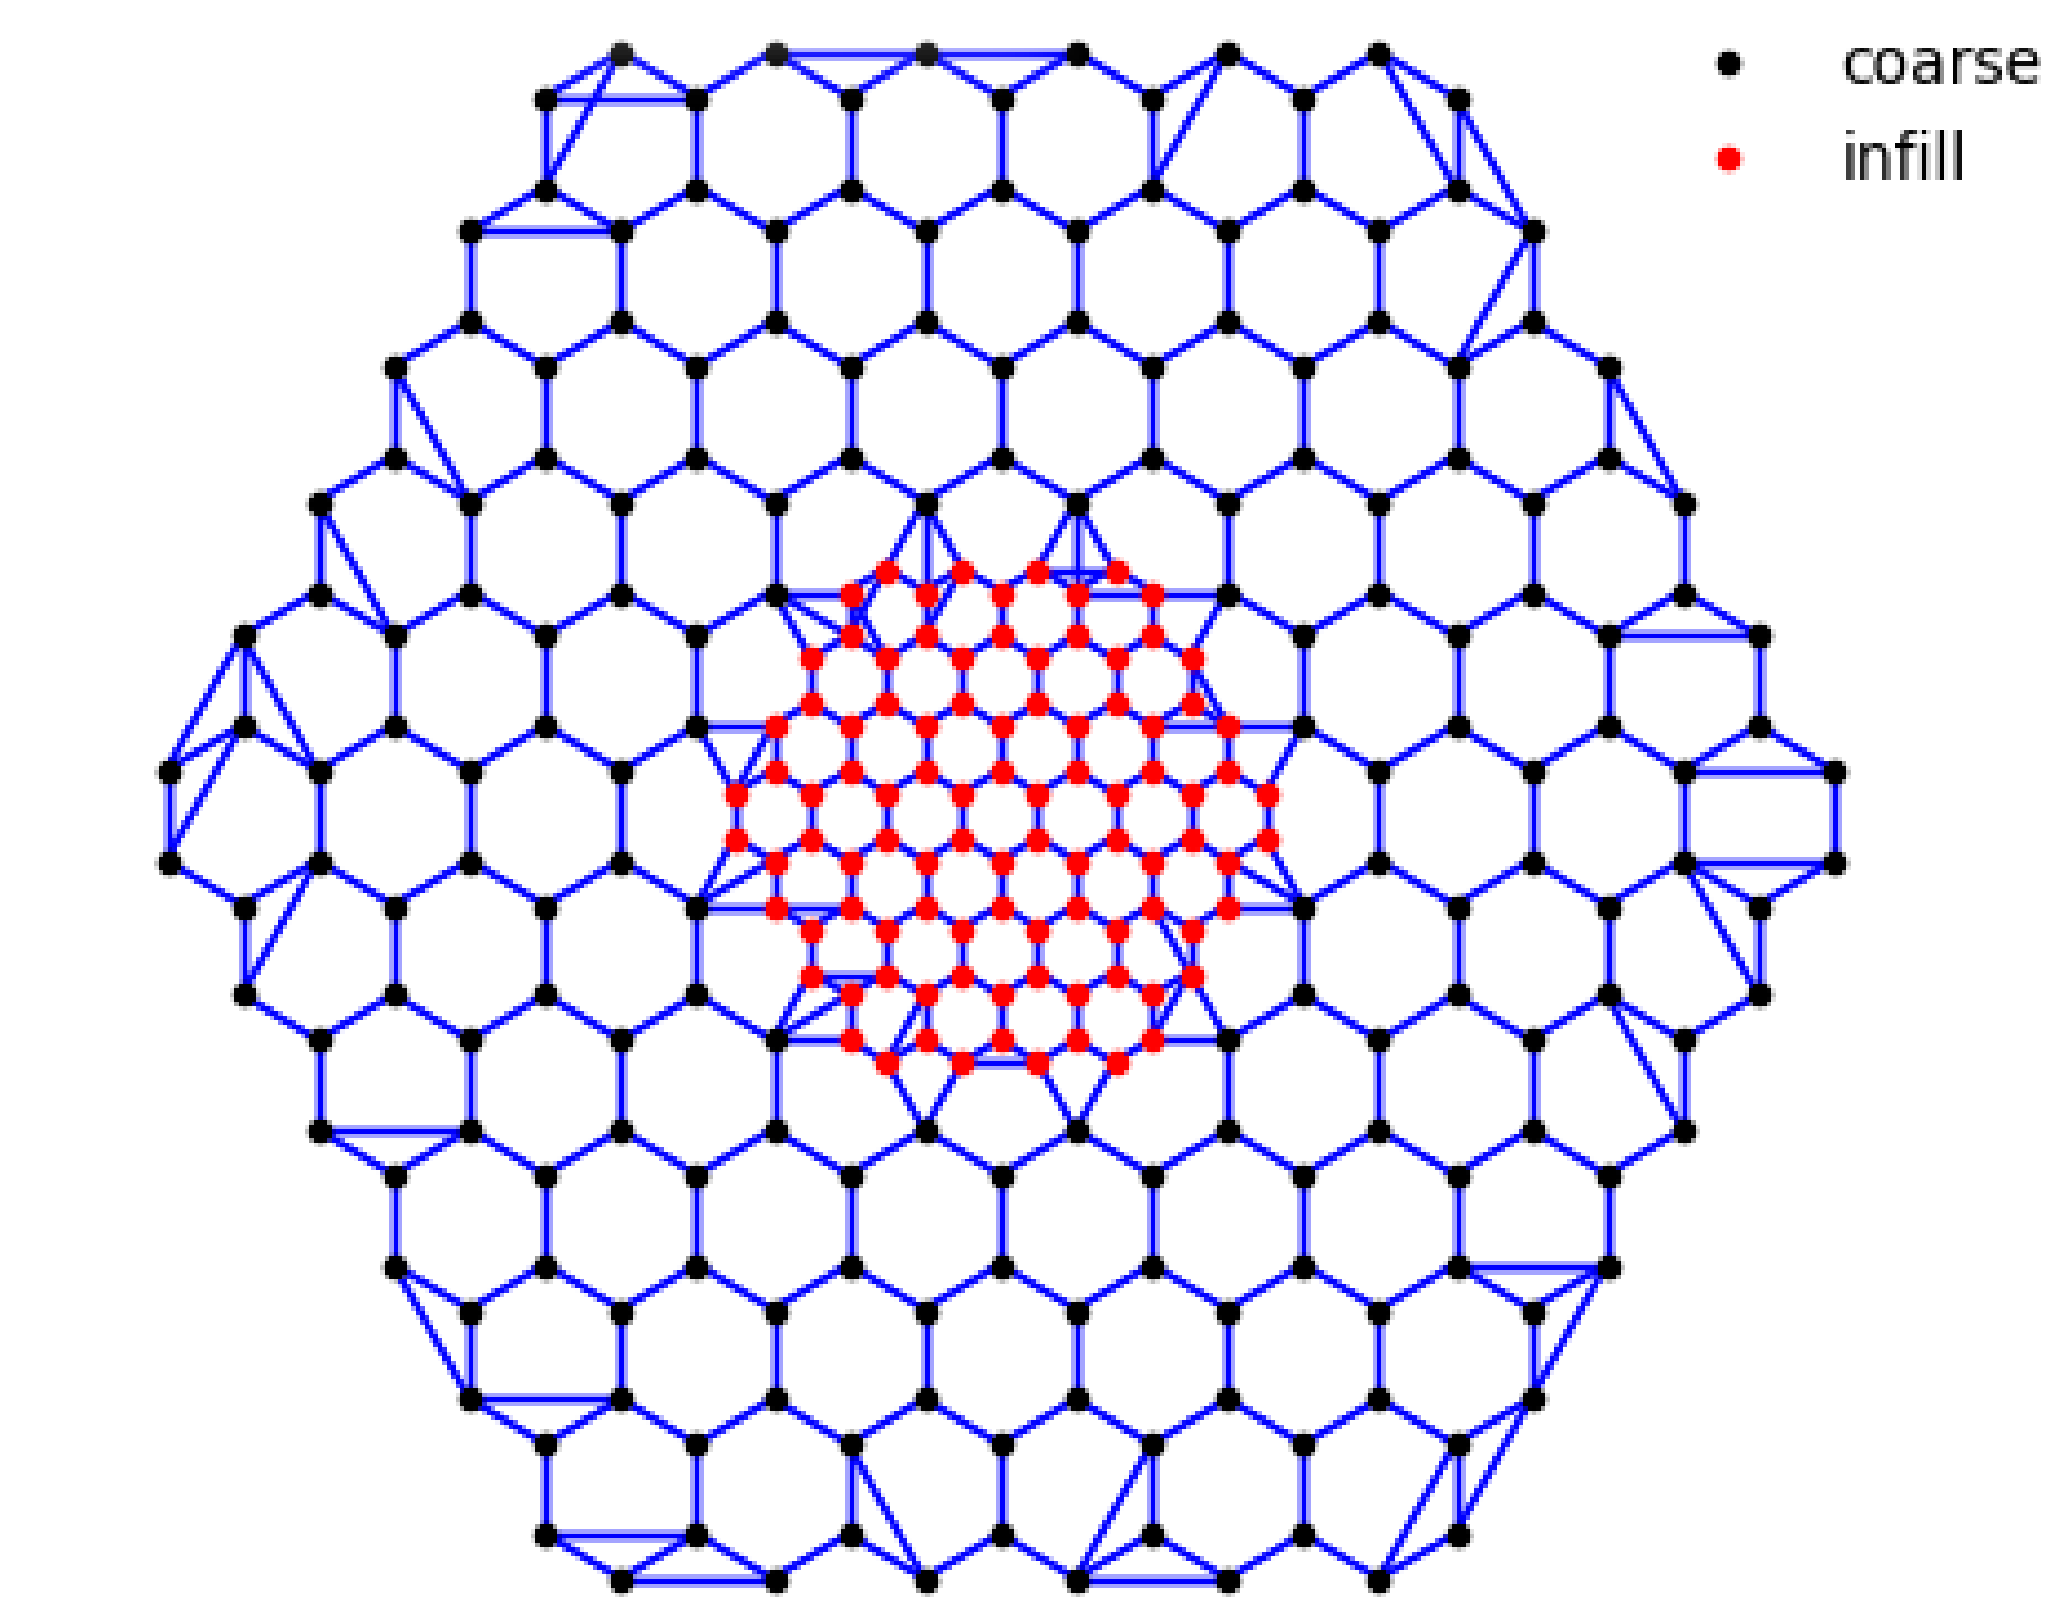
The “Data Challenge 2” (DC2) features a grid of 289 radio antennas in China’s Xiadoushan region. These antennas form a hexagonal pattern with a 1000 m spacing and a denser infill area where the spacing is 250 m. The simulations were created using both the ZHAireS [1] and CoREAS [12] software packages. Various actions were taken to ensure that the output from both packages had a compatible format. The simulations can be readily accessed and processed using the publicly available GRANDLib package [3]. The goal of this library is to be expansive and adaptable, meeting the needs of a diverse range of studies and emphasizing the development and testing of machine learning applications. In machine learning, it is essential to consistently cover a wide range of the model parameter space. To accomplish this, we use continuous parameter distributions, including a distinctive zenith angle distribution that smoothly encompasses all different footprint sizes. The full details of the simulations will be available in an upcoming publication.
3 Reconstruction of Air Showers in GRAND
Below, we highlight the preliminary results of two selected reconstruction procedures based on standard and machine learning methodologies being developed within the collaboration.
3.1 Empirical reconstruction method:
This method, first introduced in Refs. [6, 8], combines arrival time and signal amplitude to reconstruct the emission point, arrival direction, and amplitude in a step-by-step process. Detected arrival times are initially used to estimate the emission point assuming a plane wavefront (PWF) model, followed by a refinement using a spheroidal one. Then, using this reconstructed emission point and the recorded amplitude pattern on the ground, the position of the shower axis is determined, thus establishing the direction of the EAS. This method considers asymmetry features and signal attenuation during propagation [8]. Additionally, this approach enables the determination of the EAS’s energy and composition by examining the event’s geometry.
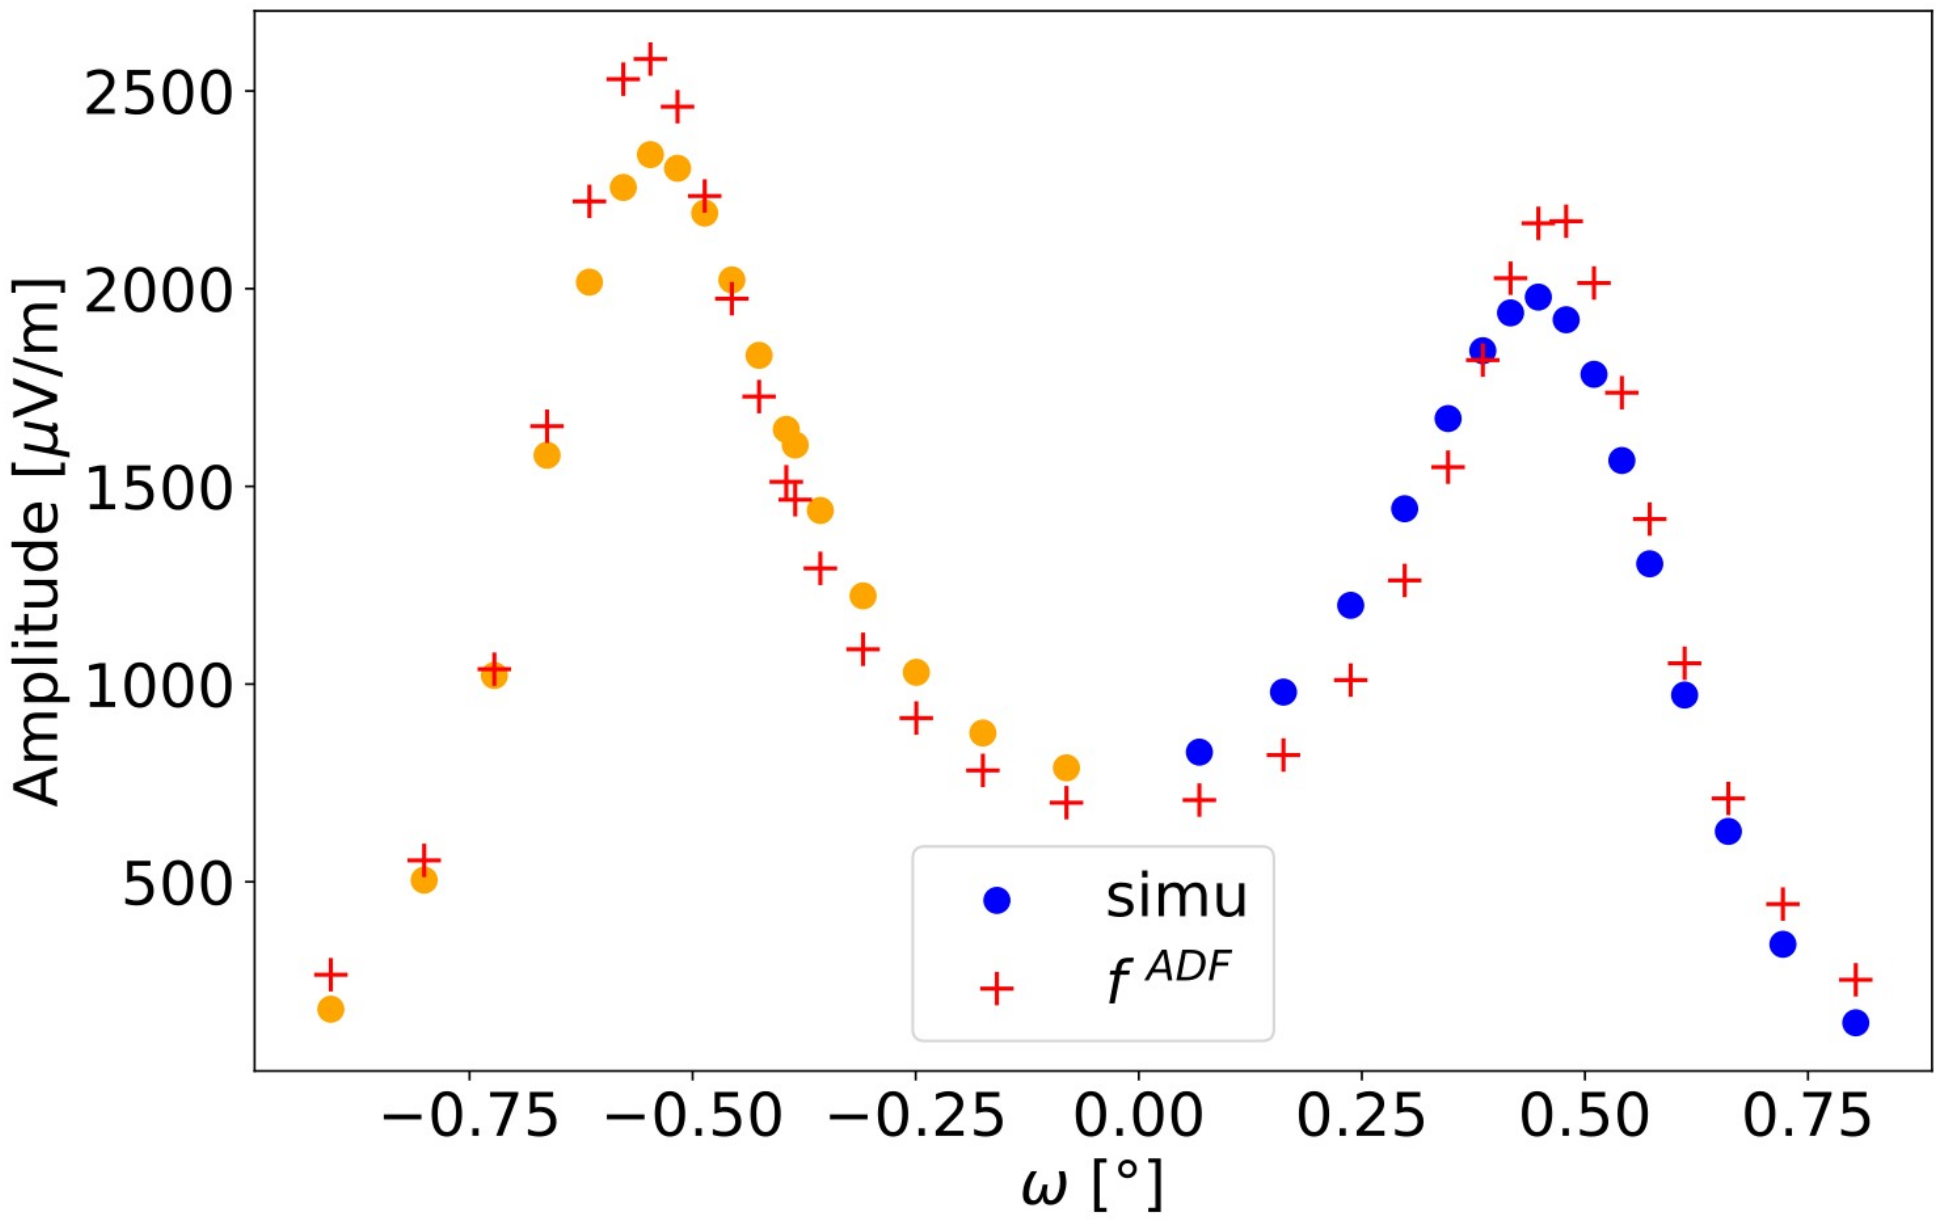
Figure 2 illustrates a comparison between the true and reconstructed directions of simulated UHECR events using only the PWF model (first step) of the empirical method. We considered only simplified (Gaussian) errors for this test 111Further details about our PWF implementation can be found in Ref. [9]. Similarly, Fig. 3 compares the angular distribution function (ADF) for a GRAND-Proto-300 (GP300) [4, 7] simulated event versus the reconstructed one. Consistent with previous findings presented in Ref. [6, 8], the pipeline demonstrates great potential, particularly for the most highly inclined events.
 |
 |
4 Reconstruction procedure based on Machine Learning algorithms
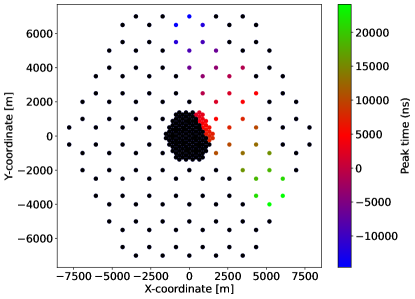
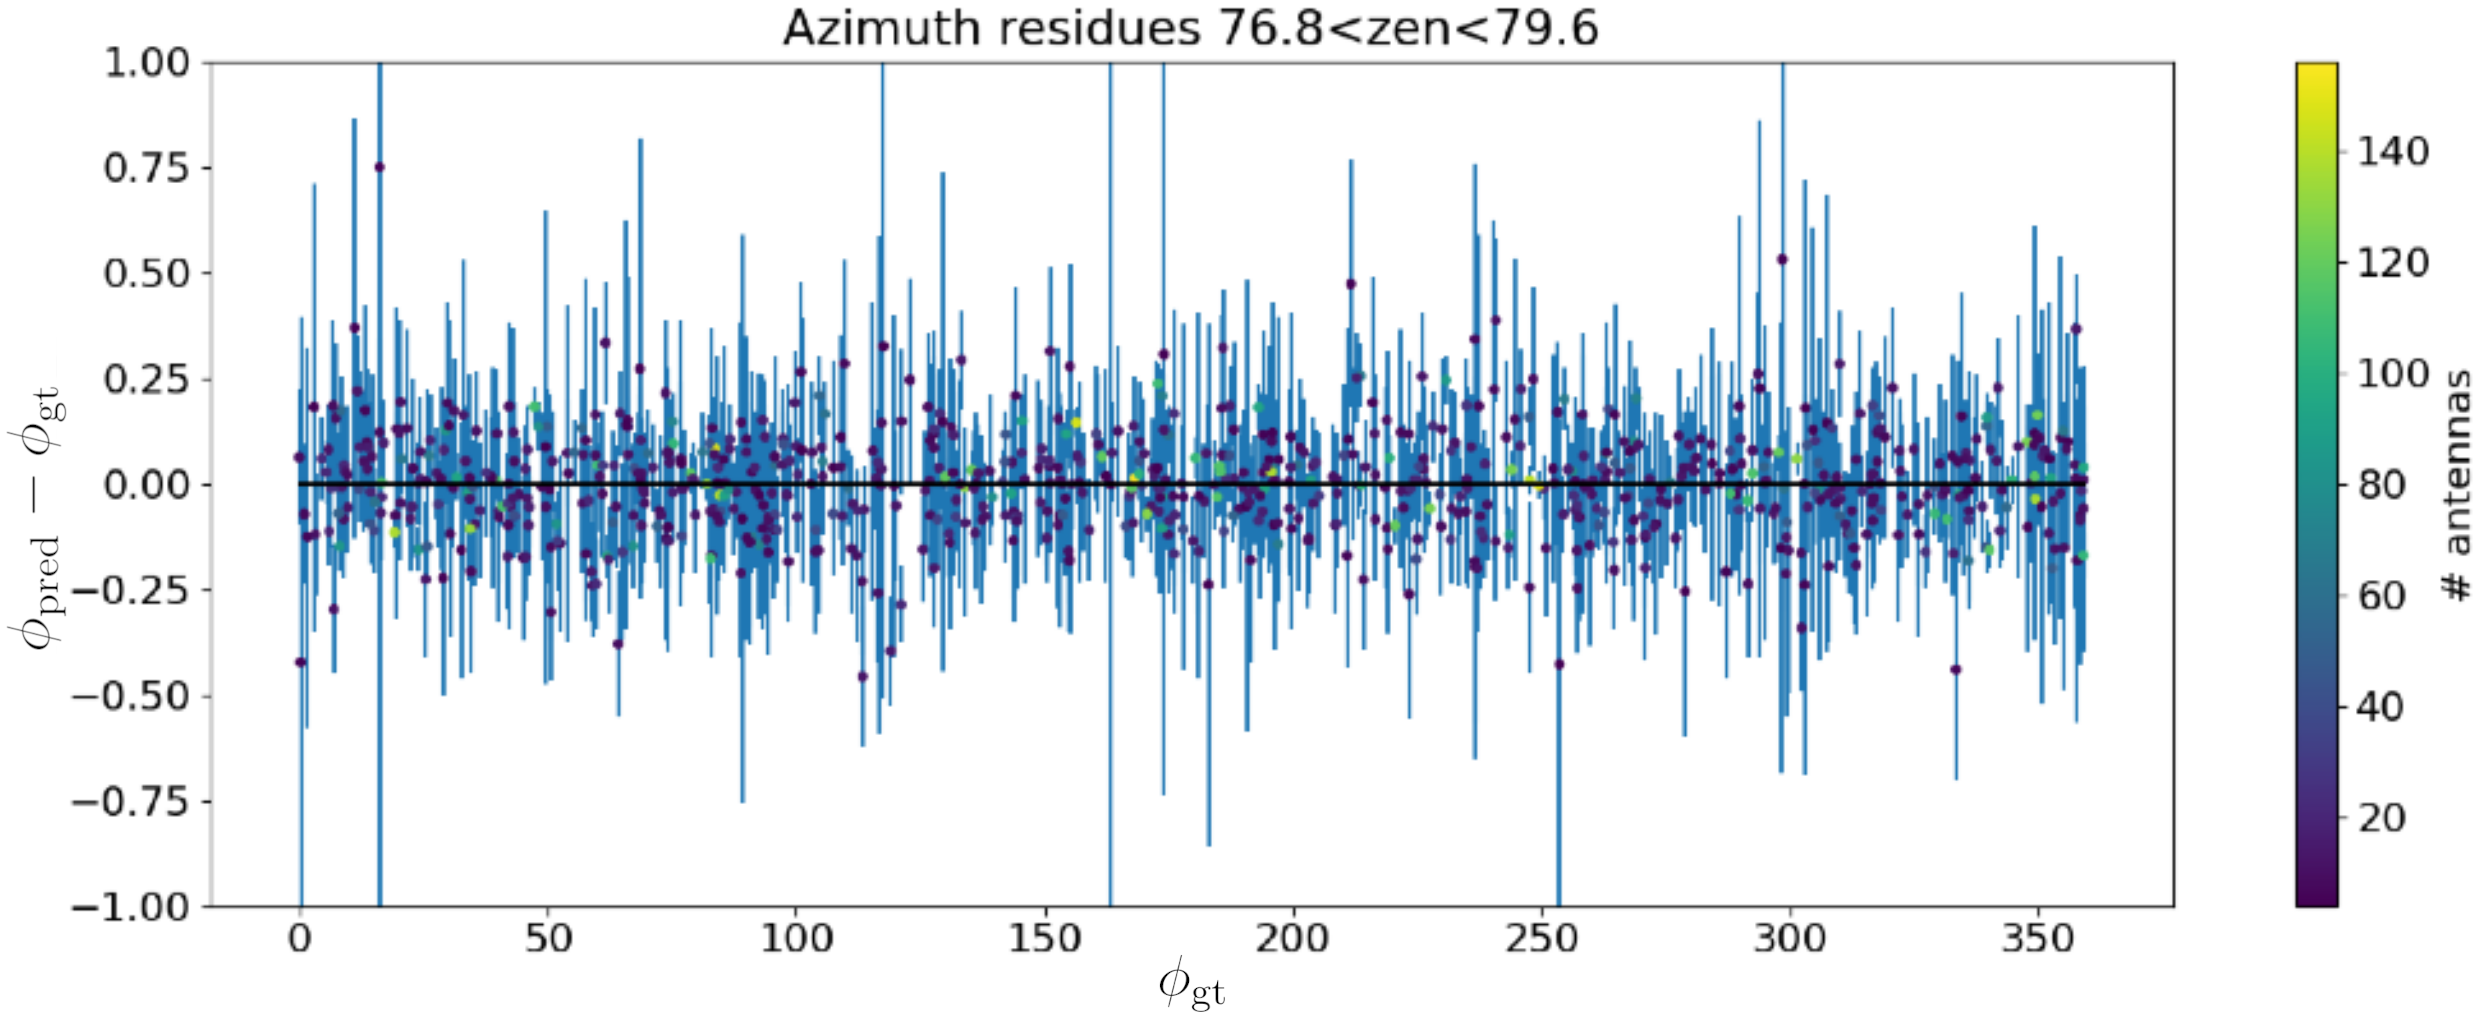
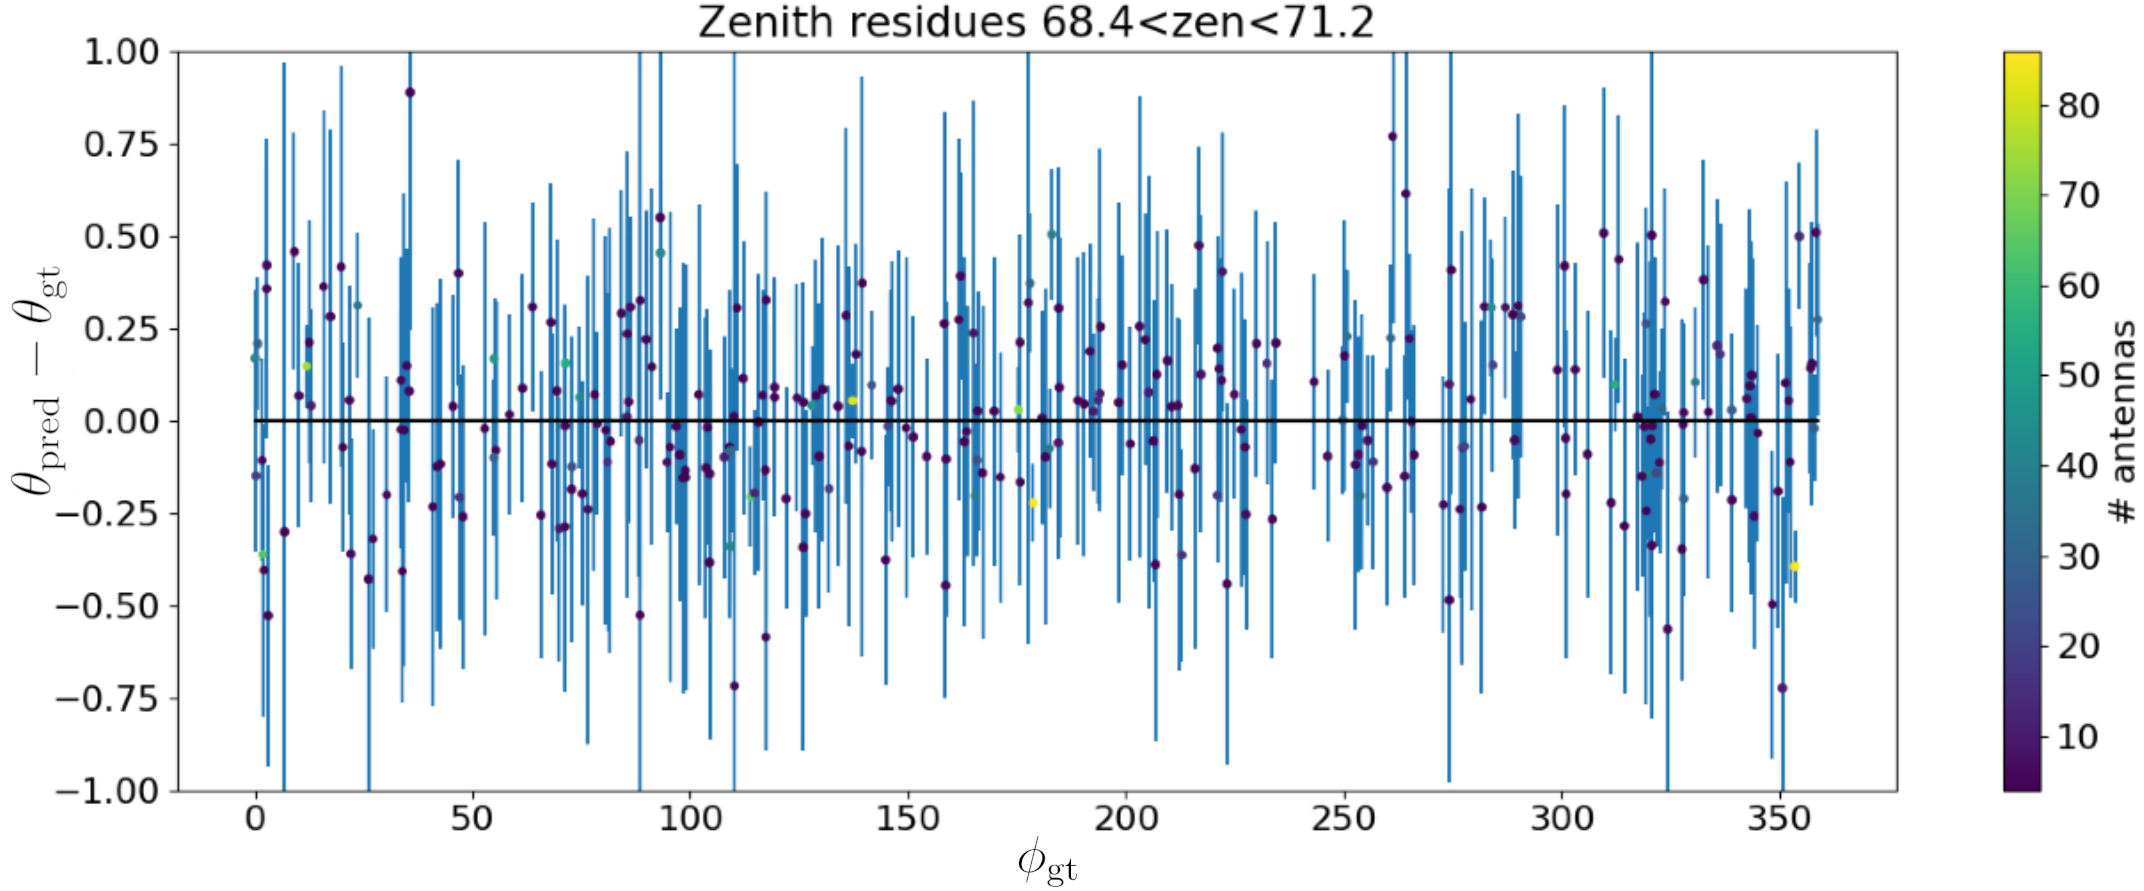
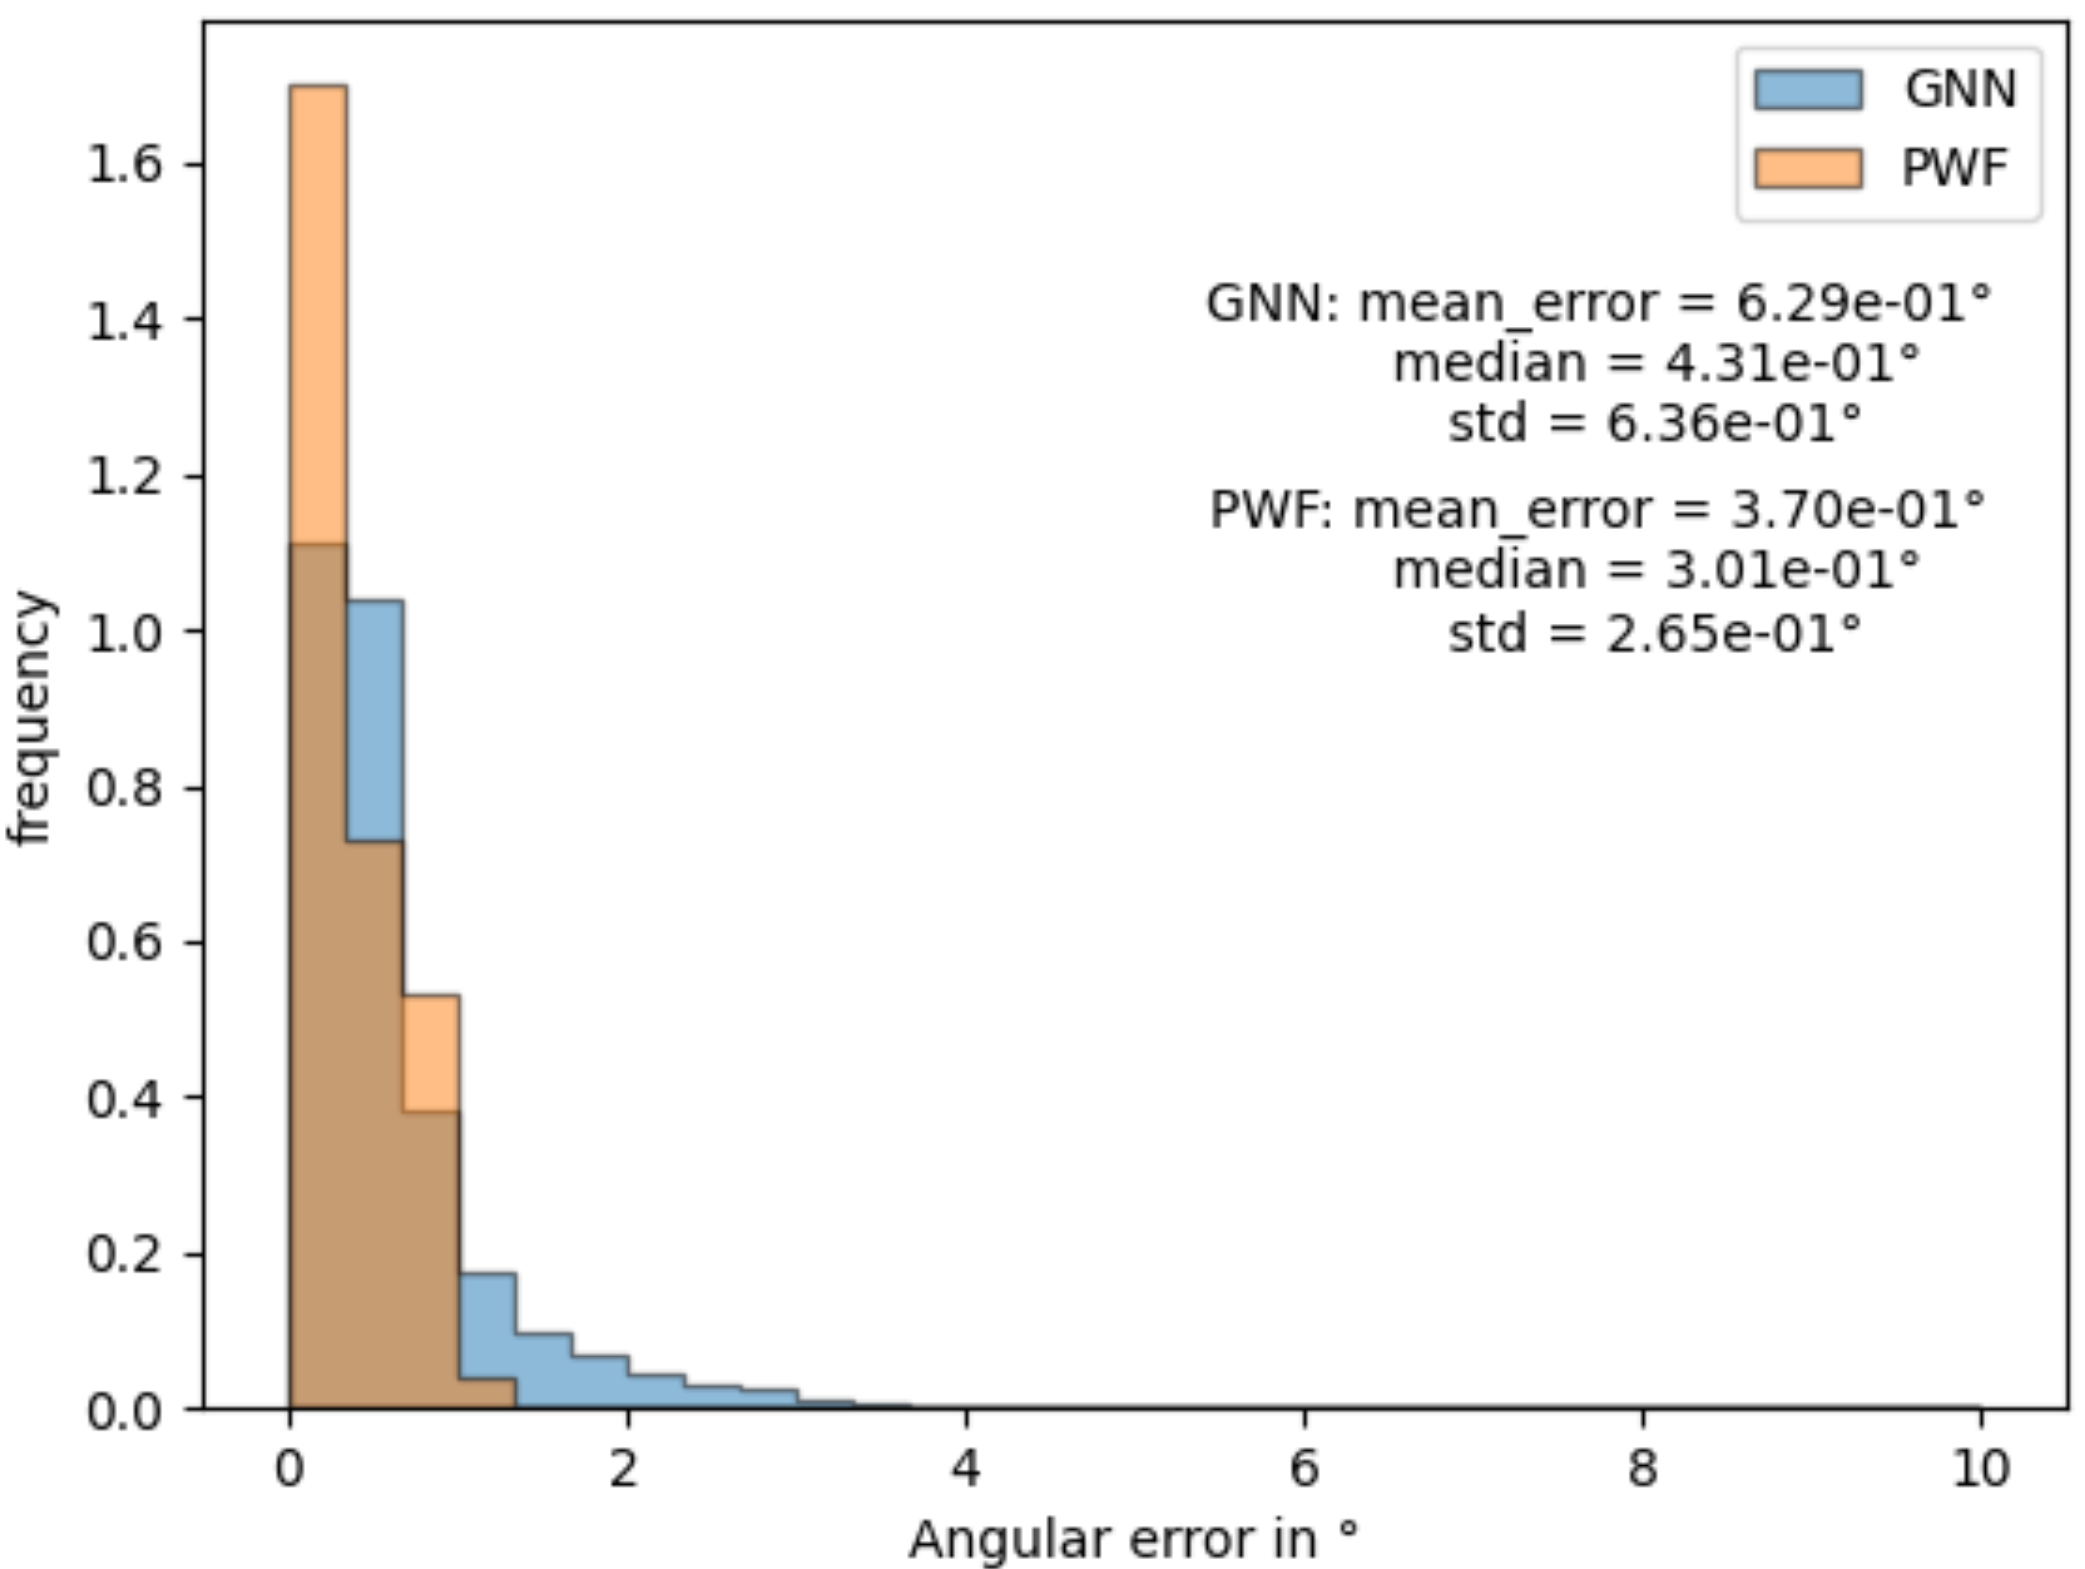
Extensive simulation studies (see Sec. 2) demonstrate that UHECR events create distinct antenna illumination patterns, encompassing electric field amplitudes and trigger times. This geometrical information is input into a Graph Neural Network (GNN) algorithm to represent GRAND events as point cloud graphs and utilize GNN for reconstruction. The model architecture, training configuration, and loss functions will be the subject of an upcoming publication. For now, we highlight preliminary results in Fig. 4 showing promising capabilities close to the more mature ADF algorithm.
5 Denoising of voltage signals using machine learning methods
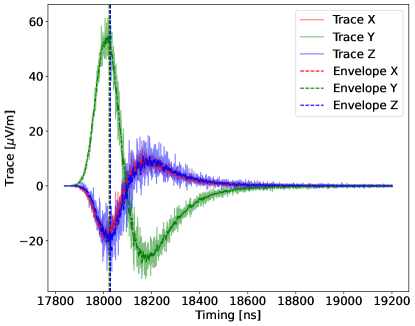
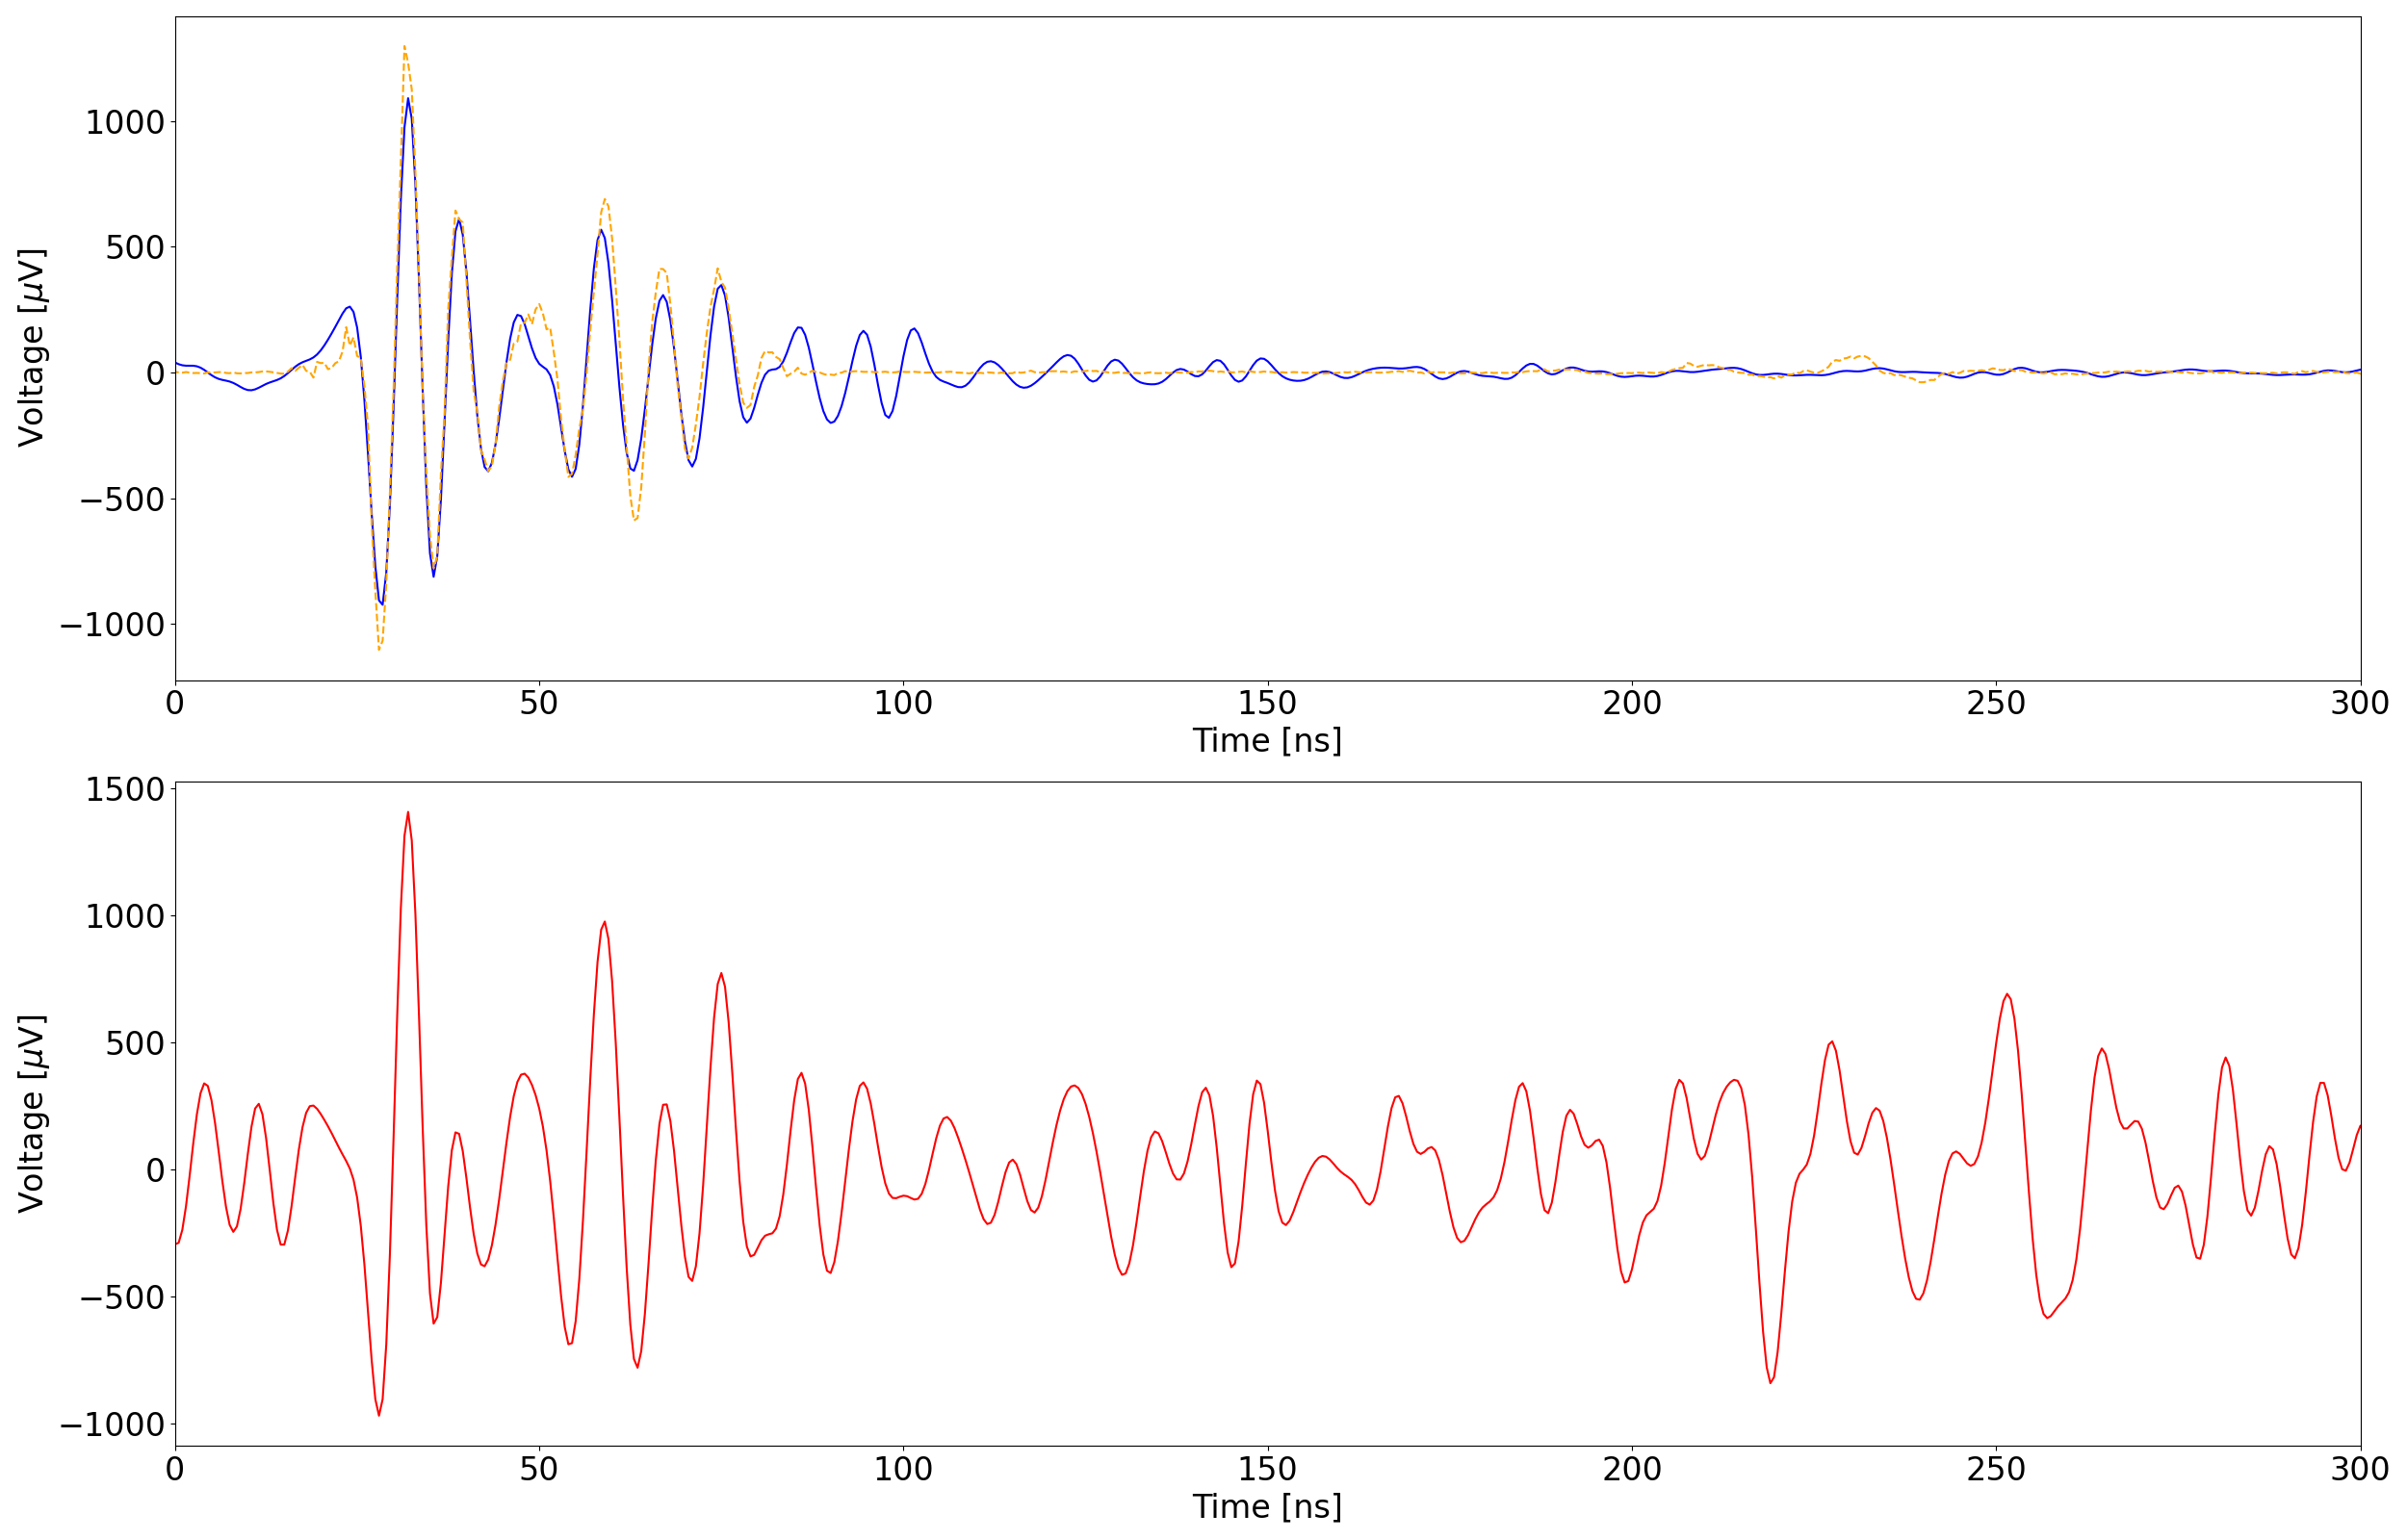
Autoencoders are potent machine learning algorithms recently employed for denoising data in the field of radio astronomy. It encodes data into a small latent space and then decodes it back again, eliminating unwanted features such as noise. The GRAND collaboration is developing a denoising pipeline using an autoencoder. It is trained using thousands of DC2 simulations containing voltage traces at the antennas at the antenna level. Figure 5 shows an example of a voltage signal with an . It is difficult to identify where the signal is visually, but the autoencoder can recover most of the signal. This enables it to recover the trigger time and the peak amplitude accurately. We have obtained preliminary promising results for SNRs greater than 3, but further validation work is required to confirm the method’s effectiveness fully.
6 Conclusions
The GRAND collaboration is advancing various reconstruction methods, which show promising results in preliminary testing with realistic mock observations. A combination of empirical methods where the physics is clearly understood and modern methods based on machine learning will allow us to gain efficiency and perform the necessary cross-checks for the reliable identification of the properties of UHE particles.
References
- Alvarez-Muñiz et al. [2012] Alvarez-Muñiz, J., Carvalho, W. R., Tueros, M., & Zas, E. 2012, Astroparticle Physics, 35, 287, doi: 10.1016/j.astropartphys.2011.10.002
- Álvarez-Muñiz et al. [2020] Álvarez-Muñiz, J., et al. 2020, Sci. China Phys. Mech. Astron., 63, 219501, doi: 10.1007/s11433-018-9385-7
- Alves Batista et al. [2024] Alves Batista, R., et al. 2024. https://arxiv.org/abs/2408.10926
- Chiche [2024] Chiche, S. 2024, PoS, ARENA2024, 059
- Correa [2024] Correa, P. 2024, PoS, ARENA2024, 060
- Decoene [2020a] Decoene, V. 2020a, PhD thesis, Paris, Inst. Astrophys.
- Decoene [2020b] —. 2020b, PoS, ICRC2019, 233, doi: 10.22323/1.358.0233
- Decoene et al. [2021] Decoene, V., Martineau-Huynh, O., Tueros, M., & Chiche, S. 2021, PoS, ICRC2021, 211, doi: 10.22323/1.395.0211
- Ferrière et al. [2024] Ferrière, A., Prunet, S., Benoit-Lévy, A., et al. 2024, arXiv e-prints, arXiv:2408.15677, doi: 10.48550/arXiv.2408.15677
- Guépin et al. [2022] Guépin, C., Kotera, K., & Oikonomou, F. 2022, Nature Rev. Phys., 4, 697, doi: 10.1038/s42254-022-00504-9
- Gülzow [2024] Gülzow, l. 2024, PoS, ARENA2024, 063
- Huege et al. [2013] Huege, T., Ludwig, M., & James, C. W. 2013, AIP Conf. Proc., 1535, 128, doi: 10.1063/1.4807534
- Kotera [2024] Kotera, K. 2024, PoS, ARENA2024, 057
- Köhler [2024] Köhler, J. 2024, PoS, ARENA2024, 061