Network transferability of adversarial patches in real-time object detection
Abstract
Adversarial patches in computer vision can be used, to fool deep neural networks and manipulate their decision-making process. One of the most prominent examples of adversarial patches are evasion attacks for object detectors. By covering parts of objects of interest, these patches suppress the detections and thus make the target object “invisible” to the object detector. Since these patches are usually optimized on a specific network with a specific train dataset, the transferability across multiple networks and datasets is not given. This paper addresses these issues and investigates the transferability across numerous object detector architectures. Our extensive evaluation across various models on two distinct datasets indicates that patches optimized with larger models provide better network transferability than patches that are optimized with smaller models.

Keywords Object Detection, Transferability, Adversarial Attacks, Adversarial Patches
1 Introduction and Related Work
As deep neural networks become increasingly mature and get included in everyday life, there is a growing demand for robust yet fast and accurate models. Robustness refers to the ability of a model to correctly handle new, corrupt, incomplete or noisy input data[1]. In addition to these naturally occurring impairments, a model can also be disturbed deliberately with so-called adversarial examples that are a side effect of the internal structures and training procedures of deep neural networks[2]. These carefully calculated patterns are induced into the input data to manipulate the model’s output in the attacker’s favor. As these patterns are typically tailored to specific models and datasets, their transferability, and broader relevance are often subjects of debate among critics.
This work gives a foundation for answering the question of transferability of adversarial patterns for real-time object detectors. Specifically, a total of 28 real-time object detectors are attacked with adversarial patches in an evasion attack [3] manner. The object detectors use the pre-trained weights, optimized on the COCO dataset [4]. Since most of the more recent state-of-the-art real-time object detectors are part of the YOLO [5] family, RT-DETR [6] is the only non-YOLO competitor. The key finding of this work shows (Figure 1), that the impact of adversarial patches on the mean average precision is significant high – even when these patches are trained on entirely different network architectures.
The fact that adversarial examples are transferable, has already been shown in different works. Yet, the research focus is mainly on high-frequent pattern [7, 8, 9, 10, 11, 12, 13, 14], that usually target image classifiers. Naseer et al. [8] examine cross-domain transferability and demonstrate the existence of domain-invariant adversaries. The learned adversarial function on entirely different domains as paintings, cartoons or medical images can successfully fool classifiers when applied to samples of ImageNet [15]. Cross-dataset transferability is investigated by Staff et al. [16]. They attack object detectors that have been learned with disjoint training sets with the targeted objectness gradient attack [11]. Their results suggest, that the more the training data of two models intersect, the more transferable the attack is. Alvarez et al. [13] investigate the transferability of different adversarial attacks between various image classifier architectures. Their results show, that stronger perturbations and comparable architectures result in better transferability. Interestingly, they observe that black-box attacks do not transfer at all.
In addition to directly accessing the transferability of attacks, various works [17, 14, 12, 9, 10, 7, 18] have focused on enhancing the transferability of adversarial examples. For instance, Wang et al. [14] validate empirically, that truncation of the gradient during back propagation by non-linear layers such as ReLU and max-pooling making the gradient imprecise regarding the input image to the loss function. As a result, they propose a novel Backward propagation attack to increase further the transferability of adversarial examples. Regarding the transferability of physical attacks against object detectors, Zhang et al. [18] suggest a novel learning method to produce adversarial patches by redistributing separable attention maps. A different approach is presented by Wei et al. [17] based on a generative adversarial network. Examples generated with the presented adversarial example generator have a better transferability and can be generated significantly faster than the compared method.
However, some works [19, 20, 21, 22] also conduct transferability studies for adversarial patches that attack object detectors, but as the transferability study is only of secondary interest, the discussion on this topic is consequently quite short.
As this is only a brief review of selected works, the interested reader is referred to these surveys [2, 3, 23] for a more profound overview. However, the presented results reveal a gap in the literature: the investigation of physical attacks on object detectors. To be more precise, there is no extensive empirical study on the transferability that offers more than a vague answer. This work addresses this issue and provides an empirical study on the transferability of the most popular real-time object detector family: YOLO [5]. To the best of our knowledge, this work is the first that offers an extensive evaluation of SOTA real-time object detectors of recent years.
The structure of the paper is as follows: Section 2 gives a more in-depth analysis of the calculated patches. The experimental setup as well as a description of the used datasets is given in section 4. The results are presented and discussed in section 5. Finally, section 6 summarizes the main outcomes and gives a brief outlook.
To ensure the reproducibility of our results, we provide the code used to create
the patches and the evaluation code in our
repository111https:
github.com/JensBayer/transferability.
2 Transferability of Adversarial Patches
Instead of directly going into the in-depth analysis of the patch properties, the optimization process of the patches is presented first. Afterward, the patches are analyzed with their corresponding t-SNE embeddings and compared statistically.
2.1 Patch Optimization
The patch optimization follows the procedure presented by Thys et al. [19]. Each investigated model uses the official provided pretrained weights on the COCO dataset [4]. The resolution of the patches is pixel. Each patch is initialized with random noise in the range [0,1] and is optimized with the AdamW [24] optimizer over 100 epochs with an initial learning rate of and a learn rate reduction by factor 10 each 25th epoch. During training, the patches are augmented by a random resize in the range of of the original bounding box size, a random color jitter, random perspective and a random rotation in the range of degree. To smoothen the patch and keep values in a valid range, a smoothening term and a validity loss are calculated. The final loss
| (1) |
is then given by the weighted sum of the smoothening, validity and target loss. The investigated patches are used in an evasion attack setting. Therefore, the optimization objective is to minimize the network activations when the trained patch is applied on objects of interest. As different architectures are used to generate patches, the target loss differs slightly for some model .
2.1.1 YOLOv7
YOLOv7[25] is the oldest investigated architecture group and still uses an objectness score to provide information about whether a certain anchor box contains an object at all. The loss term
| (2) |
is therefore set to be the maximum objectness score over all anchor boxes. Furthermore, the maximum is extracted before the final sigmoid activation and non-maximum suppression are applied.
2.1.2 Yolov8/v9/NAS/RT-DETR
For most of the investigated models (YOLOv8[26], YOLOv9[27], YOLO-NAS[28], RT-DETR[6]) the loss term
| (3) |
is given by the maximum class prediction score over all detected bounding boxes. Similar to the YOLOv7 group, the extraction of the maximum happens before the final sigmoid activation and non-maximum suppression are applied.
2.1.3 YOLOv10
In comparison to the previous architecture groups, YOLOv10[29] does not require a non-maximum suppression. Instead, a dual label assignment is used. As a result, the loss term
| (4) |
is calculated in the same manner as the previous methods, but considers both heads.
3 Patch Properties
3.1 Inception t-SNE Analysis
Instead of directly embedding the patches pixelwise with a t-distributed stochastic neighbor embedding (t-SNE), a more sophisticated analysis variant is chosen. Inspired by the Inception Score [30] and motivated by the fact, that a pixelwise comparison of patches fails to capture similar structures located differently within patches, the patches are first activated with the Inceptionv3[31] network. The features of the last convolutional layer of the network are used as the input for the t-SNE analysis.
Each data point of the resulting plot (see Figure 2) refers to a single patch. The color determines the origin, the symbol provides information about the general architecture used to train, and the size of the symbol encodes the relative mean average precision (mAP) [4] drop of the patch. By using this representation, the clusters of the different architecture groups and networks become visible. For example, almost all YOLOv7 patches are located below and . In addition to the obvious clusters, the relative mAP drop of different clusters becomes visible. The larger the symbol, the higher the mAP drop is. Clusters that are further away from the center result in a lower mAP drop and perform therefore worse, compared to the more central ones. These more distant patches originate from the RT-DETR architectures and the YOLOv8-s network. As depicted in Figure 1, the patches trained with these networks suffer from a low overall mAP drop.

3.2 Histogram Analysis
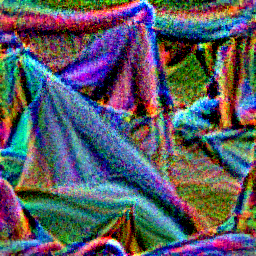
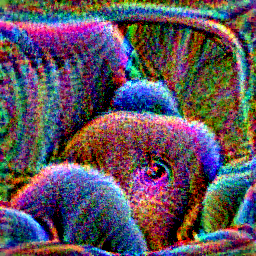
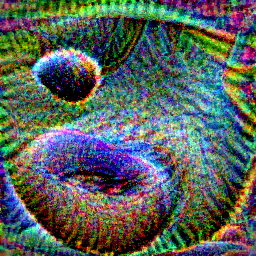
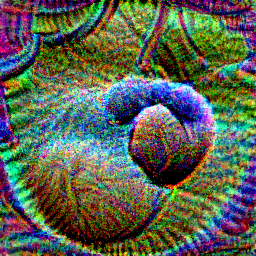
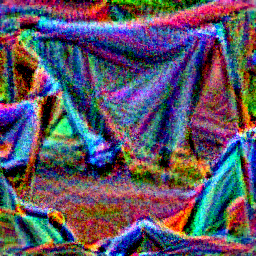
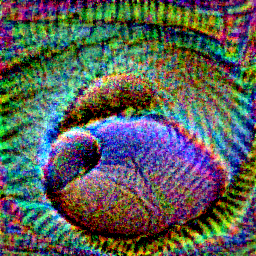
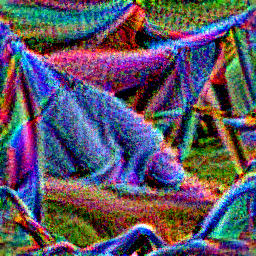
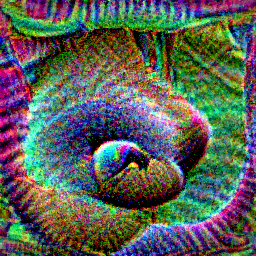
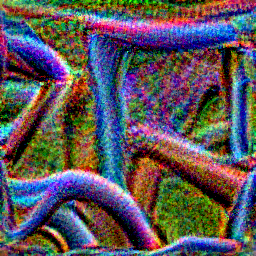
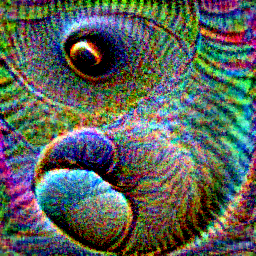
To check if the YOLOv8-s patches differ in a certain way regarding the overall color distribution, the histograms of both, the RGB (see Figure 4) and the HSV (see Figure 5) values are analyzed. Both plots contain three columns and three rows. Each row depicts the histogram of a certain RGB or HSV channel. The first column refers to the first patch (Figure 3, top left) generated with the YOLOv8-s network. The second column to the histogram of all ten patches (Figure 3), generated with the YOLOv8-s network. The third row is the histogram of all 280 patches regarding the architecture.
All three RGB channels show spikes at the lowest (0) and highest (255) values. This is true whether it is the single YOLOv8-s patch, all YOLOv8-s patches or all generated patches. The distributions of the histograms regarding the channels are also quite similar, as the values in Table 1 show. However, aside from these spikes, the histograms offer limited insight as they do not indicate which colors dominate in a patch. To gain a clearer understanding of color distribution, an additional HSV analysis is performed, as illustrated in Figure 5. This way, the color distributions among the patches becomes visible. Similar to the previous spikes, the hue histograms in the first row show three spikes for red, green, and blue. Again, the HSV histograms of the single YOLOv8-s patch are comparable with the histograms of all YOLOv8-s patches and the histograms of all patches. Yet, differences are visible, especially in the hue and saturation histograms.
| Channel | Source | Mean Std. | Median | Skewness | Kurtosis |
|---|---|---|---|---|---|
| Red | Single v8n | ||||
| All v8n | |||||
| All | |||||
| Green | Single v8n | ||||
| All v8n | |||||
| All | |||||
| Blue | Single v8n | ||||
| All v8n | |||||
| All |


4 Experimental Setup
To ensure a fair comparison, all patches are embedded at the same positions and the same scaling within the bounding boxes of objects of interest. That is, the center of a ground truth bounding box with a scale equal to 0.75 times the shorter side of the bounding box. To have a reference on how important the covered area is, the performance of the networks is measured, when the same area is covered with different grayscale levels. Similar to the optimization procedure, the evaluated networks use the official provided pretrained weights on the COCO dataset. The relative mean average precision drop is used to quantify the performance of a patch. First, the mAP of a detector is calculated when no patches are present in the test data. Then, the mAP is calculated again, when the bounding boxes of objects of interests contain the patches. Finally, the difference between the two mAP values is calculated.
The patches are optimized for the exemplary reference category “Person”. As a result, the training dataset is the INRIA Person Dataset [32]. The evaluation is performed on two datasets. In addition to the test set of the INRIA Person dataset, images of the COCO test set that contain objects of the target category are evaluated as well.
5 Evaluation

Figure 1 and Figure 6 summarize the evaluation results. Networks that are used to train a patch are mapped on the x-axis. The evaluated networks are mapped on the y-axis. In addition to the optimized patches, we also checked the impact of noise or grayscale patches on the evaluated networks. The results are located in the first two columns, next to the rowwise mean. The color of a single entry of the heatmap encodes the relative mAP drop a patch causes. The brighter the color, the higher the mAP drop is.
When inspecting the heatmap in Figure 1, the rightmost dark vertical block is prominent. Here, the overall tone is remarkably darker than the rest of the heatmap. Only the YOLOv8-s and YOLOv8-n networks perform similarly. This block belongs to the YOLO-NAS and RT-DETER architecture groups. The patches trained with these architectures are by far less transferable in comparison to the YOLOv9 or YOLOv10 architectures. Furthermore, almost every architecture group optimizes more efficient patches in terms of attacking the YOLO-NAS architecture, than patches trained with the architecture per se. The exception here is again the RT-DETR and the YOLOv8-s and YOLOv8-n architecture. The same is true for the RT-DETR architecture group. Yet, this group is more resistant against patches optimized with YOLOv7 and YOLOv8.
The highest mAP drops are achieved with the YOLOv10 and YOLOv9 architectures. Moreover, networks of these architecture groups are more resistant against patches that are optimized with networks of the remaining architecture groups, as long as the networks are large enough. A general observation is, that a larger network usually produces better patches than a smaller network of the same architecture group. This is also sometimes, but not always across all architectures, the case (e.g., YOLOv7-e6e).
The results achieved on the COCO test set (see Figure 6) are consistent with those from the INRIA Person dataset. Patches produced with YOLO-NAS, RT-DETR and the two small YOLOv8 networks perform much worse than the rest. Surprisingly, the YOLOv7 networks are much more sensitive to the patches compared to the results achieved with the INRIA Person test set. In general, the heatmap is much brighter. Moreover, the scale covers a smaller range but starts at a higher value. This means that the COCO test set is more complex and that the impact on the detection performance caused by the patches, transfers, even when the patches are trained on an entirely different dataset.
Regarding the performance of the networks when uniform noise patches are present, the impact on the INRIA Person dataset is negligible, while the mAP drop for the COCO dataset is much higher. When attacked with different shades of gray, the impact on the INRIA Person dataset is by far less low than on the COCO dataset. The cause for the investigated behavior is probably the higher complexity of the COCO dataset. Nonetheless, an interesting finding is that all networks seem to be sensible to grayscale patches with the value of 0.5. We hypothesize that this sensitivity arises from an unintended side effect of the training procedures, where such a grayscale value is usually used for padding or to fill gaps between images when using mosaic training.
6 Summary
This work analyzes the transferability of adversarial patches between multiple real-time object detector networks by comparing the relative mean average precision. A total of 280 patches have been optimized and evaluated with 28 different models. INRIA Person is used as the training dataset for the patches, while the evaluation is performed on the test sets of INRIA Person and COCO. The results indicate that patches that are optimized with larger models have a higher transferability between different models than patches that are optimized with smaller models. The YOLO-NAS architecture provides robustness against these patches, while the best robustness is provided by the more recent YOLOv9 and YOLOv10 architectures. Similarly, the best transferability is achieved with the larger YOLOv9 and YOLOv10 architectures. Future research should explore the hypothesis that the networks’ sensitivity to specific grayscale patches may be an unintended consequence of the training procedure.
ACKNOWLEDGMENTS
This work was developed in Fraunhofer Cluster of Excellence “Cognitive Internet Technologies”.
References
- [1] S. Wang, R. Veldhuis, and N. Strisciuglio, “The Robustness of Computer Vision Models against Common Corruptions: a Survey,” arXiv Prepr. , pp. 1–23, may 2023.
- [2] A. Serban, E. Poll, and J. Visser, “Adversarial Examples on Object Recognition: A Comprehensive Survey,” ACM Computing Surveys 53(3), 2020.
- [3] A. Chakraborty, M. Alam, V. Dey, A. Chattopadhyay, and D. Mukhopadhyay, “A survey on adversarial attacks and defences,” CAAI Trans. Intell. Technol. 6(1), pp. 25–45, 2021.
- [4] T.-Y. Lin, M. Maire, S. Belongie, J. Hays, P. Perona, D. Ramanan, P. Dollár, and C. L. Zitnick, “Microsoft coco: Common objects in context,” pp. 740–755, 2014.
- [5] J. Terven and D. Cordova-Esparza, “A Comprehensive Review of YOLO: From YOLOv1 to YOLOv8 and Beyond,” in arXiv preprint, pp. 1–27, 2023.
- [6] Y. Zhao, W. Lv, S. Xu, J. Wei, G. Wang, Q. Dang, Y. Liu, and J. Chen, “Detrs beat yolos on real-time object detection,” in CVPR, pp. 16965–16974, June 2024.
- [7] L. Wu, Z. Zhu, C. Tai, and W. E, “Understanding and Enhancing the Transferability of Adversarial Examples,” in arXiv preprint, (2015), pp. 1–15, 2018.
- [8] M. Naseer, S. Khan, M. H. Khan, F. S. Khan, and F. Porikli, “Cross-domain transferability of adversarial perturbations,” Adv. Neural Inf. Process. Syst. 32(NeurIPS), pp. 1–11, 2019.
- [9] C. Xie, Z. Zhang, Y. Zhou, S. Bai, J. Wang, Z. Ren, and A. L. Yuille, “Improving transferability of adversarial examples with input diversity,” Proc. IEEE Comput. Soc. Conf. Comput. Vis. Pattern Recognit. 2019-June, pp. 2725–2734, 2019.
- [10] W. Wu, Y. Su, X. Chen, S. Zhao, I. King, M. R. Lyu, and Y.-W. Tai, “Boosting the transferability of adversarial samples via attention,” in Proceedings of the IEEE/CVF Conference on Computer Vision and Pattern Recognition (CVPR), June 2020.
- [11] K.-h. Chow, L. Liu, M. E. Gursoy, S. Truex, W. Wei, and Y. Wu, “TOG : Targeted Adversarial Objectness Gradient Attacks on Real-time Object Detection Systems,” in arXiv preprint, 2020.
- [12] Y. Guo, Q. Li, and H. Chen, “Backpropagating linearly improves transferability of adversarial examples,” Advances in neural information processing systems 33, pp. 85–95, 2020.
- [13] E. Alvarez, R. Alvarez, and M. Cazorla, “Exploring Transferability on Adversarial Attacks,” IEEE Access 11(October), pp. 105545–105556, 2023.
- [14] X. Wang, K. Tong, and K. He, “Rethinking the backward propagation for adversarial transferability,” in Proceedings of the 37th International Conference on Neural Information Processing Systems, NIPS ’23, Curran Associates Inc., (Red Hook, NY, USA), 2024.
- [15] J. Deng, W. Dong, R. Socher, L.-J. Li, K. Li, and L. Fei-Fei, “Imagenet: A large-scale hierarchical image database,” in 2009 IEEE conference on computer vision and pattern recognition, pp. 248–255, Ieee, 2009.
- [16] A. M. Staff, J. Zhang, J. Li, J. Xie, E. A. Traiger, J. A. Glomsrud, and K. B. Karolius, “An Empirical Study on Cross-Data Transferability of Adversarial Attacks on Object Detectors,” CEUR Workshop Proceedings 3125, pp. 38–52, 2021.
- [17] X. Wei, S. Liang, N. Chen, and X. Cao, “Transferable adversarial attacks for image and video object detection,” IJCAI Int. Jt. Conf. Artif. Intell. 2019-Augus, pp. 954–960, 2019.
- [18] Y. Zhang, Z. Gong, Y. Zhang, K. Bin, Y. Li, and J. Qi, “Boosting transferability of physical attack against detectors by redistributing separable attention,” Pattern Recognit. 138, p. 109435, 2023.
- [19] S. Thys, W. V. Ranst, and T. Goedeme, “Fooling automated surveillance cameras: Adversarial patches to attack person detection,” CVPR Work. 2019-June, pp. 49–55, 2019.
- [20] Z. Wu, S. N. Lim, L. S. Davis, and T. Goldstein, “Making an Invisibility Cloak: Real World Adversarial Attacks on Object Detectors,” Lect. Notes Comput. Sci. 12349 LNCS, pp. 1–17, 2020.
- [21] K. Xu, G. Zhang, S. Liu, Q. Fan, M. Sun, H. Chen, P. Y. Chen, Y. Wang, and X. Lin, “Adversarial T-Shirt! Evading Person Detectors in a Physical World,” Lect. Notes Comput. Sci. (including Subser. Lect. Notes Artif. Intell. Lect. Notes Bioinformatics) 12350 LNCS, pp. 665–681, 2020.
- [22] S. Hoory, T. Shapira, A. Shabtai, and Y. Elovici, “Dynamic adversarial patch for evading object detection models,” arXiv preprint arXiv:2010.13070 , 2020.
- [23] J.-x. Mi, X.-d. Wang, L.-f. Zhou, and K. Cheng, “Adversarial examples based on object detection tasks: A survey,” Neurocomputing 519, pp. 114–126, jan 2023.
- [24] I. Loshchilov and F. Hutter, “Decoupled weight decay regularization,” 7th Int. Conf. Learn. Represent. ICLR 2019 , 2019.
- [25] C.-Y. Wang, A. Bochkovskiy, and H.-Y. M. Liao, “YOLOv7: Trainable Bag-of-Freebies Sets New State-of-the-Art for Real-Time Object Detectors,” in 2023 IEEE/CVF Conf. Comput. Vis. Pattern Recognit., pp. 7464–7475, IEEE, jun 2023.
- [26] G. Jocher, A. Chaurasia, and J. Qiu, “Ultralytics YOLO,” Jan. 2023.
- [27] C.-Y. Wang, I.-H. Yeh, and H.-Y. M. Liao, “Yolov9: Learning what you want to learn using programmable gradient information,” arXiv preprint arXiv:2402.13616 , 2024.
- [28] S. Aharon, Louis-Dupont, Ofri Masad, K. Yurkova, Lotem Fridman, Lkdci, E. Khvedchenya, R. Rubin, N. Bagrov, B. Tymchenko, T. Keren, A. Zhilko, and Eran-Deci, “Super-gradients,” 2021.
- [29] A. Wang, H. Chen, L. Liu, K. Chen, Z. Lin, J. Han, and G. Ding, “YOLOv10: Real-Time End-to-End Object Detection,” in arXiv preprint, pp. 1–18, 2024.
- [30] T. Salimans, I. Goodfellow, W. Zaremba, V. Cheung, A. Radford, and X. Chen, “Improved techniques for training gans,” in NIPS, NIPS’16, p. 2234–2242, Curran Associates Inc., (Red Hook, NY, USA), 2016.
- [31] C. Szegedy, V. Vanhoucke, S. Ioffe, J. Shlens, and Z. Wojna, “Rethinking the Inception Architecture for Computer Vision,” Proc. IEEE Comput. Soc. Conf. Comput. Vis. Pattern Recognit. 2016-December, pp. 2818–2826, 2016.
- [32] N. Dalal and B. Triggs, “Histograms of Oriented Gradients for Human Detection,” in CVPR, 1, pp. 886–893, IEEE, 2005.