Limits on new strongly interacting matter from measurements of Transverse Energy-Energy Correlations at TeV at the LHC
Abstract
This work establishes 95% confidence level limits to models incorporating additional fermions sensitive to the strong interaction. Precision measurements of Transverse Energy-Energy Correlations at the ATLAS experiment are used, exploiting their dependence on the strong coupling constant to analyse the effects of introducing new fermions with colour charge on the Renormalisation Group Equation. The comparison between theoretical predictions, corrected up to next-to-next-to-leading order, and the data collected by ATLAS at TeV allows to constrain physics models proposing the existence of new fermions with masses up to 2 TeV, independently of assumptions on the fermion decay.
add1]javier.llorente.merino@cern.ch add2]evsanc12@ucm.es
1 Introduction
After decades of experiments that have tested the Standard Model of particle physics (SM), it has been established as the model that most accurately describes both the elementary particles known to date and the forces that determine the interaction between these particles, with the exception of gravity. However, the SM is known to be incomplete for several reasons. Among them, the matter-antimatter asymmetry in the Universe, the lack of explanation for dark matter, and the non-inclusion of General Relativity in the SM are the main incentives for searching for physics beyond the Standard Model (BSM) [1].
Today, some of the experiments that focus part of its efforts on the search for BSM physics are installed at the Large Hadron Collider (LHC), the most powerful particle collider to date, capable of reaching centre-of-mass energies of 13.6 TeV [2]. Since the existence of new particles could leave signals at the energies available at the LHC, indications of new physics would be indirectly detectable at this collider by performing precise measurements of observables whose theoretical prediction is modified by reformulating the SM. Because the colliding objects at the LHC are protons, it is very common for their constituents to interact strongly to give rise to final states that contain jets, i.e., sets of high-energy collimated particles resulting from the fragmentation of quarks or gluons that group together forming colour-neutral hadrons [3]. The interactions between particles with colour charge are theoretically described in the SM by a quantum field theory called Quantum Chromodynamics (QCD). Therefore, one way to check the validity of the SM can be through the examination of QCD as a perturbative theory by analyzing observables measured in events with multiple jets in the final state [4, 5]. Specifically, observables sensitive to how the strong coupling constant , which determines the strength of interactions between quarks and gluons, varies with the interaction scale, , and with the theoretical model, can be analysed to restrict BSM models that include new fermions with colour charge [6, 7].
Transverse Energy-Energy Correlations (TEEC) constitute an observable of particular interest because of its experimental precision. They also exhibit excellent perturbative convergence properties, as well as an important dependence on the strong coupling constant [5, 8]. Therefore, modifying the function by introducing new fermions with colour charge in the SM implies a different theoretical prediction for the TEEC in BSM models with respect to the SM. Consequently, the analysis of TEEC allows to set limits on the existence of new fermions independently of any decay model, as it only requires a coupling model to the strong sector of the Standard Model. This study has been previously conducted [7] using theoretical predictions of TEEC at next-to-leading order (NLO) in perturbative QCD (pQCD) and data collected at the LHC for centre-of-mass energies of 8 TeV [9]. The aim of the present work is to extend this analysis by considering theoretical predictions to the next perturbative order in QCD, which have been recently calculated in Ref. [10], and data taken at higher energies, 13 TeV [5], in order to improve the limits on BSM models.
The report is organised as follows. Section 2 introduces the theoretical background, including the modification of the strong coupling constant when new fermions with colour charge are added to the SM. Section 3 defines Transverse Energy-Energy Correlations and, subsequently, Section 4 details the dataset and theoretical predictions used. The analysis concludes with the determination of limits on BSM models in Section 5. Finally, the conclusions of the study are presented in Section 6.
2 Quantum Chromodynamics and the Strong Coupling Constant
Quantum Chromodynamics (QCD) is a non-abelian gauge theory whose Lagrangian is characterised by its invariance under the special unitary group SU(3). The renormalisation of the coupling constant of the theory, , requires the Renormalisation Group Equation (RGE) to hold:
| (1) |
where
| (2) |
and is the number of active flavours at the considered energy.
If new colour-charged fermions are included, it is necessary to modify the definition of the coefficients and . In Ref. [6], these parameters are calculated for BSM models with new fermions sensitive to the strong interaction,
| (3) |
where represents the number of new fermions; is the group factor given by , where are the generators of SU(3) in a given representation; and is the Casimir of that representation, fulfilling . For SU(3) triplets, i.e. quarks, and . In what follows, the parameter and the mass of the new fermion, , will be used to characterise a specific BSM model.
The solution to the Renormalisation Group Equation provides the way in which the strong coupling constant varies with the renormalisation scale. At NLO, it reads:
| (4) |
where is the integration constant defined as
| (5) |
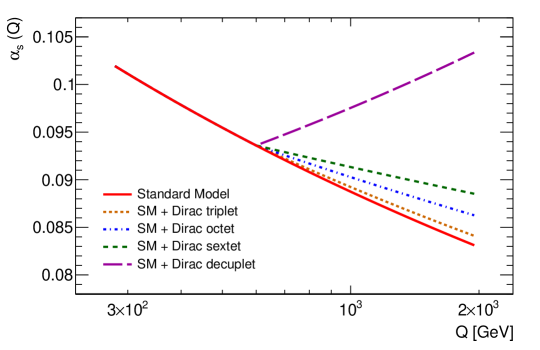
The definition of coefficients and introduces a dependence of the strong coupling constant evaluated at a specific energy on the specific BSM model. Figure 1 shows the running of with the renormalisation scale for different BSM models introducing a new colour-charged fermion. The curves shown are calculated at NLO in the strong coupling constant, and the mass of the new fermion is fixed at 600 GeV. The represented models correspond to (SM + Dirac triplet), (SM + Dirac octet), (SM + Dirac sextet), and (SM + Dirac decuplet). As observed in the figure, the curve as a function of begins to deviate from the SM curve at values of equal to the mass of the new fermion. For higher , the separation of the curve with respect to the SM becomes more pronounced, and even for some models, asymptotic freedom ( as ) is lost. This phenomenon occurs at first order when the derivative of vanishes. For models with 6 active flavours, this happens for . Thus, in the graph, the only represented model that loses asymptotic freedom is that with an additional fermion transforming as a Dirac decuplet, i.e., . It should be noted that, given a fermion of mass , the deviation of with respect to the SM curve is greater for higher energy scales.
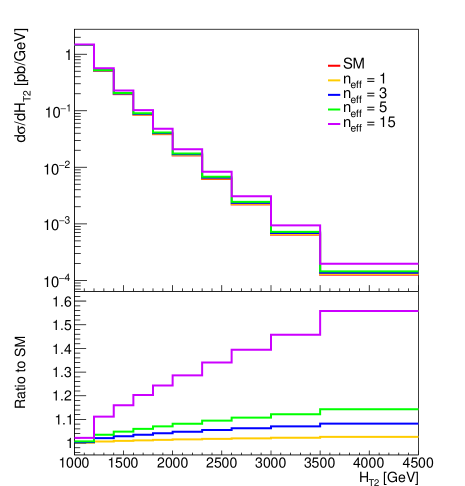
The modification of caused by the introduction of new fermions is reflected on measurable quantities at the LHC by means of their perturbative expansion. One observable that allows to understand how the theoretical predictions are changed by introducing such fermions is the two-jet production cross section in collisions, , as it is calculated perturbatively as a power series in [11]. Figure 2 shows the differential cross section of the process as a function of the scalar sum of the transverse momenta of the two highest- jets, . The SM predictions, as well as those introducing a new strongly interacting fermion with a mass of 600 GeV and and 15 into the SM, are included. The SM cross section is represented in red. In the lower panel, the ratios of the predictions for each BSM model to the corresponding SM prediction are shown. It can be seen that the existence of massive new fermions deviates the theoretical prediction for the cross section from the SM prediction at the energies available at the LHC. Although the trend of the curves is the same for the represented BSM models (the cross section decreases as the energy of the process increases) the cross sections for models with higher take larger values, and the difference with the SM becomes greater at higher energies. Despite the cross section seeming useful for distinguishing between BSM models and potentially ruling them out, in the following we will use Transverse Energy-Energy Correlations, as they present several advantages over other observables, such as its higher experimental precision.
3 Transverse Energy-Energy Correlations
Transverse Energy-Energy Correlations [12] offer several advantages: they can be easily calculated in pQCD and, as introduced in Section 1, they show excellent perturbative convergence properties as well as stability with respect to different experimental and theoretical effects. Moreover, this observable shows an important dependence on the value of the strong coupling constant, which has allowed the ATLAS Collaboration to determine from them at different centre-of-mass energies [13, 14, 5]. The mathematical expression defining TEEC is [15]:
| (6) |
where is the cross-section for two-jet production and is the fraction of energy carried by jet relative to the total,
| (7) |
At NLO in perturbative QCD, TEEC can be expressed as a second-order expansion in powers of as [8]
| (8) |
where and are functions to be determined. The TEEC distributions exhibit two peaking structures at and . The former corresponds to back-to-back dijet configurations at , while the latter corresponds to self-correlations and collinear emissions at . Intermediate values of correspond to radiation emitted at larger angles. Thus, the first non-trivial contribution to the TEEC cross section corresponds to leading-order three-jet production.
4 Dataset and Theoretical Predictions
The dataset used for the analysis was collected by the ATLAS experiment during the LHC Run II, between 2015 and 2018. The data were taken at a centre-of-mass energy of 13 TeV, with a total integrated luminosity of 139 fb-1, and corresponds to the distributions published in Ref. [5].
Theoretical predictions were obtained using the NLOJet++ program [16], which allows for the calculation of the NLO cross sections for three-jet production, . The parton distribution functions (PDF) used for our central result are those from MMHT2014 [17], while the result is cross-checked using the CT18 PDF [18].
The tools mentioned above allow for obtaining theoretical predictions at NLO for the TEEC. However, this report aims to work with predictions at a higher precision order, specifically at NNLO. Therefore, the following approximation has been made. Since SM predictions at NNLO have been calculated using both MMHT2014 and CT18 [10], it is possible to estimate the NNLO prediction for BSM models approximately. To do this, the so-called -factors, defined as the ratios of the NNLO prediction to the NLO prediction in the SM are computed. These depend both on and the azimuthal angle between jet pairs. The BSM theoretical prediction at NNLO is obtained by multiplying the corresponding -factor by the NLO prediction, thus providing an approximation for the NNLO result, i.e., for each bin
| (9) |
Moreover, the parton distribution functions have been used without any modification due to the inclusion of new coloured fermions. This approximation is valid because TEEC are a ratio of two cross sections, thus cancelling out most of the effects introduced by the PDF [6, 8, 13].
The event selection follows that in Ref. [5]. The study is, thus, limited to final states with two or more jets with 60 GeV, and . Additionally, only events fulfilling the condition GeV are analysed. The TEEC distributions are studied in the phase space 0.92 to avoid non-perturbative effects due to hadronisation, as well as logarithmic corrections due to collinear gluon resummation [19]. Finally, the renormalisation and factorisation scales are chosen as , where is the scalar sum of of all partons in the final state. This choice represents a compromise between recent theoretical developments proposing a scale proportional to [10, 20], where all final-state partons are involved, and the tendency in experimental measurements to use scales of the order of the average transverse momentum of the process [21, 14]. This allows for a fair comparison with the results obtained in Ref. [7], where a scale of the same numerical order, , with and being the transverse momenta of the two highest momentum jets, was chosen.
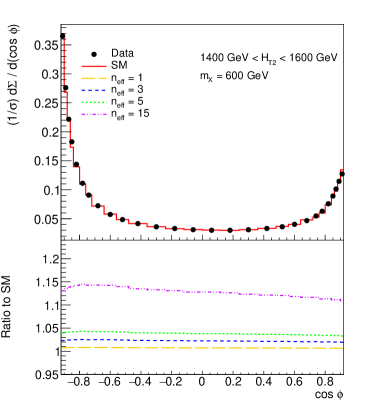
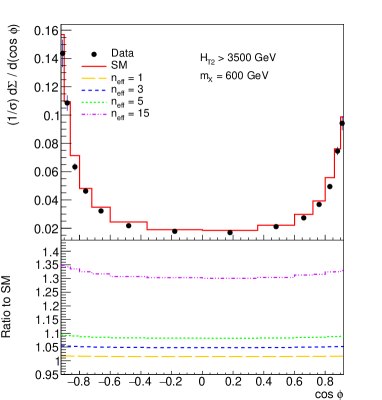
Figure 3 shows the approximate NNLO theoretical predictions for the TEEC as a function of the azimuthal angle between jet pairs, for four ranges and four sample BSM models. Specifically, the displayed predictions were calculated for new fermions with a mass of 600 GeV and and 15. In the upper panel of each figure, the theoretical SM prediction (at exact NNLO) and the data from Ref. [5] are shown. In the lower panels, the ratio of the BSM model prediction to the SM prediction is represented. As can be seen in the figures, the agreement of the Standard Model with the data collected at the LHC is, in general, very good. However, the agreement between the data and the predictions begins to slightly deteriorate as the energy scale increases. Among other possible effects, this difference is understood to be due to the multiple scales involved in the calculation of the process, one being the of the third jet, , which becomes small with respect to the dijet scale, , as is increased.
On each of the subfigures, it can be observed that the ratio of the BSM models to the SM approaches unity as the value of decreases. This is theoretically expected, as the coefficients and for BSM models (see Eq. 3), which play a crucial role in defining at NLO, differ from the coefficients for the SM (Eq. 2) on a term which is linear in . Thus, for low values of , the agreement with the SM is better. Another factor to highlight is that as the available energy in a process increases, BSM models diverge more from the Standard Model. This is because the introduction of a new fermion with mass modifies the function starting from an energy equal to the mass of the new fermion onwards and, from that point, the curves for different models begin to separate from the SM curve, with greater separation at higher energies (see Figure 1).


5 Limits on BSM models with new coloured fermions
The comparison between the theoretical predictions and the experimental data allows us to exclude theoretical models whose predictions do not agree with experimental results. In order to quantify the agreement between data and theory, a test is used to find the -value of a specific model with respect to the data, which allows us to understand the probability of such model to describe the experimental observations.
The experimental uncertainties on the measured distributions are not independent but correlated among them. The magnitude of these correlations and their effects on the determination of the have been evaluated in Ref. [5] assuming a Gaussian model by introducing parameters that modify theoretical predictions as [5, 9, 13]
| (10) |
where the index runs over correlated sources of systematic error. In the above expression, is the analytical function parameterizing the dependence of TEEC on the strong coupling constant on bin , are nuisance parameters, and is the -th source of experimental uncertainty for bin in the measurement phase space. These parameters are introduced in the definition of as
| (11) |
where are the measured data for the TEEC, is the statistical uncertainty on these data points and is the statistical uncertainty on the theoretical predictions. This definition is used to estimate the -value. In the following, the parameter used to characterise the agreement between data and theory will be the normalised confidence level, CL CL/CL [22], where CL refers to the -value of the BSM model with respect to the data and CL is the -value of the Standard Model (SM) with respect to the data.
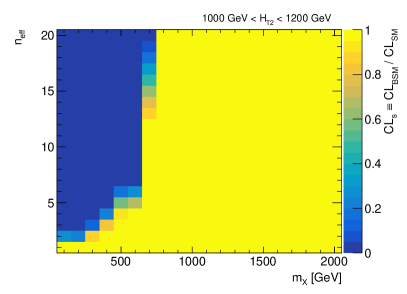
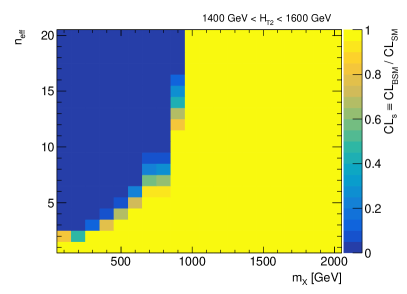

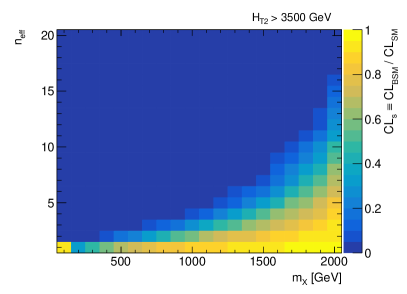
Figure 4 shows the value of CL for four different ranges. The results are calculated for 400 BSM models with integer ranging from 1 to 20 and new fermion masses between 100 GeV and 2 TeV, in steps of 100 GeV.
In general, as can be seen in the figure, specific BSM models exhibit better agreement with experimental results for lower and higher . A comparison of the different figures shows that, as the energy scale is increased, fermions with larger masses can be excluded. This is not surprising, since, as mentioned earlier, the curves for these models tend to diverge from the SM as increases, and this effect is manifested in TEEC. Consequently, at higher energies, it is possible to exclude a greater number of BSM models.
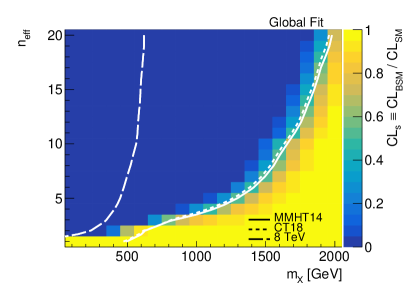
Based on the results presented above, a 95% confidence level contour can be obtained, separating the excluded region from the models that cannot be ruled out from the comparison of data to theory. To find such curve on the (, ) plane, the function that satisfies CL = 0.05 is interpolated. As it is customary, this interpolation is done in the significance phase space, defined as , where erf-1 is the inverse error function. Figure 5 shows the corresponding CL = 0.05 curve calculated with TEEC approximated at NNLO and experimental data collected at 13 TeV. In the left figure, a global fit is performed while, in the right figure, the curve is obtained from the fit to the highest energy bin, 3500 GeV. While the solid line shows the curve for 13 TeV, the dashed line shows the curve for the 8 TeV results [7]. A clear improvement with respect to the 8 TeV results can be observed. In order to illustrate the smallness of the PDF dependence of the 95% CL limits, the results are obtained for both the MMHT2014 [17] and the CT18 [18] PDF determinations. Figure 5 show very similar results for both PDF choices. As discussed in some detail in Ref. [7], the effect of varying the renormalisation and factorisation scales by a factor of 2 is not taken into account as a theoretical uncertainty. This is so since is taken as the argument of in the perturbative calculation and, hence, variations of by a factor of 2 are expected to cause a variation on the 95% CL limits by a factor of 2.

6 Conclusions
In this work, the dependence of on the BSM model through TEEC, at approximate NNLO in pQCD has been studied. Specifically, BSM models that introduce a new coloured fermion to the SM, characterised through its mass, , and the SU(3) representation under which it transforms, parametrised by the parameter, have been analysed. The theoretical predictions relative to the SM has been studied for models with 1, 3, 5, and 15, and 600 GeV as an example, highlighting the fact that such models can become very similar to the SM at low energies, necessitating study at high energies to truly distinguish between them. The comparison of the theory predictions with the experimental data collected by ATLAS at 13 TeV has been performed to obtain the value of CL for such BSM models.
The agreement between experiment and theory is better for models where the additional fermion transforms under an SU(3) representation with lower (for example, the SM with an additional quark, ) and higher , some cases being undistinguishable from the SM at the energies available to date. Limits have been set for these BSM models at a 95% confidence level, considering all points in the measurement phase space through a global fit, and restricting the study to high-energy events, 3500 GeV. The second dataset allows for more stringent limits to be established, with most of the (, ) plane excluded when 20 and 2000 GeV.
Increases in the centre-of-mass energy from future colliders, as well as the improved precision of the data and eventual theoretical predictions at higher perturbative orders, would allow for the improvement of the analysis presented here by reducing errors in both data and theory, thus allowing to test new physics models for increasingly high masses.
Acknowledgements
The authors would like to thank Rene Poncelet for useful discussions.
References
- Virdee [2016] T. S. Virdee, Beyond the Standard Model of particle physics, Phil. Trans. R. Soc. A. 374 (2016) 20150259. doi:10.1098/rsta.2015.0259.
- Evans and Bryant [2008] L. Evans, P. Bryant, LHC Machine, JINST 3 (2008) S08001. doi:10.1088/1748-0221/3/08/S08001.
- Cacciari et al. [2012] M. Cacciari, G. P. Salam, G. Soyez, FastJet user manual: (for version 3.0.2), Eur. Phys. J. C 72 (2012) 1896. doi:10.1140/epjc/s10052-012-1896-2.
- Aad et al. [2021] G. Aad, et al., Measurement of hadronic event shapes in high-pt multijet final states at tev with the atlas detector, JHEP 01 (2021) 188. doi:10.1007/JHEP01(2021)188.
- Aad et al. [2023] G. Aad, et al., Determination of the strong coupling constant from transverse energy-energy correlations in multijet events at = 13 TeV with the ATLAS detector, JHEP 07 (2023) 85. doi:10.1007/jhep07(2023)085.
- Becciolini et al. [2015] D. Becciolini, M. Gillioz, F. Sannino, M. Nardecchia, M. Spannowsky, Constraining new colored matter from the ratio of 3 to 2 jets cross sections at the LHC, Phys. Rev. D 91 (2015) 015010. doi:10.1103/physrevd.91.015010.
- Llorente and Nachman [2018] J. Llorente, B. Nachman, Limits on new coloured fermions using precision jet data from the Large Hadron Collider, Nucl. Phys. B 936 (2018) 106. doi:10.1016/j.nuclphysb.2018.09.008.
- Ali et al. [2012] A. Ali, F. Barreiro, J. Llorente, W. Wang, Transverse energy-energy correlations in next-to-leading order in at the LHC, Phys. Rev. D 86 (2012) 114017. doi:10.1103/physrevd.86.114017.
- Aaboud et al. [2017] M. Aaboud, et al., Determination of the strong coupling constant from transverse energy–energy correlations in multijet events at TeV using the ATLAS detector, Eur. Phys. J. C 77 (2017) 872. doi:10.1140/epjc/s10052-017-5442-0.
- Alvarez et al. [2023] M. Alvarez, J. Cantero, M. Czakon, J. Llorente, A. Mitov, R. Poncelet, NNLO QCD corrections to event shapes at the LHC, JHEP 03 (2023) 129. doi:10.1007/jhep03(2023)129.
- Aaboud et al. [2018] M. Aaboud, et al., Measurement of inclusive jet and dijet cross-sections in proton-proton collisions at TeV with the ATLAS detector, JHEP 2018 (2018) 195. doi:10.1007/jhep05(2018)195.
- Ali et al. [1984] A. Ali, E. Pietarinen, W. Stirling, Transverse energy-energy correlations: A test of perturbative QCD for the proton-antiproton collider, Phys. Lett. B 141 (1984) 447. doi:https://doi.org/10.1016/0370-2693(84)90283-1.
- Aad et al. [2015] G. Aad, et al., Measurement of transverse energy–energy correlations in multi-jet events in pp collisions at 7 TeV using the ATLAS detector and determination of the strong coupling constant , Phys. Lett. B 750 (2015) 427. doi:10.1016/j.physletb.2015.09.050.
- Aaboud et al. [2018] M. Aaboud, et al., Measurement of dijet azimuthal decorrelations in pp collisions at 8 TeV with the ATLAS detector and determination of the strong coupling, Phys. Rev. D 98 (2018) 092004. doi:10.1103/physrevd.98.092004.
- Altarelli [1994] G. Altarelli, The Development of Perturbative QCD, World Scientific, 1994.
- Nagy [2003] Z. Nagy, Next-to-leading order calculation of three-jet observables in hadron-hadron collisions, Phys. Rev. D 68 (2003) 094002. doi:10.1103/physrevd.68.094002.
- Harland-Lang et al. [2015] L. A. Harland-Lang, A. D. Martin, P. Motylinski, R. S. Thorne, Parton distributions in the LHC era: MMHT 2014 PDFs, Eur. Phys. J. C 75 (2015) 204. doi:10.1140/epjc/s10052-015-3397-6.
- Hou et al. [2021] T. Hou, J. Gao, T. J. Hobbs, K. Xie, S. Dulat, M. Guzzi, J. Huston, P. Nadolsky, J. Pumplin, C. Schmidt, I. Sitiwaldi, D. Stump, C. P. Yuan, New CTEQ global analysis of quantum chromodynamics with high-precision data from the LHC, Phys. Rev. D 103 (2021) 014013. doi:10.1103/physrevd.103.014013.
- Banfi et al. [2010] A. Banfi, G. P. Salam, G. Zanderighi, Phenomenology of event shapes at hadron colliders, JHEP 06 (2010) 038. doi:10.1007/JHEP06(2010)038.
- Czakon et al. [2021] M. Czakon, A. Mitov, R. Poncelet, Next-to-Next-to-Leading Order study of three-jet production at the LHC, Phys. Rev. Lett. 127 (2021) 152001. doi:10.1103/physrevlett.127.152001.
- Chatrchyan et al. [2013] S. Chatrchyan, et al., Measurement of the ratio of the inclusive 3-jet cross section to the inclusive 2-jet cross section in pp collisions at and first determination of the strong coupling constant in the TeV range, Eur. Phys. J. C. 73 (2013) 2604. doi:10.1140/epjc/s10052-013-2604-6.
- Read [2002] A. L. Read, Presentation of search results: the CLs technique, J. Phys. G: Nucl. Part. Phys. 28 (2002) 2693. doi:10.1088/0954-3899/28/10/313.