Evaporation of water-in-oil microemulsion droplet
Abstract
Emulsion fuels have the potential to reduce both particulate matter and NOx emissions and can potentially improve the efficiency of combustion engines. However, their limited stability remains a critical barrier to practical use as an alternative fuel. In this study, we explore the evaporation behavior of thermodynamically stable water-in-oil microemulsions. The water-in-oil microemulsion droplets prepared from different types of oil were acoustically levitated and heated using a continuous laser at different irradiation intensities. We show that the evaporation characteristics of these microemulsions can be controlled by varying water-to-surfactant molar ratio () and volume fraction of the dispersed phase (). The emulsion droplets undergo three distinct stages of evaporation, namely pre-heating, steady evaporation, and unsteady evaporation. During the steady evaporation phase, increasing reduces the evaporation rate for a fixed . It is observed that the evaporation of microemulsion is governed by the complex interplay between its constituents and their properties. We propose a parameter () denoting the volume fraction ratio between volatile and non-volatile components, which indicates the cumulative influence of various factors affecting the evaporation process. The evaporation of microemulsions eventually leads to the formation of solid spherical shells, which may undergo buckling. The distinction in the morphology of these shells is explored in detail using SEM imaging.
keywords:
Droplets, evaporation, microemulsion, shell bucklingCurrent Affiliation: Material Sciences Division and The Molecular Foundry, Lawrence Berkeley National Laboratory, Berkeley, California, USA \alsoaffiliationInterdisciplinary Centre for Energy Research, Indian Institute of Science, Bengaluru, India \abbreviationsIR, AOT
1 Introduction
The droplet evaporation is a ubiquitous phenomenon that occurs in many natural and industrial processes. A few common examples are drying of drops in food/chemical industries1, 2, evaporative cooling of electronic devices3, 4, fuel droplet vaporization inside combustion engines 5, 6, 7, 8, 9. The evaporation of drops is also a crucial process in pharmaceutical industries10, 11. The evaporation of liquid droplets has been investigated under distinct configurations, including the sessile mode12, 13, 14, 15, 16, 17, where the droplet rests on a solid substrate, and the pendant mode18, 19, 20, 21, 22, where the droplet is suspended from a needle or wire. Droplet evaporation involves a multitude of transport processes (heat, mass, and momentum)23, 6 and ambient conditions (pressure, temperature, and humidity)24. Brutin and Starov categorically summarised the evaporation of droplets on a substrate and discussed various parameters affecting the evaporation process, such as wettability, thermal effects, and associated flow instabilities. However, drying drops in pendant configuration lead to distinct evaporation characteristics compared to the sessile mode. In many industrial applications, such as spray drying and spray combustion, the droplet remains contactless. Therefore, understanding the evaporation characteristics of an isolated contactless drop becomes crucial.
In recent years, there has been a growing emphasis on multi-component liquids such as emulsion fuels, due to their potential application as alternative fuels for combustion applications 26. This interest stems from their ability to mitigate harmful emissions (NOx) and enhance engine efficiency27, 28, 29. The study of droplet evaporation is crucial for a comprehensive understanding of their spray and combustion behavior. The addition of water to these fuels can impact the evaporation rate and potentially affect their spray and combustion characteristics 26. For instance, the addition of water tends to lower the combustion temperature since water exhibits exceptionally high heat capacity, resulting in a significant reduction in NO production27, 30. Furthermore, water-in-oil emulsion fuels can potentially improve the atomization characteristics inside the combustion chamber by undergoing vapor bubble-induced breakup7, 31, 28, 32. While extensive research has been carried out on the atomization characteristics of emulsion fuels, a critical knowledge gap exists regarding their evaporation behavior.
Shen et al. reported that upon heating the emulsion droplet, there exists a threshold temperature beyond which the interfacial tension between the water/oil interface increases abruptly. As a result, the water sub-droplets can no longer remain dispersed in oil, and depending on the threshold temperature, the dispersed water droplet can either diffuse towards the surface (eventually vaporize) or undergo coalescence resulting in complete phase separation. A recent study explored the evaporation of sessile water-in-oil emulsion droplets and investigated the capillary clustering of water sub-droplets on the evaporation rate34. Similarly, it has been shown that for sessile water-in-cyclohexane emulsion droplets, the evaporation rate can be controlled by varying the water concentration35. Emulsions and their distinct evaporation characteristics are also utilized extensively for making engineered particles11, 36. For instance, porous particles can be produced by spray-drying of emulsions. Such particles are useful in pharmaceutical applications such as pulmonary drug delivery systems37.
While emulsions have diverse applications, in this investigation, we primarily focus on their applicability as an alternative fuel for combustion applications. The emulsions we have discussed so far are called macro emulsions (usually referred to as emulsions), and the major challenge with these emulsions is their limited stability. The size of dispersed phase sub-droplets in these emulsions is typically above 1 . Such systems are milky white and kinetically stable (i.e., eventually undergo phase separation with time)38, 39. The stability of the emulsions depends on parameters such as the size distribution of the dispersed sub-droplets, the volume fraction of water sub-droplets, surfactant properties, and preparation method 40, 41. It is established that the microemulsions are thermodynamically stable, optically transparent, and relatively simple to prepare42, 43, 44, 45. The microemulsions used in this study exhibit ultra-long stability (up to 180 days44, 45), making them a viable option as a model alternative fuel for combustion applications. Thermodynamic stability of these emulsions is achieved due to the self-organization of the surfactant molecules at the interface between oil and water sub-droplets, which leads to a decrease in the surface energy of the system.
In this work, we investigate the evaporation characteristics of microemulsion droplets in a contactless environment using an infrared laser. Heating with laser offers a significant advantage over conventional droplet heating methods by enabling precise control over the heating rate. To better understand the evaporation process, we employ a non-intrusive method that involves complete isolation of the droplet. This isolation eliminates any external interactions that could potentially influence the evaporation rate. We report that a microemulsion droplet undergoes three distinct stages during the evaporation process, viz., pre-heating (Stage I), steady evaporation (Stage II), and unsteady evaporation (Stage III). Following evaporation, the droplet transforms into a solid residual structure. The global overview of these stages is provided in section 3.1. Subsequently, a detailed understanding of these evaporation process is provided based on microemulsion structure, tuned using parameters , the molar ratio; , the volume fraction and the nature of the base oil, in sections 3.2.1, 3.2.2, and 3.2.3. An in-depth discussion on shell formation and its dependence on the microemulsion parameters is presented in the section 3.2.3. We also propose a parameter referred to as the volume fraction ratio, which is useful to understand the cumulative effect of various factors on the evaporation process and the shell characteristics.
2 Materials and Experimental Methodology
Water-in-oil microemulsions used for droplet evaporation studies throughout this work were prepared using water as the dispersed phase and decane, dodecane, p-xylene, and a surrogate (defined as the mixture of dodecane and p-xylene in the ratio 9:1 by mass) as the continuous oil phase (i. e., base oil). For reference, the properties of the components are tabulated in Table 1. A double-tailed ionic surfactant, sodium bis(2-ethylhexyl) sulfosuccinate, commonly referred to as AOT or Aerosol-OT ( purity), was used to stabilize the microemulsions. All the chemicals were procured from Merck and used without any further modification. High purity freshly de-ionized water (resistivity, 18.2 M-cm) obtained from a laboratory milli-Q system (ELGA, Purelab Option-Q, DV 25).
|
|
|
|
|
|
|
|
|||||||||||||||||
|---|---|---|---|---|---|---|---|---|---|---|---|---|---|---|---|---|---|---|---|---|---|---|---|---|
| Water | 72.75 | 0.79 | 44.0 | 100 | 2.30 | 57.05 | 997 | |||||||||||||||||
| Decane | 23.83 | 0.85 | 51.5 | 174 | 0.19 | 5.10 | 730 | |||||||||||||||||
| Dodecane | 25.35 | 1.36 | 61.4 | 216 | 0.018 | 0.95 | 750 | |||||||||||||||||
| p-Xylene | 28.90 | 0.58 | 42.4 | 140 | 1.16 | 18.86 | 860 |
2.1 Preparation of microemulsions
Water-in-oil microemulsions consist of thermodynamically stable dispersion of nanometer-sized water sub-droplets stabilized by a monolayer of surfactant. The characteristics of these microemulsions are characterized based on two parameters: (1) molar ratio of water to AOT (i.e., )46 and (2) dispersed phase volume fraction (i.e., ). The and are defined as
| and, | (1) |
where and denotes the number of moles of water and AOT, respectively, and denotes the volume of different components. The parameters and can be used as handles to tune the size and number density of water sub-droplets in the microemulsions. As evident from Equation 1, increase in the concentration of water leads to increase in the values of and and is typically used as a handle to tune the size and the number density of the dispersed water sub-droplets45, 44.
For a given value of and , the corresponding mass of the continuous oil phase and AOT in the water-in-oil microemulsions can be calculated using Equation 1 by providing the mass of water as an additional input variable. To prepare the microemulsion samples, a pre-determined quantity of AOT is precisely weighed and transferred into pre-cleaned glass vials. Subsequently, an appropriate amount of the oil is added to the vials. The mixture is then shaken gently for a few minutes (depending on the relative quantity of AOT and oil) until the AOT is completely dissolved in the oil phase. Later, a weighed amount of deionized water is added to the oil-AOT mixture and shaken gently until the resulting sample becomes a single-phase optically clear fluid. The samples were stored for 3-4 hours at room temperature (25 ℃) to ensure equilibration and homogeneity before any experiments or characterization.
To study the effect of and the nature of the continuous oil phase, microemulsions were prepared using decane as the oil phase at various values: 5, 10, 20, and 40. Furthermore, dodecane microemulsions were formulated at two (= 10 and 20) values, whereas p-xylene microemulsion was prepared at . To study the effect of dispersed phase volume fraction, samples were prepared for three different (= 0.1, 0.2, and 0.4) values for all the values. Additionally, a surrogate microemulsion (at ) has been formulated, where the oil phase is a mixture of dodecane and xylene in the ratio 9:1.
2.2 Structural characterization of the microemulsions
Microemulsions are optically clear, thermodynamically stable dispersions with the dispersed water sub-droplets in the size range of a few nanometers. Such small dispersed structures cannot be resolved using microscopic techniques and therefore, we resorted to scattering techniques. While dynamic light scattering (DLS) was employed to elucidate the structure of decane based microemulsions, small angle x-ray scattering (SAXS) and small angle neutron scattering (SANS) have been used to quantify the size, shape, and interactions for dodecane, p-xylene and surrogate microemulsions reported in this work, prior to evaporation experiments. A thorough characterization of the structure of the microemulsions is necessary and is expected to have a significant influence on their evaporation behavior, as will be shown in the subsequent sections. For a more detailed and systematic characterization of these microemulsions formulated at different values of and , we refer to the work of Rastogi et al.45, 47. The wide angle x-ray scattering (WAXS) on selected samples and the SAXS measurements were performed using a Nano-inXider instrument (Xenocs, Sassenge, France) equipped with a microfocus sealed-tube Cu 30 W/30 m X-ray source (Cu k-, = 1.54 Å). These small angle scattering experiments were performed with facilities available at the ISIS Neutron and Muon Source of the Rutherford Appleton Laboratory (Didcot, UK).
For decane microemulsion, the effective diffusivity () of the water sub-droplets decreases with the increase in the values of both and . Furthermore, the hydrodynamic diameter () of the water sub-droplets is also reported and was calculated based on the Stokes-Einstein relation given as
| (2) |
where, is the Boltzmann constant, is the absolute temperature, and is the solvent viscosity. The water sub-droplet diameter for water-in-decane is found to be for and . The viscosity of the microemulsion prepared was measured, and it was found that the viscosity increased with the increase in the value . Figure 1(a) elucidates the effect of molar ratio, on the size of the water sub-droplets dispersed in a continuous decane phase. The symbols in the plot correspond to the electric field autocorrelation function () as a function of delay time () obtained from dynamic light scattering analysis of decane microemulsions for and at . A single exponential decay of the versus curve (black continuous lines) indicates the presence of spherical droplets of water dispersed in the decane phase. The shift in the observed with an increase in the , suggests an increase in the size of the water nanodroplets. For the data shown in Figure 1(a), the hydrodynamic diameter () of water sub-droplets is estimated using the fitting procedure described earlier 45 and the Stokes-Einstein equation (Equation 2) and is shown in the inset of Figure 1(a).
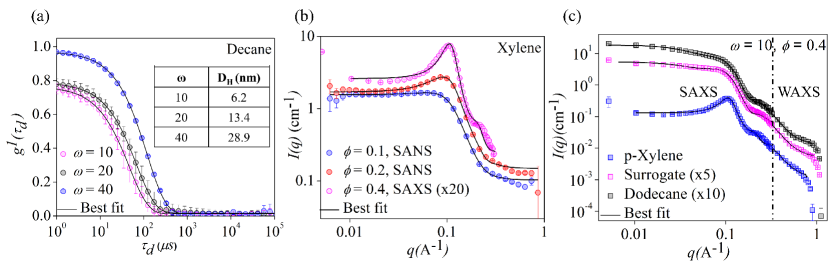
Figure 1(b), The scattering intensity, versus scattering vector, , recorded from neutron ( and ) and x-ray scattering () captures the effect of change in volume fraction, on the structure of xylene microemulsion at . Since the estimated size of the dispersed water sub-droplets in p-xylene is near the lower limit of the DLS instrument, the use of small angle neutron and X-ray scattering techniques was crucial to gain insight into the structure of these microemulsions. The versus data for xylene microemulsions at and and is adapted from Rastogi et al.. The water sub-droplets dispersed in xylene are found to be spherical in shape and had a core diameter of 2.70 ± 0.44 for and 2.92 ± 0.22 nm for . More details of the structural analysis can be found elsewhere48. Due to the limited availability of the beamtime on the SANS beamline, data for and was recorded on the SAXS instrument and is scaled by a factor of 20 in Figure 1(b) for depiction alongside data from neutron scattering. The experimental details and the fitting procedure for SANS and SAXS data is illustrated previously 48, 47. For completeness, experimental data from small and wide angle X-ray scattering (SAXS and WAXS) is acquired at and for three different oil phases – p-xylene, dodecane, and surrogate and is shown as symbols in Figure 1(c). The plot shows the effect of the oil phase on the nanostructure of the dispersed water sub-droplets at the same composition. SAXS and WAXS data for surrogate and dodecane microemulsions is shifted by a factor of 5 and 10 respectively for clarity of presentation. The black continuous lines are the structure factor that fits to the combined SAXS and WAXS data (symbols). The water sub-droplets in xylene microemulsions are modeled as spherical objects with sticky hardsphere type interactions. The dispersed species in dodecane and surrogate microemulsions are found to be cylindrical in shape. Therefore, a structure factor for cylinders interacting via sticky interactions is used for the analysis of scattering data from these samples. The fit parameters are tabulated in Table 2, which lists the parameter which denotes the goodness of the fits, diameter (D) of the spherical droplets in xylene microemulsions, length (L) and diameter (D) of the cylinder for the case of surrogate and dodecane microemulsions, polydispersity index for variation in diameter () and length of the cylindrical droplets ().
| Oil Phase | Diameter, D (nm) | Length, L (nm) | |||
|---|---|---|---|---|---|
| p-xylene | 29.1 | 2.5 | 0.45 | - | - |
| Dodecane | 9.8 | 4.2 | 0.17 | 8.9 | 0.19 |
| Surrogate | 24.8 | 4.1 | 0.15 | 9.5 | 0.07 |
2.3 Experimental details and post processing
The schematic of the experimental setup is shown in Figure 2. A droplet of diameter micron is suspended using a single-axis acoustic levitator (Tec5) with a frequency of 100 kHz at standard ambient conditions. The droplet is heated externally at irradiation intensities , and , where and with a 3.5 mm beam diameter continuous infrared (IR) laser (Synrad 48, wavelength , and maximum power (). Droplet evaporation dynamics are recorded using a high-speed camera (Photron SA5) with a high-speed laser light source (CAVILUX Smart UHS, 640 nm).
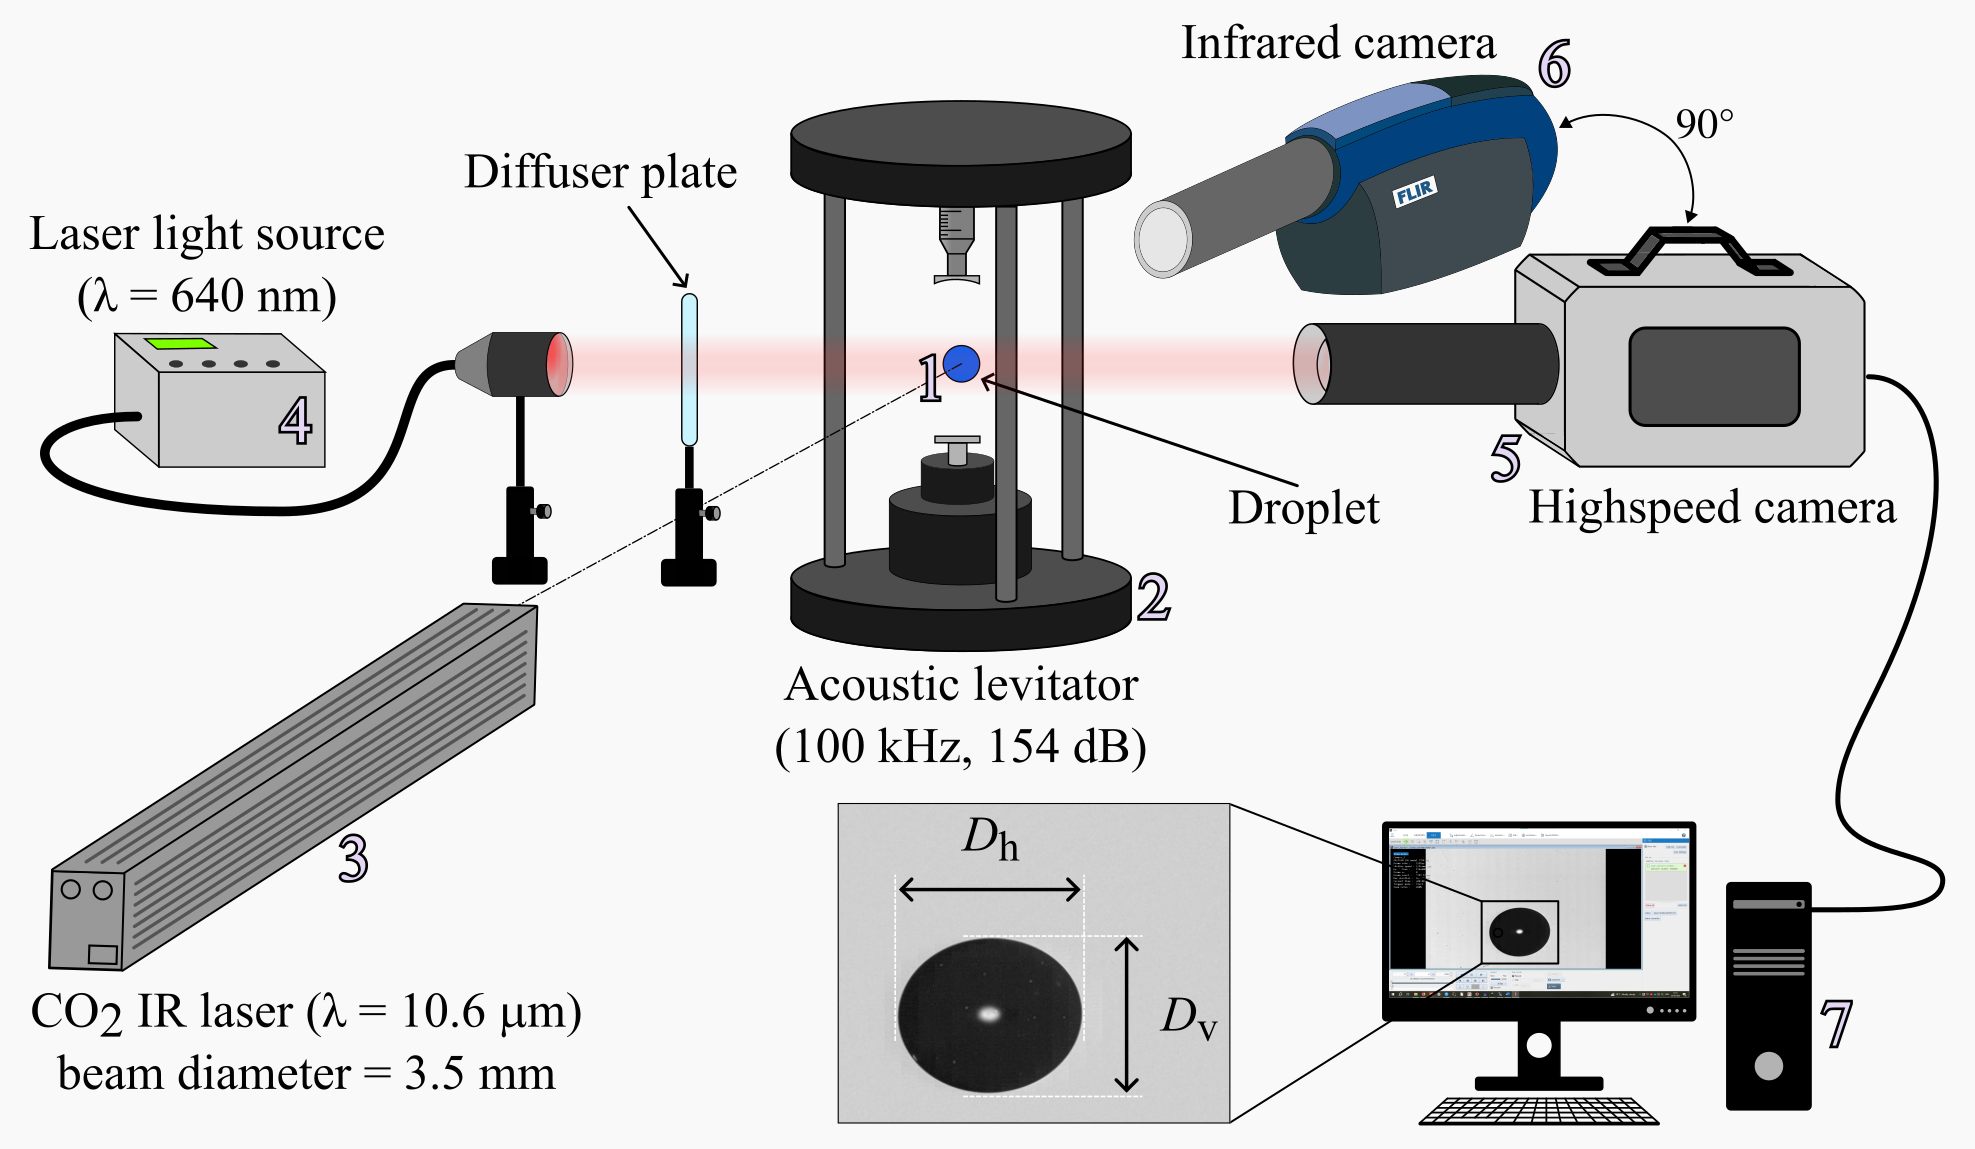
A recording rate of 50-125 frames per second (fps) has been used because of the large time scale associated, along with the spatial resolution of 5.2 per pixel. An infrared camera is used for droplet surface temperature measurement at 170 frames per second. At the minimum, six repetitions for each sample were conducted to ensure the reproducibility of data and capture the probability of occurrence of the phenomenon. The droplet images are analyzed and processed using Photron’s proprietary software PFV4(x64) and ImageJ (version 1.53t). For data plotting and figure preparation, Python 3.10 and Inkscape 1.1.2 have been used, respectively. The equivalent diameter of the droplet is calculated as , where and represent the maximum horizontal and vertical length scales (i.e., diameter) of the droplet as shown in the Figure 2. The uncertainty associated with the calculated droplet diameter and temperature is less than or equal to and , respectively.
3 Results and discussion
3.1 A global overview
A microemulsion droplet undergoes various changes throughout its lifetime when it comes in contact with the infrared (IR) laser. It is important to note that a liquid droplet may respond to electromagnetic irradiation in many different ways, exhibiting various phenomena such as plasma initiation and breakup49, spontaneous nucleation50 and vaporization51. Depending on the irradiation intensity, different phenomena have been observed in the past50. This study investigates the vaporization behavior of microemulsion droplets, which usually requires significantly low irradiation intensity depending on the absorption properties of the liquid. The evaporation of the microemulsion droplet can be divided into three distinct stages primarily characterized by the microemulsion composition(, ) and irradiation intensity. Soon after the droplet is exposed to the irradiation, it starts to heat up, and its temperature increases until it reaches a constant value. The temperature rise causes the droplet to undergo evaporation, as a result, the droplet loses its mass and the diameter of the droplet reduces marginally. At the end of evaporation, the formation of a spherical solid residue is observed. As time progresses, this spherical residue undergoes buckling due to the acoustic pressure and stresses generated during the course of evaporation. The formation of the shell is a unique phenomenon observed for microemulsions, primarily due to the non-volatile nature of the surfactant (AOT) used in this work. A detailed discussion about different stages of evaporation is presented in the next section 3.2.

Primarily, droplet evaporation phenomenon has been observed for all the cases at low irradiation intensity (); however, increasing the irradiation intensity to results in the nucleation of a vapor bubble inside the droplet for decane and xylene based microemulsions (only for higher and values). These vapor bubbles expand and grow, eventually undergoing breakup/collapse. Typically, the bubble nucleation depends on various factors, such as degree of superheat, IR absorbance, heat of vaporization, and number of active nucleation sites. It is important to note that at , we do not observe bubble nucleation across all the samples (i.e., microemulsions with a particular value of and ) and trials (i.e., repetition of experiment for a sample) explored in this study (essentially undisruptive evaporation occurs at ). However, at , most samples exhibit undisruptive evaporation, except for a decane and xylene microemulsion having higher and value. It is to be pointed out that the vapor bubble nucleation at was observed only for a few repetitions in xylene and decane microemulsions, which is expected since the nucleation process is a stochastic phenomenon52. To identify the most probable behavior among evaporation/nucleation, we have calculated their probability of occurrence across all the trials. Figure 3 shows the probability of occurrence of evaporation and/or bubble nucleation for decane microemulsion, where each colored block represents the 20% probability of occurrence. The dominant phenomena have been decided based on the probability of occurrence. For example, the decane microemulsion at and shows an 80% probability of bubble nucleation compared to 20% of undisruptive evaporation.
To study the effect of surfactant on droplet evaporation, experiments were conducted using mixtures of oil and AOT at different AOT concentrations without adding water. Additionally, for completeness of the study, droplet evaporation experiments were also conducted for pure liquids.
3.2 Evaporation of microemulsion droplet
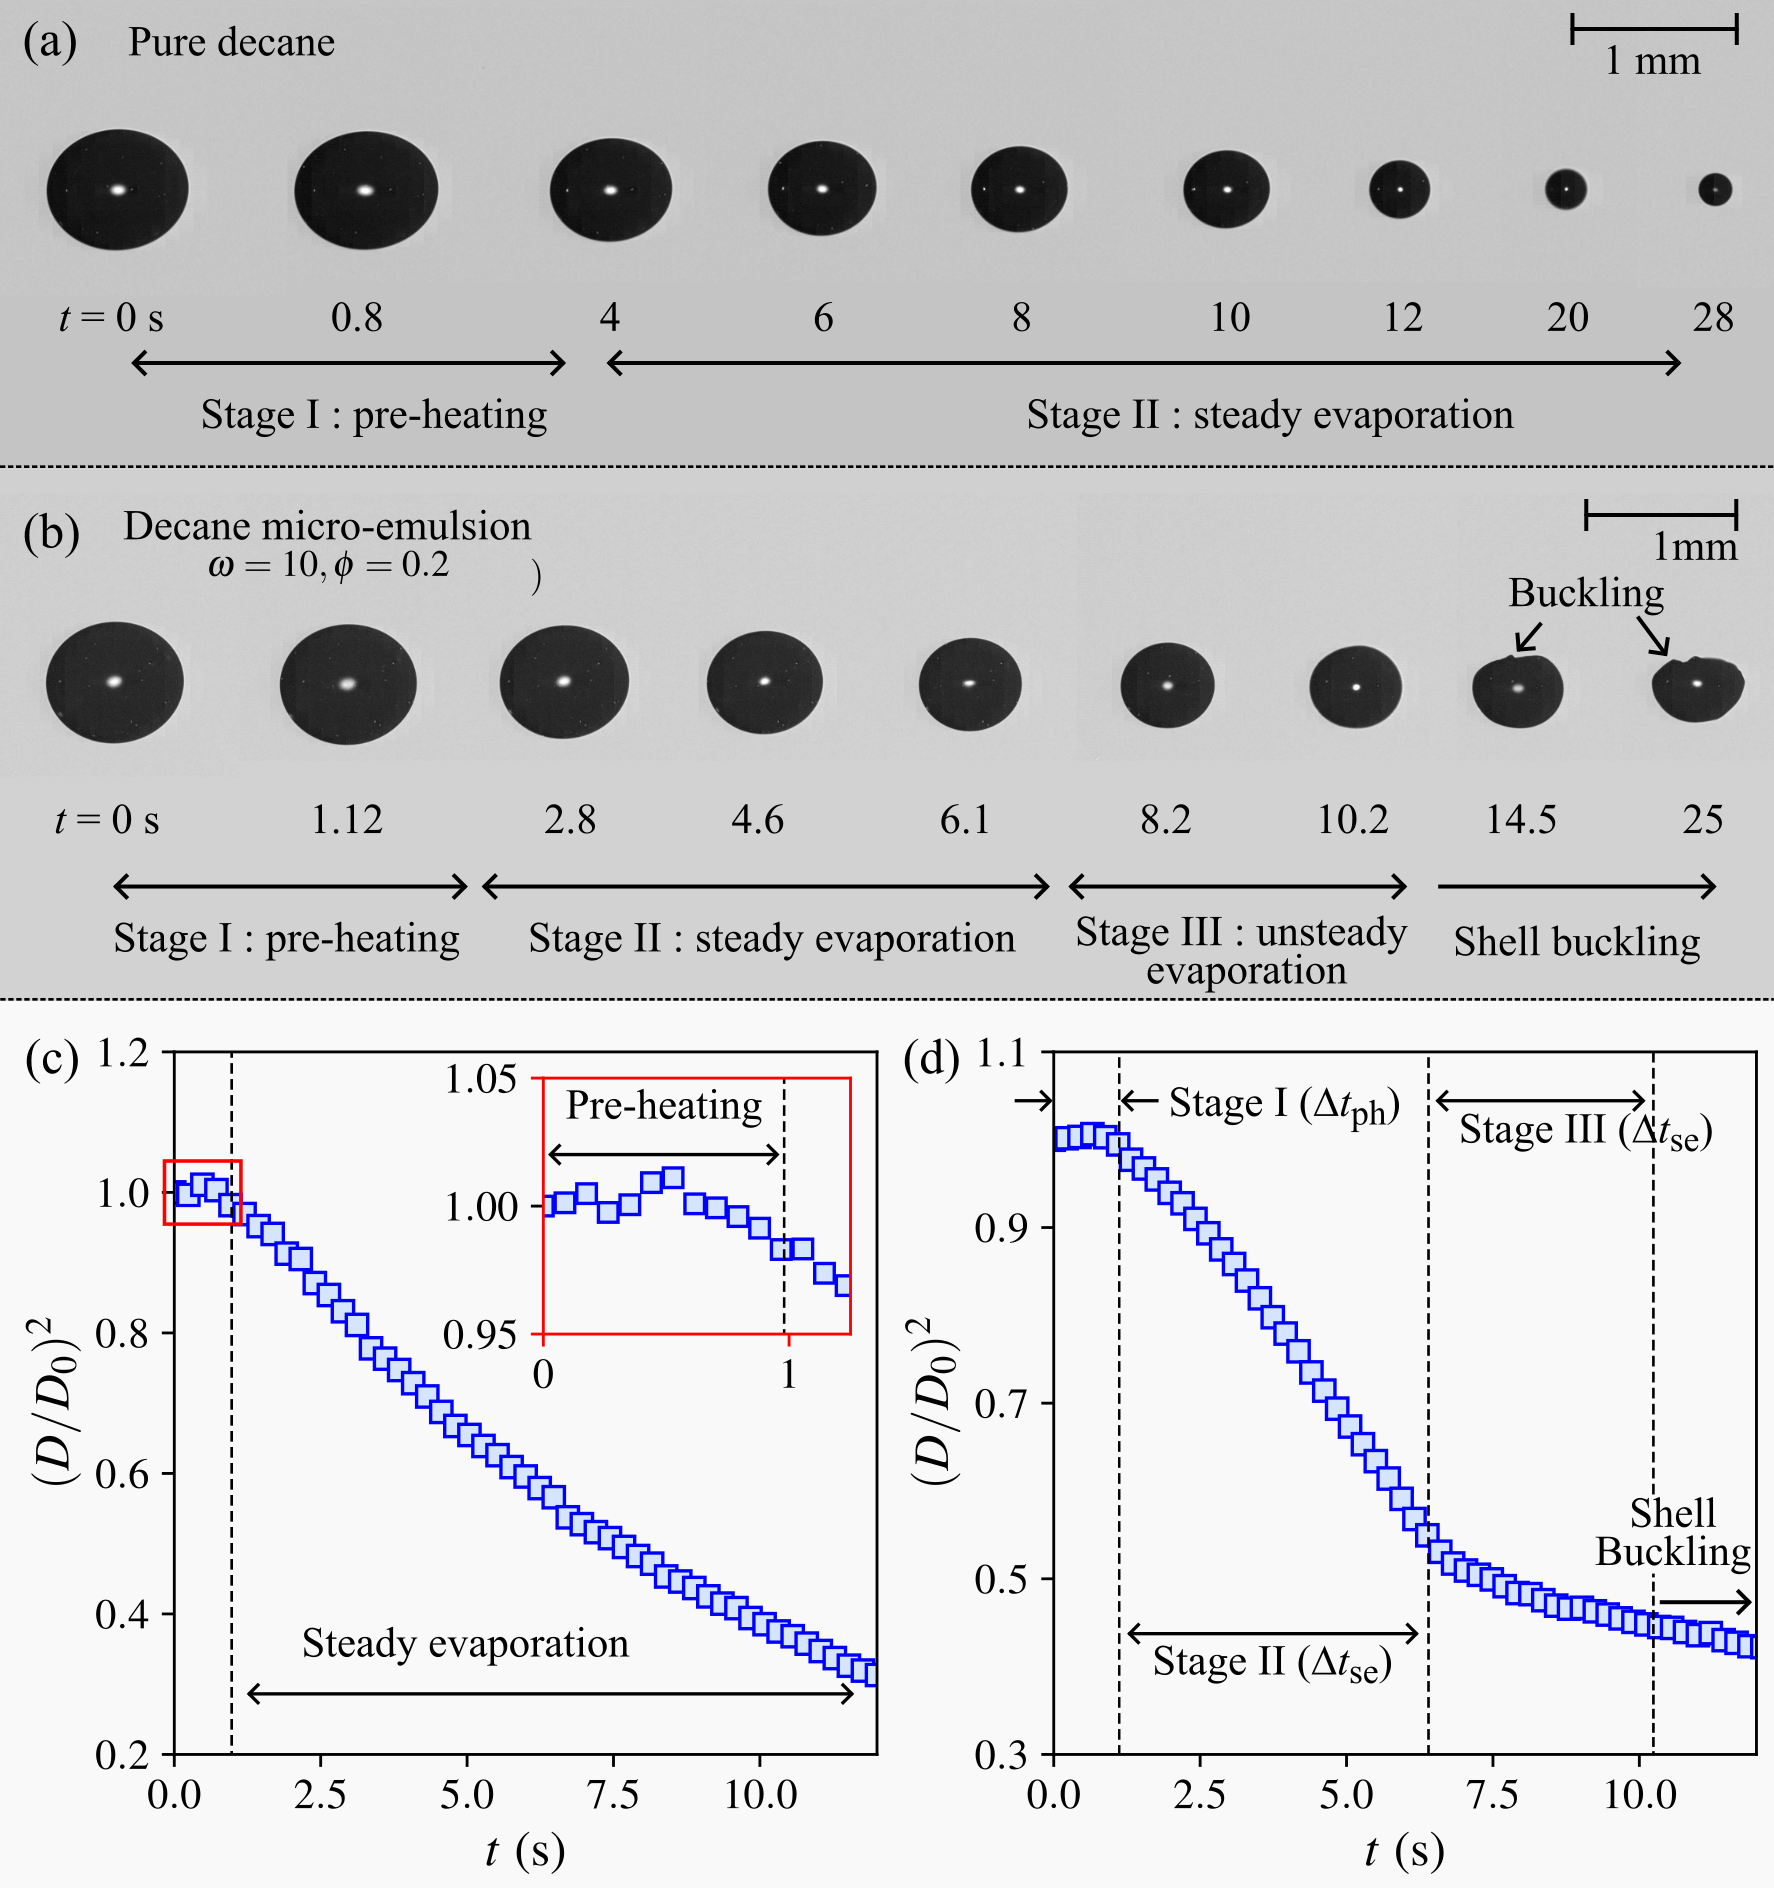
Typically, the evaporation of a single component liquid droplet occurs in two stages upon interaction with an IR laser. Stage I is the preheating Stage, where the irradiation energy increases the temperature of the droplet, with minimal change in its diameter. Stage II corresponds to the steady evaporation stage where the droplet diameter reduces steadily (see Figure 4(a), and (c)) with constant surface temperature 7, 53. During the pre-heating phase, the droplet absorbs the irradiation as sensible heat, which increases its temperature. As a result, the droplet’s surface temperature also rises until it becomes constant. Following this, the droplet starts to evaporate, and the irradiation energy absorbed by the droplet during this phase is utilized to vaporize liquid from the droplet surface in the form of latent heat. Consequently, due to the mass loss from the droplet surface, the pure liquid droplet undergoes near-complete evaporation, reaching a final diameter significantly smaller than its initial size (). Once the droplet reaches this size, it becomes undetectable within the limitations of the current experimental setup, either due to visualization limitations or loss of stable levitation in the acoustic levitator.
The fundamental difference between a pure liquid and a microemulsion droplet is that the pure liquid consists of a single component whereas microemulsions are multi-component systems, which typically contain a base oil (i.e., continuous phase), water (i.e., dispersed phase), and a stabilizer or surfactant. In this study, we use microemulsions (water-AOT-oil) droplet, which has nanometer-sized water sub-droplets dispersed into the continuous phase (oil), where a monolayer of surfactant (AOT) stabilizes the interface between the water and oil, as shown in the Figure 5(a). The microemulsions are a ternary system and quaternary for the surrogate microemulsion (water-AOT-dodecane-xylene) and their evaporation characteristics depend on the molar ratio of water to AOT (), and dispersed phase volume fraction ()47, 44.
The evaporation of a microemulsion droplet has been observed to occur in three different stages, where the first two stages (namely preheating and steady evaporation) are similar to that for single-component droplet evaporation. An additional stage (Stage III) referred to as unsteady evaporation stage is observed, where the droplet evaporation rate continuously decreases until the evaporation completely stops, which is attributed to the non-volatile nature of the surfactant AOT. Upon heating, AOT molecules undergo agglomeration as the evaporation proceeds, and their concentration at the droplet surface increases, leading to the formation of a shell at the end of evaporation. During evaporation, the time scales associated with different stages are affected by the components and compositional parameters ( and ) of the microemulsion and the laser irradiance. The droplet evaporation time (i.e., lifetime) () of a microemulsion droplet, defined as the time period between the start of laser irradiation on the droplet and the end of evaporation, is given as:
| (3) |
where , and denote the preheating, steady, and unsteady evaporation time periods, respectively. The quantitative measures associated with droplet evaporation, such as evaporation rate and time scales, have been calculated from the experimental data and discussed in subsequent sections.
3.2.1 Stage I: Pre-heating
As discussed earlier, during the first stage (pre-heating), the laser irradiation increases the temperature of the droplet. It is important to note that droplet heating exhibits directional dependence due to the unidirectional irradiation from the laser. Consequently, the droplet experiences non-uniform heating initially. However, for an acoustically levitated droplet, the rotation54 and internal flow 55, 56 facilitates the transport of energy throughout the droplet. This eventually leads to a more uniform temperature distribution within the droplet, as shown in the Figure 5(a).
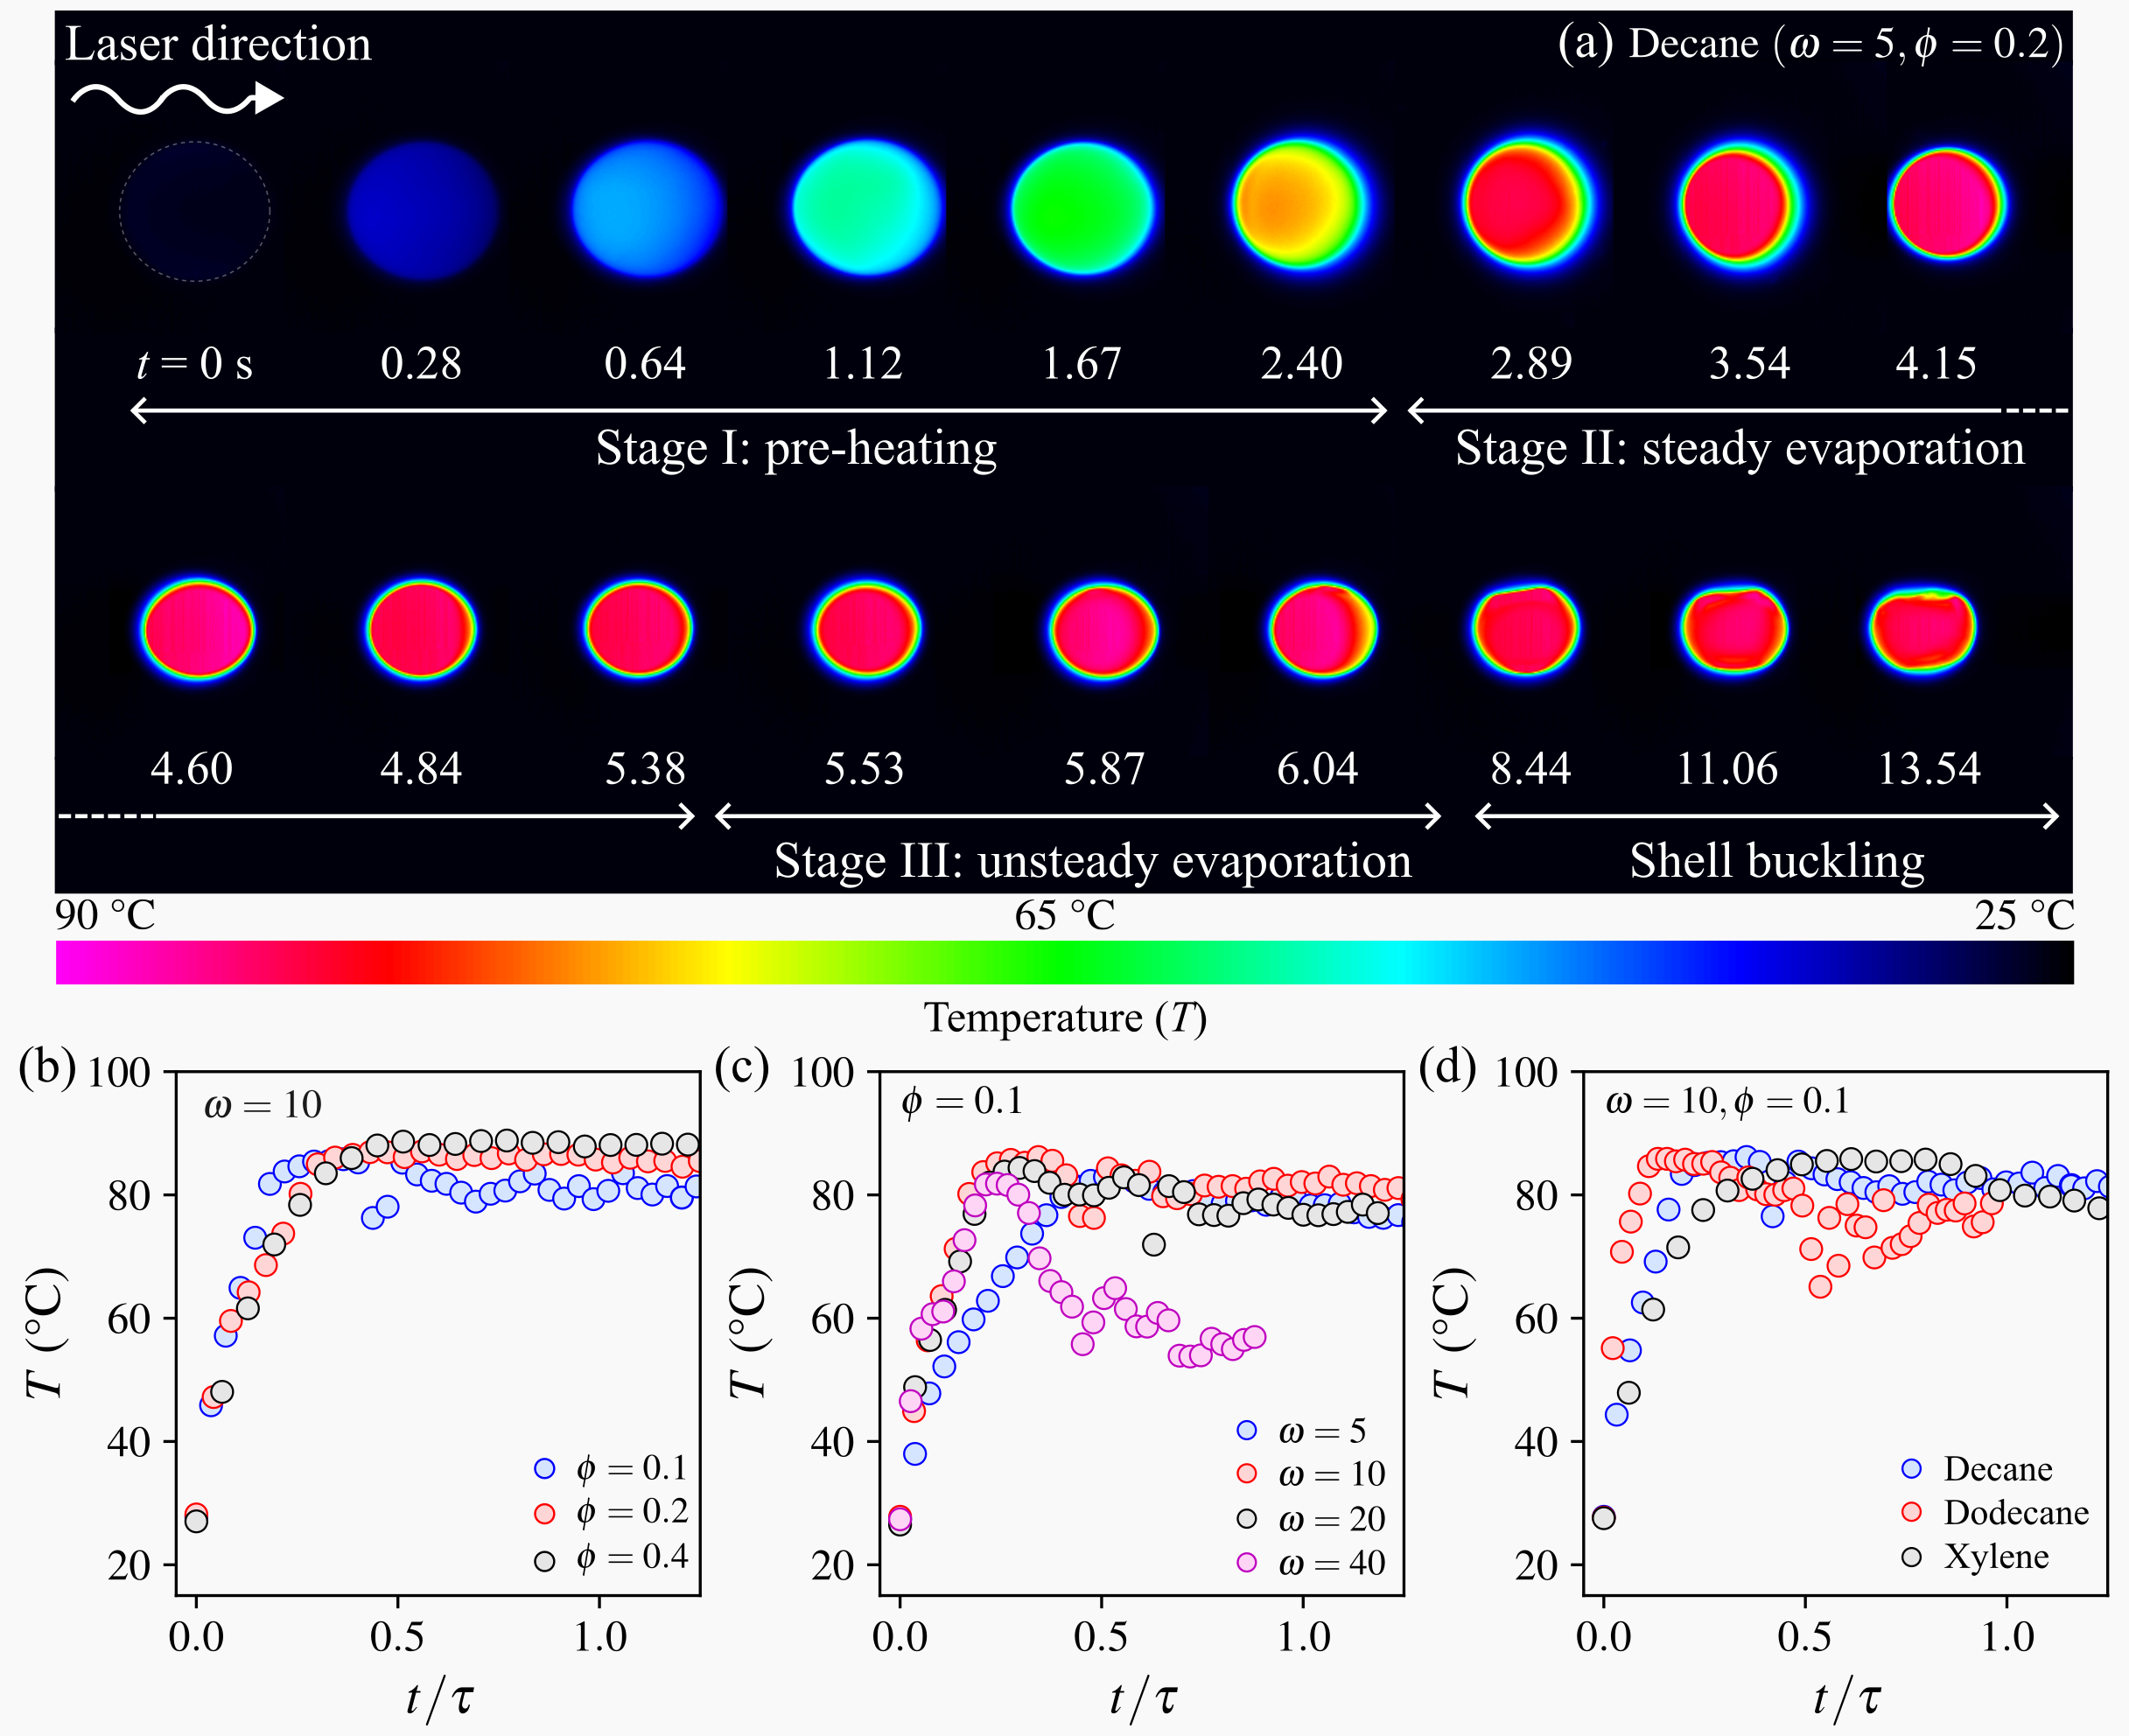
Following laser activation, the temperature of the droplet exhibits a monotonic increase. This initial heating phase is referred to as the pre-heating period, characterized by a continuous rise in temperature as illustrated in Figure 5. During the pre-heating phase, the irradiation from the laser is used to increase the internal energy of the droplet, which translates to a rise in its surface temperature until it becomes constant (wet-bulb temperature57, 53). In this regime, the droplet absorbs energy from the laser as sensible heat, and loss of energy to the surrounding is negligible due to minimal vaporization and conduction (a detailed discussion is presented in section3.2.2). Later, the dominant heat transfer mechanism transitions from sensible heating to latent heat transfer, and this shift in heat transfer dynamics manifests as a plateau in the droplet surface temperature profile. The droplet size does not change significantly during the pre-heating phase; however, the droplet undergoes volumetric expansion, resulting in a marginal increase in the size () of the droplet before the beginning of Stage II. Figure 5(a) shows the infrared images of the droplet surface temperature distribution during the evaporation of water-in-decane microemulsion (). It is observed that the droplet starts to heat-up from the same direction as the laser, indicating the directional heating of the droplet. The evolution of maximum surface temperature is plotted in the Figure 5(b)-(d) for different microemulsions. Figure 5(b) shows that the temperature starts to increase at similar rate and reaches a steady state temperature for the water-in-decane microemulsions at and and . However, a slight variation in the heating rate can be seen for microemulsions with different base oils, (see Figure 5(d)), which translates to a variation in their heating time. The preheating time () can be quantified through two independent analyses: the evolution of droplet diameters through high-speed images and the evolution of surface temperature through thermal imaging. The preheating time () can be determined from the temperature profile by identifying the time interval between the initiation of laser irradiation and the point where the temperature reaches a steady-state.
The preheating time is anticipated to be influenced by the microemulsion parameters (, ) and the properties of constituents (such as IR absorption coefficient, heat capacity, viscosity, and volatility). From Figure 5(b), it is observed that an emulsion droplet with higher exhibits higher preheating time at a particular , however, the difference is minimal. At low heating rate (), the pre-heating time () is seconds, however at higher heating (), this time reduces to seconds. The water-in-decane microemulsion droplet attains a surface temperature () of ℃ for , and it is reduced to ℃ for a lower (0.1) at . A higher temperature for a higher is expected due to the presence of larger number of dispersed sub-droplets. For , for different values, the droplet surface temperature ranges between ℃. The surface temperatures of microemulsions containing different base oils have also been analyzed; the results show that for all the emulsion droplets, the surface temperature ranges between ℃.
3.2.2 Stage II: Steady evaporation
During steady evaporation stage, the droplet undergoes a well-defined, steady-state evaporation phenomenon 53, 7, 58, which is characterized by a constant rate of decrease in droplet diameter, as observed in Figure 4.The evaporation phenomenon can be attributed to a balance between the energy supplied by the laser irradiation and the energy required for vaporization of the droplet, considering a negligible amount of the energy is lost to the surroundings via conduction50. As a result, a cloud of vapor surrounding the droplet surface is created, which then diffuses away due to a concentration gradient.
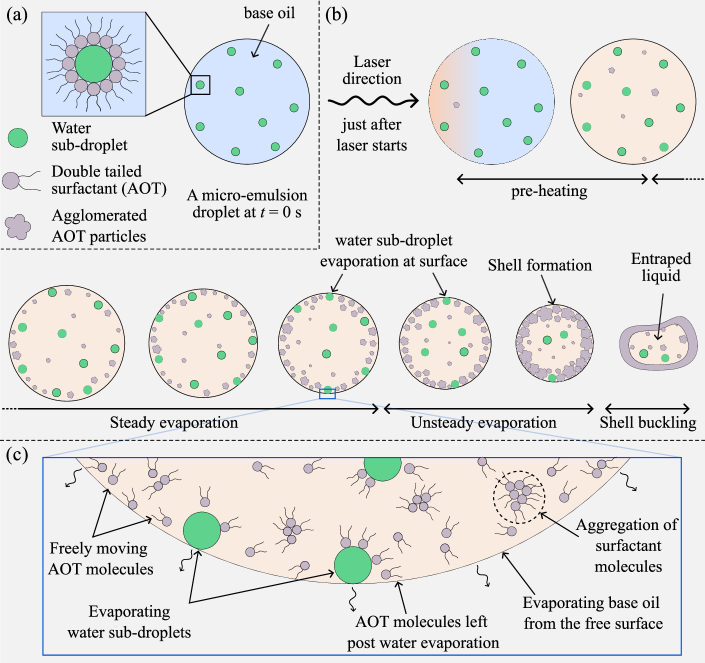
Figure 6(b), shows the various stages of evaporation for a microemulsion droplet. During Stage II, preferential vaporization occurs between the two volatile components (oil and water), while the surfactant AOT does not evaporate due to its non-volatile nature. Thus, the nature of base oil and its properties significantly influence the evaporation rate for a microemulsion droplet. Although the dispersed water sub-droplets can contribute to the overall evaporation rate, their influence is contingent upon transport to the droplet surface. In essence, the rate of evaporation in microemulsion droplets is dictated by the properties of base oil, and the dispersed water sub-droplets must traverse to the surface to participate in evaporation.
Upon heating a microemulsion droplet, the temperature rise induces an increase in the interfacial tension at the interface between the base oil and dispersed water sub-droplets. This elevated temperature could lead to the detachment of AOT molecules from the interface, exceeding a critical threshold. Furthermore, evaporation of liquid mass from the droplet alters the proportion of the volatile component 59. Given the high sensitivity of microemulsions to compositional changes, it is likely that the microemulsion deviates from its original composition and structure, determined using scattering techniques in a closed cuvette. Understanding how the nanostructure and transport properties of these thermodynamically stable microemulsions evolve under elevated temperature and evaporative mass loss remains a significant challenge experimentally. These detached AOT molecules may then aggregate within the droplet to form larger AOT particles (see Figure 6). For a given , the water and AOT volume fraction increases with the increase in . This increased concentration of AOT molecules inherently increases the probability of their agglomeration. Consequently, microemulsions with higher values can be expected to exhibit a greater number of agglomerated AOT particles compared to those with lower .
The overall evaporation rate of a microemulsion droplet is anticipated to be influenced by its constituents and properties, contingent on irradiation intensity. While the readily available base oil at the droplet surface is the primary determinant, dispersed water can also contribute to evaporation when transported to the surface. There are three different mechanisms through which the water sub-droplets may get exposed to the surface; (1) receding droplet surface exposing water sub-droplets due to evaporation, (2) diffusive transport, and (3) convective transport due to internal flow. The receding time scale of the droplet surface is the same as the evaporation time scale, which is of the order at and at . The diffusion time scale () can be calculated using the , where is the effective diffusivity of nanometer-sized dispersed water sub-droplets. The diffusivity of these small sub-droplets is extremely low ()45, therefore the diffusion time scales are very large (for decane microemulsion at ) compared to evaporation time scale. The convection time scale (), where is the velocity inside the acoustically levitated droplet. The convection velocity can be calculated using , where, and and dynamic viscosity and density of the air medium surrounding the droplet, and, and and dynamic viscosity and density of the droplet60. The is the maximum acoustic streaming velocity which is given as , where is the speed of sound and is the Mach number, which is related to the acoustic sound pressure level (), as 54, 60. The convection velocity due to internal flow inside the droplet is which gives the convective time scale of . Although the convective time scale is much smaller compared to the evaporation time scale, it is important to note that the streamlines within an acoustically levitated droplet are azimuthal rather than radial. Therefore, it can be assumed that the convective velocity does not influence water sub-droplet transport towards the surface. As a result, diffusive and convective transport can be assumed to have minimal influence on the overall evaporation of the microemulsion droplet. Therefore, the evaporation of water sub-droplets primarily depend on the receding of evaporating droplet surface. A schematic diagram illustrating the role of different components in microemulsion droplet evaporation is presented in Figure 6(c), however, it is important to note that experimental observation of this phenomenon is extremely difficult due to nanometer size ( nm45) of these water sub-droplets.
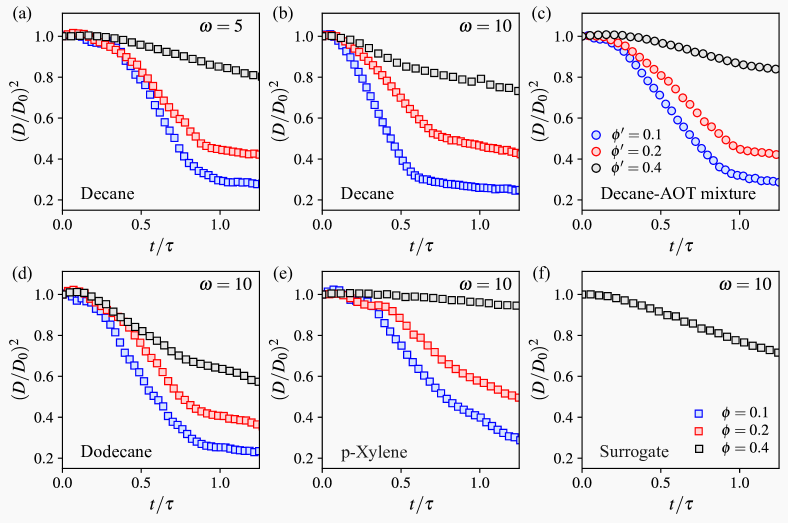
The temporal evolution of normalized droplet diameter is shown in the Figure 7, and it is evident that a strong correlation exists between the dispersed phase volume fraction () and the evaporation rate of microemulsion droplets. For all the values of (water to AOT molar ratio), as (dispersed phase volume fraction) increases, the evaporation rate decreases across all the base oils investigated in this study. The decrease in evaporation rate is primarily governed by two key factors: (1) lower oil volume fraction (), (2) increase in the number of water sub-droplets present in the suspended microemulsion droplet when increases. As discussed before, vaporization at the surface of the droplet is the combination of continuous vaporization of bulk liquid (base oil) and intermittent vaporization of water sub-droplets once exposed at the surface). As increases, the corresponding volume percentage of the base oil in the microemulsion droplet decreases (the volume percent of different components in a microemulsion droplet is tabulated in the Table S1 for 10 and 40). For instance, a droplet with signifies a 90% oil composition by volume, with the remaining 10% constituting the dispersed phase (comprises of water and AOT dictated by (see Equation 1)). The abundant base oil readily replenishes at the droplet surface, leading to a higher evaporation rate, particularly for a lower value of . To isolate the effect of non-volatile surfactant on evaporation, samples with an oil-AOT mixture were also prepared without the addition of water. The oil-AOT mixtures were prepared by adding an exact amount of AOT into oil, corresponding to the microemulsion (). Figure 7(c) shows the droplet lifetime history for decane-AOT mixture (), for different values of . It is observed that an increase in results in a decrease in the evaporation rate of the droplet (oil-AOT). Here represents the decane-AOT mixture corresponding to decane microemulsions at and indicates the corresponding of the microemulsion () which contains the same amount of AOT used to prepare the microemulsion. The prime (′) notation has been adapted in this work to distinguish oil-surfactant mixture from microemulsions.
While the evaporation process is primarily driven by the nature of the base oil, the evaporation of water sub-droplets is contingent upon their exposure to the surface. As time progresses, the continuously increases because of a decrease in the volume of volatile components. This effect becomes even more pronounced for larger due to the high initial concentration of AOT.

In general, the overall droplet evaporation rate () can be estimated using the equation58,
| (4) |
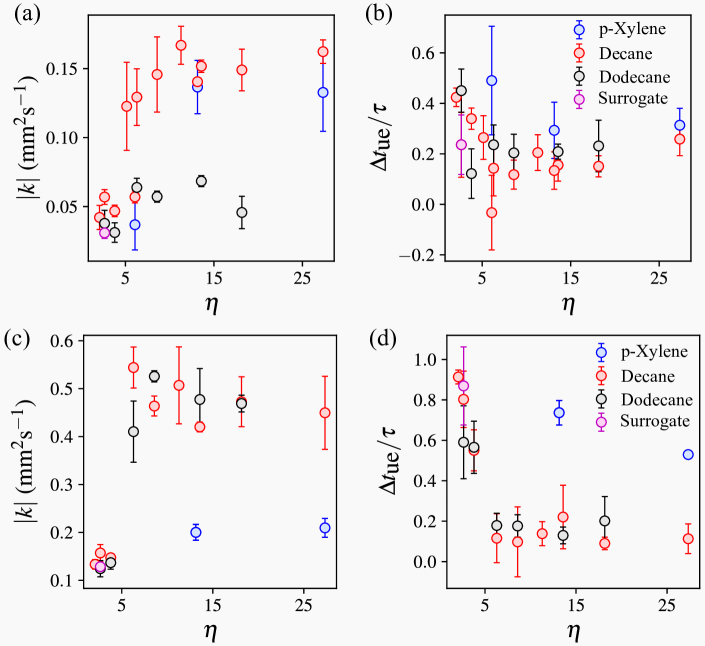
where, is the total evaporation time, and are the final and initial droplet diameter, respectively. In microemulsions, to estimate the steady evaporation rate () from the experimental data, we have calculated the slope of the square of droplet diameter vs the time curve in the steady evaporation phase. The evaporation rate was determined by employing the least squares method implemented within a Python code, which yielded a minimum value of 0.98, indicating a highly linear correlation between the squared diameter of the droplet and time. The evaporation rate for decane microemulsion for different values of as a function of is plotted in the Figure 8(a), which shows that the increase in reduces the rate of evaporation during Stage II. From Figure 7 and Figure 8(a), it is evident that the difference in evaporation rate between and 0.2 is minimal, whereas a significant reduction occurs for . The significant decrease in evaporation rate can be attributed to the higher concentration of AOT. At higher (for example, = 0.4), a denser packing of AOT aggregates at the droplet surface occurs due to a higher concentration of AOT, which reduces the effective surface area for evaporation. The evaporation lifetime () of the droplet is plotted in the Figure 8(b) and (d) for decane microemulsion and different base oils as a function of at . It is seen that the droplet lifetime also decreases with an increase in . A higher leads to the inhibition of evaporation due to the reasons explained above, which eventually terminates the evaporation process much earlier. In essence, the evaporation ends much earlier for higher , resulting in a shorter evaporation lifetime.
To further understand the evaporation process in a microemulsion system, we formulate a parameter, , defined as the ratio of volume fraction of volatile to non-volatile components of the microemulsion droplet. The can be expressed as
| (5) |
As shown in the Figure 8(a) and (c), as the value of increases, the evaporation rate of the droplet also increases. This is expected because increasing essentially indicates an increase of volatile components in the droplet and a reduction in the non-volatile AOT, leading to enhanced evaporation, as discussed before. This behavior is consistent for all the microemulsions with different base oils.
Role of the base oils (continuous phase):
So far, we discussed the effect of and on the evaporation characteristics. Figure 8(c) shows the evaporation rate of microemulsions () having different base oil as a function of at . Decane and xylene show similar values of evaporation rate (). However, the dodecane microemulsion exhibits a much lower evaporation rate for all the values of except at . The evaporation characteristics of the microemulsions having different base oils can be partially explained based on the vapor pressure () of base oil. The vapor pressure of dodecane, decane, and xylene are of the order , and respectively, as shown in the Table 1. As discussed earlier, the characteristics of the base oil primarily control evaporation, and since the vapor pressure of dodecane is one order lower than decane, the dodecane shows a much lower evaporation rate compared to the decane microemulsion. However, despite xylene having the highest vapor pressure among all the base oils, the xylene microemulsion shows an evaporation rate similar to that of decane microemulsion at . The evaporation of a microemulsion droplet is a complex process not solely governed by the characteristics of base oil. Additional factors, such surfactant agglomeration, possibly the nanostructure, can significantly influence the overall evaporation rate. The relatively reduced evaporation rate of the xylene microemulsion can be attributed to the interplay between the vapor pressure of base oil and the agglomeration of surfactant. Due to its high vapor pressure, xylene initially evaporates rapidly from the droplet surface. This rapid evaporation leads to an early and significant rise in the relative concentration of non-volatile AOT at the surface. These particles lack sufficient time to diffuse and achieve a homogeneous distribution throughout the droplet. The high concentration of AOT slows the transport of liquid components toward the droplet surface, effectively limiting the evaporation rate of xylene by reducing the effective surface area for evaporation. It is important to distinguish this Stage from a phase where the droplet surface is entirely covered with AOT particles (which comes much later), effectively halting evaporation.
Figure 9(a) and (c) shows the evaporation rate () for different base oils as a function of at . It is observed that, at a high heating rate, the evaporation rate of the decane and dodecane microemulsion is similar, and the xylene microemulsion exhibits an even lower evaporation rate. This indicates that the combined influence of the vapor pressure and the elevated concentration of AOT near the droplet surface becomes increasingly significant at higher heating rates. This indicates that the combined influence of the vapor pressure and the elevated concentration of AOT particles near the droplet surface becomes increasingly significant at higher heating rates. It is to be noted that this effect is also expected to occur for the emulsion with higher . It is also shown in the Figure 9(a), and (c) that, for the lower value of , we observe very closely packed data points for all the base oils, indicating similar evaporation rates irrespective of the heating rate. Additionally, the evaporation time also depends on the volatility of the base oils and the relative concentration of the AOT. As shown in Figure 8(d), the dodecane microemulsion exhibits the highest evaporation time followed by surrogate, decane, and xylene. This is also consistent with the trend in their evaporation rate.
3.2.3 Stage III : Unsteady evaporation and shell formation
During Stage II, the microemulsion droplet exhibits a constant rate of evaporation, and as time progresses, this process eventually transitions to a stage where the rate of diameter reduction progressively diminishes until it becomes negligible or constant (), as shown in Figure 7 ( indicates the end of Stage III). Between the end of Stage II and the point where the evaporation rate approaches zero is called unsteady evaporation phase (i.e., Stage III). Most of the liquid components evaporate during Stage II. As a result, the relative concentration of surfactant inside the droplet increases drastically at this Stage (II). This creates a liquid-deficient droplet with high AOT concentration. As time progresses, the transport of liquid components to the surface becomes even more difficult. Because of these two phenomena, the evaporation rate of the microemulsion droplet decreases continuously until the evaporation completely stops. Figure 9(b) and (d) show the evaporation time during the unsteady evaporation phase of the droplet. It is observed that the droplet with a lower value of exhibits a larger evaporation time (). This behavior can be attributed to the higher concentration of the AOT relative to the concentration of volatile components (oil and water) leading to an early transition from steady to unsteady evaporation (see Figure 7). As a result, the majority of the liquid evaporation occurs during Stage III and at a slower rate, which leads to an increase in unsteady evaporation time scale ().
Unlike pure liquids, complete evaporation of the droplet does not occur, instead a residual material, often referred to as a “shell" remains following the evaporation process. The basis of the formation of this spherical solid shell can be attributed to the rapid packing of agglomerated AOT particles at the droplet surface compared to their diffusion to the bulk57, 61.
The formation of this spherical shell suggests that a significant amount of the microemulsion components continue to remain even after the evaporation stops. This un-evaporated mass of the droplet gets encapsulated by a layer of agglomerated surfactant, completely closing the shell and thus preventing further mass transfer from the droplet. However, this residue formed post-evaporation is not unique to the microemulsion droplets. These shell-like structures have been observed for several multi-component droplets containing non-volatile components, for instance, nano-particle laden droplets58, 62, polymeric droplets63 and even in biological fluids such as respiratory droplets64, 65. While in all such cases, the evaporating droplet results in residue formation, the characteristics of this residue differ significantly. For instance, respiratory droplets do not undergo buckling (a phenomenon observed in the present work, which will be discussed further) but instead show crystal formation66.
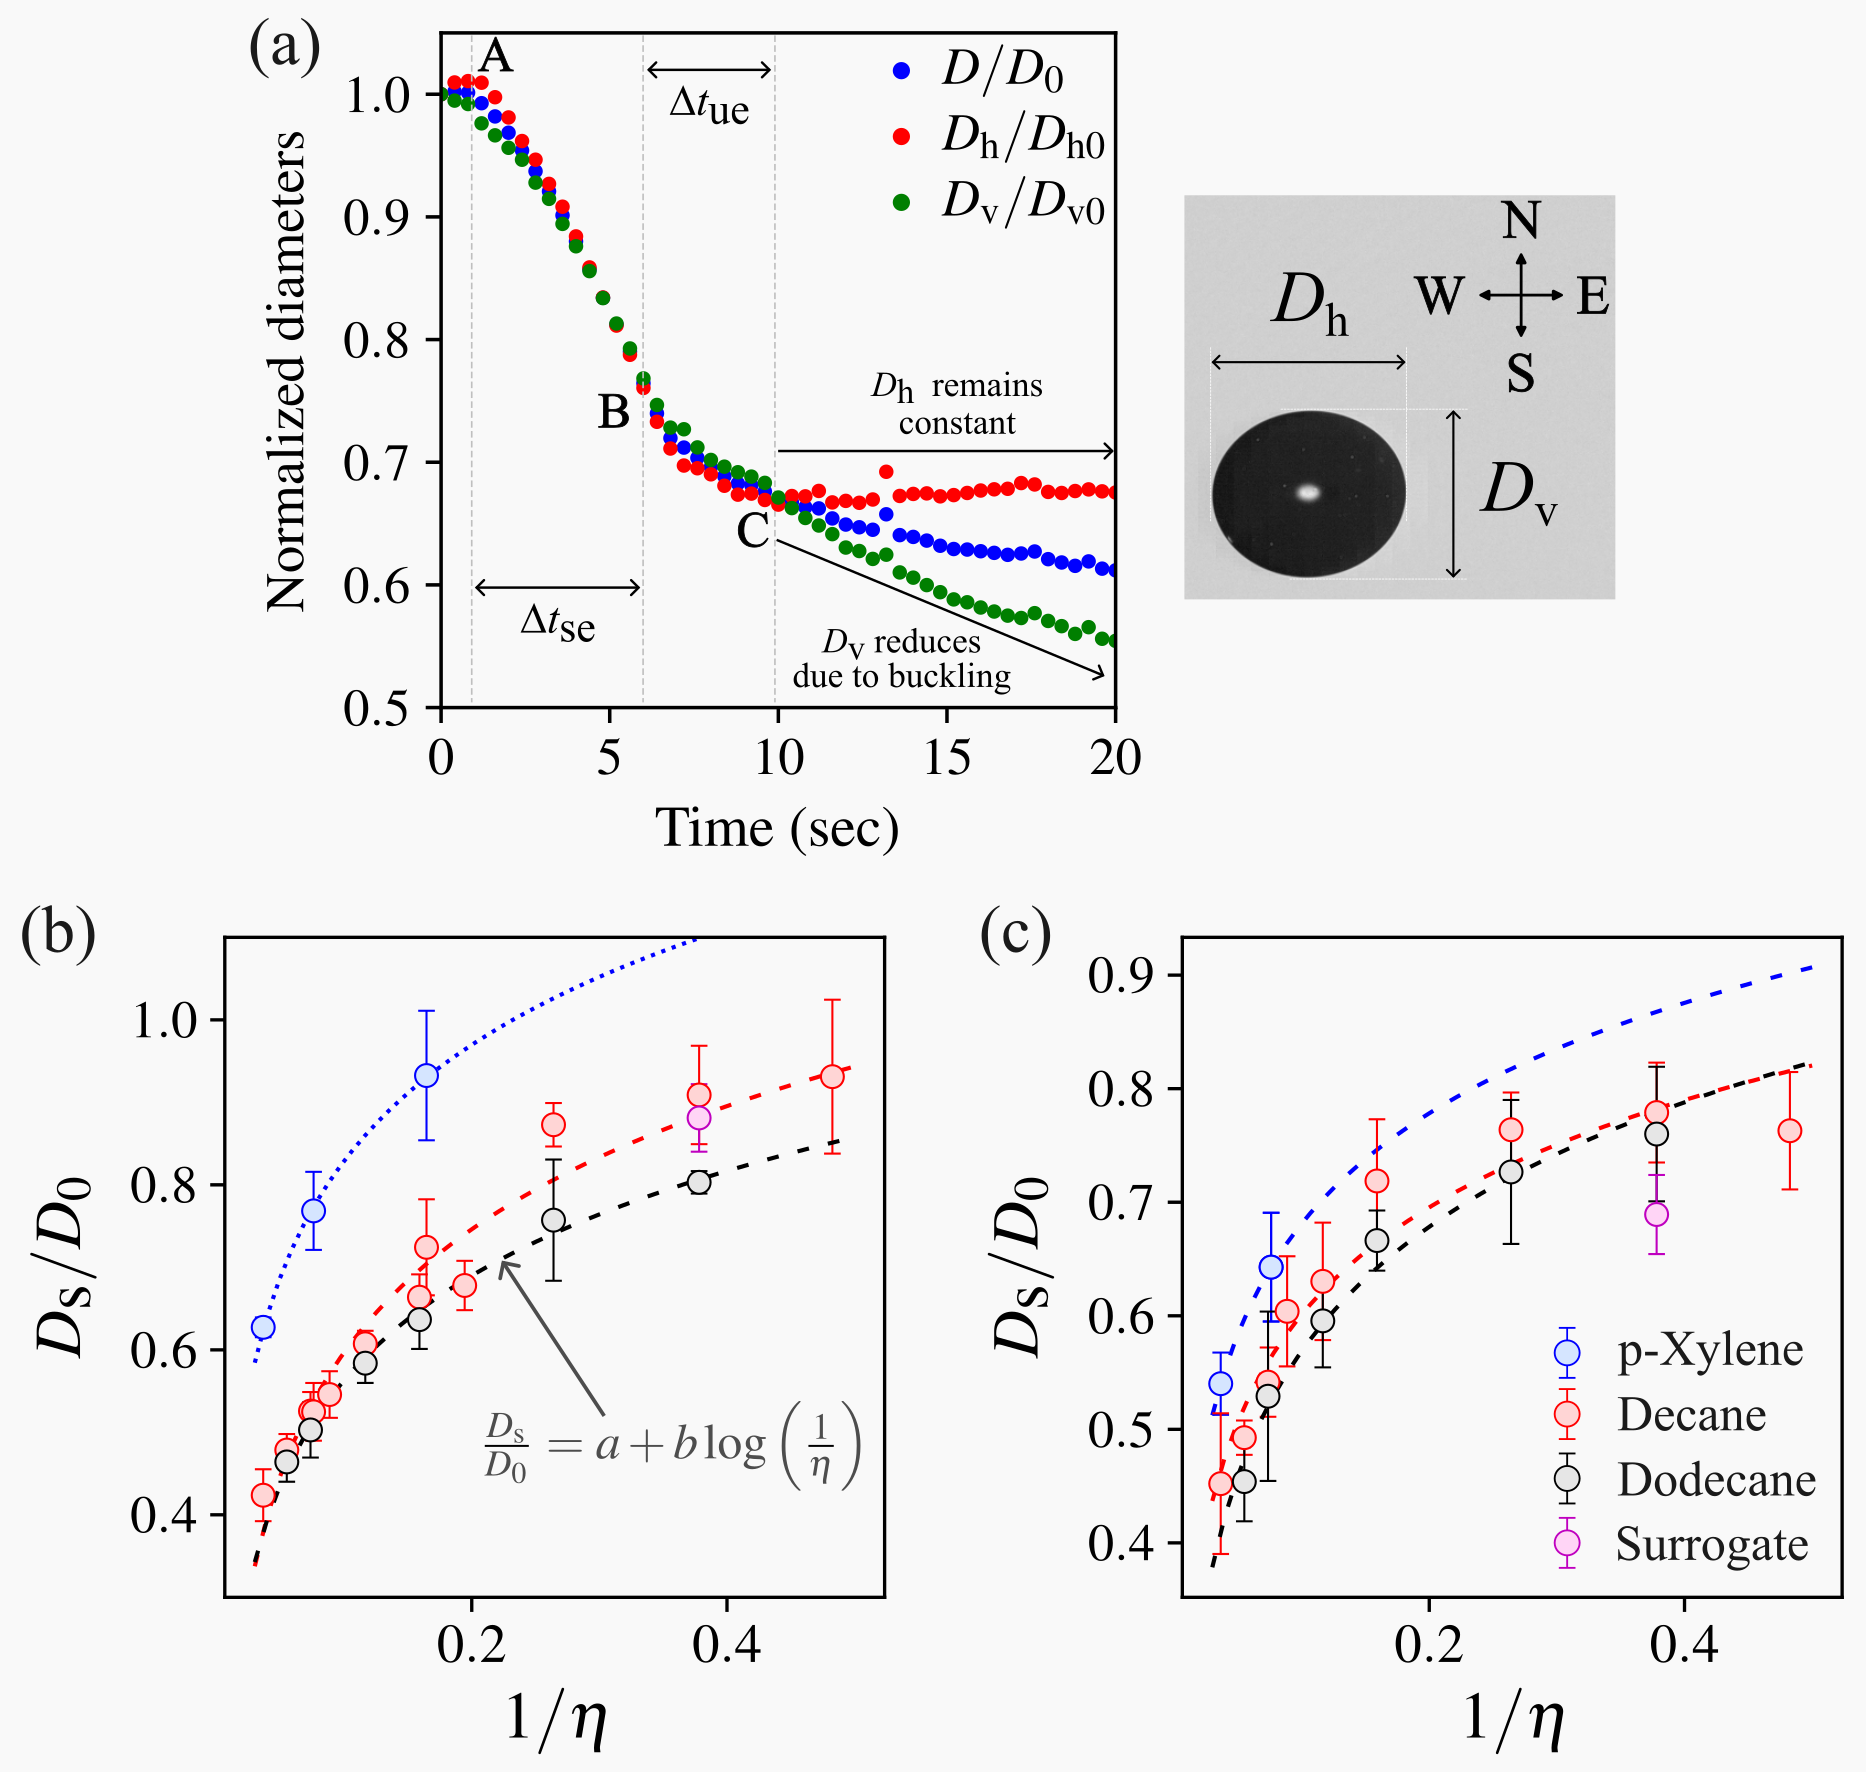
At the onset of the shell formation, droplet evaporation stops, which translates to a negligible change in the size of the residual structure. Therefore, this should indicate a zero slope in the diameter vs time curve (see Figure 4(c), Figure 7). As evident from the figures, it is difficult to ascertain the point where the droplet evaporation ends. We observe a persistent reduction in droplet size for a significant time interval (10 - 30 seconds), even after the shell formation. To elucidate this unexpected observation, a detailed analysis of droplet diameter evolution is carried out. Figure 10 (a) presents the temporal evolution of horizontal () and vertical () characteristic lengths (diameter) of the microemulsion droplet along with the equivalent droplet diameter (). It is observed that, during stages II and III, the horizontal and vertical diameters reduce proportionally with the equivalent diameter. For an evaporating droplet, it is expected that both of its characteristic diameters (horizontal and vertical) should decrease with time as a result of a reduction in the overall droplet volume. However, a significant deviation from this anticipated behavior of the droplet diameters has been observed after point C, as shown in Figure 10(a). While the horizontal diameter appears to reach a plateau, indicating minimal change in droplet size with time, the vertical diameter continues to decrease in size. This discrepancy between the horizontal and vertical diameter variations is attributed to the buckling of the spherical shell. The evaporation is considered to stop at the point (C), where the horizontal diameter becomes constant.
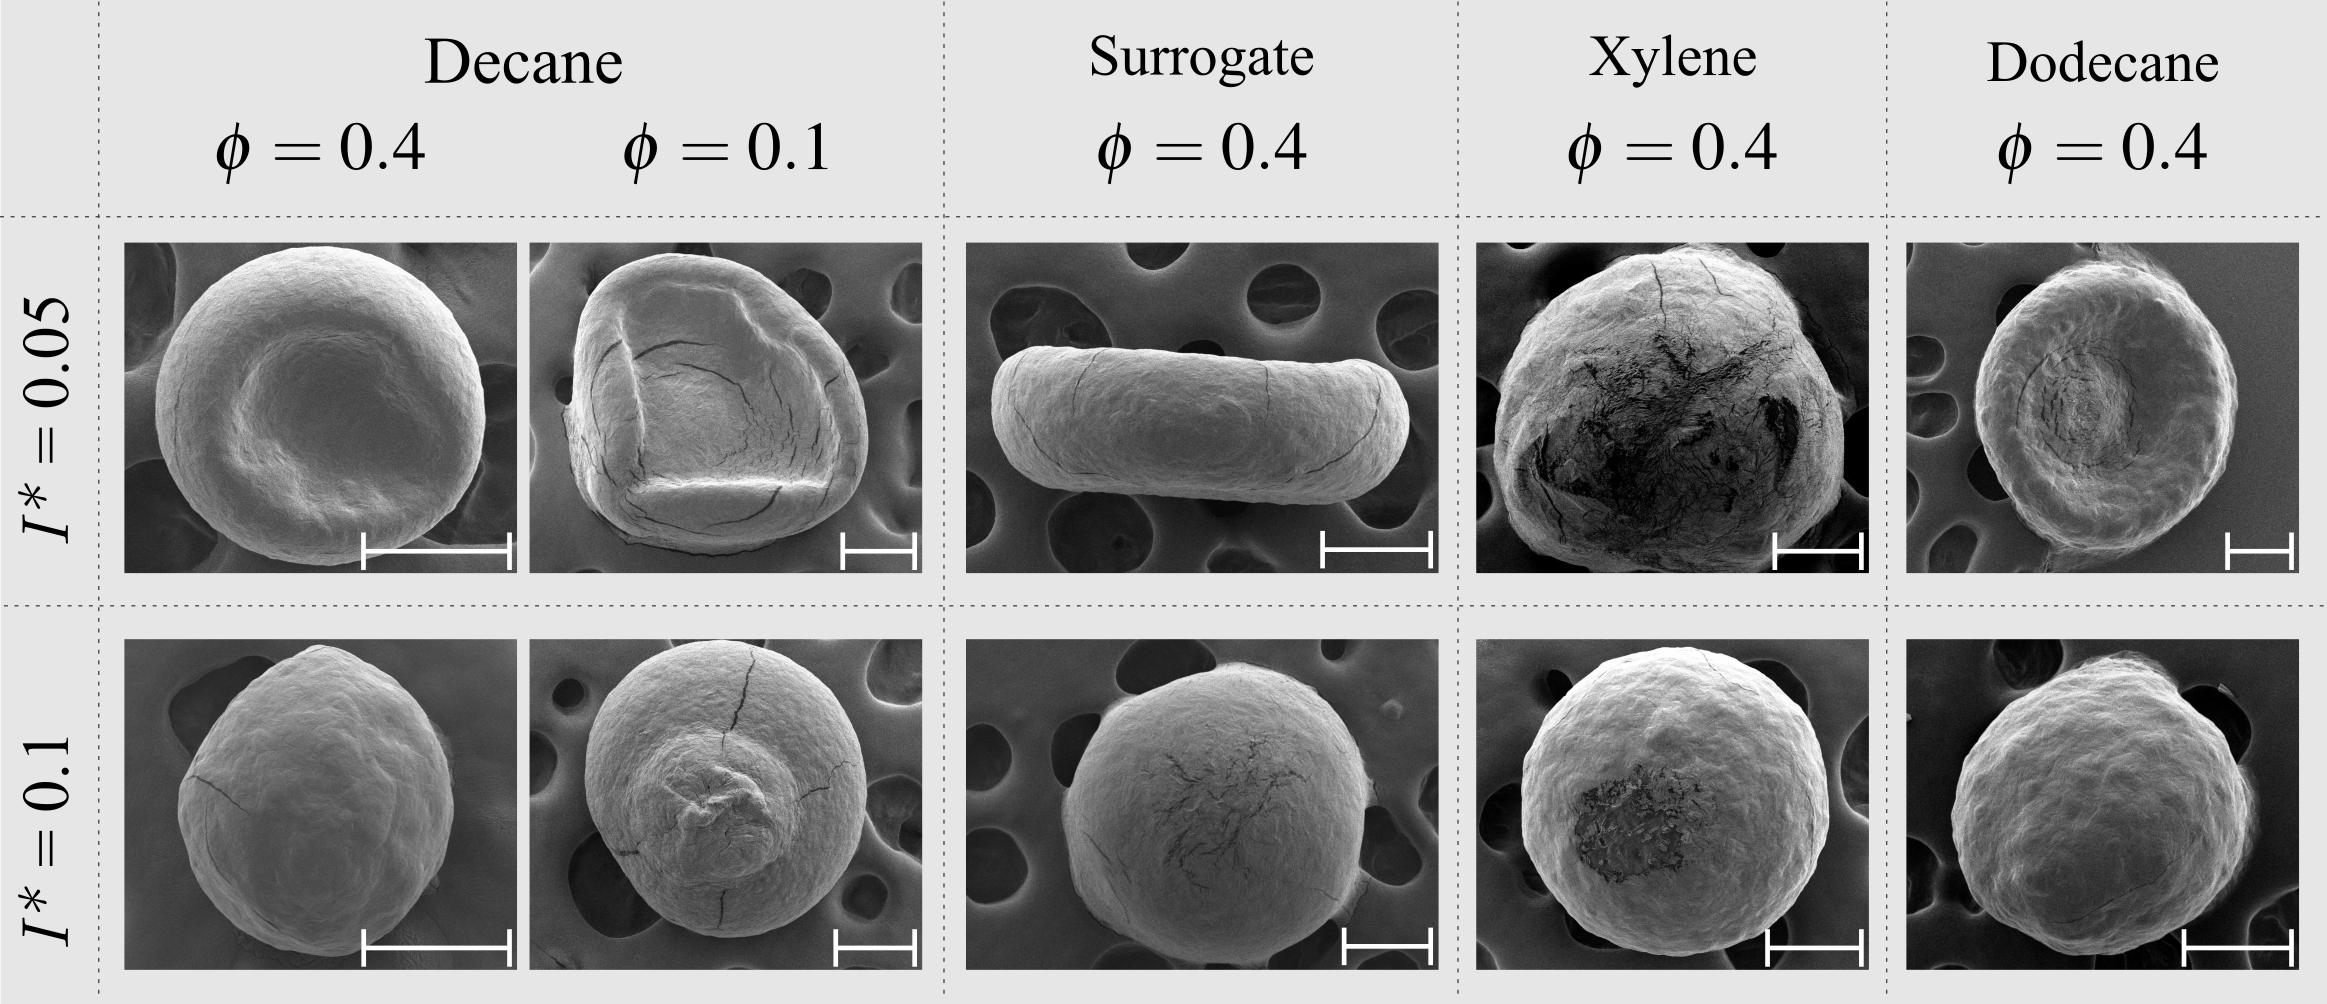
The spherical shell exhibits localized buckling, majorly at its north (N) and south poles (S). The deformation of these shells is typically attributed to capillary forces. Liquid evaporation at the droplet surface induces the formation of microscopic pores within the AOT shell. These pores function as tiny menisci, where the Laplace pressure () acting just inside the meniscus falls below the ambient atmospheric pressure. The curvature-induced capillary force pulls the liquid out of the pores and pulls the spherical shell inwards, eventually leading to the buckling of the shell67. In addition to capillary forces, acoustic radiation forces acting on the droplet might also influence the observed shell buckling phenomenon. It is observed that the buckling primarily occurs at the north (N) and south (S) poles of the shell, which are also seen in the SEM images of the residual shell (Figure 11 at ). This observation suggests a potential role of acoustic pressure in the buckling phenomenon, particularly since the droplet is subjected to a continuous acoustic field. Notably, the spherical shell may not always undergo buckling. A spherical shell morphology can also be observed at the end of Stage III, which is referred to as shell jamming (see Figure 11 at ) xylene microemulsion at ). It is observed that initially, the north pole of the shell buckles, which is followed by buckling in the south pole (see Figure 4(b)). The observed behavior can be attributed to the influence of gravity. During evaporation, the liquid within the droplet may tend to accumulate at the south pole due to gravitational pull and surface tension forces acting at the interface ensure the spherical shape.
The final diameter of the residual spherical shell at the end of Stage III is measured from the shadowgraph images. The shell size depends on both the evaporation rate and the volume fraction ratio () of the volatile to non-volatile components within the parent droplet. Figure 10(b) and (c) show the variation of the shell size () as a function of at and , respectively. It can be seen that a higher shell size is inversely proportional to the volume fraction ratio (). The shell size of the xylene microemulsion exhibits large shell sizes compared to the other microemulsions. The larger shell size can be attributed to the high vapor pressure of xylene which leads to its faster evaporation. Therefore, the rate of accumulation of AOT particles is much faster than their diffusion/transport throughout the droplet causing an early and larger shell formation. Typically, for xylene microemulsion, no buckling has been observed at a higher heating rate (see Figure 11). The faster evaporation rate of xylene causes the shell to form early such that the solid residual structure can sustain deformation due to the acoustic radiation pressure.
A smooth temporal variation of non-dimensional droplet diameter for all microemulsions has been observed at IR irradiation intensity of . Similar behavior has been observed at as well, except for xylene and decane microemulsion. The xylene (, ) and decane (, ) microemulsions show bubble nucleation and breakup at . Note that the focus of the present study is to investigate the evaporation characteristics in stable microemulsion droplets. Thus, the study of bubble nucleation and breakup lies beyond the scope of this work and is not addressed herein.
4 Conclusions
We explore the evaporation dynamics of stable microemulsion droplets in a contactless environment using an infrared continuous laser. The key evaporation characteristics of stable emulsion droplets are as follows.
-
1.
The microemulsion droplet exhibits three distinct stages of evaporation: pre-heating, steady evaporation, and unsteady evaporation. At the end of evaporation, the droplets result in a spherical residue.
-
2.
Pre-heating corresponds to the transient heating period of the droplet, where its surface temperature increases and becomes constant after a certain time period, i.e., preheating time (. The ranges from seconds at irradiation intensity of , whereas it reduces to seconds at .
-
3.
During Stage II, the droplet undergoes steady evaporation, and the rate of evaporation is observed to decrease with the increase in for a constant . It is shown that the evaporation of a microemulsion droplet is governed by the complex interplay between its constituents and their properties. A parameter was introduced, which indicates the cumulative influence of various factors () affecting the evaporation process. Moreover, the nanostructure of microemulsion may have a role in droplet evaporation, however, more evidence is needed to confirm its influence on evaporation.
-
4.
As time progresses, the evaporation rate continuously decreases until the evaporation stops, (Stage III). Finally, the droplet transforms into a solid residual structure. The morphology of this residual shell is spherical, which further undergoes buckling at its south and north poles. This shell size ) is observed to increase as the value of decreases ().
-
5.
Among all the base oils used in this study, the xylene microemulsion shows a larger shell size in comparison to other microemulsions with a different oil phase. This may be attributed to its high vapor pressure of the xylene.
-
6.
At higher heating, we usually observe a nearly spherical shell in contrast to a buckled non-spherical structure for a lower heating rate.
5 Author’s Contribution
Bal Krishan: Experiments, Data curation, Data Processing and Analysis, Writing – original manuscript, Writing – review & editing. Preetika Rastogi: Experiments, Data curation, Scanning Electron Microscopy, Conceptualization, Writing – review & editing. D. Chaitanya K. Rao: Experiments, Conceptualization, Theoretical Analysis, Writing – review & editing. Niket S. Kaisare: Conceptualization, Resources, Writing – review & editing, travel grant. Madivala G. Basavaraj: Conceptualization, Resources, Writing – review & editing, travel grant. Saptarshi Basu: Conceptualization, Resources, Theoretical Analysis, Writing – review & editing.
The authors thank Dr. Durbar Roy and Vadlamudi Gautham for insightful discussions and suggestions, Dr. Gannena K.S. Raghuram for his assistance with the rheology experiments and G. Prashanth for help with imaging on the high resolution scanning electron microscopy (HR-SEM) procured through a DST-FIST grant at the Department of Chemical Engineering, IIT-Madras. We also acknowledge Dr. Najet Mahmoudi for SAXS and WAXS experiments carried out at the ISIS Neutron and Muon Source at the Rutherford Appleton Laboratory, Didcot, UK. Funding from SPARC is gratefully acknowledged.
Data Availability Statement
The data that support the findings of this study are available
from the corresponding author upon reasonable request.
Author Declarations
The authors have no conflicts to disclose.
References
- Samborska et al. 2024 Samborska, K.; Budziak-Wieczorek, I.; Matwijczuk, A.; Witrowa-Rajchert, D.; Gagoś, M.; Gładyszewska, B.; Karcz, D.; Rybak, K.; Jaskulski, M.; Barańska, A.; Jedlińska, A. Powdered plant beverages obtained by spray-drying without carrier addition-physicochemical and chemometric studies. Scientific Reports 2024, 14, 4488, Publisher: Nature Publishing Group
- Dantas et al. 2024 Dantas, A.; Piella-Rifà, M.; Costa, D. P.; Felipe, X.; Gou, P. Innovations in spray drying technology for liquid food processing: Design, mechanisms, and potential for application. Applied Food Research 2024, 4, 100382
- Kapilan et al. 2023 Kapilan, N.; Isloor, A. M.; Karinka, S. A comprehensive review on evaporative cooling systems. Results in Engineering 2023, 18, 101059
- Xu et al. 2021 Xu, R.; Wang, G.; Jiang, P. Spray Cooling on Enhanced Surfaces: A Review of the Progress and Mechanisms. Journal of Electronic Packaging 2021, 144
- Williams 1973 Williams, A. Combustion of droplets of liquid fuels: A review. Combustion and Flame 1973, 21, 1–31
- Law 1982 Law, C. K. Recent advances in droplet vaporization and combustion. Progress in Energy and Combustion Science 1982, 8, 171–201
- Chaitanya Kumar Rao and Basu 2020 Chaitanya Kumar Rao, D.; Basu, S. Phenomenology of disruptive breakup mechanism of a levitated evaporating emulsion droplet. Experimental Thermal and Fluid Science 2020, 115, 110086
- Naka and Hasegawa 2020 Naka, M.; Hasegawa, K. Breakup characteristics of levitated droplets in a resonant acoustic field. Physics of Fluids 2020, 32, 124109, Publisher: American Institute of Physics
- Pandey et al. 2017 Pandey, K.; Chattopadhyay, K.; Basu, S. Combustion dynamics of low vapour pressure nanofuel droplets. Physics of Fluids 2017, 29
- Erbil 2012 Erbil, H. Y. Evaporation of pure liquid sessile and spherical suspended drops: A review. Advances in Colloid and Interface Science 2012, 170, 67–86
- Vehring 2008 Vehring, R. Pharmaceutical Particle Engineering via Spray Drying. Pharmaceutical Research 2008, 25, 999–1022
- Hu and Larson 2002 Hu, H.; Larson, R. G. Evaporation of a Sessile Droplet on a Substrate. The Journal of Physical Chemistry B 2002, 106, 1334–1344
- Timm et al. 2019 Timm, M. L.; Dehdashti, E.; Jarrahi Darban, A.; Masoud, H. Evaporation of a sessile droplet on a slope. Scientific Reports 2019, 9, 19803
- Gelderblom et al. 2022 Gelderblom, H.; Diddens, C.; Marin, A. Evaporation-driven liquid flow in sessile droplets. Soft Matter 2022, 18, 8535–8553, Publisher: The Royal Society of Chemistry
- Korenchenko and Zhukova 2022 Korenchenko, A. E.; Zhukova, A. A. Sessile droplet evaporation in the atmosphere of different gases under forced convection. Physics of Fluids 2022, 34, 042102
- Teng et al. 2023 Teng, L.; Wang, W.; Huang, X.; Luo, X.; Li, W.; Li, J.; Yin, P.; Luo, Y.; Jiang, L. Evaporation of sessile droplet on surfaces with various wettability. Chemical Engineering Science 2023, 268
- Thampi and Basavaraj 2023 Thampi, S. P.; Basavaraj, M. G. Drying drops of colloidal dispersions. Annual Review of Chemical and Biomolecular Engineering 2023, 14, 53–83
- Mandal and Bakshi 2012 Mandal, D. K.; Bakshi, S. Internal circulation in a single droplet evaporating in a closed chamber. International Journal of Multiphase Flow 2012, 42, 42–51
- Chini and Amirfazli 2013 Chini, S. F.; Amirfazli, A. Understanding the evaporation of spherical drops in quiescent environment. Colloids and Surfaces A: Physicochemical and Engineering Aspects 2013, 432
- Mashayek 2001 Mashayek, F. Dynamics of evaporating drops. Part I: formulation and evaporation model. International Journal of Heat and Mass Transfer 2001, 44, 1517–1526
- Ranz 1952 Ranz, W. E. Evaporation from Drops-I and-II. Chem. Eng. Progr 1952, 48, 141–146
- Ranz 1952 Ranz, W. E. Evaporation from Drops-I and-II. Chem. Eng. Progr 1952, 48, 141–146
- Faeth 1977 Faeth, G. M. Current status of droplet and liquid combustion. Progress in Energy and Combustion Science 1977, 3, 191–224
- Chen 2020 Chen, L.-D. Effects of ambient temperature and humidity on droplet lifetime – A perspective of exhalation sneeze droplets with COVID-19 virus transmission. International Journal of Hygiene and Environmental Health 2020, 229, 113568
- Brutin and Starov 2018 Brutin, D.; Starov, V. Recent advances in droplet wetting and evaporation. Chemical Society Reviews 2018, 47, 558–585, Publisher: Royal Society of Chemistry
- Rastogi et al. 2024 Rastogi, P.; Kaisare, N. S.; Basavaraj, M. G. Emulsions as Viable Alternative to Conventional Fuels: Current Status and Challenges. Langmuir 2024, 40, 2800–2808
- Kadota and Yamasaki 2002 Kadota, T.; Yamasaki, H. Recent advances in the combustion of water fuel emulsion. Progress in Energy and Combustion Science 2002, 28
- Shinjo et al. 2014 Shinjo, J.; Xia, J.; Ganippa, L. C.; Megaritis, A. Physics of puffing and microexplosion of emulsion fuel droplets. Physics of Fluids 2014, 26, 103302
- Gowrishankar et al. 2020 Gowrishankar, S.; Rastogi, P.; Krishnasamy, A.; others Investigations on NO x and Smoke Emissions Reduction Potential through Water-in-Diesel Emulsion and Water Fumigation in a Small-Bore Diesel Engine; 2020
- Gopidesi and Selvi Rajaram 2022 Gopidesi, R. K.; Selvi Rajaram, P. A review on emulsified fuels and their application in diesel engine. International Journal of Ambient Energy 2022, 43, 732–740, Publisher: Taylor & Francis _eprint: https://doi.org/10.1080/01430750.2019.1667435
- Priyadarshini et al. 2024 Priyadarshini, S.; Kushari, A.; Rao, D. C. K. Atomization behavior of burning stable emulsion droplets. Fuel 2024, 371
- Rao and Basu 2020 Rao, D. C. K.; Basu, S. Atomization modes for levitating emulsified droplets undergoing phase change. Experiments in Fluids 2020, 61, 41
- Shen et al. 2020 Shen, S.; Che, Z.; Wang, T.; Yue, Z.; Sun, K.; Som, S. A model for droplet heating and evaporation of water-in-oil emulsified fuel. Fuel 2020, 266, 116710
- Gopu and Mampallil 2022 Gopu, M.; Mampallil, D. Distributed evaporation of water-in-oil emulsion drops on solid surfaces. Physics of Fluids 2022, 34, 102110
- Friberg and Langlois 1992 Friberg, S. E.; Langlois, B. Evaporation from Emulsions. Journal of Dispersion Science and Technology 1992, 13, 223–243, Publisher: Taylor & Francis_eprint: https://doi.org/10.1080/01932699208943310
- de Souza Lima et al. 2020 de Souza Lima, R.; Ré, M. I.; Arlabosse, P. Drying droplet as a template for solid formation: A review. Powder Technology 2020, 359, 161–171
- Dellamary et al. 2000 Dellamary, L. A.; Tarara, T. E.; Smith, D. J.; Woelk, C. H.; Adractas, A.; Costello, M. L.; Gill, H.; Weers, J. G. Hollow porous particles in metered dose inhalers. Pharmaceutical Research 2000, 17, 168–174
- Sharma and Shah 1985 Sharma, M. K.; Shah, D. O. Macro- and Microemulsions; ACS Symposium Series; American Chemical Society, 1985; Vol. 272; pp 1–18, Section: 1
- Preetika et al. 2019 Preetika, R.; Mehta, P. S.; Kaisare, N. S.; Basavaraj, M. G. Kinetic stability of surfactant stabilized water-in-diesel emulsion fuels. Fuel 2019, 236, 1415–1422
- Califano et al. 2014 Califano, V.; Calabria, R.; Massoli, P. Experimental evaluation of the effect of emulsion stability on micro-explosion phenomena for water-in-oil emulsions. Fuel 2014, 117, 87–94
- Goodarzi and Zendehboudi 2019 Goodarzi, F.; Zendehboudi, S. A Comprehensive Review on Emulsions and Emulsion Stability in Chemical and Energy Industries. The Canadian Journal of Chemical Engineering 2019, 97, 281–309, Publisher: John Wiley & Sons, Ltd
- Hoar and Schulman 1943 Hoar, T. P.; Schulman, J. H. Transparent Water-in-Oil Dispersions: the Oleopathic Hydro-Micelle. Nature 1943, 152, 102–103, Publisher: Nature Publishing Group
- Moulik and Paul 1998 Moulik, S. P.; Paul, B. K. Structure, dynamics and transport properties of microemulsions. Advances in Colloid and Interface Science 1998, 78
- Domschke et al. 2013 Domschke, M.; Kraska, M.; Feile, R.; Stühn, B. AOT microemulsions: droplet size and clustering in the temperature range between the supercooled state and the upper phase boundary. Soft Matter 2013, 9, 11503–11512, Publisher: The Royal Society of Chemistry
- Rastogi et al. 2019 Rastogi, P.; Kaisare, N. S.; Basavaraj, M. G. Diesel Emulsion Fuels with Ultralong Stability. Energy & Fuels 2019, 33, 12227–12235, Publisher: American Chemical Society
- Kotlarchyk et al. 1985 Kotlarchyk, M.; Huang, J. S.; Chen, S. H. Structure of AOT reversed micelles determined by small-angle neutron scattering. The Journal of Physical Chemistry 1985, 89, 4382–4386
- Rastogi et al. 2023 Rastogi, P.; Honecker, D.; Venero, D. A.; Mahmoudi, N.; S. Kaisare, N.; G. Basavaraj, M. Modulating shape transition in surfactant stabilized reverse microemulsions. Soft Matter 2023, 19, 7033–7045, Publisher: Royal Society of Chemistry
- Rastogi et al. 2023 Rastogi, P.; Honecker, D.; Alba Venero, D.; Mahmoudi, N.; Kaisare, N. S.; Basavaraj, M. G. Investigation of Nanostructure and Interactions in Water-in-Xylene Microemulsions Using Small-Angle X-ray and Neutron Scattering. Langmuir 2023, 39, 4701–4711
- Rao et al. 2022 Rao, D. C. K.; Singh, A. P.; Basu, S. Laser-induced deformation and fragmentation of droplets in an array. International Journal of Multiphase Flow 2022, 148, 103925
- Park and Armstrong 1989 Park, B.-S.; Armstrong, R. L. Laser droplet heating: fast and slow heating regimes. Appl. Opt. 1989, 28, 3671–3680
- Armstrong 1984 Armstrong, R. L. Aerosol heating and vaporization by pulsed light beams. Appl. Opt. 1984, 23, 148–155
- Mikami and Kojima 2002 Mikami, M.; Kojima, N. An experimental and modeling study on stochastic aspects of microexplosion of binary-fuel droplets. Proceedings of the Combustion Institute 2002, 29, 551–559
- Pandey and Basu 2018 Pandey, K.; Basu, S. How boiling happens in nanofuel droplets. Physics of Fluids 2018, 30, 107103, Publisher: American Institute of Physics
- Saha et al. 2012 Saha, A.; Basu, S.; Kumar, R. Velocity and rotation measurements in acoustically levitated droplets. Physics Letters A 2012, 376, 3185–3191
- Hasegawa et al. 2016 Hasegawa, K.; Abe, Y.; Goda, A. Microlayered flow structure around an acoustically levitated droplet under a phase-change process. npj Microgravity 2016, 2, 1–5
- Yamamoto et al. 2008 Yamamoto, Y.; Abe, Y.; Fujiwara, A.; Hasegawa, K.; Aoki, K. Internal Flow of Acoustically Levitated Droplet. Microgravity Science and Technology 2008, 20
- Raju et al. 2018 Raju, L. T.; Chakraborty, S.; Pathak, B.; Basu, S. Controlling Self-Assembly and Topology at Micro–Nano Length Scales Using a Contact-Free Mixed Nanocolloid Droplet Architecture. Langmuir 2018, 34, 5323–5333, PMID: 29659290
- Mehrizi et al. 2022 Mehrizi, A. A.; Karimi-maleh, H.; Naddafi, M.; Karaman, O.; Karimi, F.; Karaman, C.; Cheng, C. K. Evaporation characteristics of nanofuel droplets: A review. Fuel 2022, 319
- Friberg et al. 1993 Friberg, S.; Yu, B.; Lin, J.; Barni, E.; Young, T. Evaporation from microemulsions. Colloid and Polymer Science 1993, 271, 152–161
- 60 Yarin, A. L.; Brenn, G.; Kastner, O.; Rensink, D.; Tropea, C. Evaporation of acoustically levitated droplets. 399, 151–204
- Al Harraq and Bharti 2020 Al Harraq, A.; Bharti, B. Increasing aspect ratio of particles suppresses buckling in shells formed by drying suspensions. Soft Matter 2020, 16, 9643–9647
- Saha et al. 2010 Saha, A.; Basu, S.; Suryanarayana, C.; Kumar, R. Experimental analysis of thermo-physical processes in acoustically levitated heated droplets. International Journal of Heat and Mass Transfer 2010, 53, 5663–5674
- Gannena et al. 2022 Gannena, K. S. R.; Rao, D. C. K.; Roy, D.; Kumar, A.; Basu, S. Bubble dynamics and atomization in evaporating polymeric droplets. Journal of Fluid Mechanics 2022, 951, A48, Publisher: Cambridge University Press
- Vejerano and Marr 2018 Vejerano, E. P.; Marr, L. C. Physico-chemical characteristics of evaporating respiratory fluid droplets. Journal of the Royal Society Interface 2018, 15, 20170939
- Seyfert et al. 2022 Seyfert, C.; Rodríguez-Rodríguez, J.; Lohse, D.; Marin, A. Stability of respiratory-like droplets under evaporation. Physical Review Fluids 2022, 7, 023603, Publisher: American Physical Society
- Chaudhuri et al. 2020 Chaudhuri, S.; Basu, S.; Kabi, P.; Unni, V. R.; Saha, A. Modeling the role of respiratory droplets in Covid-19 type pandemics. Physics of Fluids 2020, 32, 063309
- Tsapis et al. 2005 Tsapis, N.; Dufresne, E. R.; Sinha, S. S.; Riera, C. S.; Hutchinson, J. W.; Mahadevan, L.; Weitz, D. A. Onset of Buckling in Drying Droplets of Colloidal Suspensions. Physical Review Letters 2005, 94, 018302, Publisher: American Physical Society