Energy Relaxation of N2O in Gaseous, Supercritical and Liquid Xenon and SF6
Abstract
Rotational and vibrational energy relaxation (RER and VER) of N2O embedded in xenon and SF6 environments ranging from the gas phase to the liquid, including the supercritical regime, is studied at a molecular level. Calibrated intermolecular interactions from high-level electronic structure calculations, validated against experiments for the pure solvents were used to carry out classical molecular dynamics simulations corresponding to experimental state points for near-critical isotherms. Computed RER rates in low-density solvent of s-1M-1 and s-1M-1 compare well with rates determined by analysis of 2-dimensional infrared experiments. Simulations find that an isolated binary collision (IBC) description is successful up to solvent concentrations of M. For higher densities, including the supercritical regime, the simulations do not correctly describe RER, probably due to neglect of solvent-solute coupling in the analysis of the rotational motion. For VER, the near-quantitative agreement between simulations and pump-probe experiments captures the solvent density-dependent trends.
University of Basel]Department of Chemistry, University of Basel, Klingelbergstrasse 80 , CH-4056 Basel, Switzerland Boston University] Department of Physics and the Photonics Center, Boston University, 590 Commonwealth Ave, MA 02215, Boston Boston University] Department of Chemistry and the Photonics Center, Boston University, 8 St Mary’s St, MA 02215, Boston University of Basel]Department of Chemistry, University of Basel, Klingelbergstrasse 80 , CH-4056 Basel, Switzerland \altaffiliationDepartment of Chemistry, Brown University, Providence, RI 02912, USA
1 Introduction
Understanding the precise molecular level details of rotational and
vibrational energy relaxation dynamics in high density gas and
supercritical fluid (SCF) solutions is of fundamental importance for
the description, optimization and control of chemical reactivity in
inherently dense media. For example, dense fluids at high temperatures
and pressures, often in supercritical (sc) regimes, are solvent
environments where many combustion reactions
occur.1, 2, 3 Furthermore,
SCFs offer the possibility for selective control of chemical processes
including energy relaxation/transfer dynamics, and have already been
successfully employed in a range of
applications.4, 5, 6, 7, 8, 9, 10
Aside from offering the “green” potential to replace organic
solvents (e.g. scH2O or scCO2), local density augmentation and
the dynamics associated with the long-spatial correlations that
develop in near critical state points contribute to the special
solvation properties of near critical
fluids.4, 11, 12 These density
correlation length increases result in a corresponding correlation
relaxation time increase at the critical point, often described as
critical slowing and evident in scattering
experiments13, 14, 15 and
simulations.16, 17
In prior ultrafast studies of dense gas and supercritical fluid
solutions, two-dimensional infrared (2DIR) experiments have revealed
rates of rotational energy relaxation (RER) as a function of solvent
density for the N2O asymmetric stretching mode () in
SF6 and Xe even in the absence of any rotational features in the
corresponding rovibrational
spectrum.18, 19, 20 Pump-probe
measurements provide vibrational energy relaxation (VER) rates for
these same high density state points. A simple isolated binary
collision (IBC) model was sufficient to describe RER of N2O
up to SF6 and Xe solvent densities of M
for isotherms derived from 2DIR
measurements.20 However, the RER dynamics of N2O
in these two similar non-dipolar solvents show different concentration
dependencies as the critical density is approached and where many body
effects begin to play a larger role for solvation.20
The RER of N2O is slower than the IBC predicted rates in the
density region ( M - M) of the SF6
critical point ((SF6) = 5.09 M) and attributed to
the longer length scale, slower density fluctuations coupling to the
closest N2O solvation shells. However, no such slowing effect was
observed for N2O RER in xenon. For xenon densities M,
the RER rate monotonically increased through the critical point region
((Xe) = 8.40 M). It was hypothesized that the many
body interactions at the higher critical density for the xenon solvent
shielded the N2O rotors from coupling to the long correlation
length fluctuations. N2O rotational relaxation in both solvents is
a highly efficient process. Following excitation
rotational equilibrium is re-established after 1.7 and 2.4 collisions
in SF6 and Xe respectively in the IBC density
region.20
Rotational and vibrational equilibrium are established on very
different timescales following N2O excitation in
these high density gas and SCF SF6 and Xe
solvents.20 While only a couple of collisions are
required for N2O rotations to thermalize in both solvents, the VER
of N2O may take hundreds of collisions or more to return the
molecule fully to thermal equilibrium. The density dependence of
N2O VER is also strikingly different in xenon and SF6, and
underscores that VER has a highly variable rate due to the inherently
quantum nature () of this relaxation
mechanism. The N2O lifetime is times
shorter in SF6 than in xenon than because xenon has no possible
resonant VV, solutesolvent, energy transfer
relaxation pathway as found for relatively efficient VER from N2O
in SF6. The first step in N2O VER
in SF6 is the collision enabled intramolecular relaxation to the
N2O symmetric stretching mode before a much slower return to the
ground vibrational state. Furthermore, VER is nearly an order of
magnitude slower for this initial VER component in SF6 as compared
to RER, and a critical slowing effect is not as clearly
evident.20 The density dependence of the N2O
rovibrational absorption line shapes in SF6 and
xenon were well-captured in a previous classical MD simulation
study.21 Even the rovibrational spectral contours,
inherently determined by J,M quantum transition selection rules, were
accurately duplicated by these classical simulation results. The goal
of this current report is to test the ability of this same simulation
approach to capture the previously reported N2O
rotational and vibrational relaxation dynamics determined by these
2DIR and pump-probe measurements spanning the dense gas to
supercritical density regime in SF6 and Xe.
Relaxation phenomena in liquids provide valuable information about
intermolecular interactions and coupling between solvent and solute
modes. In the present work RER and VER of N2O as the solute
immersed in Xe and SF6 as atomic and molecular solvents at a wide
range of densities is investigated from atomistic simulations. The
environments are under conditions which range from gaseous to the
supercritical and regular liquids.
The present work is structured as follows. First, the methods are
presented, followed by the validation of the intermolecular
interactions. Next, results on the RER and VER of N2O are
presented and discussed. Finally, conclusions are drawn.
2 Methods
2.1 Inter- and Intramolecular Interactions
The N2O PES: The intramolecular potential energy surface (PES)
of N2O in its
electronic ground state (1A′) is provided by a machine-learned
representation using the reproducing kernel Hilbert space (RKHS)
method.22, 23 Reference energies at the
CCSD(T)-F12/aug-cc-pVQZ level of theory were determined on a grid of
Jacobi coordinates with the N-N separation, the
distance between the center of mass of the diatom and the oxygen atom,
and the angle between the two distance vectors. All
calculations were carried out using the MOLPRO
package.24 The full-dimensional RKHS model for a
N2O potential energy surface was originally developed for the
investigation of N+NO collision reaction dynamics.23
The Pearson coefficient of the RKHS representation and the full
set of reference values is and the root mean squared error
(RMSE) between RKHS and reference energies up to 20 kcal/mol above
the equilibrium structure (78 reference energies) is
kcal/mol.
The Solvent PES: Intra- and intermolecular force field
parameters for SF6 were those from the work of Samios et
al..25 Intermolecular interactions were based on
Lennard-Jones potentials only and the parameters were optimized such
that MD simulations of pure SF6 reproduce the experimentally
observed state points for liquid and gas SF6, as well as the
states of liquid-vapor coexistence below and supercritical fluid above
the critical temperature K,
respectively.26, 27 For Xe the
Lennard-Jones parameters were optimized to reproduce the state
points of gaseous, supercritical and liquid Xe at different densities
and temperatures below and above the critical temperature of
K.26, 27
The Xe–Xe Lennard-Jones (LJ) potential parameters for the van-der-Waals (vdW) potential energy contribution were fit to match experimental state points of xenon, which were computed with a similar setup as used by Samios et al. to fit the force field parameters for SF6.25 A set of experimentally measured state points of xenon at temperatures (number of state points) (5), (3), (12), (12) and K (12) was selected.28 For each state point a separate molecular dynamics (MD) simulation was run using a Langevin thermostat with a friction coefficient of ps-1. The system contained 1200 Xe atoms, the structure was minimized, heated to the target temperature and equilibrated for a total of 100 ps with a time step of 1 fs. Next, the average pressure was determined from a 300 ps simulation and compared with the experimental reference.28 The xenon LJ parameters and were then optimized by the Nelder–Mead method29 to minimize the relative root mean square error (rRMSE) between sampled average and experimental pressures at respective volume and temperature
| (1) |
The LJ parameter set with the lowest rRMSE were chosen after
the rRMSE arguably reached a convergence limit for several tens of
optimization steps.
Electrostatic solvent-solute interactions were computed based on a
minimally distributed charge model (MDCM) for N2O that correctly
describes higher-order multipole
moments.30, 31, 32 For
parametrization, a reference electrostatic potential (ESP) of N2O
in its linear equilibrium conformation was computed at the
CCSD/aug-cc-pVTZ level using the Gaussian program
package.33 The optimized MDCM fit reproduces the ESP
with a RMSE of kcal/mol. For SF6 in its octahedral
equilibrium conformation the ESP was computed at the MP2/aug-cc-pVTZ
level of theory using the Gaussian program. The RMSE between the
fitted ESP from MDCM and the reference ESP was
kcal/mol. Recently,32 non-iterative
polarization was also included in MDCM, and this is also used here for
N2O, SF6 and Xe. The polarizability of linear N2O at the
CCSD/aug-cc-pVTZ level is Å3 (with each atom contributing
Å3 per atom), compared with Å3 from
experiment.34 For Xe at the CCSD/aug-cc-pVTZ the
computed value of Å3 compares with Å3 from
experiment34 and for SF6 the experimentally measured
polarizability of Å3 was used and evenly distributed over
the fluorine atoms ( Å3 per fluorine
atom).35
The LJ parameters for N2O (
with ) were individually optimized for each
N2O atom by least-squares fitting using the trust region reflective
algorithm36 to best reproduce the N2O–Xe and
N2O–SF6 interaction energies, respectively. Reference energies
were computed for a single N2O molecule immersed within differently
dense Xe or SF6 clusters to sample gaseous, supercritical and
liquid solvent environments. For this, 50 cluster conformations for
each solvent state were extracted from earlier MD simulations of
difference solvent concentration.21 The clusters
contained 3, 7, and 10 xenon atoms and 2, 6, and 10 SF6 molecules
for gaseous, supercritical and liquid samples within the radius of the
first solvation shell around the N2O center of mass of and
Å, respectively. Cluster conformations were randomly
extracted from the trajectories with the respective number of solvent
atoms or molecules within the cluster radius is maintained.
Counterpoise corrected reference interaction energies between N2O
and the solvent shell of the cluster were computed at the
M06-2X/aug-cc-pVTZ level of theory including D3 dispersion corrections
with the Gaussian program package.37, 38, 33
Computations at the CCSD(T) level of theory, as done for the
intramolecular N2O potential, are not feasible for the interaction
energies between N2O and up to 10 Xe atoms or 10 SF6
molecules.
2.2 Molecular Dynamics Simulations
Molecular dynamics simulations were performed with the CHARMM program
package39 including provisions for RKHS and
MDCM.22, 30, 32 Each system (N2O
in Xe and N2O in SF6 at given temperature and solvent
concentration) was sampled from 5 independent MD simulations with
initially random solute and solvent arrangements generated using the
packmol code.40 Each simulation was initially heated
and equilibrated for ps each, followed by 10 ns production
simulations in the ensemble using a time step fs
for the leapfrog integration scheme. In total, a total of 50 ns was
sampled for each system condition.
The N2O/Xe systems were simulated at a temperature of 291.2 K and
for N2O/SF6 the temperature was 321.9 K which both are slightly
above the experimental critical temperatures for condensation of xenon
and SF6, respectively ( K,
K).19, 26, 27 A Langevin
thermostat (coupling ps-1) was used to maintain the
temperature constant but was applied only to the solvent (Xe and
SF6) atoms. Positions and velocities of snapshots of the
simulations were stored every fs for analysis. As intermolecular
vibrational energy transfer is slow,20 the structure
of N2O was optimized and new velocities from a Boltzmann
distribution at the simulation temperature were assigned to N2O
after the heating step. This ensures that the kinetic energies along
the asymmetric, symmetric and bending modes match the thermal energy
with respect to the target simulation temperature.
The different simulation systems were prepared according to the
conditions used in the
experiments.18, 19, 20 Table
S1 summarizes the N2O concentrations (N2O),
molar volumes and critical density ratios
used in the simulations. The experimentally determined critical
densities are g/ml for xenon and g/ml for SF6 from which critical concentrations of M
and M for xenon and SF6 are obtained,
respectively.26, 27 In all setups, the
simulation box contained one N2O molecule and 600 Xe atoms or 343
SF6 molecules which corresponds to similar simulation box volumes
for similar relative density ratios of the two solvents. In the
original parametrization study a simulation box containing 343 SF6
molecules was used to fit temperature-pressure
properties.25
In the MD simulations for N2O in SF6, electrostatic and
polarization interactions were only computed between the N2O solute
and SF6 solvent. Electrostatic and polarization contributions to
the SF6 solvent-solvent interactions were neglected. Such a
procedure ensures that the pure (liquid, gas) properties of the
solvent are unaltered.
2.3 Analysis
Rotational Relaxation: RER times of the N2O solute were determined by fitting single- or bi-exponential functions to the autocorrelation functions involving angular momentum-dependent quantities. The normalized correlation function for a time-dependent scalar or vectorial observable
| (2) | ||||
| (3) |
were computed for time series of the rotational energy of N2O where
and
is the moment of inertia, the squared angular momentum and angular momentum .
The amplitude , RER rates and offset of a single exponential function
| (4) |
were optimized to fit the sampled rotational energy correlation
function from simulations. For the fit, the lower limit for the time
was ps, as had also been done for fitting the experimental
results to avoid any pulse overlap effects,20 and was
restricted to . It is noted that using a double
exponential function does not provide improved representations of the
data even near the critical point.
Vibrational Relaxation: Transition rates for the vibrational state transition of the N2O solute in solution were computed from a Landau-Teller model41, 42, 43, 44, 45
| (5) |
with a quantum correction factor defined as
| (6) |
Here, is the time-dependent friction acting on the oscillation of the solute. It is derived from the correlation function
| (7) |
of the solute-solvent friction potential .42 The friction potential is obtained from the solute-solvent force projection along the normal mode vector by the sum over the solute atoms according to
| (8) |
where is the atom mass of and
is the reduced mass of normal mode .
3 Results
3.1 Validation of Inter- and Intramolecular Interactions
For investigating the RER and VER of N2O in gaseous, supercritical,
or liquid Xe or SF6 environments an accurate representation of the
solute-solvent interaction is
crucial.20, 19, 18 The results of
the parameter optimization for the intermolecular interactions are
summarized next.
Solute Potential: To establish the quality of the N2O PES,
the vibrational modes were determined by solving the 3d nuclear
Schrödinger equation using the DVR3D46 package. The
computed fundamental asymmetric, symmetric, and bending vibrations
were at cm-1, cm-1, and cm-1 and agree well
with 2224 cm-1, 1285 cm-1, and 589 cm-1 from
experiments in the gas
phase.47, 48, 49 For the bending
overtone the computations yield 1184 cm-1
compared with 1168 cm-1 from
experiments.47, 48, 49
Solvent Potential: The Xe and SF6 solvent potential models
aim at accurately reproducing the experimentally measured state
points. The atomic LJ parameters for SF6 were already fitted to
match reference state points of pure gaseous, supercritical and
liquid SF6 systems.25 In contrast, for xenon the
previously used LJ parameters were fitted to match dilute gas
macroscopic properties such as virial coefficient, viscosity and
thermal conductivity over a wide temperature range but not
specifically for correct phase transition and supercritical fluid
properties.50 As described above, the LJ parameters were
refitted to reproduce the reference system pressure of pure xenon at
44 different density and temperature
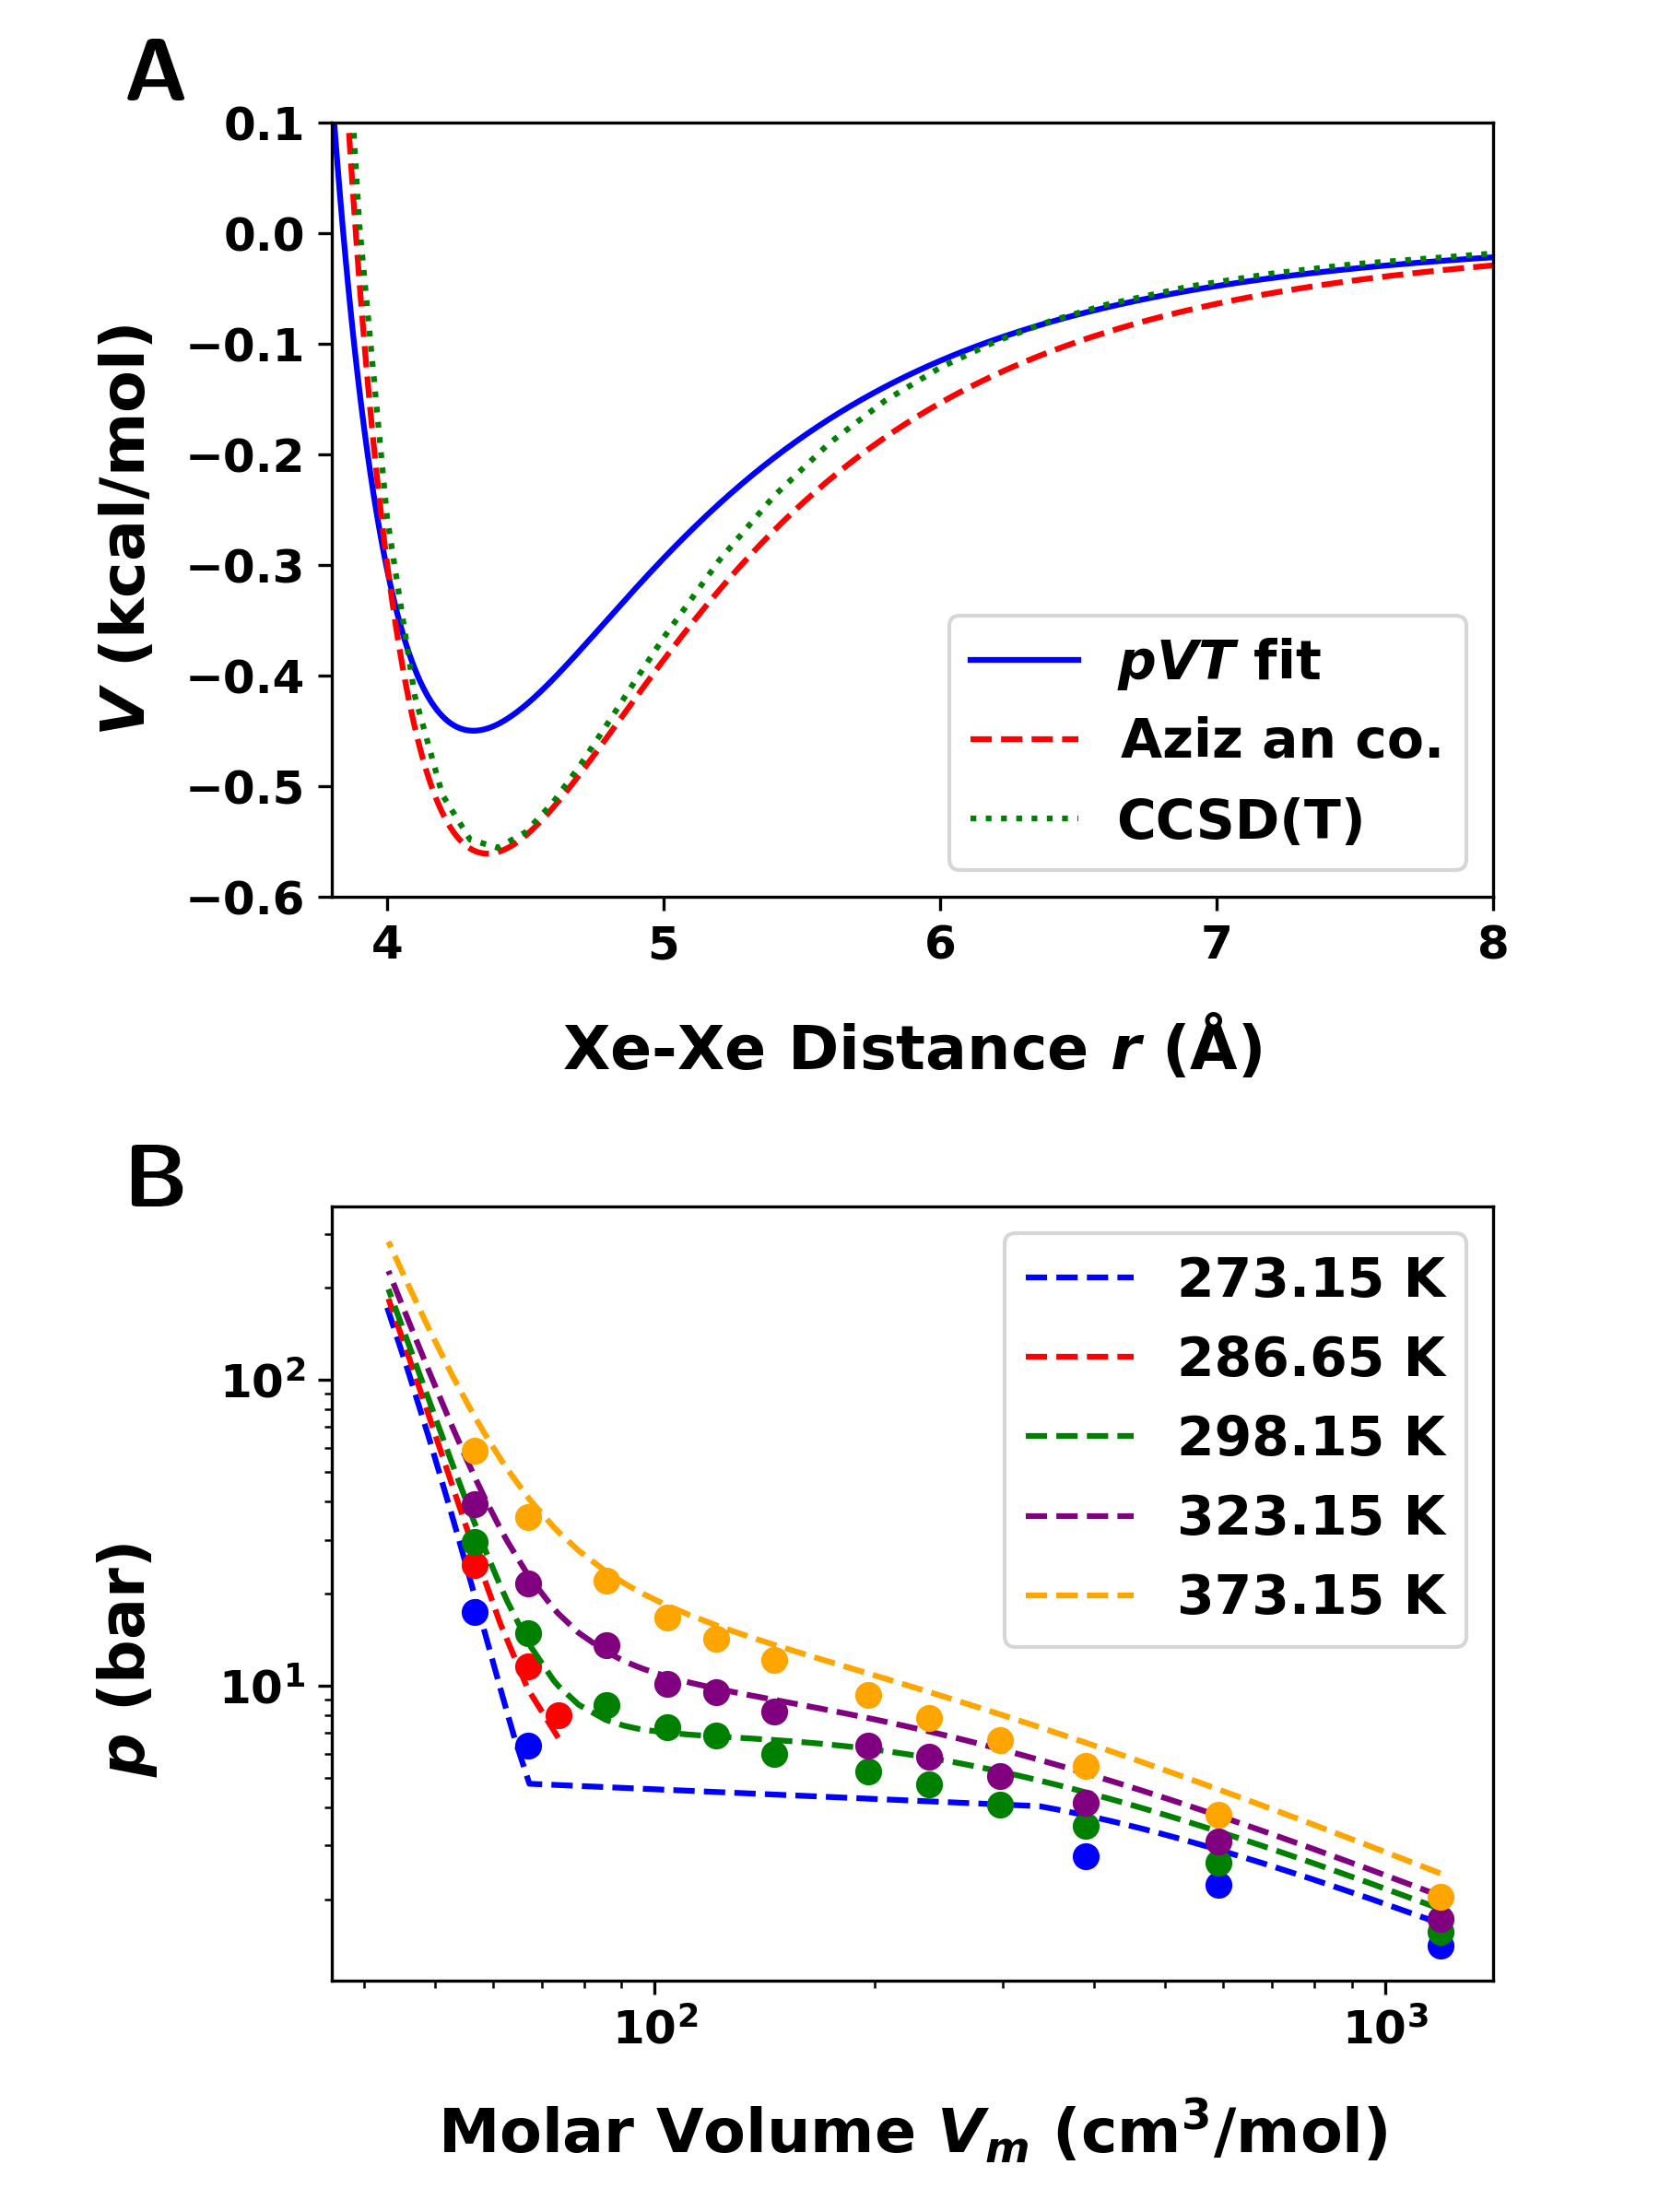
conditions.28 Figure 1A shows
the measured reference isotherms in the diagram (dashed lines)
and the computed state points from simulations using the
optimized LJ parameters with the lowest relative RMSE of %
between reference and computed system pressures (absolute RMSE of
Pa). This is an improvement by a factor of (relative
RMSE of %; absolute RMSE of Pa) when using the
original parameters.50
Figure 1B compares the Xe–Xe interaction based on a
LJ potential using the optimized LJ parameters and those from Aziz
et al.. The dissociation energies are kcal/mol and
kcal/mol, respectively, at equilibrium separations of Å and 4.36 Å. This compares with a dissociation
energy of 0.556 kcal/mol and Å from
high-level CCSD(T)/cc-pV6Z calculations.51 The zero
point vibrational energy for a xenon pair is found to be
cm-1 ( kcal/mol) experimentally52
and kcal/mol computationally using the CCSD(T)/cc-pV6Z
potential data and a 1-dimensional DVR method.51
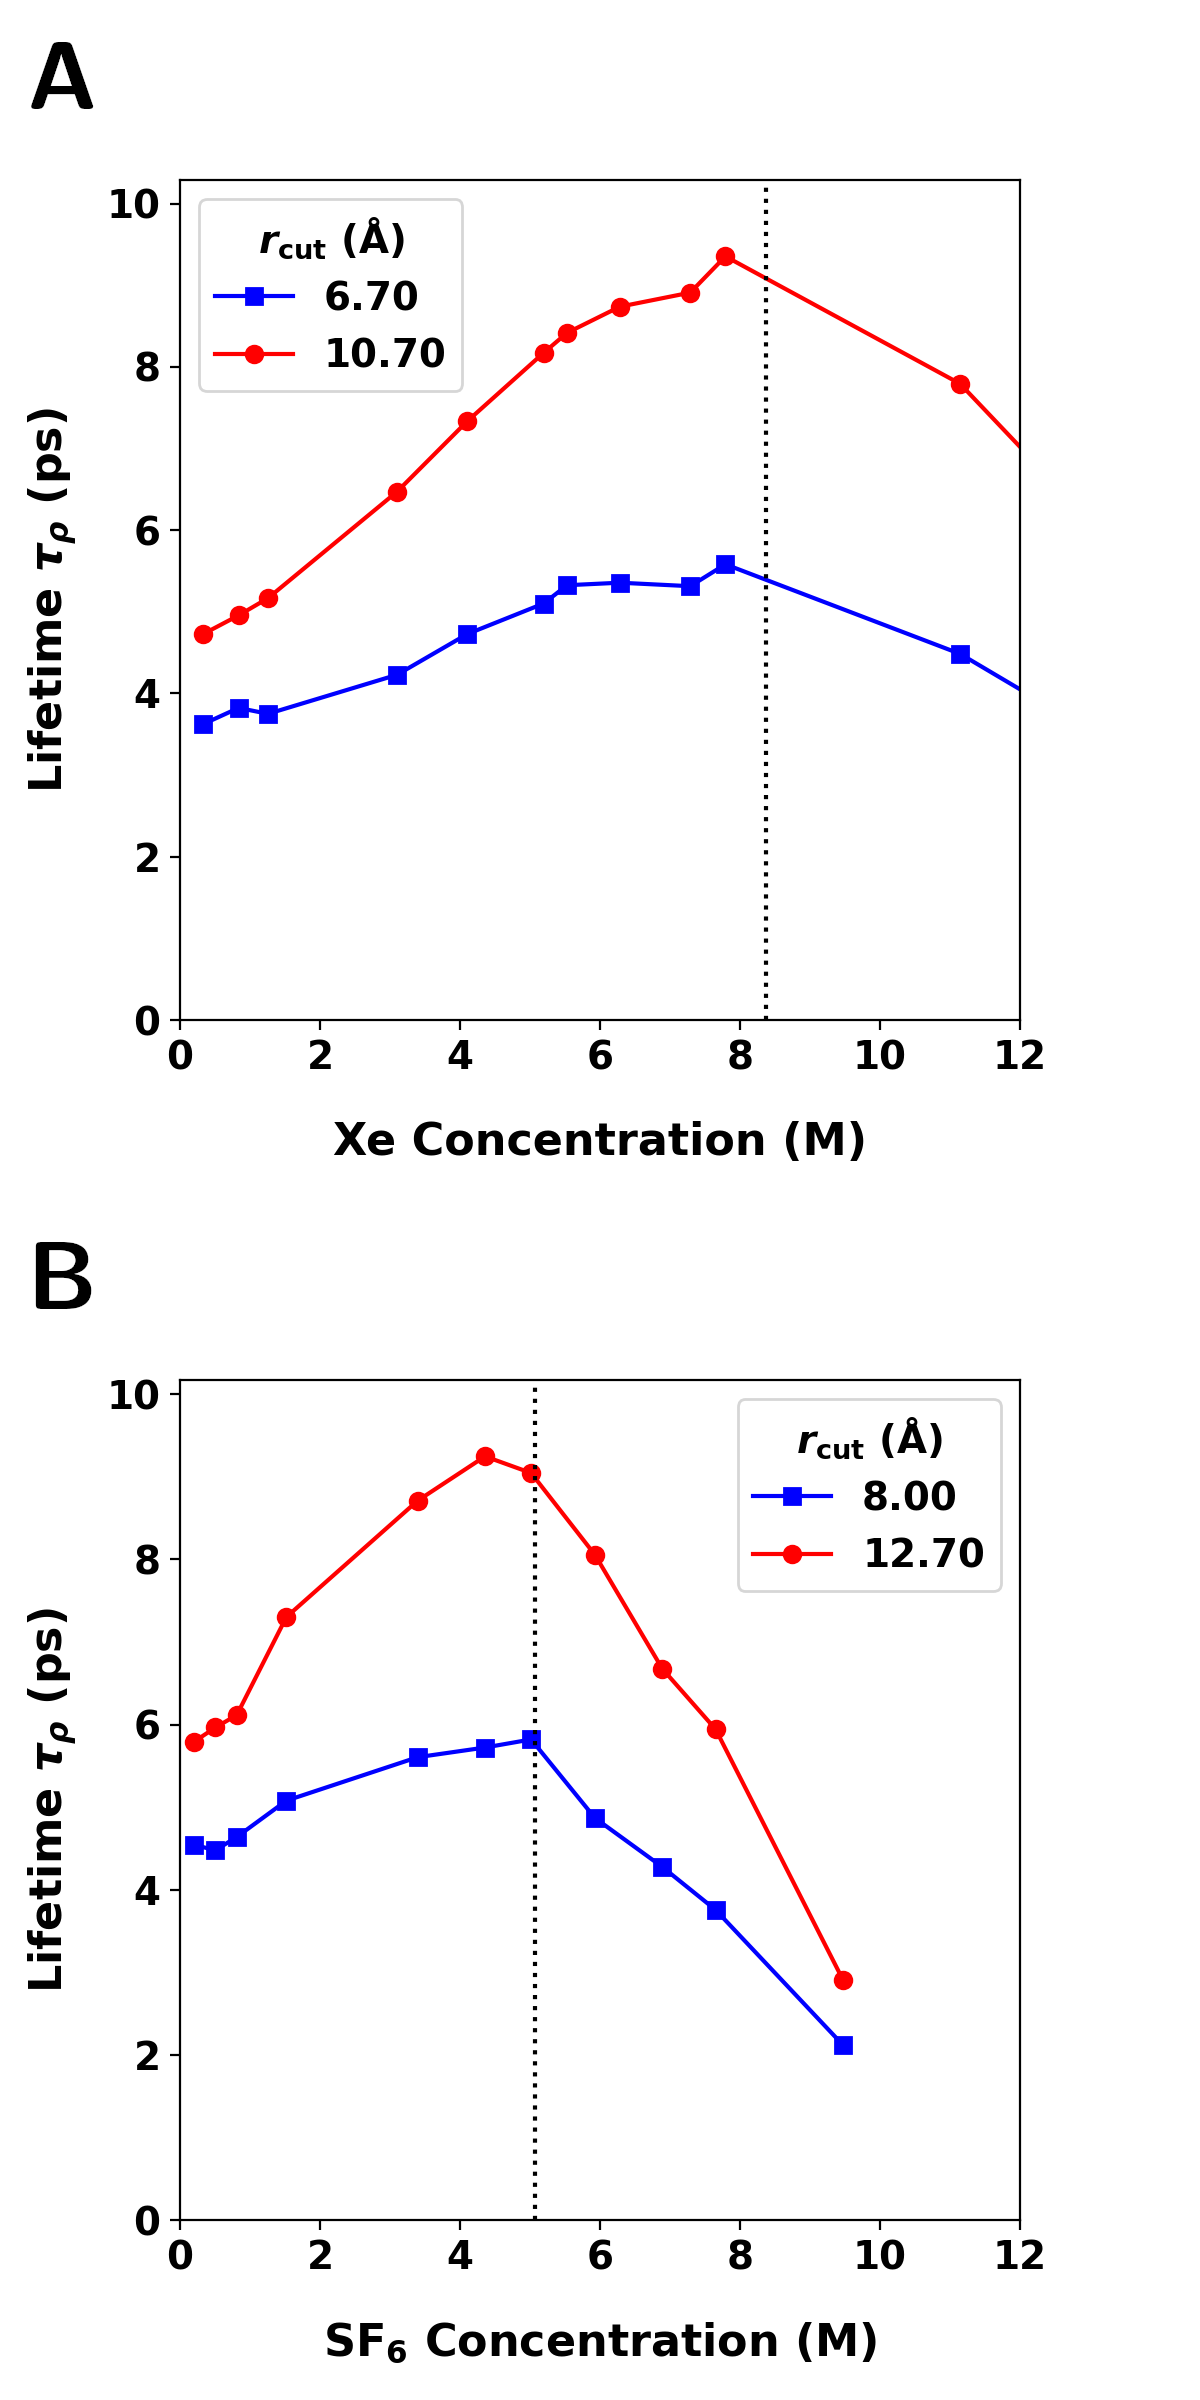
Following previous work,21 the local solvent
reorganization lifetime was used to probe for distinct SCF
properties and as a proxy to determine the computationally predicted
critical density at the given temperature, following established
routes.53, 54 Figures 2A
and B show the computed for liquid xenon and SF6,
respectively. For the analysis, the cutoff radii for the first and
second solvation shells of a local solvent residue cluster were
estimated from the local minima of the respective radial distribution
function determined from the same trajectory. For both
solvents, the maxima of for the simulated solvent
concentration are close to the experimentally observed critical
concentrations at the critical temperature. As was found in previous
work,53, 54 the solvent fluctuation
lifetime, , in LJ gas systems is a maximum for
supercritical fluids at the critical concentration. This indicates
that the supercritical dynamical properties are well captured by the
solvent potential model and are one more manifestation of critical
slowing, at least in pure xenon and SF6.
Intermolecular Interactions: The intermolecular interactions
between the N2O solute and the Xe or SF6 solvent were fit to
reproduce counterpoise corrected ab initio reference interaction
energies for various solute-solvent clusters. Figures
3A and B show the correlation between the modelled
and reference interactions for optimized LJ parameter of the N2O
atoms, respectively. The solute-solvent clusters with N2O at their
center have a maximum radius of Å for Xe and Å for
SF6, respectively. The number of solvent atoms or molecules within
the cluster are representative for the local density of gaseous,
supercritical and liquid solvent environments, respectively, and the
selection of cluster conformations are described in the Method
section.
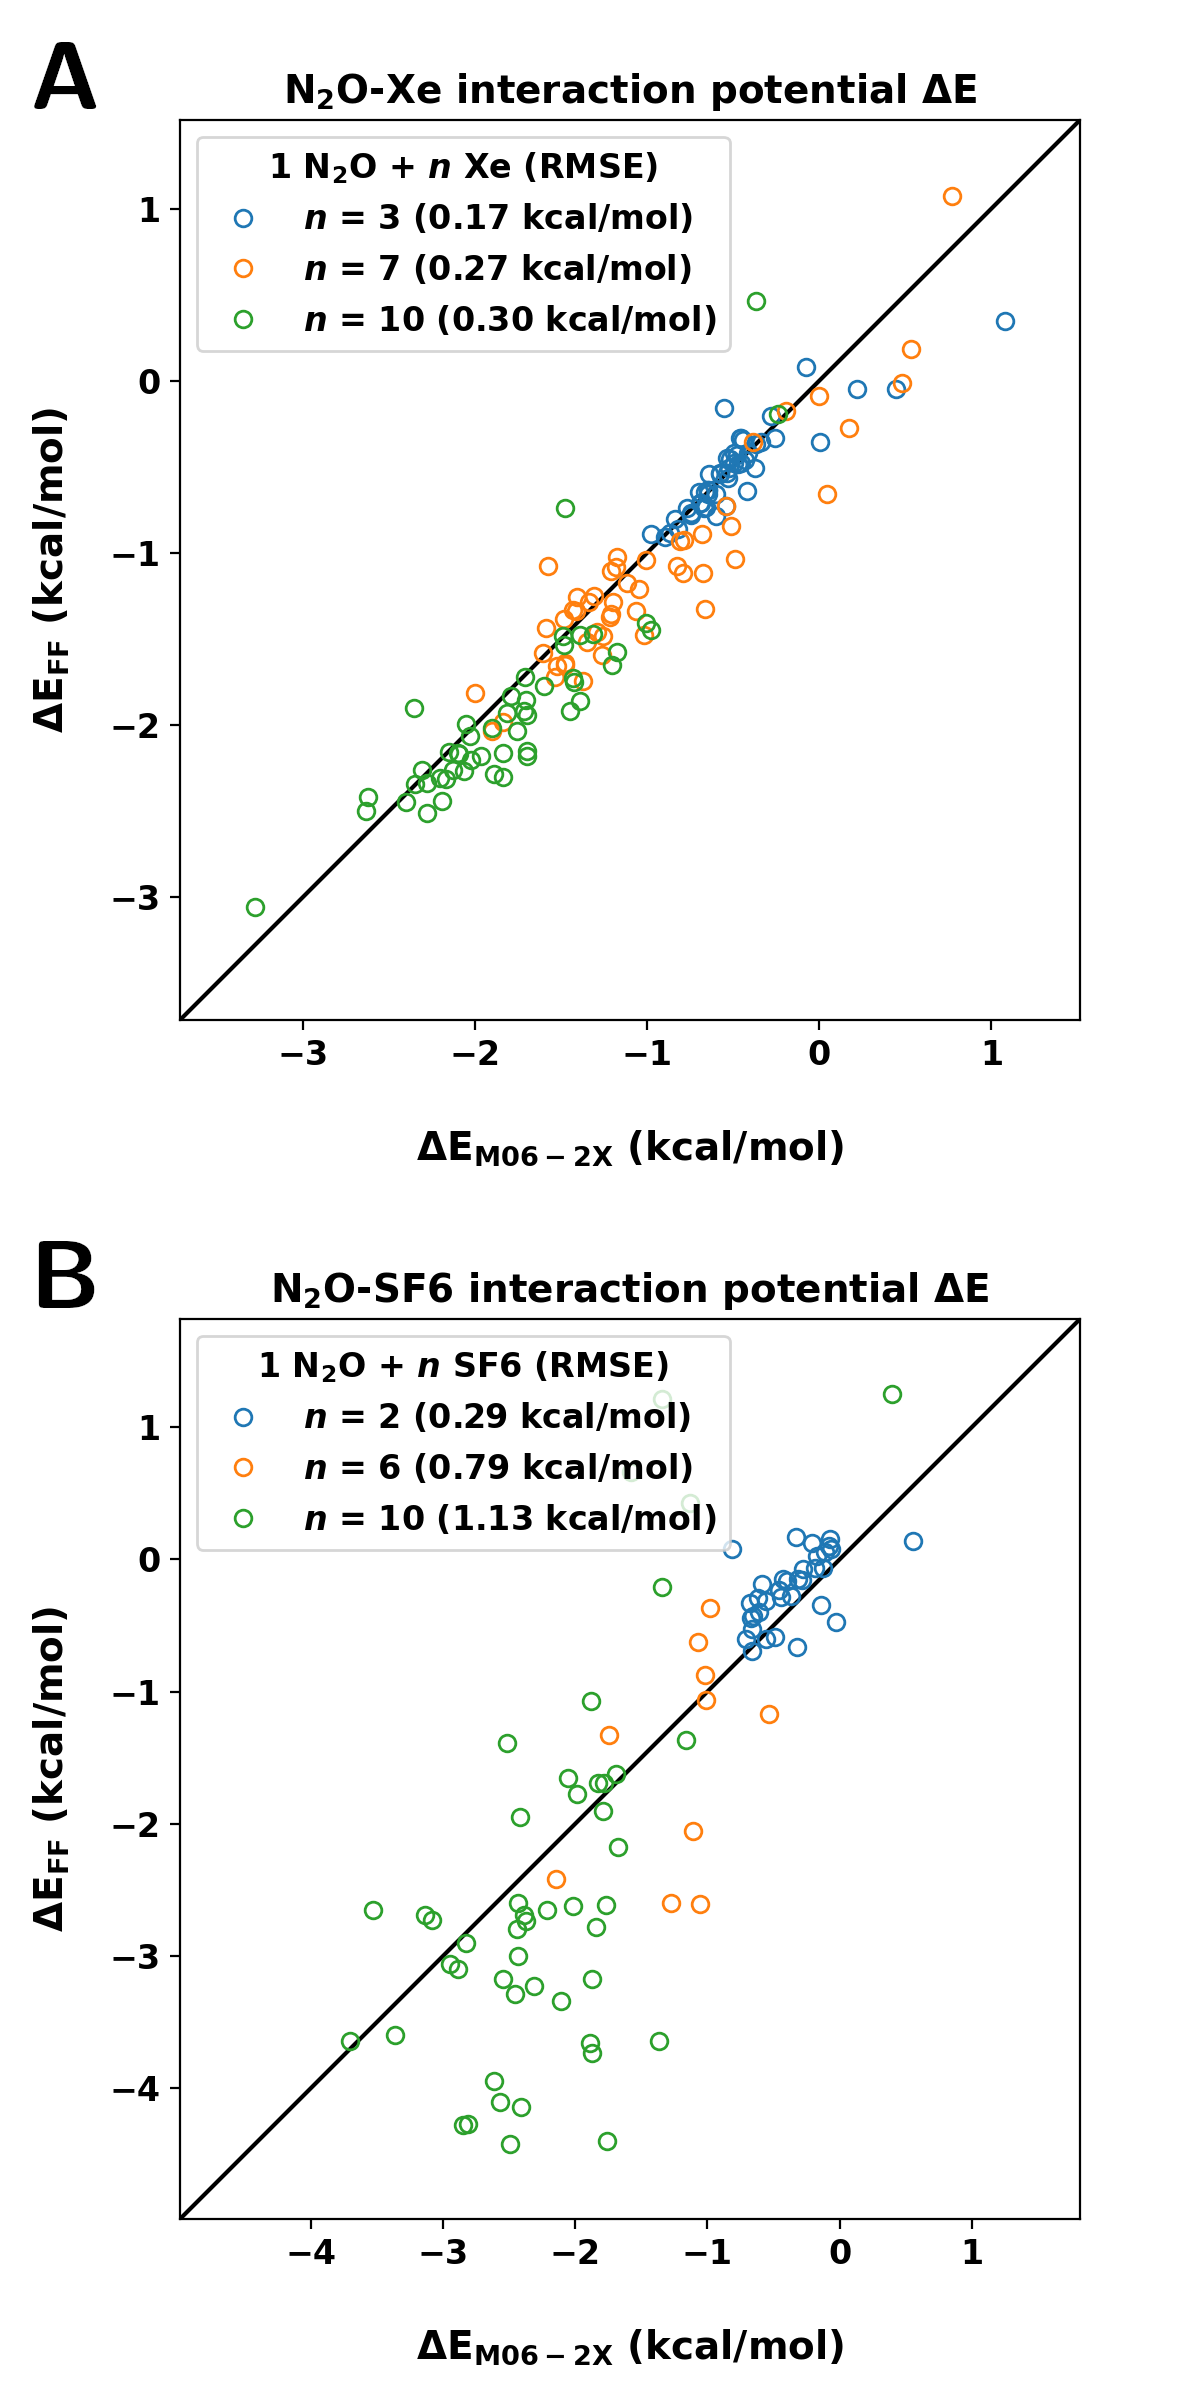
The N2O–Xe interaction in Figure 3A with
optimized LJ parameter for N2O reproduces the reference interaction
energies with RMSEs from gaseous to liquid-like solvent clusters with
, and kcal/mol, respectively. In contrast, for
the N2O–SF6 interactions (see Figure 3B) the
RMSEs increase to , and kcal/mol,
respectively. The interactions in supercritical and liquid-like
cluster environments with and 10 SF6 molecules are
overestimated due to stronger electrostatic interactions compared with
Xe.
3.2 Rotational Energy Relaxation (RER)
From the simulations the N2O atom positions and velocities were recorded every 50 fs from the aggregate of 50 ns ( ns) for each system and composition. The RER rates were then determined from the autocorrelation function by fitting to a single–exponential function (see Equation 4), yielding a single RER time . Figure 4 shows RER rates in xenon and SF6 retrieved from the corresponding calculated rotational energy correlation functions, see Figures S1 and S2.
As an extension, a bi-exponential function was used to fit the
rotational energy correlation functions. This yields two time scales:
fast and a slow RER times and
shown in Figure S3. In
general, from the single-exponential fit matches the
slow component of the RER time from which the
respective rates are closest to the experimental results. Thus, only
the fit parameters of the single-exponential function will be
discussed.
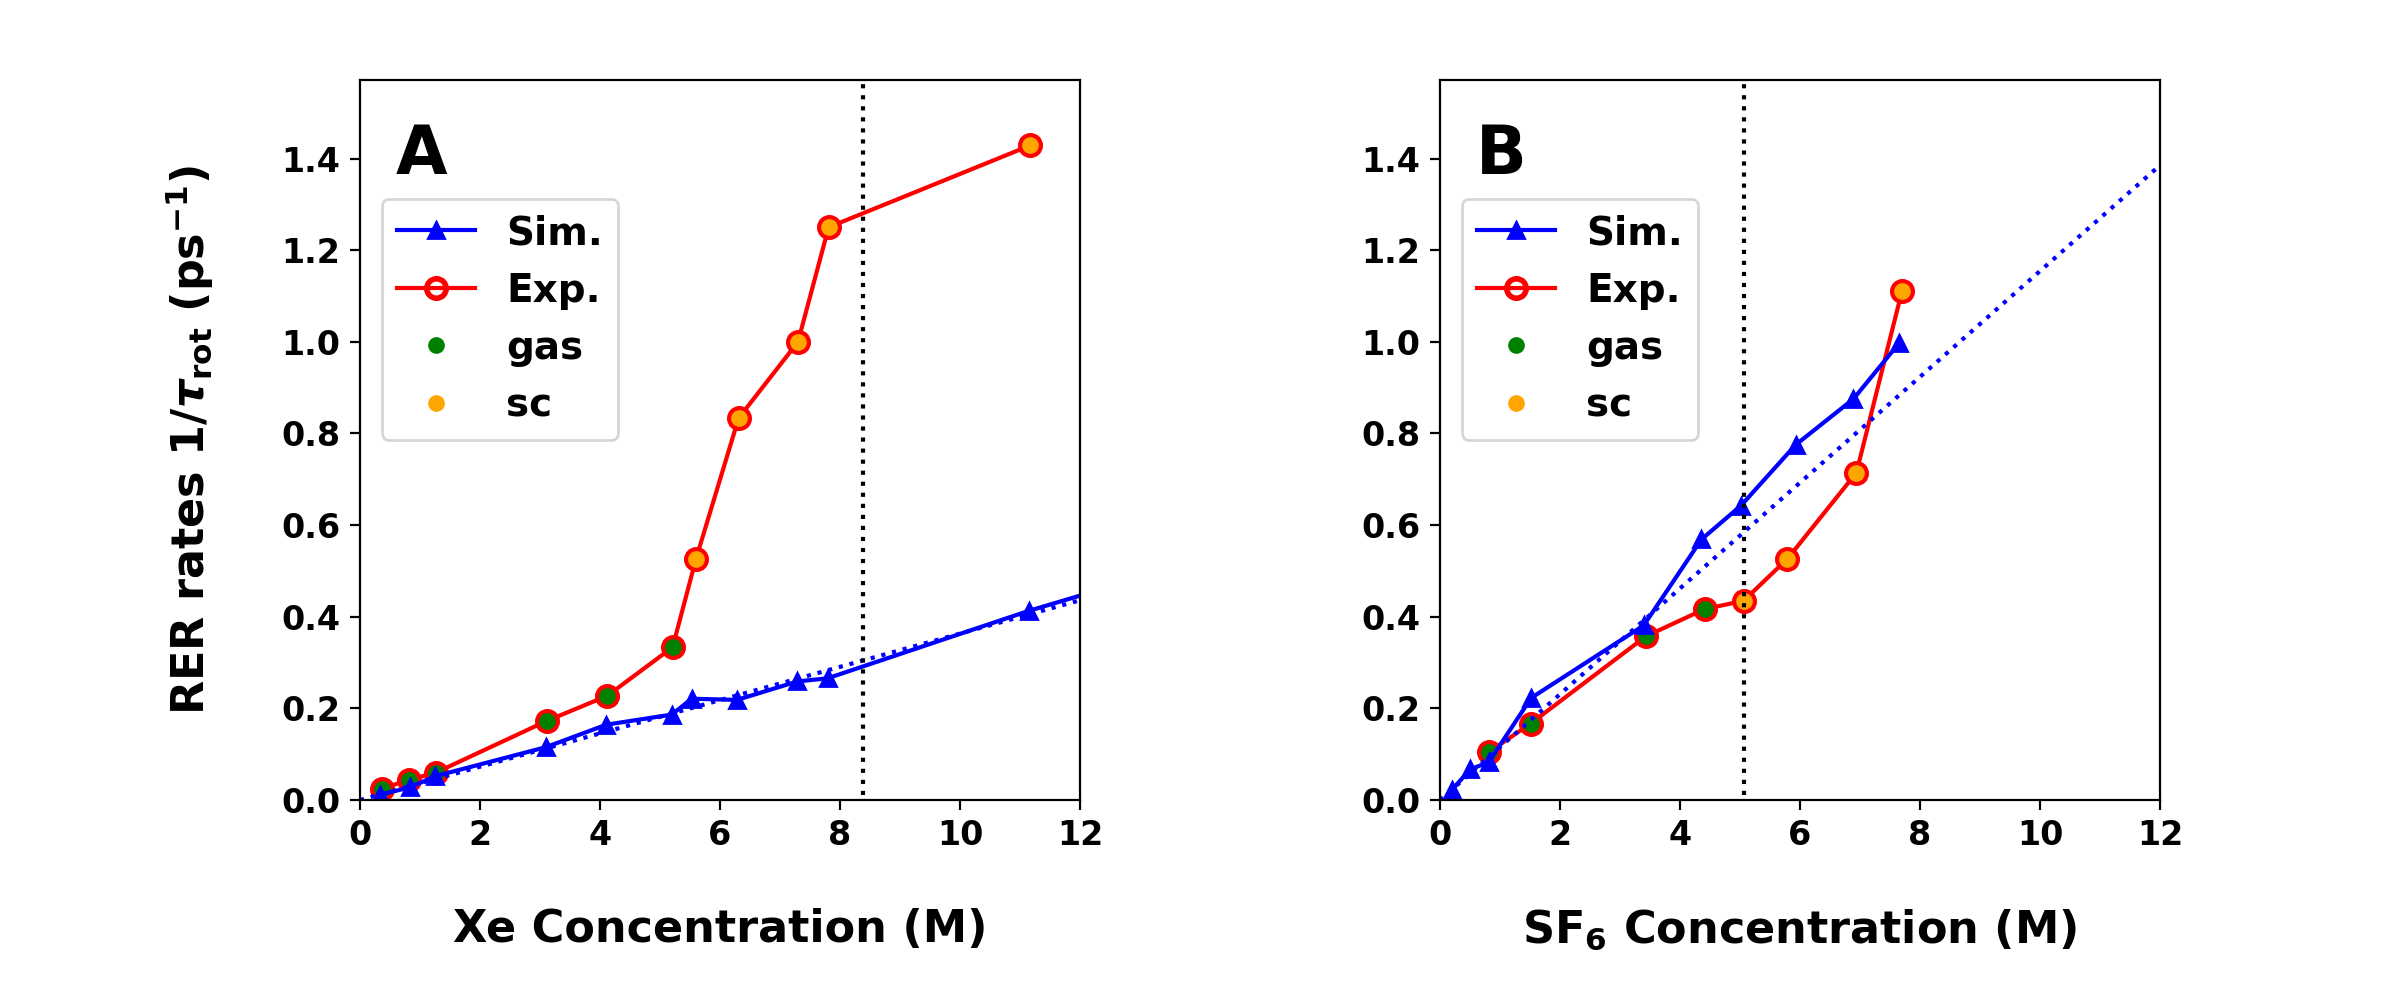
Analysis of the 2D IR experiments provided RER rates for N2O
molecules in gaseous, supercritical and liquid solvent
regions.18, 19, 20 For xenon a
characteristic increase in for M
was found whereas for SF6 critical slowing for
M was observed (red traces in Figures 4A and B).
Both measurements deviate from results predicted by the simplest IBC
model which predicts a linear dependence between
and . From the simulations in xenon, however, the
results follow that expected from IBC (blue symbols in Figure
4A) whereas for SF6 the computed results deviate
around the predictions from IBC, see Figure 4B.
The agreement between computed RER rates and the IBC model rather than
the experimentally observed RER rates at supercritical solvent
concentrations becomes apparent when scaling the rates with the
concentration to yield the RER rates . From the slopes
of the RER rate dependence of the IBC region in the Figure
4, the simulated N2O RER rates are s-1M-1 and
s-1M-1
for N2O in Xe and SF6, respectively. 2DIR derived measured RER
rates for N2O in gaseous xenon and SF6 solvent within the IBC
region are s-1M-1 and
s-1M-1, respectively, which are rather
close to the simulation results.20 The ratio also qualitatively
agrees with a factor of from the experiments.
Up to this point the rotational energy was used to determine the
correlation function and to obtain RER rates. To probe whether other
angular-momentum-dependent quantities lead to similar conclusions,
correlation functions for N2O angular momentum , and
the squared angular momentum were considered, see Figures
S4 and S5. Using
yields higher rates than those from the squared angular
momentum which in turn closely matches the rates based on
the rotational energy correlation function. This is not unexpected as
the rotational energy is proportional to the squared angular momentum:
with the N2O moment of
inertia. The rates from are higher as they also include
the reorientation of the rotational axis of N2O known as rotational
Brownian motion.55
The respective correlation functions for and
of N2O in xenon and SF6 are shown in Figures S6
to S9. The correlation functions are the average of
the correlation functions computed from each single sample run at the
respective solvent concentration. RER rates from fits to the
correlation functions of the angular momentum , squared
angular momentum and rotational energy
are shown in Figures S10
and S11.
To conclude, for low solvent densities ( M and M) the computed RER rates agree very favourably with
experiments whereas for higher densities the deviations from the IBC
model observed in the experiments are not correctly captured,
specifically for xenon. Rather, the simulations follow the predicted
behaviour from the IBC model. As the deviations are systematic with
increasing solvent concentration it is conjectured that as the solvent
concentration increases the property probed by the experiment is not
only the solute rotational energy. This is discussed further below. In
addition, many-body effects may be insufficiently accounted for in the
computational model, thus contributing to the lack of quantitative
agreement particularly for N2O in xenon at higher density.
3.3 Collision Analysis
The computed RER of N2O in Xe and SF6 followed the simple IBC
model and is in disagreement with the experimentally observed rapid
increase around M and critical slowing at the
critical density for SF6. To gain deeper insight into the
solute-solvent interactions, the change in kinetic energy before and
after N2O–solvent collisions was further analyzed and decomposed
into translational, rotational, and vibrational contributions of
N2O at different solvent densities.
Figure 5 shows the average absolute change in
the kinetic energies of N2O, xenon atoms and SF6 molecules upon
collision. A collision between N2O and solvent was considered to
have occurred when any of the N2O–Xe or N2O–SF6 atom
separations is smaller than the sum of their atomic van-der-Waals
radii ( Å for N, O, Xe, S and F,
respectively).56 The initial and final kinetic
energies of N2O and solvent were extracted from the simulation at
the frame after crossing this van-der-Waals radii threshold from which
the changes for and corresponding distributions were determined. Due to intramolecular energy flow
and intermolecular exchange of kinetic energy between the solute and
the surrounding solvent molecules during the contact time, the sum of
changes in the kinetic energy contributions does not necessarily add
up to the total kinetic energy difference.
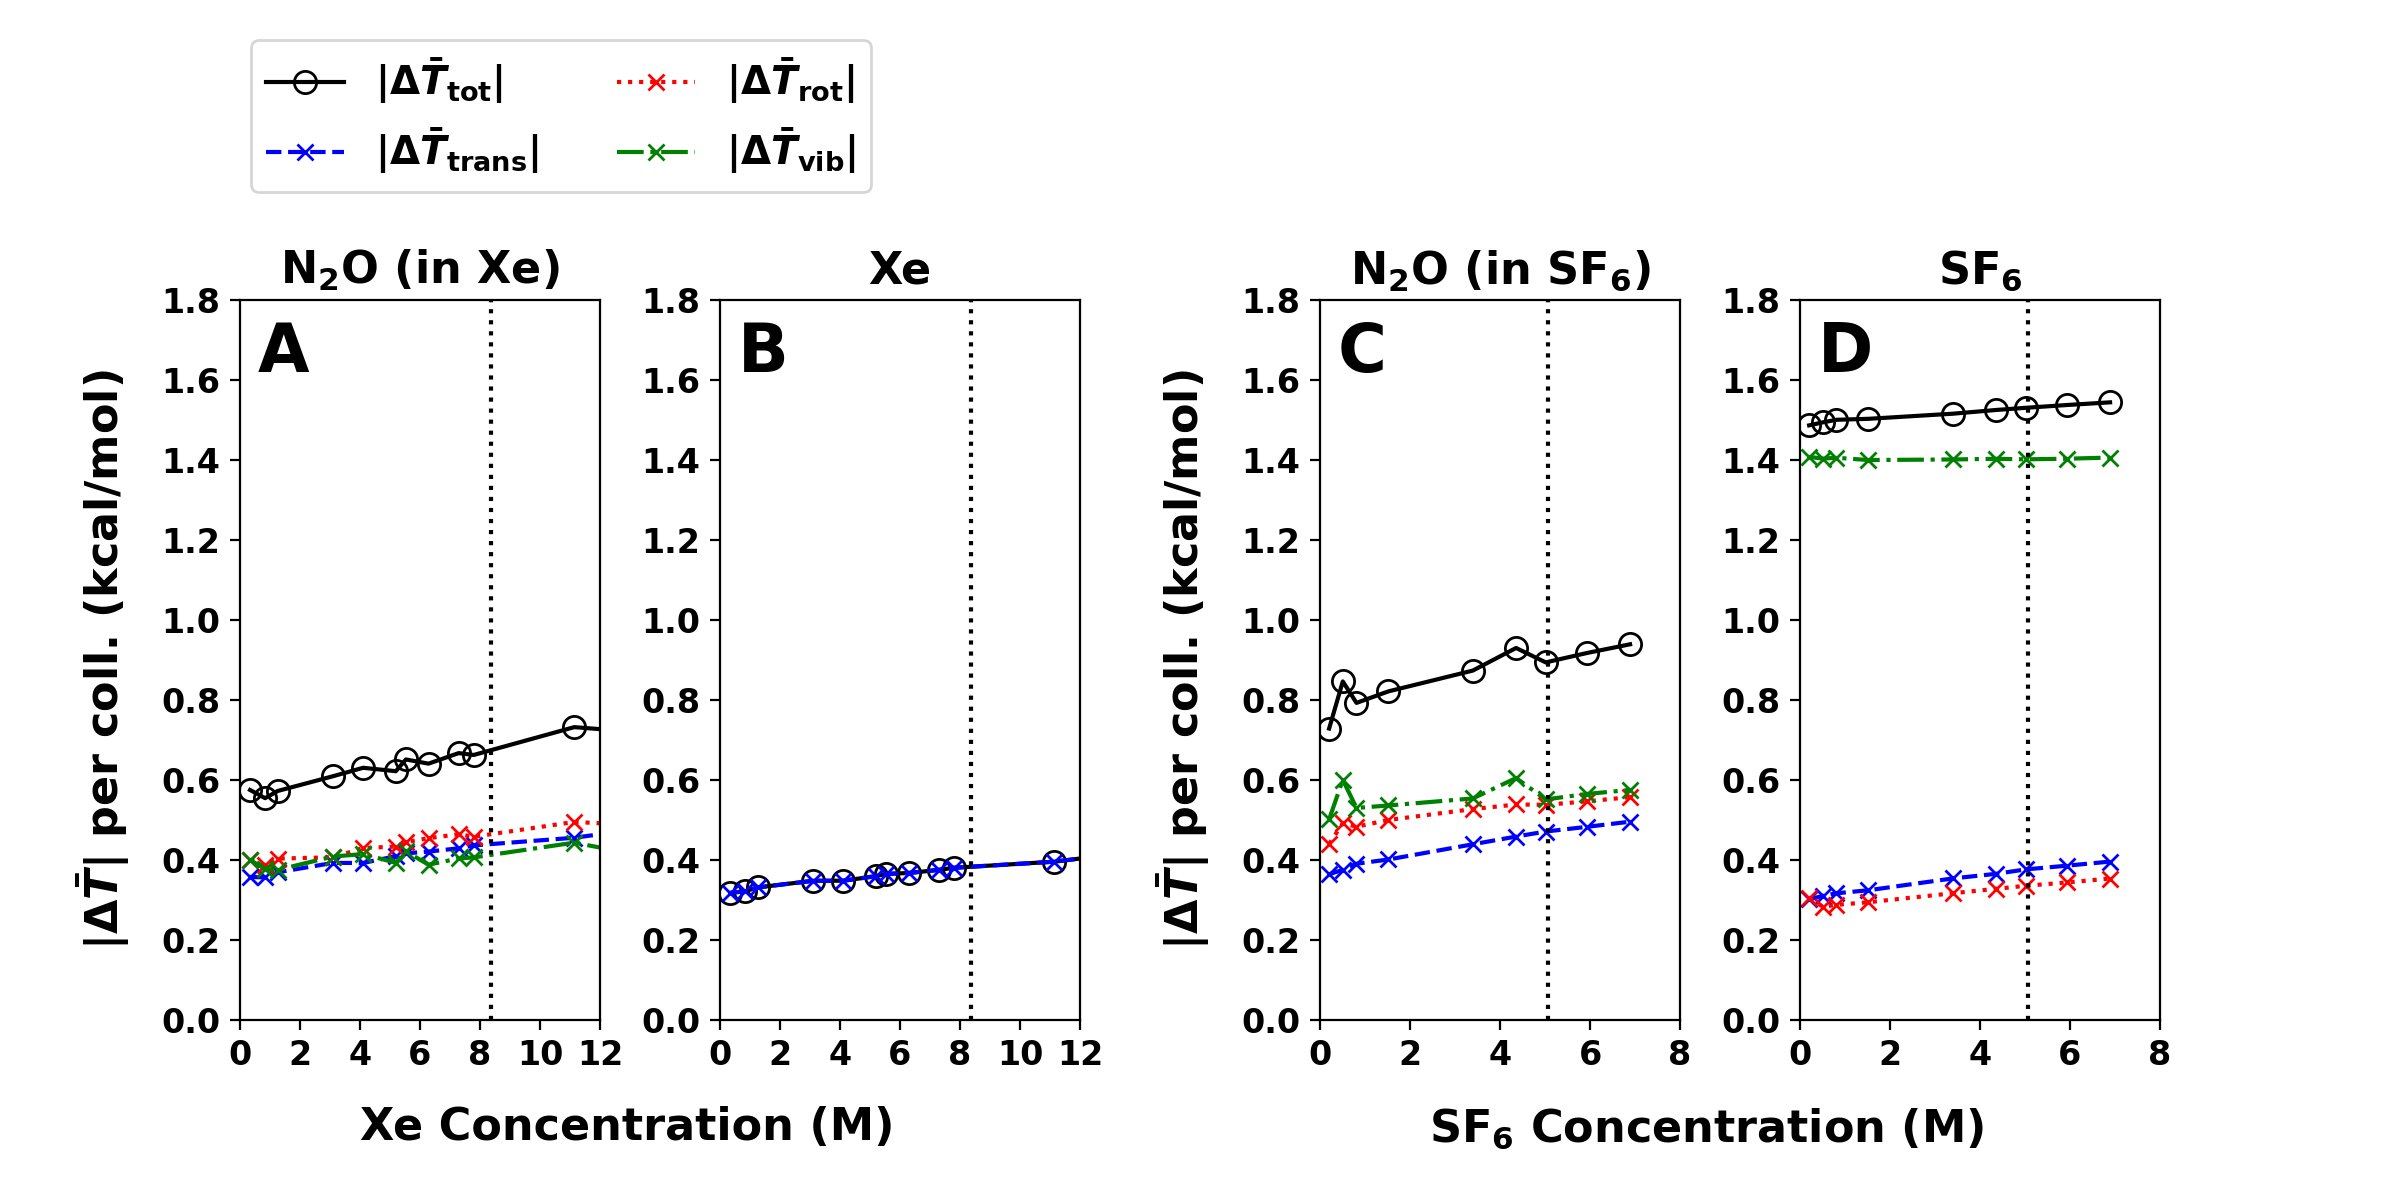
Related to RER are changes in the N2O rotational kinetic energy,
, see Figures 5A
and C (red dotted line). For N2O in Xe, is lower than in SF6
which indicates that in simulations
with SF6 as the solvent the change in the N2O rotational energy
occurs not only due to collisions as for xenon. Rather, RER is also
influenced by the longer-ranging, anisotropic intermolecular
interactions between N2O and and the nonvanishing higher-order
multipoles of SF6. As the average change in vibrational kinetic
energy in (dash-dotted green line) of
N2O is larger in SF6 than in xenon, the overall change in total
kinetic energy (solid black line) is
considerably larger, whereas the changes in translational kinetic
energy (dashed blue line) for the
two solvents are comparable because the masses of xenon ( u)
and SF6 ( u) are similar.
The change in the kinetic energy contributions of the solvent
particles, xenon and SF6, after a collision with N2O are shown
in Figures 5B and D. At an atomistic level the
kinetic energy of a single xenon atom only consists of the
translational contribution. Again, the translational contributions for
xenon and SF6 are comparable (blue symbols in Figures
5B and D) due to their similar masses. However,
because SF6 has internal degrees of freedom, additional rotational
and vibrational kinetic energy contributions arise and the total
(open circles) for collisions with
SF6 are considerably larger than those of xenon. For SF6 the
rotational and translational contributions are similar in magnitude
whereas is significantly larger. This
is due to the larger number of vibrational degrees of freedom (15)
compared with rotation (3) and translation (3). It is also interesting
to note that the translational and rotational contributions for SF6
depend on solvent-concentration whereas the vibrational contribution
does not. This is consistent with the analysis of the experimental
data which indicates that vibrational relaxation through
intramolecular energy relaxation upon collision is IBC-like as opposed
to rotational relaxation.20
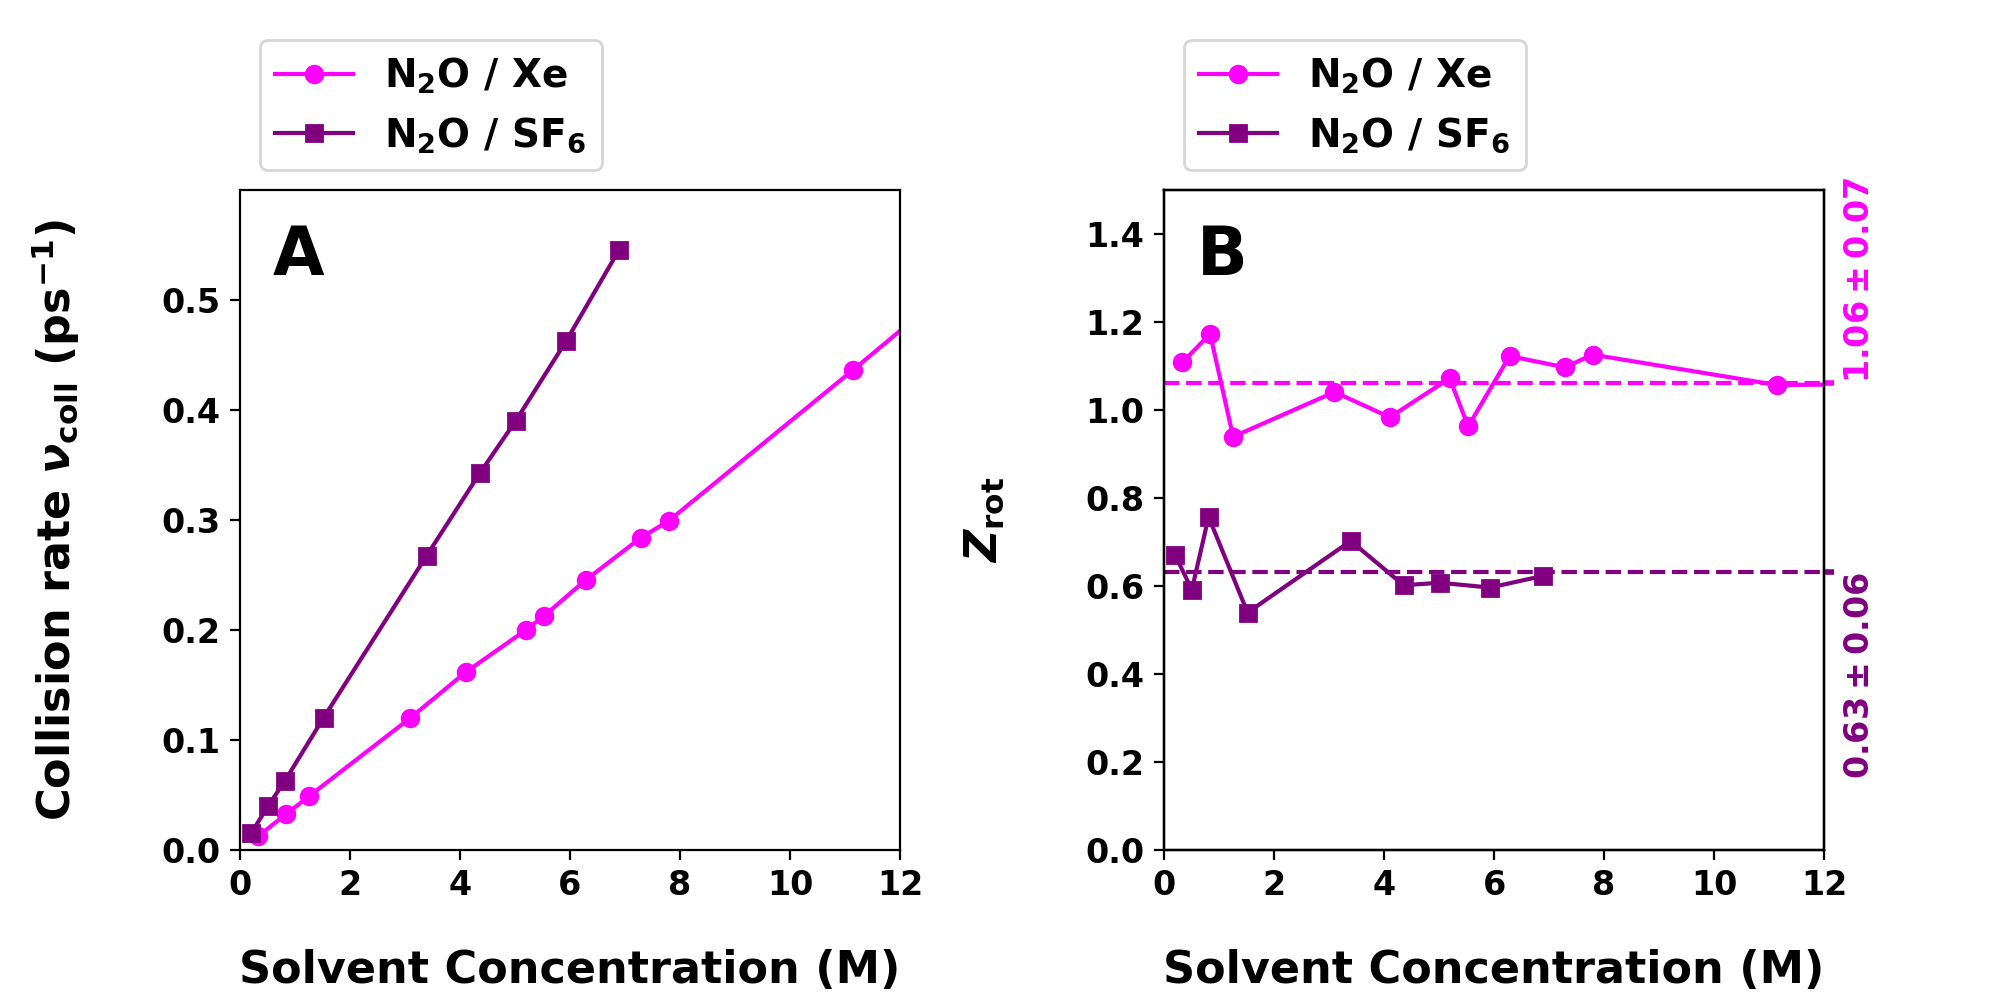
Based on the RER rates determined in the
previous subsection and the average collision frequency
( ns) it is also possible to compute the average
number of collisions required to rotationally relax the solute
(N2O). Here, is the number of collisions between
N2O and either xenon or SF6, and was
already obtained from fitting a single-exponential decay to the
rotational energy correlation function of N2O in both
solvents. Figure 6A and B shows the computed average
collision rate and number of collision
for RER of N2O in xenon and SF6,
respectively. The collision rate of N2O with SF6 (purple line in
Figure 6A) is higher than with xenon (magenta line)
because of the higher simulation temperature ( K
vs. K), the larger molecular volume occupied by SF6
compared to a single xenon atom (based on atomic van der Waals radii),
and the anisotropic electrostatic intermolecular interactions between
N2O and SF6.
The experimentally reported are and
for RER of N2O in xenon and SF6, respectively, based on a
hard sphere model for both types of solvent
molecules.57, 20 Within the IBC regime
( M and M) the
are larger than those from
simulations. This is mostly due to the higher computed collision rate
, estimated from the inverse of the mean free
collision time. On the other hand, the ratio is comparable but
somewhat smaller () than that from the simulations
(). This is also related to lower simulated RER rates for
N2O in xenon within the IBC region compared with experiments for
which the simulated RER rates for N2O in SF6 matches well. Thus,
the simulations reasonably well agree with the experiments for RER of
N2O over solvent concentrations within the IBC regime. However, the
simulations do not reproduce the steep increase or critical slowing in
the RER rates in xenon and SF6, respectively (see Figure
4).
3.4 Vibrational Energy Relaxation
VER lifetimes and rates were determined from the Landau-Teller
formalism described in the Methods section. VER of a particular N2O
mode can either involve pure intramolecular relaxation or a
combination of inter- and intramolecular processes, both of which can
be obtained from MD
simulations.41, 42, 43, 44, 45
For this, the forces acting on the solute atoms derived only from the
non-bonding solute-solvent interaction potential were extracted and
projected along the normal mode vector of the asymmetric stretch
vibration of N2O, see Eq. 8.
For N2O in SF6 and from the experimental
analysis,20 the most effective vibrational relaxation
channel of cm-1 occurs
through coupling with the symmetric N2O stretch vibration cm-1 and the three-fold degenerate
S–F stretch vibration cm-1.
Following the procedure outlined in the methods section, the VER rate
for were
computed. The forces of N2O are projected along the normal mode
vectors of obtained from instantaneous normal mode
analysis at the respective frames, which can be interpreted as solvent
friction. The Fourier transform of the correlation function of this
quantity yields the frequency dependent friction function, see Figures
S16 and S17.
The VER lifetimes for the relaxation in N2O were determined by the average of the
friction function weighted by the frequency difference distribution
. The resulting rates
from simulation and experiments20
are shown in Figure 7. The average frequency
difference in the simulation were determined to be
cm-1 but
cm-1 in
experiments.20 For consistency, the same distribution
width centered around the experimentally observed frequency difference
was used to compute the (see
green dashed line in Figure 7B).
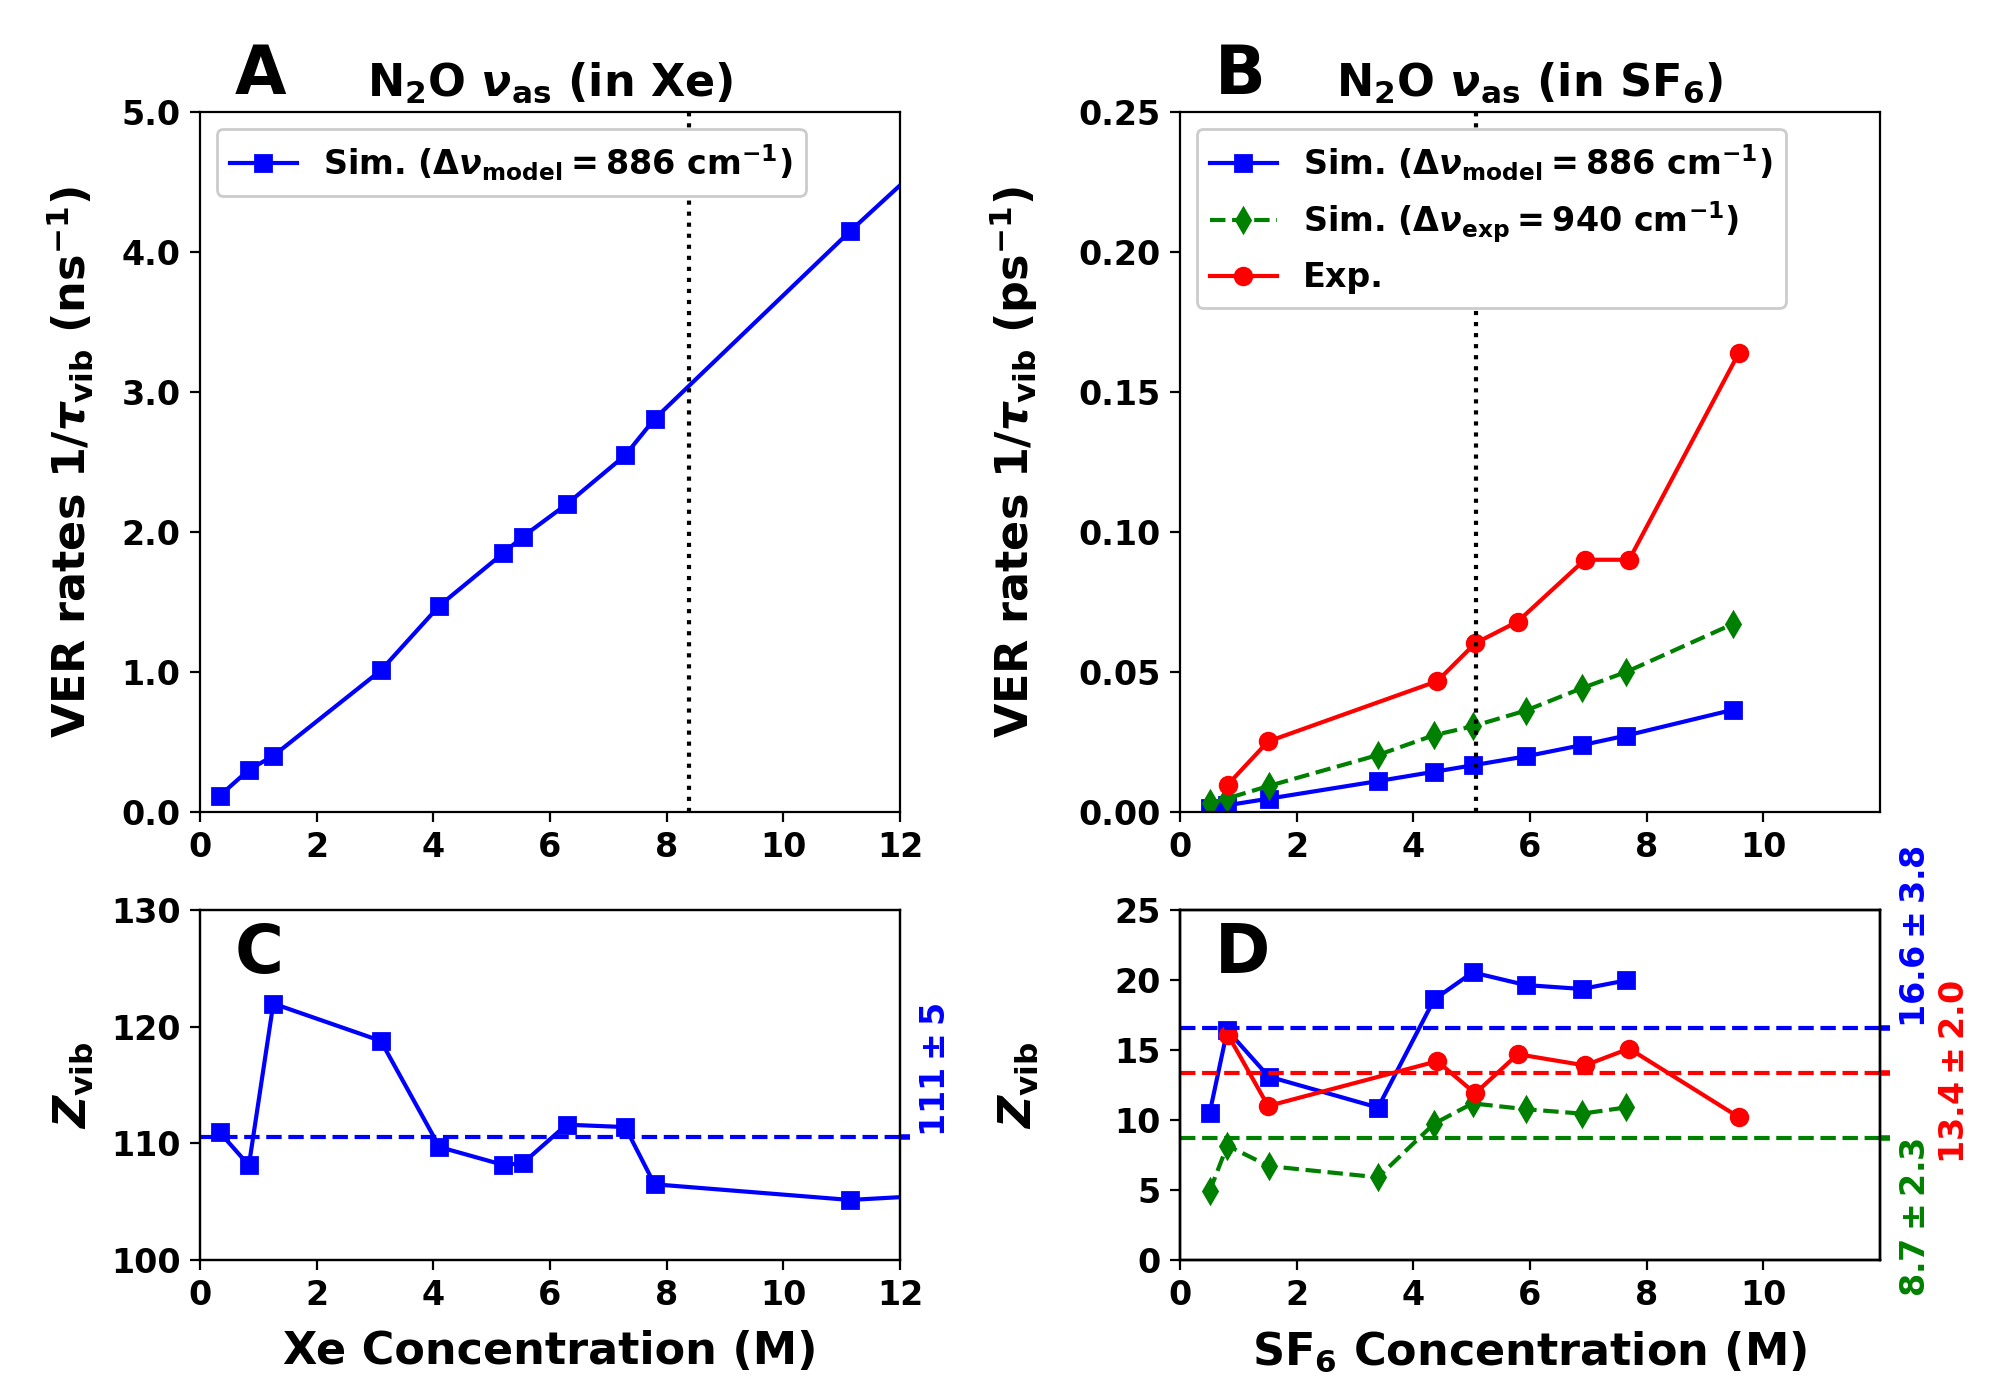
For N2O in xenon, the computed N2O VER rates for
in Figure 7A are on the
ns-1 time scale for supercritical xenon and indicate a rather
slow VER relaxation process, as expected, with an average VER rate of
s-1M-1.
Experimentally,20 a VER rate of s-1M-1 ( cm3s-1) was indirectly obtained from a small
reduction of the pump-probe decay signal within 200 ps
which corresponds to ns but was only
measured at high xenon concentration ( M). This compares with
s-1M-1 from the
simulations which is times faster compared with the estimate
from the experiments. It should be noted that the Landau-Teller model
was successfully applied to rather long VER times ( ps) for
the case of CO in myoglobin.44 Hence it is likely
that the Landau-Teller approach for VER is valid but the limitations
for N2O in xenon arise due to neglect of many-body interactions, in
particular at high solvent densities but also due to the uncertainty
in the measurements.
On the
other hand, for N2O in SF6 (panel B), the computed VER rates
obtained with the model frequency difference distribution around
(blue line) are on the ps-1 time scale
for gaseous and supercritical SF6. Assuming a frequency difference
distribution around the experimental value
the VER rates are higher by a factor of two (green dashed line). The
VER of is faster in SF6 than in xenon
due to the coupling with three-times degenerated the S-F stretch modes
at cm-1, which is well visible by a peak around
this wavenumber in the friction function in Figure
S17.
The available experimental data of the VER rates for N2O
in SF6 (red circles in Figure
7B) are still about four or two times faster
than VER rates computed with the frequency difference distribution
from the model simulation or experimental observations,
respectively. The computed VER rates, however, feature a linear raise
with increasing SF6 concentration which corresponds to VER rates of
s-1M-1 and
s-1M-1. The experimentally
reported VER rate for N2O in gaseous SF6 or
the IBC regime is s-1M-1
( cm3s-1).20
Scaling the computed VER lifetimes with the
estimated collision rate reveals that for N2O
in xenon an average of collisions between N2O and xenon
atoms are required to relax the asymmetric stretch vibration in
N2O. Using the experimentally estimated would
yield a yet larger value for by one order of
magnitude. For N2O in SF6, SF or is about one order of magnitude smaller
depending on whether or
are used for estimating the VER lifetime,
respectively. From experiments, collisions between N2O and SF6 are required. This is midway
between the two computed values due to differences in the estimated
collision rate. The collision rate from the estimated mean free
collision time - which is larger than the one obtained from counting
collision events - together with the underestimated VER rate lead to
closer agreement of computed and experimentally estimated
than comparison of the VER.
Even if VER rates from simulations are computed using the
experimentally reported frequency difference ,
the VER rates are still half as fast compared with the experimentally
measured VER rates for N2O in SF6. The first-order Landau-Teller
model to compute the VER lifetimes used here only includes the term
describing solvent friction, i.e. the influence of the solute-solvent
interaction potential on the normal mode
. Shorter lifetimes might be obtained by
including higher-order correction terms such as solvent-induced
coupling to the solute-solvent interaction potential expression in
Eq. 8. Such terms include the second derivative of
along the solute normal mode of and describing the relaxation
pathway of intramolecular VER assisted by the
solvent.43
4 Discussion and Conclusions
The present work provides a atom-resolved picture of rotational and
vibrational energy relaxation of N2O in xenon and SF6 covering a
wide range of thermodynamic states ranging from the gas phase to the
liquid. In an effort to improve the solvent-solute interactions, the
electrostatic and other nonbonded interactions were fit to reference
electronic structure calculations at different levels of theory. While
for VER satisfactory results compared with experiment were found, RER
agrees with experiment only up to M. For
higher concentrations the simulation follow the IBC model whereas
experimentally different behaviours are found for xenon and SF6.
For N2O in xenon the experiments find a pronounced increase in the
RER time as the concentration increases from 6 M to 8 M, see Figure
S4. The experiments are expected to report on the
solvent rotational energy normalized autocorrelation function . For low-density solvent the
experimental result could be reproduced almost quantitatively, whereas
for increasing density no discontinuous change of the RER time was
found. Rather, the linear behaviour - consistent with the IBC model -
continued up to the highest simulated densities yield RER rates of
s-1M-1 and
s-1M-1 for N2O in xenon and
SF6, respectively. These computed RER rates agree well with those
from experiment within the IBC region of
s-1M-1 and
s-1M-1, respectively.
In search for a reason for the disagreement, additional correlation
functions, including , , and
were analyzed. However, all of them confirm the behaviour of the
computed correlation function. One possible explanation for this
finding is to note that with increasing density the solvent packing
around the solute becomes so dense, that the isolated N2O
properties ( or ) cannot be
compared with the experimentally observed signals. The rotation of
N2O cannot be treated isolated from the movement of the solvation
shells. Rather, for sufficiently large solvent densities the
rotational motion of N2O and the solvent molecules are coupled and
solvent molecules are “slaved” to the N2O rotation.
Quantum-mechanically, the rotational quantum number correlating with
is a “good quantum number” for gas phase and
low solvent densities whereas this property is lost for increasing
solvent density.
Analysis of the trajectories with regards to changes in kinetic energy
(squared momentum transfer) between the collision partners (N2O and
xenon; N2O and SF6) revealed a larger average change for the
rotational energy of N2O when colliding with SF6 than with
xenon. The translational kinetic energy change of the solvent
molecules xenon and SF6 are comparable, whereas the additional
rotational and vibrational degrees of freedom in SF6 provide
further energy transfer pathways compared with xenon.
Considering RER, the average number of collisions to rotationally
relax N2O over the concentration range considered are
and ,
respectively. This shows that RER for N2O in SF6 is about
times more effective than in xenon, which is consistent with
experiments. There, the values of 2.4 and 1.7 collision are about 2 to
3 times larger for SF6 compared with xenon, indicating a less
efficient rotational relaxation per collision in the simulations. The
largest deviations between experiments and the simulations are in the
collision rates which are twice as high when estimated from the
inverse of the mean free collision times. Together with the simulated
RER rates this yields of 2.5 and 1.4 for N2O in
xenon and SF6, respectively, which is much closer to the
experiments. The relative change is somewhat smaller
but comparable to depending on solvent concentration
which indicates that angular anisotropy of the intermolecular
interactions influence RER.
Values of the VER rates are computed by the Landau-Teller approach and
show a very slow VER process of the asymmetric stretch vibration
of N2O in xenon with a VER rate of
s-1M-1. In SF6, the computed
rates are much faster by one magnitude with
s-1M-1 or
s-1M-1 depending on the applied
frequency difference distribution for the relaxation process . These rates are about
four or two times lower than the experimentally observed VER rate in
the IBC regime at low solvent densities of
s-1M-1, but also do the computed VER
rates of N2O in SF6 around its critical density
not show the effect of critical slowing as in the experiments (see
Figure 7B). This deficiency of the simulation,
however, is consistent with the missing effect of critical slowing in
the computed RER rates for N2O in SF6.
In summary, this work presented a molecular-level study of rotational and vibrational energy relaxation of N2O in xenon and SF6 ranging from highly dilute to liquid phases of the solvent, including the supercritical regime. For regimes in which the IBC model is valid almost quantitative agreement with experiment was found whereas near the supercritical point simulations and experimental findings disagree, in particular for RER. The most likely reason is that the effect of solvent packing is neglected in the analysis if only the rotational motion of the solute (N2O) is considered. The average number of collisions for rotational and vibrational relaxation from the simulations agree rather well with those obtained from experiments. In conclusion, VER of N2O across different solvent density regimes and RER in the low-density region can be characterized well at a molecular level whereas for the higher-density regimes, analysis of the RER requires additional refinements.
Acknowledgment
This work has been financially supported by the Swiss National Science
Foundation (NCCR-MUST, grants 200021-117810, 200020-188724), the
AFOSR, the University of Basel, and by the European Union’s Horizon 2020
research and innovation program under the Marie Skłodowska-Curie grant
agreement No 801459 -FP-RESOMUS. The support of the National
Science Foundation, Grant No. CHE-2102427 (L.D.Z.), and the Boston
University Photonics Center is gratefully acknowledged.
Supporting Information
The supporting material includes system setups (Table
S1), force field parameters (Table S2),
various correlation functions (Figures S1, S2, S6-S9)
with further evaluation results (Figures S3-S5, S10-S15)
and the frequency-dependent friction functions (Figures
S16, S17).
Data Availability
Relevant data for the present study are available at https://github.com/MMunibas/SCF_N2O/.
References
- 1 Foster, J.; Miller, R. S. High Pressure Processes in Chemical Engineering; pp 53–75
- Guardiola et al. 2017 Guardiola, C.; Olmeda, P.; Pla, B.; Bares, P. In-cylinder pressure based model for exhaust temperature estimation in internal combustion engines. Appl. Therm. Eng. 2017, 115, 212–220
- Farrell and Peters 1986 Farrell, P. V.; Peters, B. D. Droplet vaporization in supercritical pressure environments. Acta Astronaut. 1986, 13, 673–680, Congress of the International Academy of Astronautics
- Kajimoto 1999 Kajimoto, O. Solvation in Supercritical Fluids: Its Effects on Energy Transfer and Chemical Reactions. Chem. Rev. 1999, 99, 355–*390
- Knez et al. 2014 Knez, Ž.; Markočič, E.; Leitgeb, M.; Primožič, M.; Knez Hrnčič, M.; Škerget, M. Industrial applications of supercritical fluids: A review. Energy 2014, 77, 235–243
- Brunner 2010 Brunner, G. Applications of Supercritical Fluids. Annu. Rev. Biomed. Eng. 2010, 1, 321–342
- Hrnčič et al. 2018 Hrnčič, M. K.; Cör, D.; Verboten, M. T.; Knez, Ž. Application of supercritical and subcritical fluids in food processing. Food Qual. Saf. 2018, 2, 59–67
- Perrut 2000 Perrut, M. Supercritical Fluid Applications: Industrial Developments and Economic Issues. Industrial & Engineering Chemistry Research 2000, 39, 4531–4535
- Deshpande et al. 2011 Deshpande, P. B.; Kumar, G. A.; Kumar, A. R.; Shavi, G. V.; Karthik, A.; Reddy, M. S.; Udupa, N. Supercritical Fluid Technology: Concepts and Pharmaceutical Applications. PDA Journal of Pharmaceutical Science and Technology 2011, 65, 333–344
- Machida et al. 2011 Machida, H.; Takesue, M.; Smith, R. L. Green chemical processes with supercritical fluids: Properties, materials, separations and energy. The Journal of Supercritical Fluids 2011, 60, 2–15
- Tucker 1999 Tucker, S. C. Solvent Density Inhomogeneities in Supercritical Fluids. Chem. Rev. 1999, 99, 391–418
- Saitow et al. 2003 Saitow, K.; Otake, K.; Nakayama, H.; Ishii, K.; Nishikawa, K. Local density enhancement in neat supercritical fluid due to attractive intermolecular interactions. Chem. Phys. Lett. 2003, 368, 209–214
- Nishikawa and Morita 2000 Nishikawa, K.; Morita, T. Inhomogeneity of molecular distribution in supercritical fluids. Chem. Phys. Lett. 2000, 316, 238–242
- Saitow et al. 2002 Saitow, K.-i.; Ochiai, H.; Kato, T.; Nishikawa, K. Correlation time of density fluctuation for supercritical ethylene studied by dynamic light scattering. J. Chem. Phys. 2002, 116, 4985–4992
- Saitow et al. 2005 Saitow, K.-i.; Kajiya, D.; Nishikawa, K. Time Evolution of Density Fluctuation in Supercritical Region. I. Non-hydrogen-bonded Fluids Studied by Dynamic Light Scattering. J. Phys. Chem. A 2005, 109, 83–91
- Goodyear and Tucker 1999 Goodyear, G.; Tucker, S. C. Glass-like behavior in supercritical fluids: The effect of critical slowing down on solute dynamics. J. Chem. Phys. 1999, 111, 9673–9677
- Goodyear et al. 2000 Goodyear, G.; Maddox, M. W.; Tucker, S. C. The correlation between local and long-range structure in compressible supercritical fluids. J. Chem. Phys. 2000, 112, 10327–10339
- Mandal et al. 2018 Mandal, A.; Ng Pack, G.; Shah, P. P.; Erramilli, S.; Ziegler, L. D. Ultrafast Two-Dimensional Infrared Spectroscopy of a Quasifree Rotor: Scrambling and Perfectly Anticorrelated Cross Peaks. Phys. Rev. Lett. 2018, 120, 103401
- Ng Pack et al. 2019 Ng Pack, G.; Rotondaro, M. C.; Shah, P. P.; Mandal, A.; Erramilli, S.; Ziegler, L. D. Two-dimensional infrared spectroscopy from the gas to liquid phase: density dependent scrambling, vibrational relaxation, and the onset of liquid character. Phys. Chem. Chem. Phys. 2019, 21, 21249–21261
- Rotondaro et al. 2022 Rotondaro, M. C.; Jain, A.; Erramilli, S.; Ziegler, L. D. Ultrafast 2DIR comparison of rotational energy transfer, isolated binary collision breakdown, and near critical fluctuations in Xe and SF6 solutions. J. Chem. Phys. 2022, 157, 174305
- Töpfer et al. 2023 Töpfer, K.; Erramilli, D. K.; Ziegler, L. D.; Meuwly, M. Molecular-level understanding of the rovibrational spectra of N2O in gaseous, supercritical, and liquid SF6 and Xe. J. Chem. Phys. 2023, 158, 144302
- Unke and Meuwly 2017 Unke, O. T.; Meuwly, M. Toolkit for the Construction of Reproducing Kernel-based Representations of Data: Application to Multidimensional Potential Energy Surfaces. J. Chem. Inf. and Mod. 2017, 57, 1923–1931
- Koner et al. 2020 Koner, D.; San Vicente Veliz, J. C.; Bemish, R. J.; Meuwly, M. Accurate reproducing kernel-based potential energy surfaces for the triplet ground states of N2O and dynamics for the N + NO O + N2 and N2 + O 2N + O reactions. Phys. Chem. Chem. Phys. 2020, 22, 18488–18498
- Werner et al. 2020 Werner, H.-J.; Knowles, P. J.; Manby, F. R.; Black, J. A.; Doll, K.; Heßelmann, A.; Kats, D.; Köhn, A.; Korona, T.; Kreplin, D. A. et al. The Molpro quantum chemistry package. J. Chem. Phys. 2020, 152, 144107
- Dellis and Samios 2010 Dellis, D.; Samios, J. Molecular force field investigation for Sulfur Hexafluoride: A computer simulation study. Fluid Phase Equilib. 2010, 291, 81–89
- Stephenson et al. 1987 Stephenson, R. M.; Malanowski, S.; Ambrose, D. Handbook of the thermodynamics of organic compounds; section on vapor-liquid critical constants of fluids; Elsevier, 1987
- Haynes 2014 Haynes, W. CRC Handbook of Chemistry and Physics; CRC Handbook of Chemistry and Physics; CRC Press, 2014; p. 6-85
- Michels et al. 1954 Michels, A.; Wassenaar, T.; Louwerse, P. Isotherms of xenon at temperatures between 0°C and 150°C and at densities up to 515 Amagats (pressures up to 2800 atmospheres). Physica 1954, 20, 99–106
- Nelder and Mead 1965 Nelder, J. A.; Mead, R. A Simplex Method for Function Minimization. Comput. J. 1965, 7, 308–313
- Devereux et al. 2014 Devereux, M.; Raghunathan, S.; Fedorov, D. G.; Meuwly, M. A Novel, computationally efficient multipolar model employing distributed charges for molecular dynamics simulations. J. Chem. Theo. Comp. 2014, 10, 4229–4241
- Unke et al. 2017 Unke, O. T.; Devereux, M.; Meuwly, M. Minimal distributed charges: Multipolar quality at the cost of point charge elect rostatics. J. Chem. Phys. 2017, 147, 161712
- Devereux et al. 2020 Devereux, M.; Pezzella, M.; Raghunathan, S.; Meuwly, M. Polarizable Multipolar Molecular Dynamics Using Distributed Point Charges. J. Chem. Theo. Comp. 2020, 16, 7267–7280
- Frisch et al. 2016 Frisch, M. J.; Trucks, G. W.; Schlegel, H. B.; Scuseria, G. E.; Robb, M. A.; Cheeseman, J. R.; Scalmani, G.; Barone, V.; Petersson, G. A.; Nakatsuji, H. et al. Gaussian˜16 Revision C.01. 2016; Gaussian Inc. Wallingford CT
- Olney et al. 1997 Olney, T. N.; Cann, N.; Cooper, G.; Brion, C. Absolute scale determination for photoabsorption spectra and the calculation of molecular properties using dipole sum-rules. Chem. Phys. 1997, 223, 59–98
- Gussoni et al. 1998 Gussoni, M.; Rui, M.; Zerbi, G. Electronic and relaxation contribution to linear molecular polarizability. An analysis of the experimental values. J. Mol. Struct. 1998, 447, 163–215
- Branch et al. 1999 Branch, M. A.; Coleman, T. F.; Li, Y. A Subspace, Interior, and Conjugate Gradient Method for Large-Scale Bound-Constrained Minimization Problems. SIAM J Sci Comput 1999, 21, 1–23
- Boys and Bernardi 1970 Boys, S.; Bernardi, F. The calculation of small molecular interactions by the differences of separate total energies. Some procedures with reduced errors. Molecular Physics 1970, 19, 553–566
- Grimme et al. 2011 Grimme, S.; Antony, J.; Ehrlich, S.; Krieg, H. A consistent and accurate ab initio parametrization of density functional dispersion correction (DFT-D) for the 94 elements H-Pu. J. Chem. Phys. 2011, 132, 154104
- Brooks et al. 2009 Brooks, B. R.; Brooks III, C. L.; MacKerell Jr., A. D.; Nilsson, L.; Petrella, R. J.; Roux, B.; Won, Y.; Archontis, G.; Bartels, C.; Boresch, S. et al. CHARMM: The Biomolecular Simulation Program. J. Comp. Chem. 2009, 30, 1545–1614
- Martínez et al. 2009 Martínez, L.; Andrade, R.; Birgin, E. G.; Martínez, J. M. Packmol: A Package for Building Initial Configurations for Molecular Dynamics Simulations. J. Chem. Theo. Comp. 2009, 30, 2157–2164
- Whitnell et al. 1992 Whitnell, R. M.; Wilson, K. R.; Hynes, J. T. Vibrational relaxation of a dipolar molecule in water. J. Chem. Phys. 1992, 96, 5354–5369
- Rey and Hynes 1998 Rey, R.; Hynes, J. T. Vibrational phase and energy relaxation of CN- in water. J. Chem. Phys. 1998, 108, 142–153
- Morita and Kato 1998 Morita, A.; Kato, S. Vibrational relaxation of azide ion in water: The role of intramolecular charge fluctuation and solvent-induced vibrational coupling. J. Chem. Phys. 1998, 109, 5511–5523
- Sagnella et al. 1999 Sagnella, D. E.; Straub, J. E.; Jackson, T. A.; Lim, M.; Anfinrud, P. A. Vibrational population relaxation of carbon monoxide in the heme pocket of photolyzed carbonmonoxy myoglobin: Comparison of time-resolved mid-IR absorbance experiments and molecular dynamics simulations. Proc. Natl. Acad. Sci. 1999, 96, 14324–14329
- Everitt and Skinner 1999 Everitt, K. F.; Skinner, J. L. Vibrational energy relaxation of oxygen in liquid mixtures with argon. J. Chem. Phys. 1999, 110, 4467–4470
- Tennyson et al. 2004 Tennyson, J.; Kostin, M. A.; Barletta, P.; Harris, G. J.; Polyansky, O. L.; Ramanlal, J.; Zobov, N. F. DVR3D: a program suite for the calculation of rotation–vibration spectra of triatomic molecules. Comput. Phys. Commun. 2004, 163, 85–116
- Herzberg 1945 Herzberg, G. Infrared and Raman Spectra of Polyatomic Molecules; D. Van Nostrand Company, Inc., New York, 1945
- Herzberg and Herzberg 1950 Herzberg, G.; Herzberg, L. Rotation-Vibration Spectra of Diatomic and Simple Polyatomic Molecules with Long Absorbing Paths VI. The Spectrum of Nitrous Oxide (N2O) below 1.2. J. Chem. Phys. 1950, 18, 1551–1561
- Kagann 1982 Kagann, R. H. Infrared absorption intensities for N2O. J. Mol. Spectrosc. 1982, 95, 297–305
- Aziz and Slaman 1986 Aziz, R. A.; Slaman, M. On the Xe-Xe potential energy curve and related properties. Mol. Phys. 1986, 57, 825–840
- Hellmann et al. 2017 Hellmann, R.; Jäger, B.; Bich, E. State-of-the-art ab initio potential energy curve for the xenon atom pair and related spectroscopic and thermophysical properties. J. Chem. Phys. 2017, 147, 034304
- Freeman et al. 1974 Freeman, D. E.; Yoshino, K.; Tanaka, Y. Vacuum ultraviolet absorption spectrum of the van der Waals molecule Xe2. I. Ground state vibrational structure, potential well depth, and shape. J. Chem. Phys. 1974, 61, 4880–4889
- Maddox et al. 2000 Maddox, M. W.; Goodyear, G.; Tucker, S. C. Origins of Atom-Centered Local Density Enhancements in Compressible Supercritical Fluids. J. Phys. Chem. B 2000, 104, 6248–6257
- Maddox et al. 2000 Maddox, M. W.; Goodyear, G.; Tucker, S. C. Effect of Critical Slowing Down on Local-Density Dynamics. J. Phys. Chem. B 2000, 104, 6266–6270
- Berne and Pecora 2000 Berne, B. J.; Pecora, R. Dynamic light scattering: with applications to chemistry, biology, and physics; Courier Corporation, 2000
- Bondi 1964 Bondi, A. van der Waals Volumes and Radii. J. Phys. Chem. 1964, 68, 441–451
- Yardley 1980 Yardley, J. Introduction to Molecular Energy Transfer; Academic Press, New York, 1980