Root Cause Analysis for Microservices based on Causal Inference: How Far Are We?
Abstract.
Microservice architecture has become a popular architecture adopted by many cloud applications. However, identifying the root cause of a failure in microservice systems is still a challenging and time-consuming task. In recent years, researchers have introduced various causal inference-based root cause analysis methods to assist engineers in identifying the root causes. To gain a better understanding of the current status of causal inference-based root cause analysis techniques for microservice systems, we conduct a comprehensive evaluation of nine causal discovery methods and twenty-one root cause analysis methods. Our evaluation aims to understand both the effectiveness and efficiency of causal inference-based root cause analysis methods, as well as other factors that affect their performance. Our experimental results and analyses indicate that no method stands out in all situations; each method tends to either fall short in effectiveness, efficiency, or shows sensitivity to specific parameters. Notably, the performance of root cause analysis methods on synthetic datasets may not accurately reflect their performance in real systems. Indeed, there is still a large room for further improvement. Furthermore, we also suggest possible future work based on our findings.
1. Introduction
In recent years, microservice architecture has become a popular paradigm in the development of large-scale cloud-based systems (e.g., social networks, online shopping, video streaming services) owing to its scalability, resiliency, and elasticity. A microservice system consists of multiple loosely coupled services where each service can be developed and updated without requiring too much knowledge of the rest of the system. This property makes microservice systems highly adaptable for cloud environments and easy to be deployed, scaled, and maintained by different engineering groups. A large number of prominent enterprises, including Amazon, Netflix, Twitter, and Spotify, have extensively employed a wide range of microservice systems as their core business solutions (Soldani et al., 2018; Soldani and Brogi, 2022).
Although microservice systems offer various significant benefits, they come with several drawbacks, one of the most notable ones being the challenge of analyzing the root causes of system failures. A typical microservice system can consist of a dozen to hundreds of services, with each service having a large number of metrics to be continuously monitored. Once a failure occurs, it can propagate across the services and affect a large number of metrics, making it especially challenging for engineers to identify the failure’s root cause promptly. It was reported that without using an automated tool, it could take engineers at least several hours to identify a failure’s root cause (Ikram et al., 2022; Wang et al., 2018). This delay can affect a large number of users, incurring substantial economic losses and other unintended consequences. It has been reported that a one-hour downtime on Amazon.com could potentially cost up to million USD (Chen et al., 2020, 2019a).
Causal inference-based root cause analysis (RCA) methods for microservice systems via metrics data have attracted increasing attention from researchers in recent years (Soldani and Brogi, 2022; Xin et al., 2023; Ikram et al., 2022; Li et al., 2022a; Wu et al., 2021a; Ma et al., 2019; Wang et al., 2018; Meng et al., 2020; Lin et al., 2024; Arpit et al., 2023). The main idea is to construct a graph from metrics data to depict the causal relationships among the services and metrics (causal graph) and, from this graph, infer the root cause of a failure. A number of methods including CloudRanger (Wang et al., 2018), Microscope (Lin et al., 2018), MS-Rank (Ma et al., 2019), AutoMap (Ma et al., 2020), MicroCause (Meng et al., 2020), and CausalAI (Arpit et al., 2023) rely on the Peter-Clark (PC) algorithm (Spirtes et al., 1993) or its variants (Runge et al., 2019) to construct the causal graph. Then a scoring method such as random walk (Spitzer, 1976), PageRank (Brin and Page, 1998) or Depth-First Search (DFS) is used to traverse the causal graph to locate the root cause. CIRCA (Li et al., 2022a) constructs a causal graph based on domain knowledge and causal assumptions. Then, it uses a regression-based hypothesis testing method to infer the root cause. RCD (Ikram et al., 2022) uses the -PC algorithm (Jaber et al., 2020; Spirtes et al., 1993) and a divide-and-conquer strategy to infer the failure’s root cause. More recently, CausalRCA (Xin et al., 2023) introduces a gradient-based structure learning method to generate a weighted causal graph and combines it with the PageRank algorithm to locate the root cause. Meanwhile, RUN (Lin et al., 2024) uses neural Granger causal discovery with contrastive learning to construct the causal graph and the PageRank algorithm to infer the root cause.
Despite significant progress, we notice there is a lack of comprehensive evaluation of causal inference-based RCA methods. Existing research works only assess the methods from a limited number of aspects on a restricted set of datasets, and thus, do not provide adequate insights into the capability of these methods. For example, Wu et al. (Wu et al., 2021b) evaluate six causal inference-based RCA methods. However, it neither evaluates the causal graph construction step nor includes recent proposed methods (e.g., RCD, CIRCA, CausalRCA, RUN), and other important aspects such as the impact of hyperparameter tuning, input data length, among others. Both the work in (Arya et al., 2021) and (Wang et al., 2021) only evaluate Granger-based RCA methods for AIOps using time series data obtained via the system log data. In this work, we aim to understand the current state of causal inference-based RCA methods by thoroughly assessing their performance and the factors that could affect their performance.
We conduct a comprehensive evaluation of causal inference-based RCA methods on six synthetic datasets and four datasets from three benchmark microservice systems with different types of failures. First, we assess the performance of various common causal discovery methods in constructing causal graphs for microservice systems from metrics data. Second, we evaluate the performance of existing state-of-the-art causal inference-based RCA methods to understand whether they can accurately locate a failure’s root cause. Third, we analyse the runtime of these methods to understand their efficiency. Finally, we investigate different factors that could affect the performance of causal inference-based RCA methods, such as the input data length, the hyperparameter tuning process, and the misspecification of the failure occurrence time. Through extensive experiments, we obtain the following major findings about the causal inference-based RCA methods for microservice systems:
-
•
All common causal discovery methods have difficulties in working with large graphs and estimating edge directions, suggesting that directly applying causal discovery methods for RCA in large-scale microservices might not be effective. Hyperparameter tuning could help improve the performance of small-scale graphs but fail on large-scale ones.
-
•
Some causal inference-based RCA methods are better than others in identifying the root causes of microservice systems’ failures but at the cost of losing efficiency or being highly sensitive to some parameters. Large-scale microservice systems remain challenging for causal inference-based RCA methods.
-
•
Synthetic datasets used in previous research may not accurately reflect the performance of causal discovery and RCA methods for real-world microservice systems, highlighting the need to reconsider the process of generating synthetic data.
-
•
The running time of most causal inference-based RCA methods increases significantly with the size of microservices and the number of metrics. Some methods are always faster than others.
-
•
Long input data lengths could significantly improve the performance of causal discovery and causal inference-based RCA methods. Some methods are still effective with shorter data.
Based on our study, we identify several challenges of causal inference-based RCA methods in the context of microservice systems and propose possible future research work.
In summary, our major contributions are as follows:
-
•
We conduct a comprehensive evaluation of causal inference-based RCA methods using metrics for microservice systems.
-
•
We obtain many important and useful insights from our evaluation and conclude that most existing causal inference-based RCA methods do not have very good performance in all scenarios, especially for large-scale microservice systems.
-
•
We suggest future research directions on causal inference-based RCA for microservice systems using metrics data.
2. Causal Inference-Based Root Cause Analysis for Microservice Systems
2.1. Problem Statement
2.1.1. Key Terminology
While failures represent the actual inability of a service to execute its functions, faults correspond to the root causes of such failures (e.g. high CPU utilization, heavy workload, or network congestion) (Soldani and Brogi, 2022; Avizienis et al., 2004). Root cause analysis (RCA) is the process of determining why a failure has occurred (Lee et al., 2023), i.e. finding the root cause of the failure. RCA involves a thorough examination of various monitoring data, i.e. including metrics data. Metrics are recorded by the monitoring system and contain various critical information within the microservices systems, such as workload, resource consumption, and response time (Xin et al., 2023). These metrics are typically represented as multivariate time series, with each time series corresponding to the data collected with a specific metric.
2.1.2. Problem Formulation
Considering a large-scale microservice system that consists of services . At time step , the monitoring system collects metrics from each service . Suppose a failure occurred at time . Let us denote the metrics data collected from before the failure, at time step , until when the RCA module is invoked at , as . The goal of a metric-based RCA method is to identify the root cause of the failure using the dataset D.
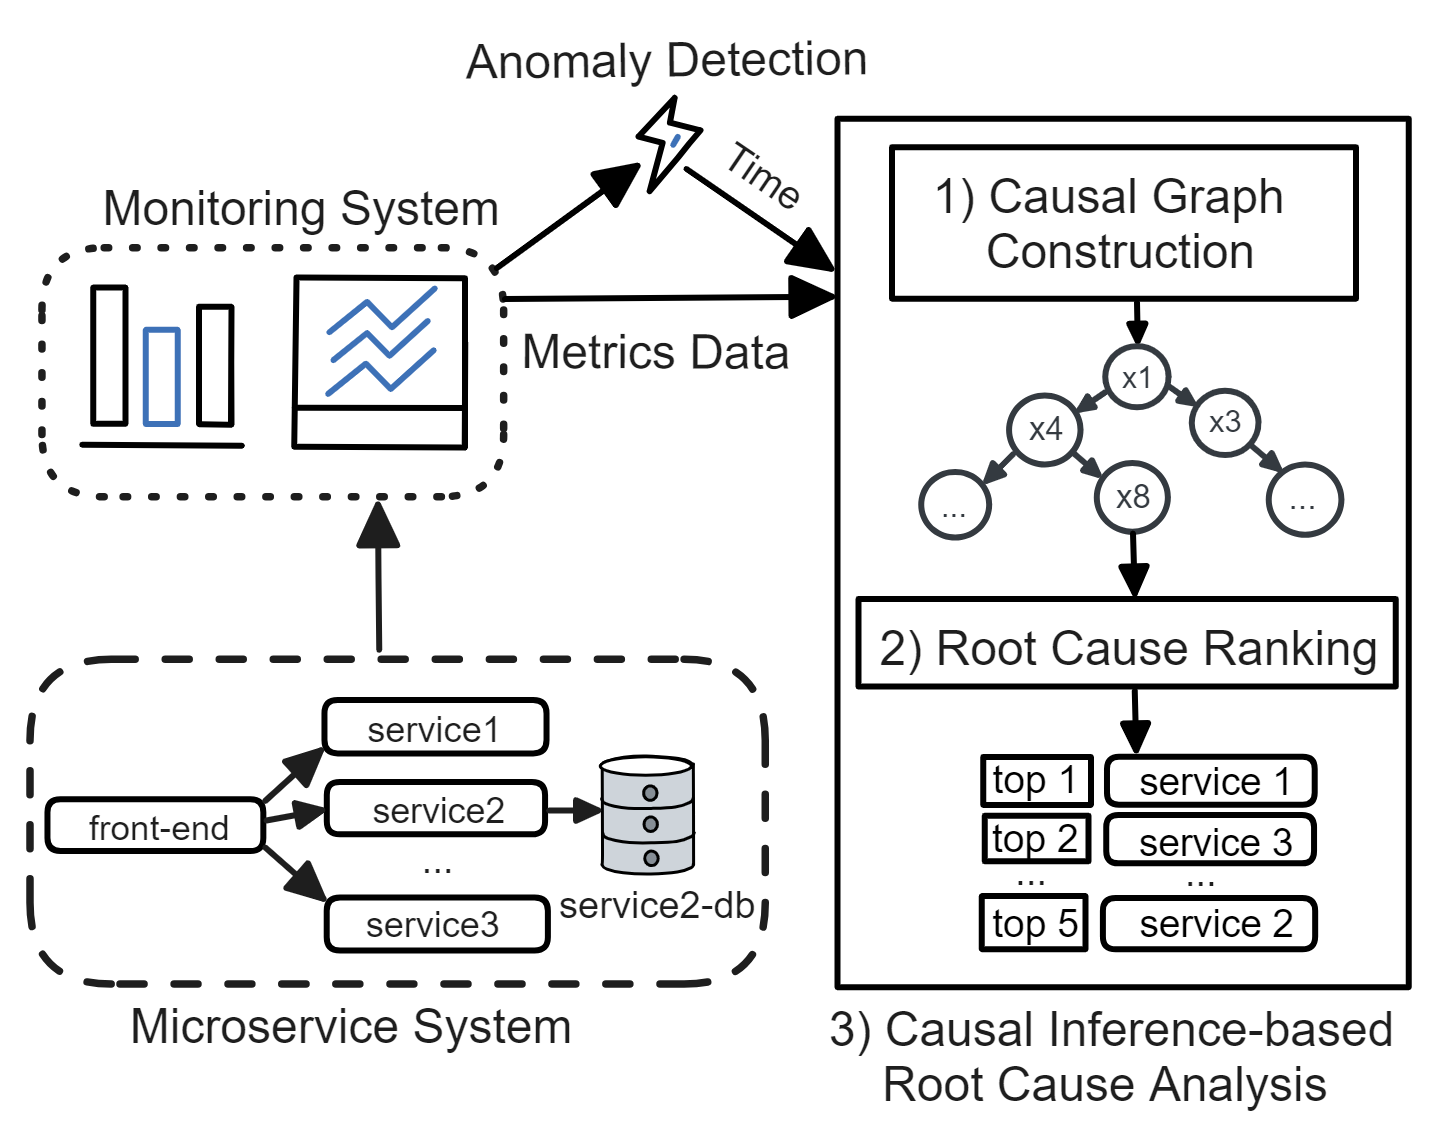
The main idea to solve this problem via causal inference is to first construct a causal graph from the dataset D and then use a scoring method to identify the service that is likely to be the root cause of the failure (see Fig. 1). In metric-based RCA, causal graphs depict cause-and-effect connections, with each node representing a metric of a service and each edge indicating a causal relationship (Soldani and Brogi, 2022). Causal graphs can capture relationships even among non-communicating services, such as those collocated on the same virtual machine (Lin et al., 2018). In the sections below, we first describe the existing causal discovery techniques to construct causal graphs from time series data (Sec. 2.2). Then, we outline the scoring methods to locate the failure’s root cause based on the causal graph (Sec. 2.3), and the state-of-the-art causal inference-based RCA methods for microservice systems (Sec. 2.4).
2.2. Causal Discovery Methods for Time Series
In recent years, causal discovery methods have gained attention for their ability to infer causal relationships from time series data (Vowels et al., 2022). In this section, we briefly summarize representative causal discovery methods commonly used in causal inference-based RCA methods. More information on these causal discovery methods is in our supplementary material (in our GitHub page), Sec. A.
Peter-Clark (PC) Algorithm (Spirtes et al., 1993). PC is arguably the most popular causal discovery algorithm. It uses conditional independence testing and a series of rules (Spirtes et al., 1993) to construct the causal graph. PCMCI (Runge et al., 2019), a PC variant, can handle time-lagged causal relations.
Fast Causal Inference (FCI) Algorithm (Spirtes et al., 1993). Similar to PC, FCI also uses conditional independence testing and a series of rules to construct the causal graph. However, FCI can deal with the presence of confounders, which is an advantage over the PC algorithm.
Granger Algorithm (Granger, 1980). It relies on the concept of Granger causality, where a time series causes another if the former provides statistically significant information about future values of the latter. An advanced nonlinear variant, Neural Granger Causal Discovery (NGCD) (Lin et al., 2024), can leverage contextual information in temporal data.
LiNGAM Algorithm (Shimizu et al., 2006). LiNGAM uses a linear, acyclic structural equation model to construct the causal graph. Similar to PC, it assumes no hidden confounders that affect the time series.
Greedy Equivalence Search (GES) Algorithm (Chickering, 2002). GES uses a greedy strategy and the Bayesian Information Criterion (BIC) (Schwarz, 1978) to build the causal graph. Besides, fGES (Fast GES) (Ramsey et al., 2017) constructs the causal graph relying on the collider causal structure when orienting edges, making it more computationally efficient.
NOTEARS-Low-Rank (NTLR) Algorithm (Fang et al., 2023). NTLR is a gradient-based causal discovery method which adapts NOTEARS (Zheng et al., 2018) with low-rank causal graphs. Note that NLTR has not yet been explored in the RCA literature but we include it to evaluate how a new causal discovery method performs in the RCA task.
2.3. Scoring Methods for Root Cause Analysis
After obtaining a causal graph, a scoring method is used to locate the root cause. We briefly outline below the scoring methods that have been commonly used in causal inference-based RCA.
Random Walk. The main idea of random walk is to walk through all the nodes in the causal graph and randomly choose the next nodes to visit (Wang et al., 2018; Lin et al., 2018; Meng et al., 2020). With this strategy, the nodes that are visited most often are considered the root cause of the failure.
PageRank. PageRank assesses the importance of each node in the causal graph based on the number and quality of the incoming edges and identifies nodes with more incoming edges from influential nodes as potential root causes (Xin et al., 2023; Wu et al., 2021a).
Depth First Search (DFS). DFS traverses all nodes in the causal graph and determines whether they are abnormal via an anomaly detection technique. It then identifies the abnormal sub-graphs, ranks their roots via anomaly scores and determines root causes as the root nodes of the abnormal sub-graphs (Chen et al., 2014).
Hypothesis Testing. This method formulates a failure as an intervention that alters the pre-failure data distribution. It conducts hypothesis testing to assess if a node’s data, after a failure, follows the pre-failure data distribution. Nodes with the most deviation from this distribution are considered root causes (Li et al., 2022a; Pham et al., 2024).
2.4. Causal Inference-based Root Cause Analysis Methods for Microservice Systems
In recent years, many causal inference-based RCA methods have been proposed to analyse and identify the root cause of failures in microservice systems (Soldani and Brogi, 2022; Xin et al., 2023; Ikram et al., 2022; Li et al., 2022a; Wu et al., 2021a; Ma et al., 2019, 2019; Meng et al., 2020; Lin et al., 2024; Arpit et al., 2023). We briefly describe recent causal inference-based RCA methods as follows.
PC-based (Wang et al., 2018; Lin et al., 2018; Meng et al., 2020; Chen et al., 2014; Ma et al., 2020, 2019). These methods use PC or its variant to construct a causal graph from time series metrics data and use a scoring method to locate the root cause. Notable methods include CloudRanger (Wang et al., 2018), Microscope (Lin et al., 2018), CauseInfer (Chen et al., 2014), AutoMap (Ma et al., 2020), MicroCause (Meng et al., 2020) and MS-Rank (Ma et al., 2019).
FCI-based (Chen et al., 2019b). AirAlert proposes to use the FCI algorithm to infer the causal relationships among the metrics data and serves as a diagnosis tool to help engineers identify the root cause easier.
Granger-based (Thalheim et al., 2017; Wang et al., 2021; Arya et al., 2021; Pan et al., 2021). These methods employ the Granger algorithm to derive causal graphs from time series logs data and then identify the root cause using a scoring technique.
LiNGAM-based (Wu et al., 2021a). MicroDiag is a popular method following this approach. It uses the DirectLiNGAM algorithm to construct the causal graph from the metrics data and the PageRank method to determine the location of the root cause from the causal graph.
MicroCause (Meng et al., 2020). MicroCause uses PCMCI (Runge et al., 2019) to construct the causal graph. Then, it applies temporal cause oriented random walk to rank the root causes from the estimated causal graph.
CIRCA (Li et al., 2022a). CIRCA constructs the causal graph from the call graph using operators’ knowledge about the system and a mapping of metrics into some defined categories. It formulates a failure as an intervention that alters the metrics data distribution and performs a regression-based hypothesis test to identify the root cause.
RCD (Ikram et al., 2022). RCD follows a divide-and-conquer approach that splits all metrics into smaller chunks and learns a causal graph for each chunk. It employs -PC algorithm (Jaber et al., 2020) to find the root cause within each chunk and then merges all the potential root causes together and runs -PC recursively to identify the final root cause.
CausalRCA (Xin et al., 2023). CausalRCA uses a gradient-based variational autoencoder causal structure learning method called DAG-GNN (Yu et al., 2019), to generate the causal graph. To infer the root cause, CausalRCA uses the PageRank algorithm.
RUN (Lin et al., 2024). RUN uses NGCD with contrastive learning to construct the causal graph. Then, it applies PageRank with a personalized vector to recommend the top-k root causes.
NSigma (Lin et al., 2018). NSigma is a hypothesis testing method that uses the z-score to compare the distributions of pre-failure and post-failure data. The higher the z-score, the more likely that metric is the root cause. NSigma does not construct any causal graph.
-Diagnosis (Shan et al., 2019). -Diagnosis uses a two-sample test algorithm and -statistics to estimate the similarity between every pair of metrics and rank the root causes based on test scores. Similar to NSigma, -Diagnosis does not construct causal graphs.
BARO (Pham et al., 2024). BARO uses a variant of hypothesis testing technique based on median and interquartile range (IQR), to analyse pre-failure and post-failure data distributions. This makes BARO more resistant to noise compared to NSigma. Similar to NSigma and -Diagnosis, BARO also does not construct causal graphs.
CausalAI (Arpit et al., 2023). CausalAI is an open-source industrial library for causal analysis. To conduct RCA, CausalAI uses PC to build the causal graph using time series metrics data. Subsequently, it derives root nodes from the causal graph as potential root causes.
3. Study Design
To understand the current state of causal inference-based RCA methods, we study the following four RQs to thoroughly assess their performance and the factors that could affect their performance:
-
•
RQ1: How effective are causal discovery algorithms in constructing causal graphs from time series metrics data? (Sec. 4.1)
-
•
RQ2: How effective are causal inference-based RCA methods in locating the failure’s root cause? (Sec. 4.2)
-
•
RQ3: How efficient are causal discovery methods and causal inference-based RCA methods? (Sec. 4.3)
-
•
RQ4: How do causal discovery and causal inference-based RCA methods perform w.r.t. different input data lengths? (Sec. 4.4)
3.1. Datasets
| Name | #nodes | #edges | #cases | #type |
|---|---|---|---|---|
| CIRCA10 | 10 | 20 | 200 | cts |
| CIRCA50 | 50 | 100 | 200 | cts |
| RCD10 | 10 | 13-19 | 200 | dct |
| RCD50 | 50 | 85-104 | 200 | dct |
| CausIL10 | 10 | 19 | 10 | cts |
| CausIL50 | 50 | 125 | 10 | cts |
(*) ’cts’ stands for ’continuous’, ’dct’ stands for ’discrete’.
| Name | #metrics | #svc | #t_svc | #fault | #cases | #type |
|---|---|---|---|---|---|---|
| Sock Shop 1 | 38 | 13 | 5 | 2 | 50 | cts |
| Sock Shop 2 | 46 | 15 | 5 | 5 | 125 | cts |
| Online Boutique | 49 | 12 | 5 | 5 | 125 | cts |
| Train Ticket | 212 | 64 | 5 | 5 | 125 | cts |
(*) The abbreviation convention is the same as Table 1.
3.1.1. Synthetic Datasets
We use three different synthetic data generators from three previous RCA studies (Li et al., 2022a; Ikram et al., 2022; Chakraborty et al., 2023) to create the synthetic datasets: CIRCA, RCD, and CausIL data generators. These data generators are used in various research works to evaluate RCA methods (Ikram et al., 2022; Li et al., 2022a; Chakraborty et al., 2023; Liu et al., 2023). Their mechanisms are as follows:
CIRCA data generator (Li et al., 2022a) generates a random causal directed acyclic graph (DAG) based on a given number of nodes and edges. From this DAG, time series data for each node is generated using a vector auto-regression (VAR) model. A fault is injected into a node by altering the noise term in the VAR model for two timestamps. RCD data generator (Ikram et al., 2022) uses the pyAgrum package (pya, 2023) to generate a random DAG based on a given number of nodes, subsequently generating discrete time series data for each node, with values ranging from 0 to 5. A fault is introduced into a node by changing its conditional probability distribution. Meanwhile, CausIL data generator (Chakraborty et al., 2023) generates causal graphs and time series data that simulate the behavior of microservice systems. It first constructs a DAG of services and metrics based on domain knowledge, then generates metric data for each node of the DAG using regressors trained on real metrics data. Unlike the CIRCA and RCD data generators, the CausIL data generator does not have the capability to inject faults.
To create our synthetic datasets, we first generate 10 DAGs whose nodes range from 10 to 50 for each of the synthetic data generators. Next, we generate fault-free datasets using these DAGs with different seedings, resulting in 100 cases for the CIRCA and RCD generators and 10 cases for the CausIL generator. We then create faulty datasets by introducing ten faults into each DAG and generating the corresponding faulty data, yielding 100 cases for the CIRCA and RCD data generators. The fault-free datasets are used to evaluate causal discovery methods, while the faulty datasets are used to assess RCA methods. We use all three dataset generators to alleviate each other’s weaknesses, such as diverse causal graph structures and different types of metrics data (continuous and discrete), enabling a more comprehensive assessment of the performance of the studied causal inference-based RCA methods. Table 1 shows the characteristics of the synthetic datasets.
3.1.2. Benchmark Microservice Systems
We deploy three popular benchmark microservice systems: Sock Shop (soc, 2023), Online Boutique (ob, 2023), and Train Ticket (tt, 2023), which are widely used for evaluating RCA methods (Lin et al., 2018; Ikram et al., 2022; Wu et al., 2021a; Xin et al., 2023; Wu, 2022; He et al., 2022; Li et al., 2021; Yu et al., 2021; Zhou et al., 2018; Wang et al., 2021; Pham et al., 2024). Sock Shop (soc, 2023) is a sock-selling e-commerce application that consists of 15 services communicating with each other through HTTP requests. Online Boutique (ob, 2023), with its 12 services, is an e-commerce application where users can browse items, add them to the cart, and purchase them. Train Ticket (tt, 2023) is one of the largest microservice systems, simulating a train ticket booking system with 64 services. Compared to Sock Shop and Online Boutique systems, Train Ticket system has longer and more complex failure propagation paths.
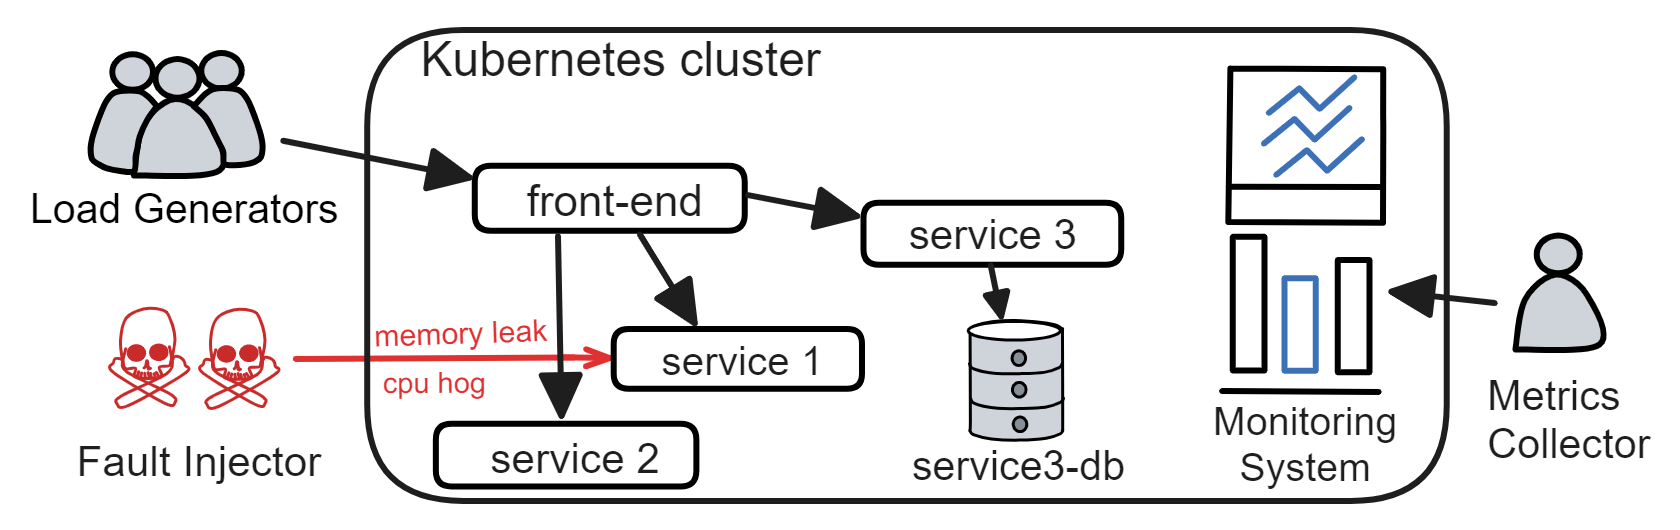
To generate metrics data, we first deploy these microservice systems on a four-node Kubernetes cluster hosted by AWS. Next, we use the Istio service mesh (ist, 2023) with Prometheus (pro, 2023) and cAdvisor (cad, 2023) to monitor and collect resource-level and service-level metrics of all services, as in previous works (Ikram et al., 2022; Xin et al., 2023; Pham et al., 2024). To generate traffic, we use the load generators provided by these systems and customise them to explore all services with 100 to 200 users concurrently. We then introduce five common faults (CPU hog, memory leak, disk IO stress, network delay, and packet loss) into five different services within each system. Finally, we collect metrics data before and after the fault injection operation. An overview of our setup is presented in Fig. 2. Furthermore, we diversify our datasets by using the available Sock Shop data from a previous study (Ikram et al., 2022), which we refer to as Sock Shop 1. We refer to our Sock Shop data as Sock Shop 2. The statistics of the collected datasets are shown in Table 2.
3.2. Evaluation Metrics
3.2.1. Causal Graph Construction.
We assess the accuracy of the estimated causal graph and its skeleton using F1-score, defined as,
where , , and correspond to true positives, false positives, and false negatives, respectively. is the number of correctly identified actual edges, is the number of incorrectly identified edges, and is the number of missing edges. The F1-score on the skeleton graph, denoted as F1-S, evaluates the accuracy of the edges without considering their directions. The F1-score on the full directed graph, denoted as F1, takes into account the orientations of the edges and penalises for incorrectly estimated directions of correctly identified adjacencies. Following previous works (Chakraborty et al., 2023; Liu et al., 2023), we also use Structural Hamming Distance (SHD) (Raghu et al., 2018) to assess the estimated causal graph. The SHD score is obtained by summing the missing edges, extra edges, and incorrectly directed edges.
3.2.2. Root Cause Analysis.
In this work, we evaluate the accuracy in identifying the root cause services as this is a standard practice in related work (Lin et al., 2018; Wang et al., 2023; Ikram et al., 2022; Xin et al., 2023; Wang et al., 2018; Chen et al., 2014; Ma et al., 2019, 2020). The root cause service is the service associated with the identified metric from the causal graph (Ikram et al., 2022; Ma et al., 2020; Xin et al., 2023). Following existing works (Lin et al., 2018; Ikram et al., 2022; Xin et al., 2023; Meng et al., 2020; Yu et al., 2021; Li et al., 2022a), we use two standard metrics, and , to assess the performance of the RCA methods. represents the probability the top results given by a method include the root cause. scores range from to 1, and the higher the value, the better the method. Given a set of failure cases A, is calculated as follows,
where is the ranking result for the failure case a. is the root cause set of case a. , which measures the overall performance of RCA methods, is calculated as .
3.3. Experimental Settings
For PC, FCI, LiNGAM, and CausalRCA methods, we use the implementation published in (Xin et al., 2023). For Granger, we use the standard implementation from the statsmodels package (sta, 2023). For PCMCI, we use the implementation in (Li et al., 2022a). For fGES and NTLR, we use the source code in (Chakraborty et al., 2023) and (Zhang et al., 2021), respectively. For -Diagnosis, we use the implementation in (Liu et al., 2023). For RCD, CIRCA, MicroCause, RUN, CausalAI, and BARO, we use their available implementation in (Ikram et al., 2022; Li et al., 2022a; Pan et al., 2021; Lin et al., 2024; Arpit et al., 2023; Pham et al., 2024). Note that for CIRCA, since the call graph is unavailable, thus following (Ikram et al., 2022), we use the PC algorithm to construct this graph. For the hyperparameter settings of the methods, we use the default values suggested by their respective papers. We confirmed the correctness of the source code by reproducing the presented results in the original and related papers. We conduct all experiments on Linux servers equipped with 8 CPUs, 16GB RAM.
4. Results
4.1. How Effective are Causal Discovery Algorithms in Constructing Causal Graphs?
| CIRCA10 | CIRCA50 | RCD10 | RCD50 | CausIL10 | CausIL50 | |||||||||||||
|---|---|---|---|---|---|---|---|---|---|---|---|---|---|---|---|---|---|---|
| F1 | F1-S | SHD | F1 | F1-S | SHD | F1 | F1-S | SHD | F1 | F1-S | SHD | F1 | F1-S | SHD | F1 | F1-S | SHD | |
| PC | 0.49 | 0.65 | 16 | 0.38 | 0.47 | 104 | 0.3 | 0.59 | 14 | 0.24 | 0.46 | 120 | 0.45 | 0.75 | 16 | 0.3 | 0.46 | 145 |
| FCI | 0.43 | 0.63 | 19 | 0.33 | 0.48 | 115 | 0.36 | 0.59 | 16 | 0.3 | 0.46 | 137 | 0.5 | 0.76 | 16 | 0.31 | 0.47 | 144 |
| Granger | 0.46 | 0.6 | 26 | 0.18 | 0.23 | 463 | 0.1 | 0.21 | 19 | 0.19 | 0.42 | 86 | 0.44 | 0.62 | 28 | 0.13 | 0.22 | 650 |
| ICALiNGAM | 0.18 | 0.66 | 28 | 0.08 | 0.35 | 283 | 0.19 | 0.46 | 14 | 0.19 | 0.42 | 86 | 0.22 | 0.72 | 20 | 0.09 | 0.36 | 281 |
| DirectLiNGAM | 0.4 | 0.66 | 22 | 0.22 | 0.37 | 249 | 0.19 | 0.45 | 14 | 0.2 | 0.42 | 86 | 0.54 | 0.76 | 13 | 0.21 | 0.36 | 263 |
| GES | 0.42 | 0.66 | 20 | 0.34 | 0.44 | 160 | 0.23 | 0.32 | 15 | 0.23 | 0.32 | 92 | 0.47 | 0.67 | 18 | 0.22 | 0.41 | 205 |
| fGES | 0.3 | 0.67 | 22 | 0.18 | 0.44 | 165 | 0.25 | 0.32 | 15 | 0.24 | 0.31 | 92 | 0.36 | 0.76 | 19 | 0.23 | 0.41 | 195 |
| PCMCI | 0.12 | 0.18 | 32 | 0.04 | 0.07 | 986 | 0.22 | 0.38 | 44 | 0.06 | 0.11 | 1223 | 0.16 | 0.25 | 35 | 0.06 | 0.11 | 1101 |
| NTLR | 0.32 | 0.52 | 21 | 0.14 | 0.27 | 131 | 0.19 | 0.34 | 20 | - | - | - | 0.43 | 0.66 | 25 | 0.06 | 0.11 | 570 |
| CIRCA10 | CIRCA50 | RCD10 | RCD50 | CausIL10 | CausIL50 | |||||||||||||
|---|---|---|---|---|---|---|---|---|---|---|---|---|---|---|---|---|---|---|
| F1 | F1-S | SHD | F1 | F1-S | SHD | F1 | F1-S | SHD | F1 | F1-S | SHD | F1 | F1-S | SHD | F1 | F1-S | SHD | |
| PC | 0.5 | 0.66 | 17 | 0.31 | 0.36 | 170 | 0.31 | 0.64 | 21 | - | - | - | 0.47 | 0.76 | 17 | 0.22 | 0.38 | 192 |
| FCI | 0.42 | 0.65 | 20 | 0.28 | 0.43 | 143 | 0.49 | 0.87 | 15 | - | - | - | 0.53 | 0.78 | 16 | 0.25 | 0.42 | 177 |
| Granger | 0.38 | 0.58 | 32 | 0.1 | 0.16 | 829 | 0.25 | 0.45 | 30 | 0.07 | 0.14 | 780 | 0.45 | 0.68 | 27 | 0.18 | 0.44 | 165 |
| ICALiNGAM | 0.18 | 0.66 | 28 | 0.08 | 0.35 | 282 | 0.19 | 0.47 | 14 | 0.19 | 0.42 | 86 | 0.21 | 0.72 | 20 | 0.1 | 0.37 | 255 |
| fGES | 0.31 | 0.66 | 22 | 0.18 | 0.44 | 164 | 0.31 | 0.39 | 15 | 0.24 | 0.31 | 92 | 0.34 | 0.77 | 19 | 0.23 | 0.41 | 192 |
| PCMCI | 0.12 | 0.18 | 32 | 0.04 | 0.07 | 925 | 0.22 | 0.38 | 44 | 0.05 | 0.1 | 1225 | 0.16 | 0.25 | 35 | 0.06 | 0.11 | 1119 |
(*) PC and FCI results on the RCD50 dataset were not obtained due to OOM errors during execution. GES, DirectLiNGAM, and NTLR were excluded for exceeding a 1-hour/case time-out.
The performance of causal graph construction directly impacts the performance of causal inference-based RCA methods, yet previous works have overlooked this evaluation (Xin et al., 2023; Ikram et al., 2022; Lin et al., 2018; Chen et al., 2014; Meng et al., 2020; Wang et al., 2018). In this section, we evaluate a comprehensive list of common causal discovery methods: Granger, PC, PCMCI, FCI, DirectLiNGAM, ICALiNGAM, GES, fGES, and NTLR on six synthetic datasets: CIRCA10, RCD10, CausIL10, CIRCA50, RCD50, and CausIL50, to understand their effectiveness. All experiments are repeated 10 times, and we report the average of F1, F1-S, and SHD scores.
In Table 3, we present the performance of these methods using the default hyperparameters. We have the following findings:
(1) PC and FCI yield the best performance. PC achieves the best score in 7 out of 18 cases, and FCI in 9 cases.
(2) All methods struggle with estimating edge directions with Granger, NTLR, LiNGAM/GES-based methods being especially bad at identifying the edge directions. The F1 scores of all methods are systematically lower than their F1-S scores. This reveals that we need to consider the capacity of causal discovery methods in estimating the edge directions when developing causal inference-based RCA methods for microservices in future work.
(3) The performance of all methods decrease significantly when the graph size increases. This highlights that directly applying common causal discovery methods for RCA may be ineffective in large-scale microservice systems.
(4) There is still ample room for improvement in developing methods to construct a causal graph from metrics data. The F1 scores of all methods are only within the range from 0.1 to 0.54, which are far from being ideal (the highest possible score is 1).
Furthermore, we also evaluate the studied methods under hyperparameter tuning setting using the Bayesian Information Criterion score (Schwarz, 1978; Biza et al., 2020), as described in our supplementary material, Sec. C. The experimental results are presented in Table 4. We observe that:
(5) Hyperparameter tuning could improve the construction results of smaller graphs. The performance of causal discovery methods with tuned hyperparameters on CIRCA10, RCD10, and CausIL10 is mostly better than when using default values.
(6) Hyperparameter tuning does not perform well on larger graphs. In CIRCA50, the tuned PC and FCI drop 23% and 10% respectively compared to the default settings. This issue could be due to the complexity of large graphs, which causes challenges for the hyperparameter tuning method to find optimal hyperparameter values. More work needs to be done to improve the effectiveness of these methods for large and complex graphs.
4.2. How Effective are Causal Inference-based RCA Methods in Locating Root Causes?
In this section, we extensively evaluate if state-of-the-art causal inference-based RCA methods can accurately identify the root causes of microservice system failures. The methods we evaluate are: PC-based, FCI-based, Granger-based, LiNGAM-based, fGES-based, NTLR-based, CausalRCA, MicroCause, CIRCA, RCD, NSigma, -Diagnosis, BARO, CausalAI, and RUN. For the PC / FCI / Granger / fGES / LiNGAM / NTLR-based methods, we use either the popular PageRank or random walk scoring method to locate the root cause from the causal graphs. To assess whether these RCA methods perform better than random, we also include Dummy, a method that randomly chooses a node within the causal graph as the root cause. We thoroughly evaluate these methods using four synthetic datasets (RCD10, RCD50, CIRCA10, CIRCA50) and four datasets collected from three benchmark systems (Online Boutique, Sock Shop 1 & 2, and Train Ticket), each with various types of failures. All experiments are repeated 10 times, and average results are reported.
Notably, CIRCA, RCD, NSigma, and -Diagnosis require knowing the exact failure occurrence time , which may not be practical as, in practice, this information is often unavailable. Meanwhile, BARO uses a customised anomaly detection technique to estimate the time ; however, this estimate may not always be accurate. To better understand the performance of these RCA methods, we include the experiments when we misspecify the failure occurrence time . We experiment with the following variants of the RCA methods: RCD [], CIRCA [], NSigma [], -Diagnosis [], BARO [] given the perfect ; and RCD [], CIRCA [], NSigma [], -Diagnosis [], BARO [] given the specified time to be + 60 seconds. The choice of setting to be 60 seconds is inspired by a previous RCA work that uses one-minute sampling intervals (Li et al., 2022a), meaning that the monitoring system collects time series metrics data every 60 seconds.
In Table 5, we report the overall performance of all methods in Avg@5. Our major findings are as follows:
(1) CausalRCA, RCD, CIRCA, NSigma, and BARO are generally better than other baselines in identifying root causes of microservice systems’ failures. Meanwhile, PC / FCI / Granger / LiNGAM / fGES / NTLR-PageRank/random walk, CausalAI, RUN, and MicroCause mostly perform similarly to Dummy, meaning they are no better or only slightly better than random selection in identifying the root cause of the datasets and benchmark systems used in our study. To the best of our knowledge, we are the first to use Dummy as a baseline and discover this problem. Examining reported results in previous works (Ikram et al., 2022; Xin et al., 2023; Wu et al., 2021a) yields the same conclusion regarding the effectiveness of the PC / FCI / Granger / LiNGAM / fGES / NTLR-PageRank/random walk approach. This insight again emphasizes that directly applying these causal discovery methods for RCA in microservice systems may not be effective.
(2) CIRCA and NSigma are sensitive to the specification of the failure occurrence time, especially for large systems like Train Ticket, whilst RCD, -Diagnosis, and BARO are more robust to this time. While previous works assume the availability of this information when performing RCA on microservice systems, this finding suggests that the estimated failure occurrence time might significantly affect the robustness of interventional recognition-based RCA methods, an aspect that is overlooked in previous works (Ikram et al., 2022; Li et al., 2022a). This finding also implies that future work should evaluate these RCA methods with different anomaly detectors.
| RCD10 | RCD50 | CIRCA10 | CIRCA50 | Online Boutique | Sock Shop 1 | Sock Shop 2 | Train Ticket | ||||||||||||||
| SIM | SIM | SIM | SIM | CPU | MEM | DISK | DELAY | LOSS | CPU | MEM | CPU | MEM | DISK | DELAY | LOSS | CPU | MEM | DISK | DELAY | LOSS | |
| Dummy | 0.3 | 0.06 | 0.3 | 0.06 | 0.25 | 0.24 | 0.26 | 0.26 | 0.25 | 0.36 | 0.33 | 0.37 | 0.38 | 0.33 | 0.38 | 0.37 | 0.07 | 0.08 | 0.06 | 0.07 | 0.07 |
| PC-PR | 0.24 | 0.11 | 0.25 | 0.07 | 0.34 | 0.15 | 0.32 | 0.33 | 0.38 | 0.38 | 0.27 | 0.46 | 0.47 | 0.4 | 0.22 | 0.42 | 0.07 | 0.15 | 0.09 | 0.10 | 0.07 |
| PC-RW | 0.13 | 0 | 0.31 | 0.01 | 0.34 | 0.31 | 0.39 | 0.18 | 0.32 | 0.44 | 0.44 | 0.48 | 0.46 | 0.49 | 0.45 | 0.36 | 0.16 | 0.05 | 0.11 | 0.03 | 0.09 |
| FCI-PR | 0.29 | 0.09 | 0.31 | 0.06 | 0.22 | 0.22 | 0.38 | 0.29 | 0.4 | 0.44 | 0.2 | 0.39 | 0.44 | 0.55 | 0.26 | 0.42 | 0 | 0.06 | 0.22 | 0.13 | 0.12 |
| FCI-RW | 0.1 | 0.04 | 0.31 | 0.04 | 0.56 | 0.56 | 0.56 | 0.36 | 0.36 | 0.32 | 0.32 | 0.48 | 0.48 | 0.48 | 0.48 | 0.48 | 0 | 0 | 0 | 0 | 0 |
| Granger-PR | 0.31 | 0.06 | 0.4 | 0.06 | 0.22 | 0.45 | 0.41 | 0.31 | 0.25 | 0.34 | 0.31 | 0.46 | 0.81 | 0.58 | 0.38 | 0.38 | 0.04 | 0.04 | 0.14 | 0.04 | 0.04 |
| Granger-RW | 0.23 | 0 | 0.3 | 0.01 | 0.34 | 0.31 | 0.34 | 0.14 | 0.2 | 0.56 | 0.54 | 0.48 | 0.46 | 0.49 | 0.45 | 0.36 | 0.16 | 0.05 | 0.11 | 0.02 | 0.13 |
| ICALiNGAM-PR | 0.17 | 0.01 | 0.26 | 0.02 | 0.22 | 0.08 | 0.09 | 0.12 | 0.3 | 0.31 | 0.26 | 0.06 | 0.01 | 0.01 | 0.00 | 0.18 | 0.03 | 0 | 0.16 | 0.03 | 0 |
| ICALiNGAM-RW | 0.13 | 0 | 0.31 | 0.01 | 0.4 | 0.37 | 0.34 | 0.14 | 0.2 | 0.56 | 0.54 | 0.48 | 0.46 | 0.49 | 0.45 | 0.36 | 0.16 | 0.05 | 0.11 | 0.03 | 0.13 |
| fGES-PR | 0.15 | 0.02 | 0.39 | 0.04 | 0.26 | 0.27 | 0.28 | 0.26 | 0.26 | 0.27 | 0.33 | 0.26 | 0.21 | 0.37 | 0.33 | 0.40 | 0.06 | 0.04 | 0.11 | 0.05 | 0.06 |
| fGES-RW | 0.13 | 0 | 0.31 | 0.01 | 0.4 | 0.38 | 0.34 | 0.14 | 0.22 | 0.36 | 0.38 | 0.48 | 0.46 | 0.49 | 0.45 | 0.36 | 0.16 | 0.05 | 0.04 | 0.03 | 0.13 |
| NTLR-PR | 0.26 | 0.04 | 0.19 | 0.01 | 0.2 | 0.1 | 0.22 | 0.1 | 0.42 | 0.25 | 0.25 | 0.08 | 0.05 | 0.04 | 0.03 | 0.11 | - | - | - | - | - |
| NTLR-RW | 0.14 | 0.05 | 0.3 | 0.02 | 0.34 | 0.31 | 0.34 | 0.14 | 0.2 | 0.56 | 0.54 | 0.48 | 0.46 | 0.49 | 0.45 | 0.36 | - | - | - | - | - |
| CausalRCA | 0.1 | 0.04 | 0.05 | 0 | 0.97 | 0.98 | 0.71 | 0.92 | 0.52 | 0.84 | 0.84 | 0.49 | 0.82 | 0.74 | 0.61 | 0.47 | 0.53 | 0.3 | 0.13 | 0.17 | 0.11 |
| CausalAI | 0.08 | 0.06 | 0 | 0 | 0.62 | 0.30 | 0.45 | 0.18 | 0.24 | 0.42 | 0.42 | 0.38 | 0.18 | 0.14 | 0.41 | 0.51 | 0 | 0 | 0.04 | 0.07 | 0.06 |
| RUN | 0.1 | - | 0.3 | - | 0.57 | 0.56 | 0.60 | 0.35 | 0.33 | 0.48 | 0.42 | 0.46 | 0.47 | 0.48 | 0.33 | 0.48 | - | - | - | - | - |
| MicroCause | 0.13 | 0.04 | 0.37 | 0.09 | 0.34 | 0.45 | 0.37 | 0.57 | 0.42 | 0.4 | 0.55 | 0.47 | 0.43 | 0.33 | 0.22 | 0.46 | - | - | - | - | - |
| -Diagnosis [] | 0 | 0 | 0 | 0 | 0.23 | 0.03 | 0.12 | 0.16 | 0.16 | 0.5 | 0.66 | 0.51 | 0.38 | 0.49 | 0.46 | 0.46 | 0 | 0 | 0 | 0 | 0 |
| BARO [] | 0.18 | 0.03 | 0.24 | 0.04 | 0.94 | 0.99 | 0.87 | 0.99 | 0.6 | 0.98 | 0.98 | 0.99 | 0.98 | 0.94 | 1 | 0.88 | 0.81 | 0.99 | 0.77 | 0.82 | 0.72 |
| RCD [] | 0.48 | 0.21 | 0.18 | 0.03 | 0.74 | 0.59 | 0.67 | 0.67 | 0.5 | 0.43 | 0.67 | 0.43 | 0.35 | 0.63 | 0.5 | 0.44 | 0.11 | 0.09 | 0.1 | 0.12 | 0.19 |
| CIRCA [] | 0.19 | 0.09 | 0.19 | 0.03 | 0.24 | 0.36 | 0.4 | 0.58 | 0.39 | 0.52 | 0.62 | 0.19 | 0.16 | 0.37 | 0.26 | 0.39 | 0 | 0 | 0.07 | 0.03 | 0.1 |
| NSigma [] | 0.23 | 0.03 | 0.05 | 0 | 0.16 | 0.24 | 0.43 | 0.55 | 0.38 | 0.15 | 0.33 | 0.27 | 0.22 | 0.23 | 0.37 | 0.5 | 0.03 | 0 | 0.03 | 0.05 | 0.12 |
| -Diagnosis [] | 0 | 0 | 0 | 0 | 0.26 | 0.02 | 0.22 | 0.12 | 0.13 | 0.5 | 0.55 | 0.49 | 0.34 | 0.49 | 0.51 | 0.5 | 0 | 0.02 | 0 | 0 | 0.02 |
| BARO [] | 0.22 | 0.05 | 0.92 | 0.87 | 0.97 | 1 | 0.91 | 0.98 | 0.67 | 0.99 | 0.99 | 1 | 0.98 | 0.94 | 0.98 | 0.87 | 0.90 | 0.96 | 0.84 | 0.77 | 0.66 |
| RCD [] | 0.89 | 0.62 | 0.28 | 0.05 | 0.91 | 0.74 | 0.67 | 0.38 | 0.47 | 0.63 | 0.66 | 0.62 | 0.46 | 0.62 | 0.48 | 0.37 | 0.08 | 0.01 | 0.31 | 0.09 | 0.12 |
| CIRCA [] | 0.34 | 0.08 | 0.34 | 0.06 | 0.94 | 0.97 | 0.7 | 0.92 | 0.55 | 0.7 | 0.8 | 0.97 | 0.98 | 0.92 | 0.98 | 0.88 | 0.66 | 0.93 | 0.64 | 0.64 | 0.57 |
| NSigma [] | 0.21 | 0.06 | 0.88 | 0.85 | 0.94 | 1 | 0.9 | 0.98 | 0.67 | 0.98 | 0.99 | 0.98 | 0.98 | 0.94 | 0.98 | 0.9 | 0.81 | 0.96 | 0.85 | 0.61 | 0.7 |
(*) ’RW’ stands for ’random walk’, ’PR’ stands for ’PageRank’. (-) MicroCause, RUN, and NTLR-based RCA have missing results because they exceed the limit of 2 hours per case.
(3) The performance of RCA methods on synthetic datasets may not accurately reflect their performance in real systems. For example, RCD performs well on its synthetic and other datasets but poorly on CIRCA datasets. NSigma and BARO performs well on CIRCA synthetic datasets and other datasets but poorly on RCD synthetic datasets. Likewise, CausalRCA performs well on Online Boutique, Sock Shop 1 & 2, but badly on synthetic datasets. These findings suggest the generation of synthetic datasets may not be consistent across different works and may not accurately represent metrics data of microservices. For example, RCD data generator introduces faults by altering the conditional probability of a node whereas real-world anomalies are often characterized by surges in metrics such as high CPU usage, workload drops (Lee et al., 2023; Soldani and Brogi, 2022). It is thus important to reconsider the process of generating synthetic data when developing and evaluating RCA methods in future work.
4.3. How Efficient are Causal Discovery and Causal Inference-based RCA Methods?
To promptly detect and troubleshoot failures so as to ensure minimal system downtime, it is crucial to develop efficient and effective RCA methods. In this section, we conduct an efficiency analysis of the studied causal discovery and RCA methods using all the available datasets. We record the running time per case of all methods on Linux machines, each with 8 CPU and 16GB memory.
4.3.1. Causal Graph Construction
To evaluate the efficiency of causal discovery methods, we report the runtimes of nine representative methods on six synthetic datasets. Due to space constraints, detailed experimental results are provided in our supplementary material, Table S1. Our findings are:
(1) The runtime of all causal discovery methods increases significantly with the graph complexity. When the size of causal graphs increases from 10 to 50 nodes, these methods become seven to thousands of times slower, taking up to hours to build a causal graph. This observation complements our finding in Section 4.1 that the causal discovery algorithms is neither effective nor efficient on large microservice systems, presenting a challenge of how to select appropriate input metrics for effective RCA in such systems.
(2) The runtime of kernel-based conditional independence testing (PC with KCI (Wu, 2022), Kernel-based DirectLiNGAM) is prohibitively long. Running PC with the KCI independence test as described in (Wu, 2022) takes an average of over 1 hour/case to estimate a 10-node graph by CIRCA and RCD synthetic data generators. We can see that there is a large room for improvement in efficiency if one wants to employ a causal discovery algorithm in their RCA method for diagnosising failures of microservice systems.
4.3.2. Root Cause Analysis
To evaluate the efficiency of RCA methods, in Table 6, we provide the running time of twenty-one RCA methods on synthetic and microservices datasets. We found that:
(1) NSigma and BARO are consistently faster, followed by RCD whilst CausalRCA, MicroCause, RUN, and NTLR-based methods tend to be the slowest. Based on our observations, NSigma and BARO have a small running time since they do not learn any causal graph, instead, they just compare the normal and abnormal metrics data. RCD also runs fast since it performs hierarchical learning and thus only needs to learn small causal graphs from subsets of metrics data while most other RCA methods learn full causal graphs from all metrics data. CausalRCA, MicroCause, RUN, and NTLR-based methods are significantly slower than others, due to their reliance on advanced causal discovery algorithms like DAG-GNN, PCMCI, NGCD, and NTLR.
(2) The running time of most RCA methods increases significantly with the complexity of microservice systems. Most causal inference-based RCA methods can handle Sock Shop (38-46 metrics) and Online Boutique (49 metrics) within seconds. However, Train Ticket (212 metrics) causes the methods to be much slower; the running time of the methods are from few minutes to one hour.
(3) The running time of PC / FCI / Granger / LiNGAM / GES / NTLR-based RCA methods is proportional to the runtime of their corresponding causal discovery methods (Table S1, supplementary material). Among these RCA methods, the PC-based methods are generally the fastest and NTLR-based methods are the slowest. This is similar to the behaviours of their corresponding causal discovery methods: PC is the fastest and NTLR is the slowest. This shows that for these RCA methods, their running time depends greatly on the running time of the causal graph construction step.
4.4. How do Different Methods Perform with Different Input Data Lengths?
In this section, we assess whether the performance of causal discovery and causal inference-based RCA methods depend on the input data length. This evaluation is to address the question that once a failure is detected, whether we can run the RCA methods immediately and thus use a smaller amount of input data or wait to collect more data so as to increase the accuracy of the RCA methods. For the causal discovery methods, we evaluate their performance with the input data lengths varying from 125 to 4000 data points, corresponding to approximately 2 to 60 minutes of metrics data. For the causal inference-based RCA methods, we evaluate with the input data lengths varying from 60 to 600 data points, corresponding to 1 to 10 minutes of metrics data. It is worth noting that prior works on RCA only evaluate the methods using a smaller number of data points. For example, the works in (Wu, 2022) and (Xin et al., 2023) use only 60 data points, while the work in (Ikram et al., 2022) uses from 535 to 593 data points. All experiments are repeated five times, and we report the average results. Note here we only repeat the experiments 5 times instead of 10 due to the prohibitive running time of this task, i.e., it takes over 400 hours on 8 CPU and 16GB RAM machines for each repeat, making it prohibitive to run with 10 repeats.
| CIRCA10 | RCD10 | CIRCA50 | RCD50 | SS1 | SS2 | OB | TT | |
|---|---|---|---|---|---|---|---|---|
| PC-PR | 0.18 | 0.05 | 1.78 | 0.39 | 1.53 | 2.16 | 3.39 | 129.65 |
| PC-RW | 0.17 | 0.05 | 1.77 | 0.39 | 1.63 | 2.24 | 3.53 | 131.27 |
| FCI-PR | 0.19 | 0.04 | 1.85 | 0.37 | 2.62 | 2.52 | 4.9 | 154.95 |
| FCI-RW | 0.21 | 0.06 | 1.93 | 0.38 | 2.62 | 2.51 | 5.21 | 152.59 |
| Granger-PR | 1.05 | 1.3 | 36.32 | 27.55 | 5.72 | 13.28 | 12.9 | 196.3 |
| Granger-RW | 0.98 | 1.25 | 35.67 | 25.92 | 5.62 | 13.21 | 13.53 | 245.4 |
| ICA-PR | 0.47 | 0.07 | 6.68 | 6.07 | 0.51 | 2.76 | 1.51 | 16.07 |
| ICA-RW | 0.44 | 0.07 | 6.11 | 5.60 | 0.53 | 2.77 | 1.55 | 16.39 |
| fGES-PR | 0.63 | 0.16 | 10.76 | 2.04 | 7.36 | 5.40 | 11.49 | 372.8 |
| fGES-RW | 0.63 | 0.17 | 10.73 | 2.06 | 7.31 | 5.46 | 11.47 | 381.12 |
| NTLR-PR | 12.97 | 39.71 | 663.07 | 6179.77 | 487.88 | 471.11 | 448.94 | - |
| NTLR-RW | 12.7 | 39.26 | 672.11 | 6181.34 | 454.18 | 462.36 | 437.16 | - |
| CausalRCA | 53.79 | 51.3 | 197.6 | 165.89 | 79.33 | 143.97 | 146.67 | 1326.34 |
| CausalAI | 0.12 | 0.13 | 6.49 | 1.12 | 7.86 | 17.7 | 16.37 | 643.29 |
| RUN | 1078.65 | 1095 | - | - | 2051.12 | 4938.75 | 1548.28 | - |
| MicroCause | 27.6 | 24.69 | 1900.77 | 1430.89 | 75.78 | 206.64 | 257.73 | - |
| -Diagnosis | 1 | 1 | 6.3 | 6.62 | 3.54 | 5.42 | 5.28 | 21.92 |
| RCD | 0.1 | 0.06 | 0.37 | 0.13 | 2.1 | 3.08 | 3.05 | 12.44 |
| CIRCA | 0.18 | 0.06 | 2.01 | 0.35 | 1.76 | 7 | 4.19 | 3792.29 |
| NSigma | 0.01 | 0.01 | 0.01 | 0.01 | 0.01 | 0.01 | 0.01 | 0.01 |
| BARO | 0.01 | 0.01 | 0.01 | 0.01 | 0.01 | 0.01 | 0.01 | 0.01 |
(*) SS1, SS2, OB, TT denote Sock Shop 1, Sock Shop 2, Online Boutique, Train Ticket.
4.4.1. Graph Construction
We plot the performance of seven causal discovery methods (PC, FCI, Granger, ICALiNGAM, PCMCI, fGES, NTLR) on six synthetic datasets. Due to the space limit, we put this plot in our supplementary material, Fig. S2. Our observations are:
(1) For most datasets, most methods (PC, FCI, ICALiNGAM, fGES) improve their accuracy when being given more input data. For example, on RCD10, the F1 score of FCI increases from 0.25 to 0.5 when the input data length increases from 125 to 4000.
(2) The accuracy of Granger and NTLR appears to plateau with increasing input metrics data whilst PCMCI’s accuracy experiences a downward trend. In all datasets, both Granger and NTLR maintain similar F1, F1-S, and SHD scores across all the input data lengths whilst the F1, F1-S, and SHD of PCMCI often decline with more input data.
(3) On CausIL50 dataset, increasing the input data length does not significantly affect the performance of the causal discovery methods. Most causal discovery methods maintain similar F1, F1-S, and SHD scores when the input metrics data length increases from 125 to 4000.
4.4.2. Root Cause Analysis
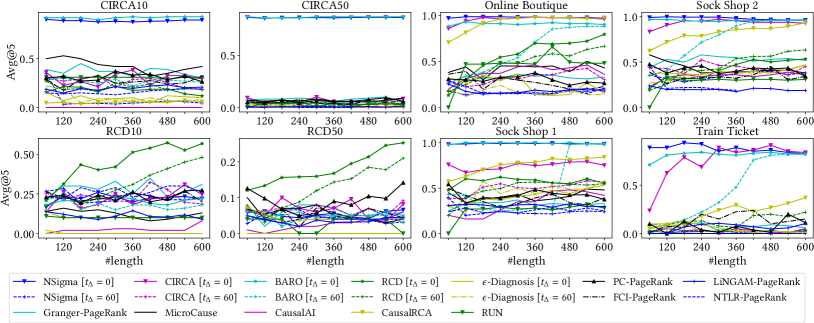
We plot the performance of studied RCA methods on eight different datasets with varying input data lengths in Fig. 3. Our major findings are:
(1) With an accurate specification of the failure occurrence time, NSigma, BARO, and CIRCA perform notably well even with less input metrics data. However, as we emphasized in Section 4.2, their performance drops significantly if there is a misspecification of the failure occurrence time. Notably, increasing the input data lengths, in this case, does not help NSigma and CIRCA, but can help BARO to significantly alleviate the performance degradation. The robustness of BARO in this context can be attributed to its use of median and IQR for hypothesis testing instead of mean and standard deviation as in NSigma and CIRCA.
(2) RCD shows remarkable improvements with increased input data lengths. For example, in Online Boutique, the Avg@5 score of RCD [] increases from 0.13 to 0.79 when increasing the data length from 60 to 600 data points. This property could be attributed to its usage of -PC (Jaber et al., 2020; Spirtes et al., 1993), a novel algorithm that learns a causal graph based on normal data and soft-abnormal data.
(3) CausalRCA steadily improves performance when the input data length increases in majority of datasets. For instance, in Sock Shop 1, its Avg@5 score increases from 0.62 to 0.93 with increased input data length from 120 to 600 data points. One possible reason is that it relies on a deep learning model which typically achieves better performance with more input data.
Based on these findings (1), (2), and (3), we can see that increasing the data length usually leads to improved performance of RCD, CIRCA, and CausalRCA methods. However, this improvement could come with a trade-off that the root cause may not be promptly identified as it generally takes time to collect more abnormal data.
(4) PC / FCI / Granger / LiNGAM / NTLR-PageRank, RUN, MicroCause, -Diagnosiss, and CausalAI do not perform well on the studied datasets and adjusting the input data length does not significantly affect their performance. Their performance is consistently low across all datasets and having more metrics data does not seem to help.
5. Discussion
5.1. The Advantages and Disadvantages of the Studied RCA Methods
Based on our findings, we can conclude that the existing causal inference-based RCA methods for microservice systems need further improvements to work well in practice. We point out the advantages and disadvantages of each method as follows.
PC/FCI/Granger/LiNGAM/NTLR-based, RUN, CausalAI, and MicroCause. These methods learn a complete causal graph from all the metrics data. With default hyperparameter settings, their performance is not consistent across different datasets; hyperparameter tuning may help to ensure good performance on small-scale microservice systems, but does not help much with large-scale microservice systems. Finally, for the datasets and microservice benchmark systems used in our studies (10 to 212 nodes), the performance of these methods is no better or only slightly better than random selection. This issue might arise from their poor performance in the causal graph construction, as indicated by our findings in Section 4.1.
CIRCA. CIRCA relies on a user-constructed causal graph, demanding knowledge about microservice structure and metrics, rather than using causal discovery methods. It employs a hypothesis testing scoring method that requires precise failure occurrence time specification for optimal accuracy. However, CIRCA is highly sensitive to this value; it performs much worse when this value deviates slightly, e.g., 1 minute. Another drawback of CIRCA is that it requires the call graph of microservices and manual work in mapping the metrics to construct the causal graph. This leads to difficulties in the adoption of this technique in real-world microservice systems, given their inherent dynamic nature. Though note that using the PC algorithm to construct the causal graph can still result in a reasonable performance of the algorithm even though it may come with some efficiency trade-offs, particularly in large-scale microservices.
RCD. The main advantage of RCD is that it does not learn a complete causal graph from all the metrics, but it employs a divide-and-conquer strategy to learn smaller causal graphs from metrics subsets. This approach makes it highly efficient, especially on large-scale microservices, i.e., its running time is significantly lower than a majority of RCA methods. A drawback of RCD is that it requires a sufficient amount of metrics data to perform well. In practice, this could lead to delays in troubleshooting the failures of microservice systems as it takes time to collect the abnormal/failure data.
NSigma. NSigma also requires the specification of the failure occurrence time. Similar to CIRCA, its performance is also significantly sensitive to this value. Given an accurate specification of the failure occurrence time, NSigma can achieve very high accuracy. However, with a slight deviation of the failure occurrence time, e.g., 1 minute, its performance significantly worsens. Another advantage of NSigma is that its runtime is very small, making it the fastest method among our studied RCA methods, even on large-scale microservices.
BARO. BARO can achieve very high accuracy and offer better resistance to the specified failure occurrence time when given enough metrics data. This robustness stems from the use of median-based hypothesis testing. Similar to NSigma, an advantage of BARO is that its runtime is very small, making it one of the fastest methods among our studied RCA methods.
CausalRCA. An advantage of CausalRCA is that it does not require the specification of a failure occurrence time in order to diagnose the root cause. By using DAG-GNN, a gradient-based causal discovery method, it can diagnose the root cause better than other methods that use PC or FCI. However, due to this characteristic, CausalRCA is less efficient than other methods. Its running time is much higher compared to other RCA methods, especially on large-scale microservices with many metrics (¿200).
5.2. Future Research Directions
We identify several challenges of causal inference-based RCA methods in the context of microservices. We outline these challenges in this section and propose possible future research work:
(1) Working with Large-scale Microservice Systems. Our findings show that most causal discovery methods (to construct the causal graphs) and RCA methods (to identify the failure’s root cause) perform well on a small set (¡50 metrics) of metrics data and perform badly on a larger set (¿200 metrics). Hence, selecting an optimal subset of metrics (Thalheim et al., 2017), implementing divide-and-conquer strategies (Ikram et al., 2022), or adding blocked edge sets as domain knowledge (Chakraborty et al., 2023) may help to reduce the need to construct a full causal graph from all the metrics data, and thus, improve the performance of root cause identification. Additionally, using call graphs (Li et al., 2022a) or hand-crafted graphs from engineers (Li et al., 2022b) may also benefit causal inference-based RCA methods, albeit at a higher cost and risk of error (Li et al., 2022b; Chen et al., 2020).
(2) Efficiency of the RCA Methods. Existing works mainly focus on demonstrating the accuracy of the RCA methods without evaluating their efficiency (the running time). Our study suggests that the running time of some RCA methods could be very long, especially when dealing with large-scale microservice systems, and this can lead to a delay in the troubleshooting of the failure. Future research work could aim to develop RCA techniques that can achieve high accuracy whilst maintaining a reasonable running time.
(3) Sensitiveness to the Failure Occurrence Time. Our study reveals that some RCA methods (Ikram et al., 2022; Li et al., 2022a) are sensitive to the failure occurrence time with varying degrees, especially in larger microservice systems. Future works should extensively evaluate RCA methods within integrated anomaly detection and RCA pipelines. Such evaluations can provide valuable insights into the actual effectiveness of these methods with actual anomaly detectors.
(4) Using a Variety of Datasets from Different Microservice Systems. Our findings indicate the importance of using multiple different datasets and microservice benchmark systems to evaluate causal inference-based RCA methods comprehensively. High performance on one dataset or microservice system does not necessarily reflect high performance on other datasets/systems, as various factors, such as the number of services, metrics, and their inherent dynamic relationships, can significantly affect the RCA performance.
(5) Synthetic Dataset Generation. Since it is not always possible to deploy real microservice systems and simulate a variety of failure scenarios, it is beneficial for the research community to develop methods to generate synthetic data that closely mimics the behaviour of microservice systems. Our results suggest that synthetic datasets used in previous work may not accurately reflect the performance of RCA methods in the real world. Better methods for generating synthetic data are needed to enhance the development of future causal inference-based RCA methods for microservice systems.
(6) Systematic Hyperparameter Tuning. In this work, we perform a hyperparameter tuning process via the BIC score (Schwarz, 1978; Biza et al., 2020) and evaluate the performance of common causal discovery methods. Previous works usually choose these hyperparameters empirically, and these chosen values might not be the most optimal choice to achieve the maximal performance. Therefore, future work can also develop more advanced hyperparameter tuning approaches to improve the performance of causal inference-based RCA methods.
(7) Develop End-to-end Anomaly Detection and RCA. Future research in RCA for microservices should consider developing more accurate anomaly detection modules. The performance of the RCA pipeline, when considered as a unified system, should be thoroughly evaluated. This approach would eliminate the need for provided information like the failure occurrence time (Li et al., 2022a; Ikram et al., 2022; Pham et al., 2024).
5.3. Threats to Validity
We now discuss threats to the validity of our study, along with the means we undertook to mitigate these threats.
5.3.1. Construct Validity
The construct validity threat of our evaluation primarily concerns the hyperparameter setting and the evaluation metrics. To address this, we conduct a hyperparameter tuning for studied causal discovery methods. For the studied RCA methods, we use the default values suggested in their papers. We also employ well-established evaluation metrics used in previous works (Lin et al., 2018; Ikram et al., 2022; Xin et al., 2023; Meng et al., 2020; Yu et al., 2021; Li et al., 2022a) to compare the performance of causal discovery and RCA methods.
5.3.2. Internal Validity
Regarding the studied methods, we re-use the code from various published RCA works, and we have also performed experiments to replicate the results of these source codes to ensure their correctness. To increase the internal validity of our experiment results and avoid the randomness factors in the causal discovery and RCA methods, we repeat the experiments multiple times for each dataset and method and report the average results. We use standard evaluation metrics extensively used in the literature to evaluate the performance of causal graphs and RCA methods. There may be other threats related to the underlying tools, our extracted data, that we have not considered here. To enable exploration of these potential threats and to facilitate replication and extension of our work, we make available our tools and data.
5.3.3. External Validity
We evaluate the methods using various synthetic datasets and benchmark systems, along with four common faults. These systems and faults are used in multiple published works on RCA with different characteristics and domains. We acknowledge that different software applications and faults could have different properties and failure propagation mechanisms, which could impact the conclusions in this paper. However, we believe that the datasets and systems we use are representative since they have been used in many previous studies (Lin et al., 2018; Ikram et al., 2022; Wu et al., 2021a; Xin et al., 2023; Wu, 2022; He et al., 2022; Li et al., 2021; Yu et al., 2021; Zhou et al., 2018; Wang et al., 2021) and could help us to derive various important insights for causal inference-based RCA methods for microservice systems.
5.3.4. Conclusion Validity
The conclusion validity threat of our evaluation is related to the fault types used in our experiments. Microservice systems can experience different faults that affect the RCA results. To address this, we use five different fault types in our study (CPU, MEM, DISK, DELAY, and LOSS), covering a wide range of different failure scenarios in microservice systems. This allows us to properly evaluate the performance of the studied RCA methods. This is a signifcant improvement over previous works, which typically involved only 2-3 fault types (Ikram et al., 2022; Xin et al., 2023; Wu et al., 2021a; Lee et al., 2023).
6. Related work
Studying causal inference-based RCA methods and evaluating their performance are important research topics. The work described in (Soldani and Brogi, 2022) conducts a comprehensive survey on anomaly detection and RCA methods for (micro) service-based cloud systems. The studied methods include both causal inference-based and other methods. This survey, however, does not include any evaluation of the RCA methods. The works in (Arya et al., 2021) and (Wang et al., 2021) evaluate Granger algorithms for AIOps on the Train Ticket microservice system using time series data constructed from logs. Our work, on the other hand, evaluates a wide range of causal discovery and causal inference-based RCA methods on various synthetic datasets and microservice systems.
The work described in (Wu et al., 2021b) evaluates six popular causal discovery methods and combines them with PageRank to identify the root causes from metrics data. These methods are evaluated using the Sock Shop and Train Ticket systems. This work, however, does not evaluate the effectiveness of the constructed causal graph, the scoring methods, recent state-of-the-art causal inference-based methods (RCD, CIRCA, CausalRCA, RUN), and other important aspects such as the impact of hyperparameter tuning, input data length, among others. More recently, there is the work in (Siebert, 2023) that surveys different causal inference-based methods with the applications in software engineering. This survey, however, does not include any evaluation of these causal inference-based techniques. There are also research works that study and/or evaluate the performance of causal discovery methods for time series data, such as (Assaad et al., 2022; Moraffah et al., 2021; Glymour et al., 2019). However, these works only focus on generic time series data, not metrics data from microservice systems.
7. Conclusion
This paper provides a comprehensive evaluation and in-depth analysis of nine causal discovery methods and twenty-one causal inference-based RCA methods for microservice systems using metrics data. We derive many valuable insights from our evaluation and conclude that the performance of existing causal inference-based RCA methods can be further improved to be efficiently and effectively applied in practice. Therefore, more research is needed in this research area. Furthermore, we also release some new datasets to facilitate the development of research in this area. Finally, we suggest some possible future research directions. We believe our contributions advance the understanding of causal inference-based RCA methods for microservices and pave the way for more robust and impactful solutions.
8. Data Availability
We have open-sourced our evaluation framework, RCAEval, which is available on GitHub (rca, 2024b). Additionally, an immutable artifact is available on Zenodo (rca, 2024c), together with our experimental datasets (rca, 2024a).
Acknowledgements.
This research was supported by the Australian Research Council Discovery Project (DP220103044), AWS Cloud Credit for Research. We also thank anonymous reviewers for their insightful and constructive comments, which significantly improve this paper.References
- (1)
- cad (2023) 2023. Container Advisor - an open-source tool to monitor containers. Retrieved Oct 10, 2023 from https://github.com/google/cadvisor
- ist (2023) 2023. The Istio service mesh. Retrieved Oct 10, 2023 from https://istio.io/
- pya (2023) 2023. A library dedicated to Bayesian networks and Probabilistic Graphical Models. Retrieved Oct 10, 2023 from https://pyagrum.readthedocs.io/en/1.0.0/
- ob (2023) 2023. Online Boutique is a cloud-first microservices demo application. Retrieved Oct 10, 2023 from https://github.com/GoogleCloudPlatform/microservices-demo
- pro (2023) 2023. An open-source monitoring and alerting toolkit. Retrieved Oct 10, 2023 from https://prometheus.io/
- soc (2023) 2023. Sock Shop - A Microservices Demo Application. Retrieved Oct 10, 2023 from https://microservices-demo.github.io/
- sta (2023) 2023. Statsmodels: statistical modelling and econometrics in Python. Retrieved Oct 10, 2023 from https://github.com/statsmodels/statsmodels/
- tt (2023) 2023. Train Ticket Benchmark System. Retrieved Oct 10, 2023 from https://github.com/FudanSELab/train-ticket
- rca (2024a) 2024a. Dataset Artifacts for paper ”Root Cause Analysis for Microservice System based on Causal Inference: How Far Are We?”. Retrieved August 20, 2024 from https://zenodo.org/records/13305663
- rca (2024b) 2024b. Root Cause Analysis for Microservice System based on Causal Inference: How Far Are We? - Github Repository. Retrieved August 20, 2024 from https://github.com/phamquiluan/RCAEval
- rca (2024c) 2024c. Root Cause Analysis for Microservice System based on Causal Inference: How Far Are We? - Source Code Artifacts. Retrieved August 20, 2024 from https://doi.org/10.5281/zenodo.13294049
- Arpit et al. (2023) Devansh Arpit, Matthew Fernandez, Itai Feigenbaum, Weiran Yao, Chenghao Liu, Wenzhuo Yang, Paul Josel, Shelby Heinecke, Eric Hu, Huan Wang, Stephen Hoi, Caiming Xiong, Kun Zhang, and Juan Carlos Niebles. 2023. Salesforce CausalAI Library: A Fast and Scalable framework for Causal Analysis of Time Series and Tabular Data. (2023). arXiv:arXiv preprint arXiv:2301.10859 [cs.LG]
- Arya et al. (2021) Vijay Arya, Karthikeyan Shanmugam, Pooja Aggarwal, Qing Wang, Prateeti Mohapatra, and Seema Nagar. 2021. Evaluation of Causal Inference Techniques for AIOps. In Proceedings of the 3rd ACM India Joint International Conference on Data Science and Management of Data (CODS-COMAD ’21). 188–192.
- Assaad et al. (2022) Charles K. Assaad, Emilie Devijver, and Eric Gaussier. 2022. Survey and Evaluation of Causal Discovery Methods for Time Series. Journal of Artificial Intelligence Research 73 (2022).
- Avizienis et al. (2004) Algirdas Avizienis, J-C Laprie, Brian Randell, and Carl Landwehr. 2004. Basic concepts and taxonomy of dependable and secure computing. IEEE transactions on dependable and secure computing 1, 1 (2004), 11–33.
- Biza et al. (2020) Konstantina Biza, Ioannis Tsamardinos, and Sofia Triantafillou. 2020. Tuning causal discovery algorithms. In International Conference on Probabilistic Graphical Models. PMLR, 17–28.
- Brin and Page (1998) Sergey Brin and Lawrence Page. 1998. The anatomy of a large-scale hypertextual Web search engine. Computer Networks and ISDN Systems 30, 1 (1998), 107–117.
- Chakraborty et al. (2023) Sarthak Chakraborty, Shaddy Garg, Shubham Agarwal, Ayush Chauhan, and Shiv Kumar Saini. 2023. CausIL: Causal Graph for Instance Level Microservice Data. In Proceedings of the ACM Web Conference (WWW ’23). 2905–2915.
- Chen et al. (2019a) Junjie Chen, Xiaoting He, Qingwei Lin, Yong Xu, Hongyu Zhang, Dan Hao, Feng Gao, Zhangwei Xu, Yingnong Dang, and Dongmei Zhang. 2019a. An Empirical Investigation of Incident Triage for Online Service Systems. In 2019 IEEE/ACM 41st International Conference on Software Engineering: Software Engineering in Practice (ICSE-SEIP). 111–120.
- Chen et al. (2014) Pengfei Chen, Yong Qi, Pengfei Zheng, and Di Hou. 2014. CauseInfer: Automatic and distributed performance diagnosis with hierarchical causality graph in large distributed systems. In IEEE Conference on Computer Communications (INFOCOM’14). 1887–1895.
- Chen et al. (2019b) Yujun Chen, Xian Yang, Qingwei Lin, Hongyu Zhang, Feng Gao, Zhangwei Xu, Yingnong Dang, Dongmei Zhang, Hang Dong, Yong Xu, Hao Li, and Yu Kang. 2019b. Outage Prediction and Diagnosis for Cloud Service Systems. In The World Wide Web Conference (San Francisco, CA, USA) (WWW ’19). Association for Computing Machinery, New York, NY, USA, 2659–2665.
- Chen et al. (2020) Zhuangbin Chen, Yu Kang, Liqun Li, Xu Zhang, Hongyu Zhang, Hui Xu, Yangfan Zhou, Li Yang, Jeffrey Sun, Zhangwei Xu, Yingnong Dang, Feng Gao, Pu Zhao, Bo Qiao, Qingwei Lin, Dongmei Zhang, and Michael R. Lyu. 2020. Towards Intelligent Incident Management: Why We Need It and How We Make It. In Proceedings of the 28th ACM Joint Meeting on European Software Engineering Conference and Symposium on the Foundations of Software Engineering (Virtual Event, USA) (ESEC/FSE 2020). 1487–1497.
- Chickering (2002) David Maxwell Chickering. 2002. Learning Equivalence Classes of Bayesian-Network Structures. Journal of Machine Learning Research 2 (2002), 445–498.
- Fang et al. (2023) Zhuangyan Fang, Shengyu Zhu, Jiji Zhang, Yue Liu, Zhitang Chen, and Yangbo He. 2023. On Low-Rank Directed Acyclic Graphs and Causal Structure Learning. IEEE Transactions on Neural Networks and Learning Systems (2023).
- Glymour et al. (2019) Clark Glymour, Kun Zhang, and Peter Spirtes. 2019. Review of Causal Discovery Methods Based on Graphical Models. Frontiers in Genetics 10 (2019).
- Granger (1980) C.W.J. Granger. 1980. Testing for causality: A personal viewpoint. Journal of Economic Dynamics and Control 2 (1980), 329–352.
- He et al. (2022) Zilong He, Pengfei Chen, Yu Luo, Qiuyu Yan, Hongyang Chen, Guangba Yu, and Fangyuan Li. 2022. Graph based Incident Extraction and Diagnosis in Large-Scale Online Systems. In Proceedings of the 37th IEEE/ACM International Conference on Automated Software Engineering (ASE’22). 1–13.
- Ikram et al. (2022) Azam Ikram, Sarthak Chakraborty, Subrata Mitra, Shiv Saini, Saurabh Bagchi, and Murat Kocaoglu. 2022. Root Cause Analysis of Failures in Microservices through Causal Discovery. In Advances in Neural Information Processing Systems (NeurIPS’22), Vol. 35. 31158–31170.
- Jaber et al. (2020) Amin Jaber, Murat Kocaoglu, Karthikeyan Shanmugam, and Elias Bareinboim. 2020. Causal Discovery from Soft Interventions with Unknown Targets: Characterization and Learning. In Advances in Neural Information Processing Systems (NeurIPS’20), Vol. 33. 9551–9561.
- Lee et al. (2023) Cheryl Lee, Tianyi Yang, Zhuangbin Chen, Yuxin Su, and Michael R Lyu. 2023. Eadro: An End-to-End Troubleshooting Framework for Microservices on Multi-source Data. arXiv preprint arXiv:2302.05092 (2023).
- Li et al. (2022a) Mingjie Li, Zeyan Li, Kanglin Yin, Xiaohui Nie, Wenchi Zhang, Kaixin Sui, and Dan Pei. 2022a. Causal Inference-Based Root Cause Analysis for Online Service Systems with Intervention Recognition. In Proceedings of the 28th ACM SIGKDD Conference on Knowledge Discovery and Data Mining (KDD’22). 3230–3240.
- Li et al. (2021) Zeyan Li, Junjie Chen, Rui Jiao, Nengwen Zhao, Zhijun Wang, Shuwei Zhang, Yanjun Wu, Long Jiang, Leiqin Yan, Zikai Wang, Zhekang Chen, Wenchi Zhang, Xiaohui Nie, Kaixin Sui, and Dan Pei. 2021. Practical Root Cause Localization for Microservice Systems via Trace Analysis. In 2021 IEEE/ACM 29th International Symposium on Quality of Service (IWQOS’21). 1–10.
- Li et al. (2022b) Zeyan Li, Nengwen Zhao, Mingjie Li, Xianglin Lu, Lixin Wang, Dongdong Chang, Xiaohui Nie, Li Cao, Wenchi Zhang, Kaixin Sui, Yanhua Wang, Xu Du, Guoqing Duan, and Dan Pei. 2022b. Actionable and Interpretable Fault Localization for Recurring Failures in Online Service Systems. In Proceedings of the 30th ACM Joint Meeting on European Software Engineering Conference and Symposium on the Foundations of Software Engineering (ESEC/FSE’22).
- Lin et al. (2024) Cheng-Ming Lin, Ching Chang, Wei-Yao Wang, Kuang-Da Wang, and Wen-Chih Peng. 2024. Root Cause Analysis in Microservice Using Neural Granger Causal Discovery. In Thirty-Eighth AAAI Conference on Artificial Intelligence. 206–213.
- Lin et al. (2018) Jinjin Lin, Pengfei Chen, and Zibin Zheng. 2018. Microscope: Pinpoint Performance Issues with Causal Graphs in Micro-service Environments. In Service-Oriented Computing. 3–20.
- Liu et al. (2023) Chenghao Liu, Wenzhuo Yang, Himanshu Mittal, Manpreet Singh, Doyen Sahoo, and Steven CH Hoi. 2023. PyRCA: A Library for Metric-based Root Cause Analysis. arXiv preprint arXiv:2306.11417 (2023).
- Ma et al. (2019) Meng Ma, Weilan Lin, Disheng Pan, and Ping Wang. 2019. MS-Rank: Multi-Metric and Self-Adaptive Root Cause Diagnosis for Microservice Applications. In IEEE International Conference on Web Services (ICWS’19). 60–67.
- Ma et al. (2020) Meng Ma, Jingmin Xu, Yuan Wang, Pengfei Chen, Zonghua Zhang, and Ping Wang. 2020. AutoMAP: Diagnose Your Microservice-Based Web Applications Automatically. In Proceedings of The Web Conference (WWW’20). 246–258.
- Meng et al. (2020) Yuan Meng, Shenglin Zhang, Yongqian Sun, Ruru Zhang, Zhilong Hu, Yiyin Zhang, Chenyang Jia, Zhaogang Wang, and Dan Pei. 2020. Localizing Failure Root Causes in a Microservice through Causality Inference. In IEEE/ACM 28th International Symposium on Quality of Service (IWQoS’20). 1–10.
- Moraffah et al. (2021) Raha Moraffah, Paras Sheth, Mansooreh Karami, Anchit Bhattacharya, Qianru Wang, Anique Tahir, Adrienne Raglin, and Huan Liu. 2021. Causal Inference for Time Series Analysis: Problems, Methods and Evaluation. Knowledge and Information Systems 63, 12 (2021), 3041–3085.
- Pan et al. (2021) Yicheng Pan, Meng Ma, Xinrui Jiang, and Ping Wang. 2021. Faster, deeper, easier: crowdsourcing diagnosis of microservice kernel failure from user space. In Proceedings of the 30th ACM SIGSOFT International Symposium on Software Testing and Analysis. 646–657.
- Pham et al. (2024) Luan Pham, Huong Ha, and Hongyu Zhang. 2024. BARO: Robust Root Cause Analysis for Microservices via Multivariate Bayesian Online Change Point Detection. In Proc. ACM Softw. Eng. 1, FSE, Article 98 (July 2024).
- Raghu et al. (2018) Vineet K Raghu, Allen Poon, and Panayiotis V Benos. 2018. Evaluation of causal structure learning methods on mixed data types. In Proceedings of 2018 ACM SIGKDD Workshop on Causal Discovery. PMLR, 48–65.
- Ramsey et al. (2017) Joseph D. Ramsey, Madelyn Glymour, Ruben Sanchez-Romero, and Clark Glymour. 2017. A million variables and more: the Fast Greedy Equivalence Search algorithm for learning high-dimensional graphical causal models, with an application to functional magnetic resonance images. International Journal of Data Science and Analytics 3, 2 (2017), 121–129.
- Runge et al. (2019) Jakob Runge, Peer Nowack, Marlene Kretschmer, Seth Flaxman, and Dino Sejdinovic. 2019. Detecting and quantifying causal associations in large nonlinear time series datasets. Science Advances 5, 11 (2019).
- Schwarz (1978) Gideon Schwarz. 1978. Estimating the Dimension of a Model. The Annals of Statistics 6, 2 (1978), 461 – 464.
- Shan et al. (2019) Huasong Shan, Yuan Chen, Haifeng Liu, Yunpeng Zhang, Xiao Xiao, Xiaofeng He, Min Li, and Wei Ding. 2019. -Diagnosis: Unsupervised and Real-Time Diagnosis of Small-Window Long-Tail Latency in Large-Scale Microservice Platforms. In The World Wide Web Conference (WWW’19). 3215–3222.
- Shimizu et al. (2006) Shohei Shimizu, Patrik O. Hoyer, Aapo Hyvarinen, and Antti Kerminen. 2006. A Linear Non-Gaussian Acyclic Model for Causal Discovery. Journal of Machine Learning Research 7, 72 (2006), 2003–2030.
- Siebert (2023) Julien Siebert. 2023. Applications of statistical causal inference in software engineering. Information and Software Technology 159 (2023).
- Soldani and Brogi (2022) Jacopo Soldani and Antonio Brogi. 2022. Anomaly Detection and Failure Root Cause Analysis in (Micro) Service-Based Cloud Applications: A Survey. Comput. Surveys 55, 3 (2022).
- Soldani et al. (2018) Jacopo Soldani, Damian Andrew Tamburri, and Willem-Jan Van Den Heuvel. 2018. The pains and gains of microservices: A Systematic grey literature review. Journal of Systems and Software 146 (2018), 215–232.
- Spirtes et al. (1993) P. Spirtes, C. Glymour, and R. Scheines. 1993. Causation, Prediction, and Search (1st ed.). MIT press.
- Spitzer (1976) Frank Ludvig Spitzer. 1976. Principles of random walk. Springer-Verlag New York. 408 pages.
- Thalheim et al. (2017) Jörg Thalheim, Antonio Rodrigues, Istemi Ekin Akkus, Pramod Bhatotia, Ruichuan Chen, Bimal Viswanath, Lei Jiao, and Christof Fetzer. 2017. Sieve: Actionable insights from monitored metrics in distributed systems. In Proceedings of the 18th ACM/IFIP/USENIX Middleware Conference (Middleware’17). 14–27.
- Vowels et al. (2022) Matthew J. Vowels, Necati Cihan Camgoz, and Richard Bowden. 2022. D’Ya Like DAGs? A Survey on Structure Learning and Causal Discovery. Comput. Surveys 55, 4, Article 82 (2022).
- Wang et al. (2023) Lu Wang, Chaoyun Zhang, Ruomeng Ding, Yong Xu, Qihang Chen, Wentao Zou, Qingjun Chen, Meng Zhang, Xuedong Gao, Hao Fan, et al. 2023. Root cause analysis for microservice systems via hierarchical reinforcement learning from human feedback. In Proceedings of the 29th ACM SIGKDD Conference on Knowledge Discovery and Data Mining. 5116–5125.
- Wang et al. (2018) Ping Wang, Jingmin Xu, Meng Ma, Weilan Lin, Disheng Pan, Yuan Wang, and Pengfei Chen. 2018. CloudRanger: Root Cause Identification for Cloud Native Systems. In 18th IEEE/ACM International Symposium on Cluster, Cloud and Grid Computing (CCGRID’18). 492–502.
- Wang et al. (2021) Qing Wang, Larisa Shwartz, Genady Ya. Grabarnik, Vijay Arya, and Karthikeyan Shanmugam. 2021. Detecting Causal Structure on Cloud Application Microservices Using Granger Causality Models. In IEEE 14th International Conference on Cloud Computing (CLOUD’21). 558–565.
- Wu (2022) Li Wu. 2022. Automatic performance diagnosis and recovery in cloud microservices. Technische Universitaet Berlin (Germany).
- Wu et al. (2021a) Li Wu, Johan Tordsson, Jasmin Bogatinovski, Erik Elmroth, and Odej Kao. 2021a. MicroDiag: Fine-grained Performance Diagnosis for Microservice Systems. In 2021 IEEE/ACM International Workshop on Cloud Intelligence. 31–36.
- Wu et al. (2021b) Li Wu, Johan Tordsson, Erik Elmroth, and Odej Kao. 2021b. Causal Inference Techniques for Microservice Performance Diagnosis: Evaluation and Guiding Recommendations. In 2021 IEEE International Conference on Autonomic Computing and Self-Organizing Systems (ACSOS’21). 21–30.
- Xin et al. (2023) Ruyue Xin, Peng Chen, and Zhiming Zhao. 2023. CausalRCA: Causal inference based precise fine-grained root cause localization for microservice applications. Journal of Systems and Software 203 (2023), 111724.
- Yu et al. (2021) Guangba Yu, Pengfei Chen, Hongyang Chen, Zijie Guan, Zicheng Huang, Linxiao Jing, Tianjun Weng, Xinmeng Sun, and Xiaoyun Li. 2021. Microrank: End-to-end latency issue localization with extended spectrum analysis in microservice environments. In Proceedings of the Web Conference (WWW’21). 3087–3098.
- Yu et al. (2019) Yue Yu, Jie Chen, Tian Gao, and Mo Yu. 2019. DAG-GNN: DAG Structure Learning with Graph Neural Networks. In Proceedings of the 36th International Conference on Machine Learning (ICML’19), Vol. 97. 7154–7163.
- Zhang et al. (2021) Keli Zhang, Shengyu Zhu, Marcus Kalander, Ignavier Ng, Junjian Ye, Zhitang Chen, and Lujia Pan. 2021. gCastle: A Python Toolbox for Causal Discovery.
- Zheng et al. (2018) Xun Zheng, Bryon Aragam, Pradeep K Ravikumar, and Eric P Xing. 2018. Dags with no tears: Continuous optimization for structure learning. Advances in neural information processing systems 31 (2018).
- Zhou et al. (2018) Xiang Zhou, Xin Peng, Tao Xie, Jun Sun, Chao Ji, Wenhai Li, and Dan Ding. 2018. Fault analysis and debugging of microservice systems: Industrial survey, benchmark system, and empirical study. IEEE Transactions on Software Engineering 47, 2 (2018), 243–260.