Magnetic correlations and Griffith-like phase in Co2TiSi0.5Al0.5 Heusler alloy
Abstract
We present a comprehensive study aimed at elucidating the complex magnetic correlations in Co2TiSi0.5Al0.5 Heusler alloy having the partial B2-type structure amid L21 cubic main phase. The thermo-magnetization measurements at 100 Oe reveal the presence of two magnetic transitions at T and T, respectively, with saturation magnetization of around 1.2 /f.u. at 5 K. Our magnetic field dependent studies reveal the dominance of TC1 transition at lower fields (); however, at higher fields the TC2 transition becomes more pronounced. The observation of remnant magnetization above Curie temperature suggests the development of Griffiths-like phase, which is extensively analyzed through ac and dc- magnetic susceptibility () data. The observed frequency dispersion in imaginary component of indicates blocking of spins leading to the development of distinct magnetic state even below Griffiths-like phase. The evaluation of magnetocaloric potential indicates second order phase transition with notable 2.22 Jkg-1K-1 at 7 Tesla. The low-field () magnetic entropy () curves exhibit two non-identical positive peaks, which corroborate the existence of TC1 and TC2 transitions. The nature and range of spin interactions near TC were scrutinized through rigorous critical phenomenon analysis, and the values of exponents and to be and , respectively, which are found to be slightly deviating from mean-field theory towards 3D Heisenberg model. Additionally, the exchange magnetic interactions are found to decay as . Furthermore, the density functional theory results reveal the half-metallic nature exhibiting 100% spin polarization (SP). However, the electronic and magnetic properties are greatly affected by the incorporation of structural disorder, which results in drastic reduction of SP to mere 8.3%.
I Introduction
Heusler alloys (HA) represent an intriguing class of materials known for their diverse physical properties and prospective applications in domains like, spintronics, thermoelectrics, magnetocalorics, spin torque transfer, and topological properties [1, 2, 3, 4, 5, 6]. However, it is well proclaimed that HAs are susceptible to structural disorder (SD), which significantly influences their electronic band structure and magnetic properties. There are numerous studies in literature which have mapped the origin of exotic phenomena, like giant magneto-resistance, exchange-bias effect, large anomalous Hall effect, and giant magneto-caloric effect in HAs to inherent SD [7, 8, 9, 10]. In this line, significant tunnelling magnetoresistance (TMR) has been reported in systems like Co2(Cr0.6Fe0.4)Al/AlOx/CoFe/NiFe/IrMn/Ta heterostructure, which exhibits 16 TMR at room temperature (RT) and 26.5 at 5 K [11], whereas, the A2-ordered Co2FeAl shows 47 TMR at RT [10]. These substantial results are attributed to the presence of disorder and/or interfaces within the structures, highlighting the potential of these materials for spintronics applications [12, 13]. Additionally, Block et al. reported a large magnetoresistive effect (30 at RT) in B2-ordered Co2(Cr0.6Fe0.4)Al system [11]. Furthermore, the low damping constant associated with HAs enhances the current induced dynamics of skyrmions [14]. Conversely, the inherent SD appears to influence the shape and size of developed skyrmions through the pinning effect [15].
Another alluring magnetic state correlated with SD is the emergence of highly inhomogeneous magnetic region, often identified as Griffiths-like phase (GP) [16, 18, 17, 19]. The development of GP in systems such as diluted ferromagnetic maganites, oxides, intermetallics, and semiconductors is often attributed to the presence of quenched disorders and/or competing magnetic interactions [17, 21, 20, 16]. For instance, in Pr2CoFeO6, random distribution of Co and Fe ions introduces AFM/FM competing interactions [21] while dilution by non-magnetic Co3+ ion in La1.5Sr0.5CoMn0.5Fe0.5O6 leads to the loss of long range magnetic ordering [20], thus giving rise to GP in these systems. Interestingly, the observed GP state in Fe2V1-xRhxGa HA was attributed to the dilution of Fe atoms upto a critical concentration of 0.15, hence resulting in development of isolated FM clusters near TC [22]. In Fe2-xMnxCrAl system, the observed (Fe-Al) anti-site disorder was considered responsible for the evolution of short-range FM clusters at higher temperatures [23]. More recently, the observed GP state in CoFeVAl system spans an unusually large temperature range, which is also evident in subsequent transport measurements, where the reduced electron-magnon (e-m) scattering resulted in negligible MR signal even under high fields [24]. Moreover, systems with GP singularity have been observed to display colossal magnetoresistance and giant magnetocaloric effect [26, 25]. In the context of magnetocaloric applications, HA have garnered much attention since Liu et al. reported evidences of giant MCE in Ni-(Co)-Mn-In, with Tad = - 6.2 K at 1.9 Tesla, which was comparable to benchmark Gd-based alloys [27]. The exploration of HAs as magnetocaloric materials opens new avenues for the development of eco-friendly and energy-efficient refrigeration systems, cooling units and heat pumps [28].
In this context, the Co2YZ HAs are of particular interest due to their high Curie temperature TC and the variation in magnetic moment at Co site, ranging from 0.3 to 1 , which is strongly influenced by the local environment [28, 29]. The Co2TiZ series, in particular, has garnered significant scientific interest for its remarkable properties, including half-metallicity, high spin polarization, and large anomalous Hall effect, highlighting its promising spintronic functionality [30, 31, 32, 33]. The variation in magnetic moment at the Co site is also significantly influenced by the localization of 3d states in constituent transition metals, which is considered as the primary reason for different / contributions at Co site in Co2ZrSn and Co2TiSn, with the Co-3d states in Co2ZrSn being relatively more localized [34]. Moreover, the theoretically predicted half-metallic characteristics of Co2MSn (M=Ti, Zr, Hf) in [35, 36] are found to be controversial, as few other reports have argued that the presence of Co-d states near Fermi level of minority spin channel destroys the half-metallicity in some of these materials [37, 38]. The spin-resolved electronic structure analysis reveals that the majority spin channel exhibits metallic character due to CoTi interactions. However, direct hybridization between CoCo second next neighbors results in a finite band gap at Fermi level for the minority spin channel [34, 39]. Furthermore, the anomalous Hall effect (AHE) in Co2TiAl revealed that an extrinsic mechanism is responsible for the profound AHE signal here, even-though the (e-m) scattering introduces a side-jump contribution, but still skew scattering is observed as the dominant mechanism. Additionally, the observation of large, non-saturating negative MR is also attributed to the significant (e-m) scattering at low fields [40]. However, to the best of our knowledge, the magnetocaloric properties of Co2TiSi(Al) system have not been extensively explored, except in [41].
Therefore, in this paper we present a detailed investigation of the structural and magnetic properties as well as electronic structure of Co2TiSi0.5Al0.5 (CTSA) Heusler alloy, utilizing the x-ray diffraction, temperature and field-dependent magnetization, and ac susceptibility measurements. Our primary objective is to unravel the origin of unique Griffiths-like phase and the underlying magnetic correlations. It is crucial to thoroughly investigate the intriguing complexities arising from substitution and structural disorder along with their profound influence on the magnetic characteristics. The synergy between our experimental investigations and density functional theory (DFT) simulations aims to bridge the gap between macroscopic observations and understanding microscopic properties of Heusler Alloys.
II Experimental and Computational Details
The polycrystalline Co2TiSi0.5Al0.5 sample was prepared by arc melting technique (CENTORR Vacuum, USA) using water cooled Cu hearth. The constituent elements (Co, Ti, Si, Al) from Alfa Aesar and Sigma Aldrich with purity 99.99+% taken in the stoichiometric amount were melted in flowing argon environment. To ensure homogeneity of sample, the ingot was turned over and re-melted several times. The ingot wrapped in molybdenum foil was then annealed under vacuum in quartz tube at 1123 K for 7 days in Nabertherm furnace, and we recorded the total weight loss of 1%.
The x-ray diffraction (XRD) pattern was recorded using Malvern PANalytical conventional diffractometer with Cu Kα radiation (Å) to study the crystallographic structure. The morphology and elemental composition were characterized using field emission scanning electron microscope (FE-SEM) and energy dispersive x-ray (EDX) measurements (see Fig. 1 in [42]). The magnetic measurements were recorded using MPMS3 SQUID magnetometer from Quantum Design, USA.
The first-principles calculations were performed using the DFT as implemented in the Vienna ab initio simulation package (VASP) [43] employing a projector augmented wave (PAW) plane wave basis [44]. For the exchange-correlation, we used Perdew, Burke and Ernzerhof (PBE) functional within the generalized-gradient-approximation framework. Further, to obtain the equilibrium structure for ground state, the unit cell was optimized using full relaxation calculation with energy convergence and atomic force tolerance used as 10-8 eV and 10-7 eV/Å, respectively. The self-consistent-field calculations were executed using a k-mesh of 121212 along-with integration method having 0.05 eV smearing and 500 eV plane wave energy cut off.
III Results and discussion
III.1 Crystal Structure and Magnetic Properties
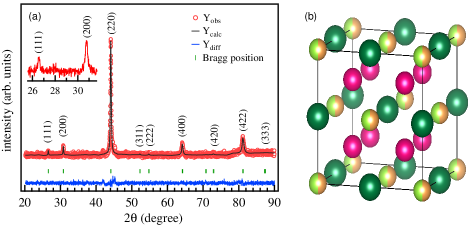
The XRD pattern recorded at room temperature is shown in Fig. 1(a) where the inset highlights an additional narrow scan of (111) and (200) peaks at 26.7°and 30.9°, respectively. The Rietveld refinement using Fullprof package is performed considering Fmm space group (no. 225) and the extracted lattice parameter is 5.8038 Å, with corresponding fitting parameters as RP = 2.2, Rexp = 2.48 and = 1.28. The Bragg reflections corresponding to , are independent of the state-of-order and are called primary reflections. The supper-lattice reflections, which are order-dependent, can be classified into two sets, are odd or . The observation of (111) and (200) peaks [see the inset of Fig. 1(a) for clarity] indicates the presence of ordered L21 structure; however, the small difference between the atomic scattering factors of Co and Ti, and absorption corrections, render only a qualitative estimate of the chemical order from x-ray diffraction pattern [45, 46]. In Co2TiZ samples the commonly observed preferential disorder is B2-type between the Y(Ti) and Z atoms, hence in the present case, the relatively similar electro-negativities and atomic radii of Ti (1.54, 147 pm) and Al (1.61, 143 pm) atoms in contrast with Si (1.9, 111 pm), leads to favorable cross-site occupation of Ti and Al atomic positions [47]. However, the quantification of the anti-site disorder by refining the respective atomic occupancies at Wyckoff positions could not be concluded as there was hardly any improvement in the refined profiles. Therefore, we try to estimate the degree of disorder from order parameters S and , using the relations S, and S, respectively [48, 45]. The extracted value of (fraction of Ti atoms occupying Al sites) from the observed XRD pattern is 0.05 indicating partial B2-type order amid L21 main cubic phase [45]. Note that, if the order parameter had been =0.5, it would have symbolized complete order between Ti and Z atoms [45].
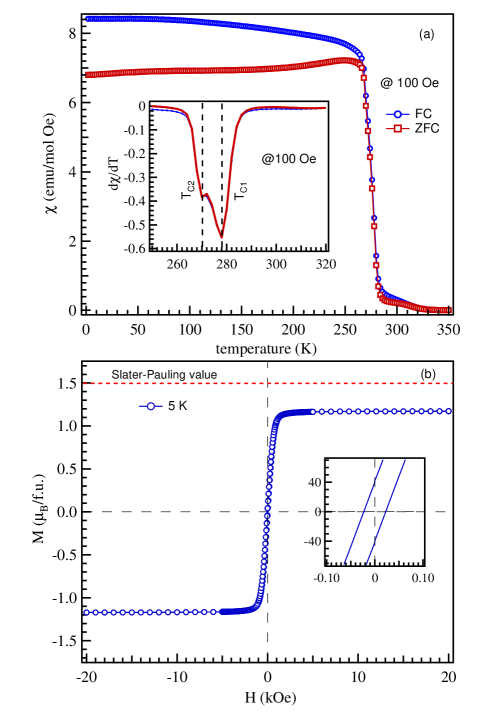
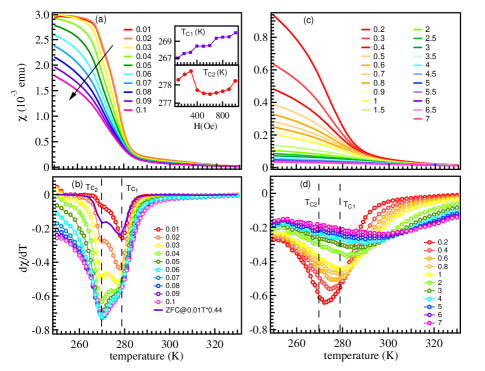
In order to investigate the magnetic phase transition and intrinsic magnetic interactions of CTSA, we measure the temperature-dependent magnetization data in zero-field cooled (ZFC) and field-cooled (FC) modes, during warming with an applied field of 100 Oe after cooling the sample in zero field and 100 Oe, respectively. Interestingly, we observe a sharp increase in the magnetic susceptibility () curves below 280 K and as evident in Fig. 2(a), the branching of ZFC and FC data points suggests the presence of competing interactions and/or inhomogeneous ferromagnet [49]. The bifurcation however is observed to diminish with increasing magnetic field (see Fig. 2 in [42]). Furthermore, the first-order temperature derivative of , clearly shows the presence of two magnetic transitions around and , indicated by dashed lines in the inset of Fig. 2(a). The isothermal magnetization curve recorded at 5 K in Fig. 2(b) illustrates low coercivity (around 22 Oe) and the saturation magnetization value is found to be 1.2 /f.u., which is to some extent below the expected Slater Pauling value of 1.5 /f.u [2, 50]. This slight difference in the magnetic moment values could be ascribed to the presence of atomic disorders in the system [51, 52]. The significant influence of structural disorder on magnetic properties has been extensively investigated and discussed in the subsequent DFT section. The temperature-dependent susceptibility () curves extracted from the magnetization isotherms are presented in Figs. 3(a, c) and the corresponding d/dT curves are presented in Fig. 3(b, d), respectively, to illustrate the evolution of the transitions at TC1 and TC2 with applied magnetic field. The low-field () in Fig. 3(a) (0.01–0.1 Tesla) undergo a notable change in the slope of the curves around 270 K, followed by another transition at about 280 K, which is more evidently observed in the respective d/dT plot, Fig. 3(b) where the transition at TC1 appears to be dominant upto 0.03 Tesla; however, further increase in the magnetic field leads to broadening of this feature accompanied with systematic shift of transition temperature towards higher values [see inset Figs. 3(a)], hence evidencing the ferromagnetic transition. On the other hand, the TC2 transition strengthens beyond 0.04 Tesla with a slight dip in the transition temperature at 0.04 Tesla field followed by systematic increase with the field [see inset Figs. 3(a)], thereby manifesting as another competing ferromagnetic interaction. The possible anti-site disorder between Ti and Al atoms, thereby allocates different exchange-coupling constants between Co–(Ti/Al)–Co sites, which might be associated with the emergence of these magnetic transitions [53]. Similar observations are reported in DyMn2Si2 where the presence of small defects in crystal structure and/or in-homogeneity resulted in the occurrence of multiple ferromagnetic/anti-ferromagnetic transitions [53].
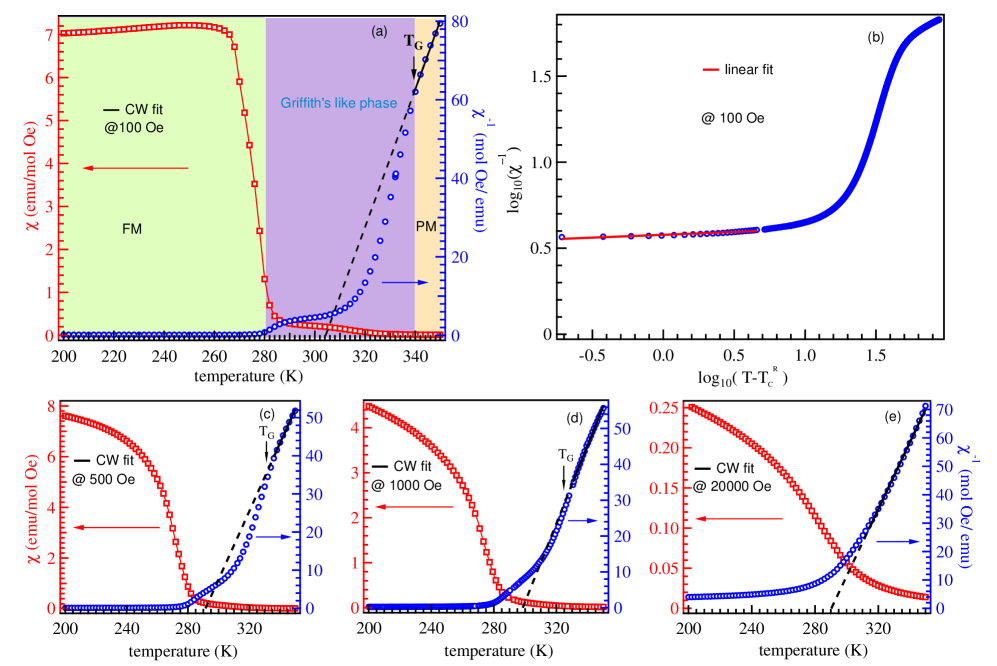
To elucidate the fundamental magnetic interactions, the inverse susceptibility () is plotted as a function of temperature in Fig. 4(a). The high-temperature behavior exhibits a slight curvature, often associated with the presence of short-range magnetic correlations and/or temperature-independent susceptibility contribution (0) [54]. We fit the susceptibility data in 340–350 K range with Curie Weiss (CW) law, as below:
| (1) |
where and are the Curie constant, and Curie temperature, respectively. The obtained value of the effective magnetic moment (), and the positive value of indicates the ferromagnetic-type interactions in the sample. Interestingly, the shows a downward deviation from CW fit and takes a sharp downturn before reaching the Curie temperature. This feature implicitly suggests a Griffiths-like phase (GP) transition, as observed in Fe2-xMnxCrAl [23], where the anti-site disorder between FeAl atoms resulted in random allocation of different exchange coupling constants at different lattice sites. This led to the coexistence of competing magnetic correlations hence suppressing the PM ordering by forming small ferromagnetic clusters well above TC [56, 22, 55]. The deviation temperature of from CW fit, referred to as the Griffith temperature TG, marks the onset of short-range magnetic ordering in the system. Therefore, we examine the field dependence of , which was found to be similar across different fields, as evident from Figs. 4(a, c, d, e). However, as the field increases above 100 Oe, the prominent downturn softens and completely vanishes at 2 Tesla, exhibiting CW behavior at high fields. Likewise, Barnabha et al. observed an identical suppression in the downturn with increasing applied field (up to 2 kOe) in CoFeVAl, due to the dominant paramagnetic contribution at higher fields [55].
Intriguingly, in the present case, the is found to shift towards lower temperatures from 338 K to 328 K, respectively, with increasing the field from 100 Oe to 1000 Oe, indicated with arrows in the Figs. 4(a, c, d). These features hence align well with the characteristic signatures of Griffiths-like phase, which is observed to emerge due to the nucleation or local alignment of small ferromagnetic clusters within globally paramagnetic regime [57, 58, 24, 22]. The magnetic response of a system exhibiting GP phase is governed by the largest cluster or correlated volume [18, 59]. Therefore, examining the logarithmic dependence of inverse susceptibility on temperature scale is crucial, where the GP singularity () can be characterized by the power law [59]
| (2) |
here, the and are the characteristic temperature of the random ferromagnet and exponent of the power law, respectively. The exponent symbolizes the deviation from CW nature and lies between 01 for GP. Meanwhile, the characteristic temperature plays a significant role in the aforementioned analysis and lies between the actual and the highest ordering temperature, , permissible by exchange bond distribution. In the present analysis, we use , as it ensures that equation (2) reduces to CW nature in PM region for 0. The versus data presented in Fig. 4(b) for 100 Oe demonstrates a small linear region at high temperatures followed by a downturn and another linear region (fitted solid red line) at lower temperatures. The linear fitting of the low-temperature segment of the curve produces , embodying the GP regime. The large observed value of corresponds to a greater deviation from the CW behavior, indicating the robustness of GP in the present sample. Recently, Nag et. al. have reported a similar robust GP state with , corresponding to the presence of quenched disorder and coexisting AFM/FM interactions in CrFeVGa Heusler alloy [22]. So we can conclude that the sharp downturn observed above in Fig. 4 could be attributed to the dominant contribution from small ferromagnetically coupled clusters over PM ordering. The crystallographic disorder, here in the form of randomly distributed local B2-type phase, suppresses the long range PM ordering temperature, because of the random allocation of exchange-coupling constants at different lattice sites. This develops an intermediate temperature region where, the FM clusters are dispersed within the paramagnetic matrix, thereby resulting in the downward deviation of from the CW fit [60].
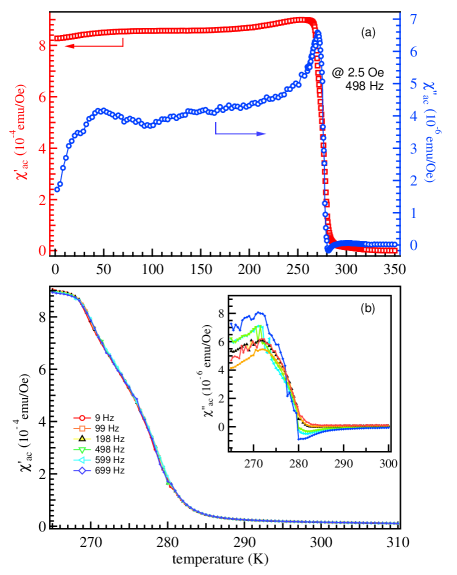
Moreover, the ac magnetic susceptibility () provides a powerful tool to probe the magnetization and dynamics of a system as a function of temperature, frequency, amplitude and direction of ac and bias dc magnetic fields. Fig. 5(a) presents the data for and recorded at 2.5 Oe field and an excitation frequency of 498 Hz. Here, the shows a frequency-independent peak at about 280 K corresponding to the magnetic phase transition. However, exhibits a low-intensity broad hump at lower temperatures (30–90)K followed by an asymmetric feature near 280 K, see Fig. 5(a). The subsequent frequency-dependent study performed in the vicinity of 280 K reveals an enhancement in the amplitude of this feature along with clear frequency dispersion in the component, as shown in Fig. 5(b). This suggests the presence of a distinct magnetic state developed due to blocking of spins below Griffiths phase. Similarly, in Fe2-xMnxCrAl, exhibits frequency dependence near TC, but without shift in the peak position, which was then ascribed to the irreversible domain wall movement and/or pinning effect [23]. Similar frequency dispersion with negative anomaly corresponding to the Griffiths phase has been also observed in Tb2CoMnO6 system [61]. In several other systems, anomalous relaxation processes have often been attributed to mediate such frequency dependence of the data [62, 63].
III.2 Magnetocaloric Properties
We perform the magnetocaloric analysis to investigate the nexus of these complex magnetic interactions with temperature and magnetic field. The isothermal magnetization measurements were performed near (278 K) with a temperature interval of T = 1 K and the magnetic fields upto 7 Tesla, see Fig. 6(a). The isothermal entropy change () can be determined using the following Maxwell’s equation,
| (3) |
where, the represents permeability. Fig. 6(b) depicts the obtained entropy change for magnetic fields ranging from 0.1 to 7 Tesla across the . All the entropy curves exhibit a distinctive peak at temperature and its position shifts slightly towards higher temperatures as well as the maximum entropy change increases with increasing magnetic field. For the present sample, the maximum entropy change is found to be 2.22 J.kg-1K-1, at 7 Tesla, which is comparable to the related Co-based systems, like 2 J.kg-1K-1 @ 9 Tesla for the Co2Cr0.75Ti0.25Al [64] and 2.55 J.kg-1K-1 @ 5 Tesla for the Co50Cr25Al25 [65].
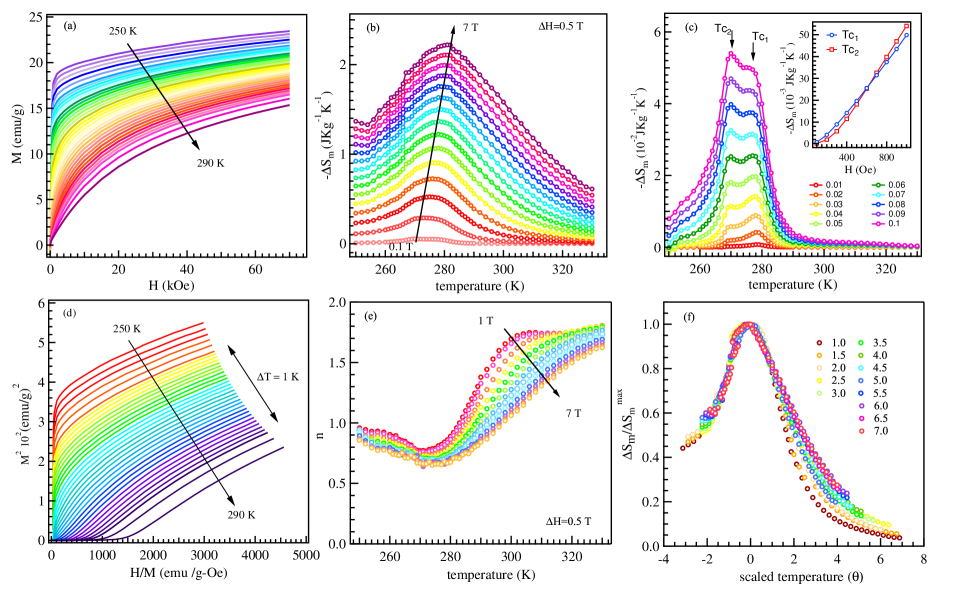
Interestingly, in the present sample for lower fields ( 0.1 Tesla) the entropy curve exhibits two non-identical positive peaks associated with TC1 and TC2 magnetic transitions, as shown in Fig. 6(c), which is consistent with the observations of Fig 3. The relative magnitude of maximum entropy change in these peaks changes with applied magnetic field, and it instantiates a crossover at about 0.06 Tesla, see the inset of Fig. 6(c). Therefore, the development of randomly allocated, temperature and magnetic field dependent exchange interactions in the sample, possibly act as the driving force for the occurrence of the observed magnetic transitions [62, 53].
Note that the magnetocaloric properties are strongly influenced by the nature of the magnetic transition where the materials having second-order phase transition (SOPT) are desirable for these applications due to the absence of thermal hysteresis, but they render considerably lower and values. The order of magnetic phase transition can be determined through magnetic analysis, like the Banerjee criterion, which suggests that for SOPT materials the slope of the Arrott curve for isotherms below and above is positive [66]. Here, the Arrott plot ( versus H/M) illustrated in Fig. 6(d) indicate the positive slope of the isotherms, affirming the second-order nature of the phase transition. However, this criterion is not always reliable because it assumes that the system adheres to the mean-field model, which may not be the case always. To further quantify the nature of the phase transition, we examine the scaling nature of the magnetocaloric properties by probing the magnetic field dependence of the entropy change, defined as [67, 68]. This general method is not constrained to any particular equation of state and has been verified and validated by Law et. al. for a various materials, including Heusler alloys such as Ni45.7Mn36.6In13.5Co4.2 [68]. Therefore, we plot the variation of exponent as a function of temperature using the following relation [69]
| (4) |
For the SOPT, the value of should approach 1 below and to paramagnetic value 2 for temperatures above , whereas, any value of greater than 2 is associated with the presence of first-order phase transition. However, before reaching the paramagnetic value, it is expected to exhibit a minimum at [67]. Our computed data for as a function of temperature are presented in Fig. 6(e), which clearly shows that the values are approximately close to 1 for temperatures below , and then starts approaching a minimum at around 278 K before increasing again towards the value of 2. This minimum corresponds to the Curie transition from ferromagnetic to the paramagnetic regime, which is found to be consistent with the transition observed in the thermo-magnetization measurement [as shown in Fig. 2(a)].
Another qualitative analysis for the SOPT is that after the normalization of entropy change and scaling of temperature, all the field-dependent entropy curves should collapse into a single curve. This analysis is based on the assumption that equivalent points corresponding to different experimental curves should converge to the same point on the universal curve [70]. The equivalent points, denoted as and , are recognized as points corresponding to the same level relative to the peak on the entropy curve. In the present work, for the analysis of we have taken the arbitrary factor as 0.8. It is to mention that, the choice of does not affect the analysis. The temperature is scaled into using the following equation [71]
| (5) |
where, and represent the temperatures corresponding to and is the temperature corresponding to . Fig. 6(e) shows the normalized entropy curves as a function of scaled temperatures, which was found to collapse into a single curve, further confirming the SOPT in the present sample. Note that the relative cooling power (RCP) is considered as the figure of merit for magneto-caloric materials, which is defined as the product of maximum entropy change and temperature at full width half maximum (FWHM) [72], as
| (6) |
The value of was extracted by fitting the entropy curves in Fig 6(b), using the Gaussian function. The highest value of RCP is obtained as 64.4 J.kg-1 (for 29 K) at 7 Tesla, which is found to be better than the reported value for Co2TiSi0.75Al0.25, 55.25 J.kg-1 at 3 Tesla [41].
III.3 Critical Analysis
To elucidate the microscopic correlations responsible for the intricate magnetic interactions in the present sample Co2TiSi0.5Al0.5, we now extensively examine the static critical behavior across the FM/PM transition around 278 K. According to the Landau mean-field theory, the M2 vs H/M curves across the TC should constitute of parallel straight lines in high-field region, with T = TC isotherm passing through the origin. However, as shown in Fig. 6(d), the Arrott curves are not stringently linear in high-field region, indicating that the system cannot be characterized by mean-field model. Therefore, we use the modified Arrott plot (MAP) approach to characterize the phase transition, i.e., the magnetization isotherms are analyzed using the equation of state proposed by Arrott-Noakes [73]:
| (7) |
where, and are temperature-dependent parameters. Near the TC, the spin-spin correlation length (), diverges as , leading to formulation of universal scaling laws governed by asymptotic critical exponents and amplitudes, as [74]
| (8) |
| (9) |
| (10) |
here, MS, and represent the spontaneous magnetization below TC, initial inverse susceptibility above TC, and reduced temperature, respectively, while the M0, h0/M0, and D denote the critical amplitudes.
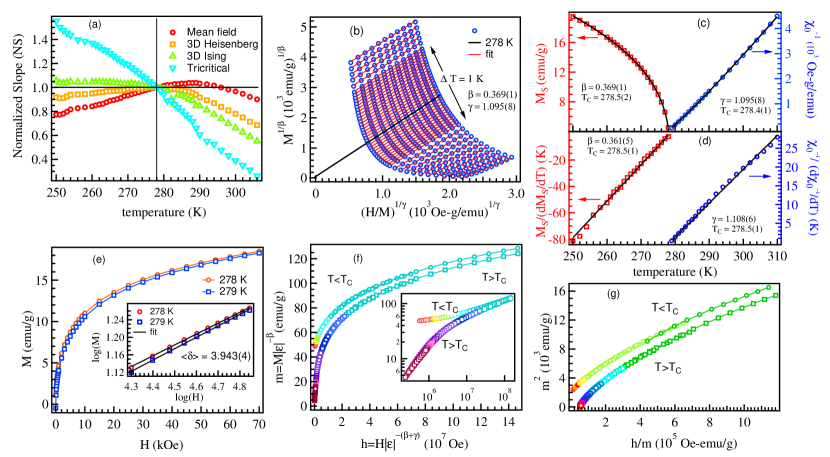
The MAPs [M1/β vs. (H/M)1/γ] corresponding to critical exponents predicted for the tricritical ( and ), 3D Heisenberg ( and ), mean-field ( and ), and 3D Ising ( and ) models [75], are constructed and illustrated in Figs. 3(a–d) of [42], respectively. The high magnetic field region (H 2 Tesla) was then linearly fitted (indicated by the red lines) and we observed that the universality classes exhibit quasi-straight lines over the wide range of fields. To determine which model produces the best fit, we plot the normalized slope (NS)=S(T)/S(T, where the slope at any given temperature has been normalized to the slope at T 278 K. Fig. 7(a) displays the NS extracted from the corresponding MAPs of Figs. 3(a–d) of [42]. The sample shows least deviation from unity for the mean-field and 3D Heisenberg models as we move away from the critical point (TC), indicating that either of these models could successfully characterize the magnetic interactions.
Therefore, we employed an iterative approach to estimate the precise values of the critical exponents and [76, 77]. The linear extrapolation of high-field region gives MS(T) and (T) as intercepts on M1/β and (H/M)1/γ axes, respectively. By substituting these resultants in equations 8 and 9, we obtain new set of and values, which are then used to construct new MAPs. This process is repeated until we are able to find the stable values of and within the error bars. It is imperative to note that these values of the critical exponents are independent of their initial trial values, thereby confirming their reliability. After rigorous iterations, a set of parallel straight lines were generated corresponding to , , and TC as 0.369(1), 1.095(8), and 278.5(1) K, respectively, and presented in Fig. 7(b). The isotherm at 278 K passes through the origin [see the black line in Fig. 7(b)], thus representing the TC. However, a slight curvature in the low magnetic field region of the isotherms (not shown here) could be attributed to the complex multi-domain spin structure in this regime [64]. The temperature dependence of final MS(T) and (T) values acquired from the MAP is plotted in Fig. 7(c). To further substantiate the critical exponents and TC, we investigate the MS(T) and data using Kouvel-Fisher (KF) plot [74],
| (11) |
| (12) |
According to the KF method, the MS(T)/[dMS(T)/dT] and /[d/dT] yield linear temperature dependence with slopes of 1/ and 1/, respectively, as presented in Fig. 7(d). The obtained values of , , and TC, from the slopes and y-intercepts of linear fitted curves, are 0.361(5), 1.108(6), and 278.5(1) K, respectively, which are consistent with those generated from the MAPs, hence validating their accuracy.
Furthermore, the critical isotherm at TC is characterized by the exponent . It exhibits a linear behavior on a log-log scale according to equation 10 with slope 1/. To verify the value of TC [278.5(1) K] extracted from the MAP and KF methods, we perform the critical isotherm analysis at the magnetic ordering temperature in Fig. 7(e). The isotherms in asymptotic region were recorded in 1 K steps, therefore, the M-H curves corresponding to 278 K and 279 K are presented in Fig.7(e). The linear fitting in the inset of Fig. 7(e) gives an average =3.943(4). Similar analysis to extract the critical parameters has been reported for few Co-based Heusler alloys, as listed in Table 1. The critical exponent can also be calculated through the Widom scaling relation [78] as:
| (13) |
here, considering the and values determined from the Fig. 7(b), the calculated value of using equation 13 is 3.967(8), which shows good agreement with the critical isotherm analysis. Therefore, it can be concluded that while the extracted critical exponents are consistent across different analytical approaches, they do not adhere to any conventional universality class. Therefore, it is crucial to scrutinize whether the obtained critical exponents can generate the scaling magnetic equation of state [79]:
| (14) |
where f+ and f- denote the regular functions above and below TC, respectively. For the correct values of critical exponents, the reduced magnetization m=M versus reduced field h=H curves should collapse into two branches, corresponding to temperatures above and below the TC. Fig. 7(f) illustrates the m versus h plot using the exponents obtained from MAP analysis, showing convergence into two universal curves. This branching is more profoundly observed in the log-log plot [inset of Fig. 7(f)]. Furthermore, the m2 versus h/m plot in Fig. 7(g), also exhibits similar branching in the data points, hence indicating that the magnetic interactions are properly re-normalized in the critical regime following a scaling equation of state [80].
| Sample/model | Reference | Approach | ||||
|---|---|---|---|---|---|---|
| Co2TiSi0.5Al0.5 | This work | Modified Arrott plot | 0.369(1) | 1.095(8) | 3.967 | |
| Kouvel-Fisher | 0.361(5) | 1.108(6) | 4.069 | |||
| Critical Isotherm | 3.943(4) | |||||
| Co2TiSi0.75Al0.25 | [41] | Modified Arrott plot | 0.429(5) | 1.211(5) | 3.82(6) | |
| Kouvel-Fisher | 0.469(1) | 1.173(1) | 3.501(4) | |||
| Critical Isotherm | 3.100(2) | |||||
| Co50Cr25Al25 | [65] | Modified Arrott plot | 0.488(3) | 1.144(4) | 3.336(5) | |
| Kouvel-Fisher | 0.482(13) | 1.148(16) | 3.382(20) | |||
| Critical Isotherm | 3.401(4) | |||||
| Co2Cr0.75Ti0.25Al | [64] | Modified Arrott plot | 0.496(4) | 1.348(12) | 3.82(6) | |
| Kouvel-Fisher | 0.491(9) | 1.327(13) | ||||
| Critical Isotherm | 3.581(5) | |||||
| Co2TiGe | [85] | Modified Arrott plot | 0.495 | 1.325 | 3.677 | |
| Kouvel-Fisher | 0.495(2) | 1.324(4) | 3.675 | |||
| Critical Isotherm | 3.671(1) | |||||
| Co2TiSn | [86] | Modified Arrott plot | 0.527(3) | 1.229(2) | 3.33(2) | |
| Kouvel-Fisher | 0.537(2) | 1.255(3) | 3.33(7) | |||
| Critical Isotherm | 3.261(2) | |||||
| Co2HfSn | [87] | Modified Arrott plot | 0.472(3) | 1.021(2) | 3.16(2) | |
| Kouvel-Fisher | 0.477(4) | 1.029(5) | 3.15(7) | |||
| Critical Isotherm | 3.273(5) | |||||
| Mean-field | [75] | Theoretical | 0 | 0.5 | 1.0 | 3 |
| 3D Heisenberg | [75] | Theoretical | -0.115 | 0.365 | 1.386 | 4.80 |
| 3D Ising | [75] | Theoretical | 0.11 | 0.325 | 1.241 | 4.82 |
| Tricritical mean-field | [88] | Theoretical | 0.25 | 1.0 | 5 |
Furthermore, the nature and range of complex spin interactions play a pivotal role in determining the magnetic properties of a system, which necessitates their investigation. According to the renormalization group theory of exchange-interaction systems, for a -dimensional spin system with an isotropic -component order parameter, the isotropic interaction decays as , where , , and represent the spatial distance, lattice dimensionality, and range of magnetic interactions, respectively. This model classifies the magnetic interaction as long-ranged for 1.5, and short-ranged for 2 [81]. The value of can hence be calculated by substituting in the following relation [82, 83, 84]
| (15) | ||||
where , , and represents the spin dimensionality. By considering the three-dimensional lattice and spin interactions ( 3) and using the values of extracted from the MAP, we find 1.696, which falls between the mean-field theory and 3D Heisenberg model range, indicating extended long-range magnetic interactions [81, 86]. The extracted values of can further be used to calculate the critical exponent using the relation , where is the exponent of correlation length, given as . On the other hand, the calculated value of (0.063) suggests the predominance of long range interactions (mean-field theory, i.e., ) in the present sample. The magnetic interactions in this sample decay approximately as , suggesting that they do not completely adhere to any theoretical model, but lies within long range (mean-field model) and short range (3D Heisenberg model) FM interactions [86, 28].
III.4 First-principles simulations
Finally, to support our experimental results we perform DFT based first-principles calculations to investigate the electronic structure and magnetic properties. The properties in a solid are strongly governed by its crystal structure and electronic bonding [90, 89]. Therefore, to verify the accuracy of our DFT parameters, we first performed electronic structure calculations for pristine Co2TiSi (CTS) system, presented in Fig. 3 of [42]. The calculations predict half-metallic character, with 100% spin polarization (SP) and a band gap of 0.60 eV associated with minority spin channel, concurring with reported literature [30, 31]. The majority spin channel exhibits metallic character due to the CoTi interactions, while the CoCo second next neighbor direct hybridization is responsible for semiconducting nature of minority spin channel [34, 39]. The computed lattice parameter is 5.7475 Å, which agrees well with the calculated value of 5.760 in [30] and experimentally observed value of 5.743 Å in [91]. Additionally, as evident from the Table 2, the computed magnetic moment, 1.99 /f.u, is in very good agreement with refs. [35, 31], which substantiates the exchange-correlation functional and other parameters used in the calculations.
| System | |||||
|---|---|---|---|---|---|
| () | () | () | () | () | |
| Co2TiSi | 0.99 | -0.04 | 0.03 | - | 1.99 |
| Co2TiSi [30] | 1.03 | -0.02 | - | - | 2.00 |
| Co2TiSi [31] | 0.99 | 0.03 | 0.01 | - | 1.99 |
| Co2TiSi0.5Al0.5 | 0.822 | -0.097 | 0.011 | 0.001 | 1.559 |
| Co2TiSi0.5Al | 0.580 | -0.012 | 0.008 | -0.003 | 1.160 |
| Co4Ti2SiAl [33] | 0.844 | -0.111 | 0.015 | -0.013 |
Further, using the optimized unit cell of pristine CTS sample, the Co2TiSi0.5Al0.5 system was constructed by creating a 222 supercell followed by substituting 50% Si by the Al atoms, see Fig. 1(b). The substituted structure is further optimized to obtain the global minimum state, where the optimized lattice parameters are obtained as Å and Å, which are consistent with the value of 5.8047 Å in ref. [33]; however, with a slight distortion along the ’c’ axis. The calculated magnetic moment 1.56 /f.u. is found to be close to the Slater-Pauling value, 1.5 . Also, the calculated total and atom resolved magnetic moments of present sample are in very good agreement with reported values in [33], as summarized in Table 2. However, there is a significant difference from the experimentally observed magnetic moment value, 1.2 /f.u in Fig. 2(b), which could possibly be due to the presence of chemical disorder between the constituents Y and Z elements [32]. Therefore, we examine the impact of anti-site disorder through swapping of sites between Ti and Al atoms by constructing all the possible structures corresponding to a particular disorder level followed by selection of the most energetically favorable structure for subsequent calculations. Interesting, we find a systematic decrease in the total magnetic moment with increasing level of disorder, as summarized in Table I of [42], owing to the corresponding change in electronic structure. The system corresponding to 37.5% disorder-level Co2TiSi0.5Al0.5(D), renders the calculated total magnetic moment of 1.16 /f.u., which is in excellent agreement with the experimental value (1.2 /f.u.). Furthermore, using the theoretical value of total magnetic moment in equation [92], the extracted value is 233 K, which underestimates the experimental value of 278 K. This can be attributed to the empirical nature of this relation, as the structural disorder significantly alters the electronic structure and hence the magnetic correlations in the system. As evident in the Table 2, the atom-resolved calculations reveal that Co atoms have the dominant magnetic moment of 0.58 /f.u., followed by a considerable antiparallel contribution of -0.012 /f.u. from Ti, and small contributions of 0.008 and -0.003 /f.u. from Si and Al atoms, respectively. The hybridization of Co-d states with Ti-d states, hence induces a small magnetic moment at Ti site, even though in the opposite direction.
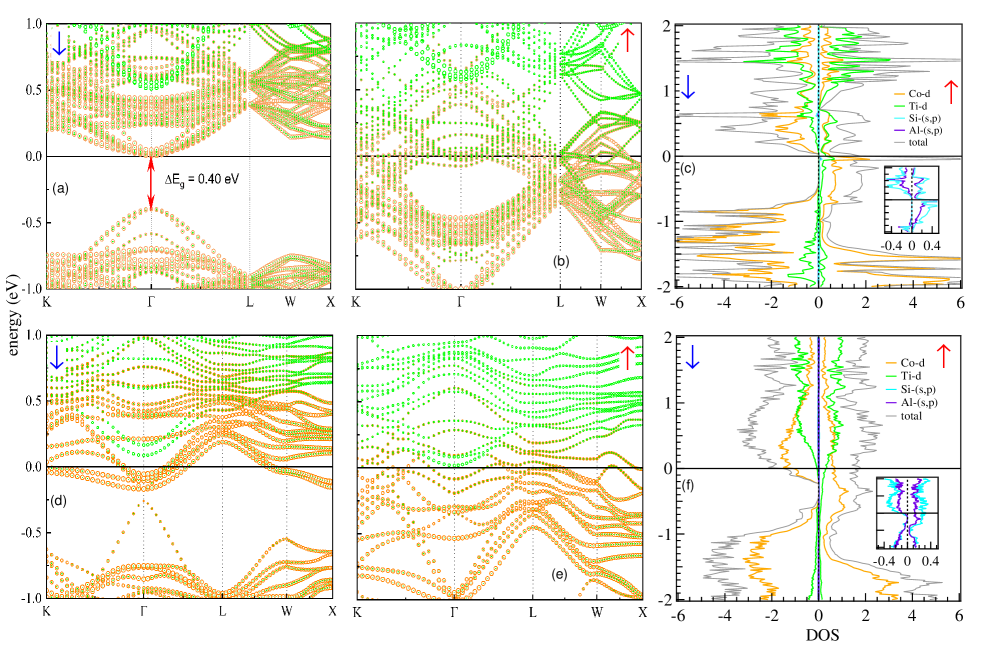
The electronic structure of Co2TiSi0.5Al0.5 sample is presented in Fig. 8 showing both atom-projected electronic band structure and density of states (DOS) for CTSA (top panel) and with disorder CTSA(D) (bottom panel). The majority spin channel shows ‘metallic’ characteristics, whereas there is a finite band gap of 0.40 eV in the minority spin states confirming the persistence of half-metallic character, as discernible from the panels (a) and (b), on Al-substitution. From the PDOS for majority spin channel, panel (c), the valence and conduction bands are densely populated with Co- and Ti- electrons, with nonzero contributions from -elements Si and Al. However, for the minority channel, there are no states in the vicinity of the Fermi level in the valence band, whereas dominant contributions from Co- and Ti- electrons are observed for the conduction band. This is in contrast with a previous study, where around 50% Fe doping in Co2TiSi was reported to exhibit loss of half-metallicity owing to the emergence of minority states at the Fermi level [92]. The spin polarization calculated from the total density of states for the Co2TiSi0.5Al0.5 sample, panel (c), renders the value 100%. This implies that upon Al substitution, even-though the band splitting in minority spin channel reduces from 0.60 eV to 0.40 eV; the half-metallic nature is still preserved. On the other hand, when the Ti-Al disorder is introduced, we observe a significant decrease in the SP value from 100% for CTSA to 8.3% for CTSA(D), symbolizing the loss of half-metallicity from the calculated bands and DOS, as shown in panels (d, e, f). The plausible cause of this drastic reduction of SP and loss of half-metallic nature could be associated to the emergence of Co- states in the vicinity of Fermi level for minority channel, in the disordered system. Here, we also find that, similar to the undistorted structure, the valence and conduction bands of majority states have dominant contributions from Co- and Ti- electrons. However, the minority channel are now composed of dominating Co- electrons as well as some nonzero Ti- contribution at the Fermi level. This study therefore highlights the profound influence of structural disorder on the electronic structure of the system, which could hence be used to tune the magnetic and transport properties of prospective materials for future spintronic applications [93].
IV Conclusions
In conclusion, our comprehensive study of the Co2TiSi0.5Al0.5 system reveals a complex interplay between structural disorder and observed magnetic properties. Through a combination of experimental measurements and theoretical simulations, we have demonstrated that the atomic disorder significantly impacts the underlying magnetic interactions, subsequently leading to the emergence of a magnetically in-homogeneous Griffiths-like phase. The Ti-Al anti-site disorder results in random allocation of different exchange-coupling constants between Co-(Ti/Al)-Co atoms, hence manifesting multiple magnetic transitions in the system. The profound field and temperature dependence of these magnetic correlations was observed in the lower magnetic fields (H 0.1 Tesla) entropy curves, exhibiting multiple peaks corresponding to these transitions. Furthermore, the calculated values of critical exponents and are and , respectively, which are slightly away from mean-field theory and deviating towards Heisenberg model. However, the corresponding magnetic interactions decay approximately as , reinforcing the notion of extended long-range magnetic ordering in the sample. The persistence of half-metallicity with Al substitution, albeit disrupted by structural disorder, underscores the role of electronic structure in determining the magnetic behavior of the system. The disorder significantly alters the electronic structure of the system, evident from the reduced magnetic moment 1.16 /f.u and spin polarization 8.3%, due to emergence of finite Co- states at Fermi level in the minority spin channel. Our findings therefore contribute to a deeper understanding of the magnetic interactions in Co-based Heusler alloys, paving the way for future explorations of their practical applications in spintronics and magnetic refrigerators.
V Acknowledgments
PY thanks MHRD for the fellowship and expresses sincere gratitude towards Dr. Ajay Kumar, Dr. Zeeshan and Madhav for useful discussions. We acknowledge the Department of Physics, IIT Delhi for providing XRD and MPMS facilities and central research facility (CRF) for FE-SEM measurements. The theoretical results presented in this work have been computed using the High Performance Computing cluster Padum, at IIT Delhi. RSD acknowledges the BRNS for financial support through DAE Young Scientist Research Award with Project Sanction No. 34/20/12/2015/BRNS..
References
- [1] I. Žutić, J. Fabian, and S. D. Sarma, Spintronics: fundamentals and applications, Rev. Mod. Phys. 76, 323 (2004).
- [2] I. Galanakis, P. H. Dederichs, and N. Papanikolaou, Slater-Pauling behavior and origin of the half-metallicity of the full-Heusler alloys, Phys. Rev. B 66, 174429 (2002).
- [3] T. Krenke, E. Duman, M. Acet, E. F. Wassermann, X. Moya, L. Manosa and A. Planes, Inverse magnetocaloric effect in ferromagnetic Ni–Mn–Sn alloys, Nat. Mater. 4, 450 (2005).
- [4] R. A. de Groot, F. M. Mueller, P. G. van Engen, and K. H. J. Buschow, New class of materials: half-metallic ferromagnets, Phys. Rev. Lett. 50, 2024 (1983).
- [5] T. Kubota, S. Tsunegi, M. Oogane, S. Mizukami, T. Miyazaki, H. Naganuma, and Y. Ando, Half-metallicity and Gilbert damping constant in Co2FexMn1-xSi Heusler alloys depending on the film composition, Appl. Phys. Lett. 94, 122504 (2009).
- [6] N. Schulz, G. Pantano, D. DeTellem, A. Chanda, E. M. Clements, M. McGuire, A. Markou, C. Felser, D. A. Arena, J. Gayles, M. H. Phan, and H. Srikanth, Unraveling the structural dependency of Weyl nodes in Co2MnGa, Phys. Rev. B 110, 054419 (2024).
- [7] Z. Gercsi and K. Hono, Ab initio predictions for the effect of disorder and quarternary alloying on the half-metallic properties of selected Co2Fe-based Heusler alloys, J. Phys. Condens. Matter 19, 326216 (2007).
- [8] S. Okamura, R. Goto, S. Sugimoto, N. Tezuka, and K. Inomata, Structural, magnetic, and transport properties of full-Heusler alloy Co2(Cr1-xFex)Al thin films, J. Appl. Phys. 96, 6561 (2004).
- [9] U. Geiersbach, A. Bergmann, and K. Westerholt, Structural, magnetic and magnetotransport properties of thin films of the Heusler alloys Cu2MnAl, Co2MnSi, Co2MnGe and Co2MnSn, J. Magn. Magn. Mater. 240, 546 (2002).
- [10] S. Okamura, A. Miyazaki, S. Sugimoto, N. Tezuka, and K. Inomata, Large tunnel magnetoresistance at room temperature with a Co2FeAl full-Heusler alloy electrode, Appl. Phys. Lett. 86, 232503 (2005).
- [11] H. J. Elmers et al., Element-specific magnetic moments from core-absorption magnetic circular dichroism of the doped Heusler alloy Co2Cr0.6Fe0.4Al, Phys. Rev. B 67, 104412 (2003).
- [12] K. Inomata, S. Okamura, R. Goto, and N. Tezuka, Large tunneling magnetoresistance at room temperature using a Heusler alloy with the B2 structure, Jpn. J. Appl. Phys. 42, L419 (2003).
- [13] H. Kubota, J. Nakata, M. Oogane, Y. Ando, A. Sakuma, and T. Miyazaki, Large magnetoresistance in magnetic tunnel junctions using Co-Mn-Al full Heusler alloy, Jpn. J. Appl. Phys. 43, L984 (2004).
- [14] S. Mizukami, D. Watanabe, M. Oogane, Y. Ando, Y. Miura, M. Shirai, and T. Miyazaki, Low damping constant for Co2FeAl Heusler alloy films and its correlation with density of states, J. Appl. Phys. 105, 07D306 (2009).
- [15] I. Gross, W. Akhtar, A. Hrabec, J. Sampaio, L. J. Martinez, S. Chouaieb, B. J. Shields, P. Maletinsky, A. Thiaville, S. Rohart, and V. Jacques, Skyrmion morphology in ultrathin magnetic films, Phys. Rev. Mater. 2, 024406 (2018).
- [16] A. Karmakar, S. Majumdar, S. Kundu, T. K. Nath, and S. Giri, A Griffiths-like phase in antiferromagnetic R0.5Eu0.5MnO3 (R = Pr, Nd, Sm), J. Phys. Condens. Matter 25, 066006 (2013).
- [17] Z. W. Ouyang, V. K. Pecharsky, K. A. Gschneidner, D. L. Schlagel, and T. A. Lograsso, Short-range anisotropic ferromagnetic correlations in the paramagnetic and antiferromagnetic phases of Gd, Phys. Rev. B 74, 094404 (2006).
- [18] R.B. Griffiths, Nonanalytic behavior above the critical point in a random Ising ferromagnet, Phys. Rev. Lett. 23, 17–19 (1969).
- [19] C. Magen, P. A. Algarabel, L. Morellon, J. P. Araújo, C. Ritter, M. R. Ibarra, A. M. Pereira, and J. B. Sousa, Observation of a Griffiths-like phase in the magnetocaloric compound Tb5Si2Ge2, Phys. Rev. Lett. 96, 167201 (2006).
- [20] A. G. Silva, K. L. Salcedo Rodríguez, C. P. Contreras Medrano, G. S. G. Lourenço, M. Boldrin, E. Baggio-Saitovitch, and L. Bufaiçal, Griffiths phase and spontaneous exchange bias in La1.5Sr0.5CoMn0.5Fe0.5O6, J. Phys. Condens. Matter 33, 065804 (2021).
- [21] A. Pal, P. Singh, V. K. Gangwar, S. Ghosh, P. Prakash, S. K. Saha, A. Das, M. Kumar, A. K. Ghosh, and S. Chatterjee, B-site disorder driven multiple-magnetic phases: Griffiths phase, re-entrant cluster glass, and exchange bias in Pr2CoFeO6, Appl. Phys. Lett. 114, 252403 (2019).
- [22] J. Nag, P. C. Sreeparvathy, R. Venkatesh, P. D. Babu, K. G. Suresh, and A. Alam, Nontrivial Topological Features and Griffith’s-Phase Behavior in CrFeVGa Probed by Experiment and Theory, Phys. Rev. Appl. 19, 044071 (2023).
- [23] K. Yadav, M. K. Sharma, S. Singh, and K. Mukherjee, Exotic Magnetic Behaviour and Evidence of cluster glass and Griffiths like phase in Heusler alloys Fe2-xMnxCrAl (), Sci. Rep. 9, 15888 (2019).
- [24] B. Bandyopadhyay, J. Nag, S. Paul, M. K. Chattopadhyay, A. Lakhani, A. Alam, and K. G. Suresh, Griffiths phase–like behavior in nearly half-metallic CoFeVAl: theory and experiment, Phys. Rev. B 109, 094433 (2024).
- [25] M. B. Salamon, P. Lin, and S. H. Chun, Colossal magnetoresistance is a Griffiths singularity, Phys. Rev. Lett. 88, 197203 (2002).
- [26] H. Zhang, Y. Wang, H. Wang, D. Huo, and W. Tan, Room-temperature magnetoresistive and magnetocaloric effect in La1-xBaxMnO3 compounds: role of Griffiths phase with ferromagnetic metal cluster above Curie temperature, J. Appl. Phys. 131, 043901 (2022).
- [27] J. Liu, T. Gottschall, K. P. Skokov, J. D. Moore, and O. Gutfleisch, Giant magnetocaloric effect driven by structural transitions, Nat. Mater. 11, 620 (2012).
- [28] P. Nehla, V. K. Anand, B. Klemke, B. Lake, and R. S. Dhaka, Magnetocaloric properties and critical behavior of Co2Cr1-xMnxAl Heusler alloys, J. Appl. Phys. 126, 203903 (2019).
- [29] G. D. Gupt, and R. S. Dhaka, Structural, magnetic and transport properties of Co2CrAl epitaxial thin films, J. Vac. Sci. Technol. A, 41, 023402 (2023).
- [30] H. C. Kandpal, G. H. Fecher, and C. Felser, Calculated electronic and magnetic properties of the half-metallic, transition metal based Heusler compounds, J. Phys. D: Appl. Phys. 40, 1507 (2007).
- [31] V. Sharma, A. K. Solanki, and A. Kashyap, Electronic, magnetic and transport properties of Co2TiZ (Z=Si, Ge and Sn): a first-principle study, J. Magn. Magn. Mater. 322, 2922 (2010).
- [32] A. Jezierski, Magnetic properties of partially ordered Co2-xPdxTiSn alloys, J. of Magn. Magn. Mater. 164, 381 (1996).
- [33] S. M. Zareii, H. Arabi, and R. Sarhaddi, Effect of Si substitution on electronic structure and magnetic properties of Heusler compounds Co2TiAl1-xSix, Physica B: Condensed Matter 407, 3339 (2012).
- [34] M. Okutani and T. Jo, Orbital magnetic moment in superlattices of transition metals, J. Phys. Soc. Jpn. 69, 598 (2000).
- [35] H. C. Kandpal, V. Ksenofontov, M. Wojcik, R. Seshadri, and C. Felser, Electronic structure, magnetism and disorder in the Heusler compound Co2TiSn, J. Phys. D Appl. Phys. 40, 1587 (2007).
- [36] H. C. Kandpal, G. H. Fecher, and C. Felser, Calculated electronic and magnetic properties of the half-metallic, transition metal based Heusler compounds, J. Phys. D Appl. Phys. 40, 1507 (2007).
- [37] A. Ślebarski, A. Jezierski, S. Lütkehoff, and M. Neumann, Electronic structure of X2ZrSn- and XZrSn- type Heusler alloys with X = Co or Ni, Phys. Rev. B 57, 6408 (1998).
- [38] A. Yamasaki, S. Imada, R. Arai, H. Utsunomiya, S. Suga, T. Muro, Y. Saitoh, T. Kanomata, and S. Ishida, Orbital angular momentum and interpretation of core-absorption magnetic circular dichroism on the band picture in Co-based Heusler alloys Co2YSn (Y = Ti, Zr, and Nb), Phys. Rev. B 65, 104410 (2002).
- [39] A. Aguayo and G. Murrieta, Density functional study of the half-metallic ferromagnetism in Co-based Heusler alloys Co2MSn (M = Ti, Zr, Hf) using LSDA and GGA, J. Magn. Magn. Mater. 323, 3013 (2011).
- [40] R. P. Jena, D. Kumar, and A. Lakhani, Scaling analysis of anomalous Hall resistivity in the Co2TiAl Heusler alloy, J. Phys. Condens. Matter 32, 365703 (2020).
- [41] S. Datta, S. Guha, S. K. Panda, and M. Kar, Correlation between critical behavior and magnetocaloric effect near paramagnetic to ferromagnetic phase transition of Co2TiAl0.75Si0.25 Heusler alloy, Phys. Status Solidi (b) 257, 2000123 (2020).
- [42] see supplementary information for more details of analysis and calculations.
- [43] G. Kresse and J. Furthmüller, efficient iterative schemes for ab initio total-energy calculations using a plane-wave basis set, Phys. Rev. B 54, 11169 (1996).
- [44] G. Kresse and D. Joubert, From Ultrasoft pseudopotentials to the projector augmented-wave method, Phys. Rev. B 59, 1758 (1999).
- [45] P. J. Webster, K. R. A. Ziebeck, Magnetic and chemical order in Heusler alloys containing Cobalt and Titanium, J. Phys. Chem. Solids, 34, 1647-1654 (1973).
- [46] G. D. Gupt, Y. Kareri, J. Hester, C. Ulrich, and R. S. Dhaka, Unveiling the magnetic structure and phase transition of Cr2CoAl using neutron diffraction, J. Appl. Phys., 134, 113901 (2023).
- [47] C. Felser, and A. Hirohata, Heusler Alloys: Properties, Growth, Applications, Springer Series of Materials Science Vol. 222, Springer International Publishing, Switzerland, (2016).
- [48] G. B. Johnston and E. O. Hall, Studies on the Heusler alloys—I. Cu2MnAl and associated structures, J. Phys. Chem. Solids 29, 193 (1968).
- [49] A. Ślebarski and J. Goraus, Electronic Structure and Thermodynamic Properties of Fe2VGa, Phys. Rev. B 80, 235121 (2009).
- [50] G. H. Fecher, H. C. Kandpal, S. Wurmehl, C. Felser, and G. Schönhense, Slater-Pauling rule and Curie temperature of Co2-Based Heusler compounds, J. Appl. Phys. 99, 08J106 (2006).
- [51] V. V. Sokolovskiy, V. D. Buchelnikov, M. A. Zagrebin, P. Entel, S. Sahoo, and M. Ogura, First-principles investigation of chemical and structural disorder in magnetic Ni2Mn1+xSn1-x Heusler alloys, Phys. Rev. B 86, 134418 (2012).
- [52] M. Baral, M. K. Chattopadhyay, R. Jangir, A. Chakrabarti, and T. Ganguli, Presence of atomic disorder and its effect on the magnetic and electronic properties of NiCrGa half Heusler alloy, J. Magn. Magn. Mater. 475, 675 (2019).
- [53] D. C. Dos Reis, E. L. T. França, V. G. De Paula, A. O. Dos Santos, A. A. Coelho, L. P. Cardoso, and L. M. Da Silva, Magnetic and Magnetocaloric Properties of DyMn2Si2 Compound with Multiple Magnetic Phase Transition, J. Magn. Magn. Mat. 424, 84 (2017).
- [54] S. Mugiraneza and A. M. Hallas, Tutorial: a beginner’s guide to interpreting magnetic susceptibility data with the Curie-Weiss law, Commun. Phys. 5, 95 (2022).
- [55] B. Bandyopadhyay, J. Nag, S. Paul, M. K. Chattopadhyay, A. Lakhani, A. Alam, and K. G. Suresh, Griffiths phase–like behavior in nearly half-metallic CoFeVAl: theory and experiment, Phys. Rev. B 109, 094433 (2024).
- [56] S. Chatterjee, S. Giri, S. Majumdar, P. Dutta, P. Singha, and A. Banerjee, Observation of Griffiths-like phase in the quaternary Heusler compound NiFeTiSn, J. Phys. Condens. Matter 34, 295803 (2022).
- [57] A. Slebarski, M. Fijalkowski, J. Deniszczyk, M. M. Maska, and D. Kaczorowski, Off-stoichiometric effect on magnetic and electron transport properties of Fe and Ni2VAl: a comparative study, Phys. Rev. B 109, 165105 (2024).
- [58] M. Ulrich, J. García-Otero, J. Rivas, and A. Bunde, Slow relaxation in ferromagnetic nanoparticles: indication of spin-glass behavior, Phys. Rev. B 67, 024416 (2003).
- [59] W. Jiang, X. Zhou, G. Williams, Y. Mukovskii, and R. Privezentsev, The evolution of Griffiths-phase-like features and colossal magnetoresistance in La1-xCaxMnO3 across the compositional metal–insulator boundary, J. Phys. Condens. Matter 21, 415603 (2009).
- [60] E. V. Sampathkumaran, N. Mohapatra, S. Rayaprol, and K. K. Iyer, Magnetic Anomalies in the Spin-Chain Compound Sr3CuRhO6: Griffiths-Phase-like Behavior of Magnetic Susceptibility, Phys. Rev. B 75, 052412 (2007).
- [61] K. Anand, M. Alam, A. Pal, P. Singh, S. Kumari, A. G. Joshi, A. Das, A. Mohan, and S. Chatterjee, Existence of Griffiths Phase and unusual spin dynamics in double perovskite Tb2CoMnO6, J. Magn. Magn. Mater. 528, 167697 (2021).
- [62] E. M. Levin, V. K. Pecharsky, and K. A. Gschneidner, Unusual magnetic behavior in Gd5(Si1.5Ge and Gd5(Si2Ge2), Phys. Rev. B 62, R14625 (2000).
- [63] M. Földeáki, G. Higelin, L. Köszegi, B. Schwendemann, and F. Walz, The behaviour of the imaginary component of the ac magnetic susceptibility in disaccommodation experiments, J. Magn. Magn. Mater. 46, 350 (1985).
- [64] P. Nehla, Y. Kareri, G. D. Gupt, J. Hester, P. D. Babu, C. Ulrich, and R. S. Dhaka, Neutron diffraction and -magnetic properties of Co2Cr1-xTixAl Heusler alloys, Phys. Rev. B 100, 144444 (2019).
- [65] J. Panda, S. N. Saha, and T. K. Nath, Critical behavior and magnetocaloric effect in Co50-xNixCr25Al25 (x=0 and 5) full Heusler alloy system, J. Alloys Compd. 644, 930 (2015).
- [66] B. K. Banerjee, On a Generalised Approach to First and Second Order Magnetic Transitions, Phys. Lett. 12, 16 (1964).
- [67] J. Y. Law, V. Franco, L. M. Moreno-Ramírez, A. Conde, D. Y. Karpenkov, I. Radulov, K. P. Skokov, and O. Gutfleisch, A quantitative criterion for determining the order of magnetic phase transitions using the magnetocaloric effect, Nat. Commun. 9, 2680 (2018).
- [68] J. Y. Law, Á. Díaz-García, L. M. Moreno-Ramírez, and V. Franco, Increased magnetocaloric response of FeMnNiGeSi high-entropy alloys, Acta Mater. 212, 116931 (2021).
- [69] V. Franco, R. Caballero-Flores, A. Conde, Q. Y. Dong, and H. W. Zhang, The influence of a minority magnetic phase on the field dependence of the magnetocaloric effect, J. Magn. Magn. Mater. 321, 1115 (2009).
- [70] V. Franco, A. Conde, J. M. Romero-Enrique, and J. S. Blázquez, A universal curve for the magnetocaloric effect: an analysis based on scaling relations, J. Phys. Condens. Matter 20, 285207 (2008).
- [71] Q. Y. Dong, H. W. Zhang, J. R. Sun, B. G. Shen, and V. Franco, A phenomenological fitting curve for the magnetocaloric effect of materials with a second-order phase transition, J. Appl. Phys. 103, 116101 (2008).
- [72] V. K. Pecharsky and K. A. Gschneidner, Magnetocaloric effect from indirect measurements: magnetization and heat capacity, J. Appl. Phys. 86, 565 (1999).
- [73] A. Arrott and J. Noakes, Approximate equation of state for Nickel near its critical temperature, Phys. Rev. Lett. 19, 786 (1967).
- [74] J. S. Kouvel and J. B. Comly, Magnetic equation of state for nickel near its curie point, Phys. Rev. Lett. 20, 1237 (1968).
- [75] S. N. Kaul, Static critical phenomena in ferromagnets with quenched disorder, J. Magn. Magn. Mater. 53, 5 (1985).
- [76] Yu Liu and C. Petrovic, Three-dimensional magnetic critical behavior in CrI3, Phys. Rev. B 97, 014420 (2018).
- [77] L. Zhang, B. S. Wang, Y. P. Sun, P. Tong, J. Y. Fan, C. J. Zhang, L. Pi, and Y. H. Zhang, Critical behavior in the antiperovskite ferromagnet AlCMn3, Phys. Rev. B 85, 104419 (2012).
- [78] B. Widom, Equation of state in the neighborhood of the critical point, J. Chem. Phys. 43, 3898 (1965).
- [79] A. K. Pramanik and A. Banerjee, Critical behavior at paramagnetic to ferromagnetic phase transition in Pr0.5Sr0.5MnO3: a bulk magnetization study, Phys. Rev. B 79, 214426 (2009).
- [80] G. D. Gupt, P. D. Babu, and R. S. Dhaka, Complex magnetic interactions and critical behavior analysis in quaternary CoFeV0.8Mn0.2Si Heusler alloy, J. Appl. Phys., 135, 083905 (2024).
- [81] S. Tarhouni, R. M’nassri, A. Mleiki, W. Cheikhrouhou-Koubaa, A. Cheikhrouhoua and E. K. Hlil, Analysis based on scaling relations of critical behaviour at PM–FM phase transition and universal curve of magnetocaloric effect in selected Ag doped manganites, RSC Adv. 8, 18294 (2018).
- [82] M. E. Fisher, S.-K. Ma, and B. G. Nickel, Critical exponents for long-range interactions, Phys. Rev. Lett. 29, 917 (1972).
- [83] M. E. Fisher, The renormalization group in the theory of critical behavior, Rev. Mod. Phys. 46 597 (1974).
- [84] S. F. Fischer, S. N. Kaul, and H. Kronmuller, Critical magnetic properties of disordered polycrystalline Cr75Fe25 and Cr75Fe30, Phys. Rev. B 65, 064443 (2002).
- [85] S. Roy, N. Khan, R. Singha, A. Pariari, and P. Mandal, Complex exchange mechanism driven ferromagnetism in half-metallic Heusler Co2TiGe:evidence from critical behavior, Phys. Rev. B 99, 214414 (2019).
- [86] A. Rahman, M. Rehman, Zhang, D. Zhang, M. Zhang, X. Wang, R. Dai, Z. Wang, X. Tao, L. Zhang, and Z. Zhang, Critical behavior in the half-metallic Heusler alloy , Phys. Rev. B 100, 214419 (2019).
- [87] A. Rahman, M. Rehman, H. Zhao, W. Liu, J. Wang, Y. Lu, K. Ruan, R. Dai, Z. Wang, X. Tao, L. Zhang, and Z. Zhang, Itinerant magnetism in the half-metallic Heusler compound : Evidence from critical behavior combined with first-principles calculations, Phys. Rev. B 103, 094425 (2021).
- [88] D. Kim, B. Revaz, B. L. Zink, F. Hellman, J. J. Rhyne, and J. F. Mitchell, Tricritical point and the doping dependence of the order of the ferromagnetic phase transition of La1-xCaxMnO3, Phys. Rev. Lett. 89, 227202 (2002).
- [89] P. Klaer, M. Kallmayer, C. G. F. Blum, T. Graf, J. Barth, B. Balke, G. H. Fecher, C. Felser, and H. J. Elmers, Tailoring the electronic structure of half-metallic Heusler alloys, Phys. Rev. B 80, 144405 (2009).
- [90] M. Baral, V. Srihari, A. Bhakar, M. K. Chattopadhyay, P. Tiwari, A. Chakrabarti, and T. Ganguli, Revealing superstructure ordering in Co1+xMnSb Heusler alloys and its effect on structural, magnetic, and electronic properties, Phys. Rev. B 105, 184106 (2022).
- [91] A. W. Carbonari, W. Pendl, R. N. Attili, and R. N. Saxena, Magnetic hyperfine fields in the Heusler alloys Co2YZ (Y=Sc, Ti, Hf, V, Nb; Z=Al, Ga, Si, Ge, Sn), Hyperfine Interact. 80, 971 (1993).
- [92] Y. Jin, J. Waybright, P. Kharel, I. Tutic, J. Herran, P. Lukashev, S. Valloppilly, and D. J. Sellmyer, Effect of Fe substitution on the structural, magnetic and electron-transport properties of half-metallic Co2TiSi, AIP Adv. 7, 055812 (2017).
- [93] K. Elphick, W. Frost, M. Samiepour, T. Kubota, K. Takanashi, H. Sukegawa, S. Mitani, and A. Hirohata, Heusler Alloys for Spintronic Devices: Review on Recent Development and Future Perspectives, Sci. Technol. Adv. Mater. 22, 235 (2021).