The impact of social media on polarization in the society
Abstract
The advent of social media platforms has revolutionized information consumption patterns, with individuals frequently engaging in these platforms for social interactions. This trend has fostered an environment where people gravitate towards information that aligns with their preconceived notions, leading to the formation of echo chambers and polarization within the society. Recently introduced activity-driven models have been successful in capturing the dynamics of information propagation and polarization. The present study uses this model to explore the impact of social media on a polarized society. By considering the varying influence of media, ranging from exposing individuals to contradictory views to reinforcing existing opinions, a supercritical pitchfork bifurcation is observed, triggering a transition from consensus to polarization. The transition points from polarization to consensus are derived analytically and is validated through numerical simulations. This research sheds light on the complex interplay between social media dynamics and societal polarization.
keywords:
Opinion dynamics , Polarization , Supercritical pitchfork bifurcation , Social media.[label2]organization=The Uncertainty Lab, Department of Applied Mechanics & Biomedical Engineering, Indian Institute of Technology Madras, city=Chennai, postcode=600036, state=Tamil Nadu, country=India
[label3]organization=Complex Systems and Dynamics Group, Indian Institute of Technology Madras, city=Chennai, postcode=600036, state=Tamil Nadu, country=India
Investigates the effect of social media on a polarized society using activity-driven model.
Individuals are exposed to contradictory views as well as views which align with their existing belief.
A supercritical pitchfork bifurcation is observed as the system transitions from consensus to polarization.
Transition points are derived analytically and validated through numerical simulations.
1 Introduction
The increase in the usage of social media platforms like Facebook, Twitter and Instagram has not only changed the way people consume information [1, 2] but also how information propagates through society, as this has given people the freedom to express themselves, communicate with other individuals around the world and participate in conversations. Social media platforms provide individuals to voice their opinions, encourage inclusiveness and have democratized information flow, beyond official channels. Unfortunately, an unsavoury side to this free flow of information is that these platforms have not only enabled the spread of misinformation [3, 4] but coupled with echo chambers [5, 6, 7, 8], have enabled faster propagation of this misinformation. In social media parlance, echo chambers constitute a network of closely connected individuals who share common beliefs and serve to amplify information that is spread by one of their cronies. The existence of these cliques enable faster propagation of an idea or information through the society and can pose significant challenges to regulatory bodies, when the information have the potential to create societal unrest. There is therefore significant interest in modelling the dynamics of information propagation through social media networks. Few recent models of opinion dynamics [9, 10, 11] have been successful in capturing the features of echo chambers quantitatively. The recommendation engine of the online social media platforms accelerates the formation of echo chambers as it allows users to interact with like minded peers [12, 13, 14, 15].
Polarization and the formation of echo chambers in online social media platforms intensifies during debates involving controversial issues and significant political events [16] such as elections [17], street protests [18], and societal issues that capture public attention [19]. Although echo chambers are not permanent in social media, recent studies highlight the negative impact as they become the breeding ground for the spread of “fake news”[20]. Several attempts have been made to prevent the formation of echo chambers. An introduction of random dynamical nudge depolarizes existing echo chambers and also help in preventing the formation of new echo chambers [21]. This has been shown to be applicable for two well known models of opinion dynamics. Another recent study also showed that when individuals in an online social platform are slightly nudged to form new connections, it significantly avoids the formation of polarization [22].
Opinion dynamics model can be classified as discrete or continuous based on the nature of its state variable. Voter model [23] is the simplest discrete model in which opinion of each individual is described as a binary state variable and is appropriate in a bi-party election. As there are only two states, the rules of the model is described by the transition rates [24], the probability by which opinion of an individual changes from one state to another. This model has been applied to heterogeneous networks [25, 26] and time-varying networks [27, 28]. Voter model has also been studied in the presence of noise [29]. Several attempts have been made to extend the two state variable models to multi state discrete variable models to make voter-like model represent realistic scenarios [30]. Surprisingly, multi-state variable opinion dynamics models behave in a similar way as that of two state models.
In models with continuous opinions, an individual is not restricted to have opinions on one or more topics within a set of possibilities. Instead, the state variable is defined on a finite interval i.e., where is the opinion of the -th individual [31]. One of the popular opinion dynamics model is the Deffuant model [32], which assumes that a pair of individuals interact only if their opinions are similar, i.e., . This model is also known as bounded confidence model [33] and depending on , this model can reproduce consensus, bimodal or multi-modal opinion distributions. Bounded confidence model has been extended to networks [34], multi-dimensional opinions [35] and its dynamics has been studied in the presence of noise [36] and also neighbourhood effects [37]. This model has also been extended to nonlinear case, called as nonlinear bounded confidence model and explored in the presence of both persuadable individuals and zealots [38]. Recently, studies focussed on opinion dynamics models for interdependent topics in the presence of individuals who are less prone to change their mind, referred to as zealots [39]. This model has also been extended for the case of complex networks [40]. The opinion dynamics model introduced by Baumann et al.[9] is an activity-driven model, and has been successful in reproducing the characteristics shown by empirical data. This model incorporates homophily factor, which is the tendency of the individuals to interact with people of similar opinions, and is able to capture consensus, radicalization and polarization. This activity-driven model has also been extended to bi-layer complex networks [41]. A recent study has further refined this activity-driven model by assuming that the agents only interact with their neighbors directly, instead of distant or global agents [42].
A graphical representation of states of polarization, radicalization and consensus in a network of individuals is shown in Fig. 1(a), (b) and (c) respectively.
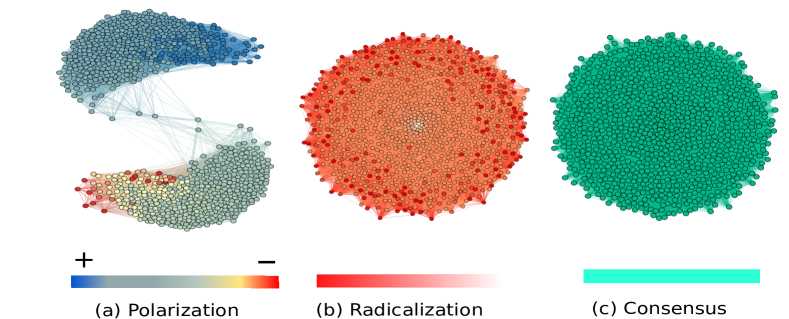
Here, the state is taken to be continuous. A network that is polarized consists of two distinct clusters representing the two opposite opinions on a given issue. Extreme opinions on either side is represented by darker shades (of blue and red), with the extremities of the state marked as and in the colorbar of Fig. 1(a). Within each clusters, despite a collective inclination towards a specific viewpoint, the intensity of an individual opinion varies. This spectrum of intensity is visualized through the gradation of color, with darker tones of blue or red signifying extreme opinions within each cluster. In the case of radicalization, the opinions of the individuals are absorbed by either side of the viewpoint, shown in varying shades of red in Fig. 1(b) whereas in consensus, the individuals remain neutral and do not have an opinion on a given issue, shown schematically in green in Fig.1(c).
The present study utilizes the mathematical model introduced by Baumann et al.[9] to examine how selective exposure of an individual to media content impacts opinion formation. Selective exposure, where individuals favor media aligning with their emotional and cognitive preferences, often leads to confirmation bias [43], a key driver of opinion polarization. Furthermore, this study delves into scenarios where individuals actively seek information contradicting their own perspectives. Through analytical and numerical studies, it is shown that society undergoes a transition from polarized to a consensus state when exposed to opposing views. The paper is structured as follows: Section 2 provides a background on the activity-driven model which is used in this study. Results and related discussions are presented in Section 3. The salient outcomes of this study are summarized in the concluding section in Section 4.
2 Mathematical model
The activity-driven (AD) model, proposed by Baumann et al. [9] is used for exploring the influence of social media on polarization within society. This model effectively captures certain aspects of opinion dynamics, such as the formation of echo chambers and polarization as a result of interactions in a network of individuals.
2.1 Background
The governing equations for the evolution of opinions according to the AD model, is given by
| (1) |
Here, each of the agents in a network, denoted as , represent a time evolving opinion (state variable) denoted by , is the interaction strength between any two agents and , and denotes controversialness [9] of a given topic. Additionally, this model assumes that each topic can attain polarization into two opposing stands - for or against. The stance taken by each agent is determined by the sign of , and is mathematically denoted by the signum function . The magnitude of reflects the strength of conviction of an agent towards the topic. The interactions among the agents are described through the temporal adjacency matrix denoted as . Specifically, signifies an input from agent to agent , while indicates no such input. The probabilistic factor of reciprocity, , determines the likelihood that a connection between agents is mutually influential. When due to reciprocity, both agents participate in updating their opinions based on this interaction. Conversely, if the interaction lacks reciprocity (i.e., only one direction or ), the connection is unidirectional and an update of opinions occurs only in the agent downstream of the connection. Additionally, in the model [44, 45], each agent possess an activity level, denoted by and only active agents can interact with other individuals. This factor is assumed to be different for each individual and therefore follows a distribution. Empirical data reveals that the probability distribution of follows a power-law [44, 46], given by . The parameter is the power-law exponent which controls how steeply the activity probability distribution decreases. If at time , where denotes the minimum activity level, the agent interacts with other individuals based on a weighted probability given by, . Here, the parameter serves as the homophily factor, signifying the inclination of agents with similar opinions to interact with each other. Specifically, when , there is no preference for interaction based on similarity of opinions. However, for , it implies that agents sharing similar viewpoints are more inclined to interact. The weighted probability is formulated to depict a power-law decay of connection probabilities. This formulation results in a situation where there is only a minimal probability for agents with divergent opinions to engage in interactions. Thus, capture the activity-driven model of opinion dynamics.
(a) (b) (c)
(d) (e)
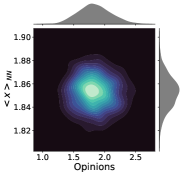
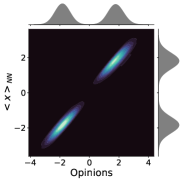
When active agents have an equal probability of interacting with other agents, the network has the potential to radicalize, resulting in all agents adopting the same stance (as illustrated in Fig. 2(b)). Conversely, if agents with similar opinions interact, this bias favours polarization of viewpoints and leads to the creation of echo chambers, as shown in Fig. 2(c). In the absence of any interactions (), the individuals maintain a neutral opinion; see Fig. 2(a). When users tend to establish connections more frequently with peers who hold similar opinions, it leads to the formation of echo chambers, facilitating the exchange of information among like-minded individuals. This phenomenon, observed at a network scale, is characterized by a correlation between an individual’s opinion and the average opinions held by their closest neighbors, and is mathematically given by [9]. Here, represents the elements of the adjacency matrix obtained after Eq. 1 is integrated for a long time so that steady state condition is achieved and is the total number of connections of agent . Figs.2(d)-(e) show colored contour maps of the density of users in plane. The resulting bimodal distribution as shown in Fig.2(e) indicates the formation of echo chambers, whereas a unimodal distribution shown in Fig.2(d) indicates that the agents share a similar opinion and depicts radicalization in the society. Note that radicalization is a distinct state from consensus, with the latter state being characterized by no significant difference in the state variables within the network.
2.2 Social media effects
To take into account the effect of social media on a group of individuals who have tendency to be polarized, Eq.(1) is modified as
| (2) |
The third term in Eq.(2) describes the influence of selective information from the media, which is a central focus of this study. This term in the equation is inspired by everyday experiences on social media platforms, such as video recommendations on YouTube. When one watches a video, the platform tends to suggest similar ones based on one’s viewing history and this can have adverse effects like intensifying political polarization [47]. This is modeled as , where is a constant, denoting the strength or the magnitude of impact that the social media exerts on the opinions of an agent and signifies various factors such as the persuasive power, prominence, or intensity of the social media’s influence on the opinion of the agents. is assumed to be a tan hyperbolic function, commonly chosen due to its symmetric nature [9, 48, 41]. The parameter is the willingness (converse of resistance) of individuals to be influenced by social media and reflects the degree to which the influence of the social media affects the viewpoint of the individuals.
When , the second term in Eq.(2) reinforces an agent’s own opinion. Conversely, for , this term operates inversely, leading to a scenario where positive (negative) values of result in a decrease (increase) in . This indicates that media tends to either strengthen or weaken the opinion of each agent, depending on the sign of . As discussed in [9], in Eq.(2) is approximated by its time average . By taking the time average, it is assumed that the rapid dynamics and fluctuations within the network average out or become negligible. Eq.(2) can now be rewritten as
| (3) |
The -th element of the time-averaged adjacency matrix is, [9], which when averaged over all the activities in the system can be written as
| (4) |
Here, is the average activities which is calculated by taking the first moment of :
| (5) |
The expression for is substituted in the above equation and simplified to get as,
| (6) |
Substituting Eq.(4) in Eq.(3), leads to
| (7) |
Eq.(2) is integrated numerically using fourth order Runge-Kutta method with a step size of 0.01 and initial opinions uniformly distributed in . The parameters are set to , , and unless mentioned otherwise. In the absence of effects of social media, i.e. when , Eq.(2) reproduces the results obtained in [9].
3 Results
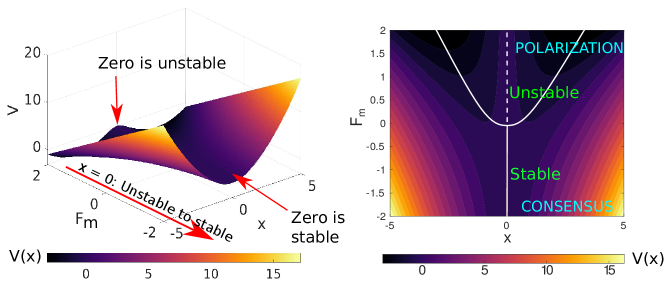
The behaviour of the system described by Eq.(7) can be better understood by defining a metric and referred to as the potential function. For a first-order system of the form , the potential is defined as a scalar function, given by [49] and can be viewed as an energy function, with its topology helping in describing the dynamical behavior of the system. The definition can be extended to higher order systems and the scalar definition of the function ensures a mapping from a multi-dimensional state space to the scalar space, enabling an easier appreciation of the overall dynamics of the system. Specifically, any point on the function where the gradient is zero defines an equilibrium point, whose stability can be examined by the nature of the gradient of the function in their neighborhood. Following this definition, the potential function for the system in Eq.(7) can be defined as [41]
| (8) |
where is the effective force, appearing on the right-hand side of Eq.(7) and can be shown to be
| (9) |
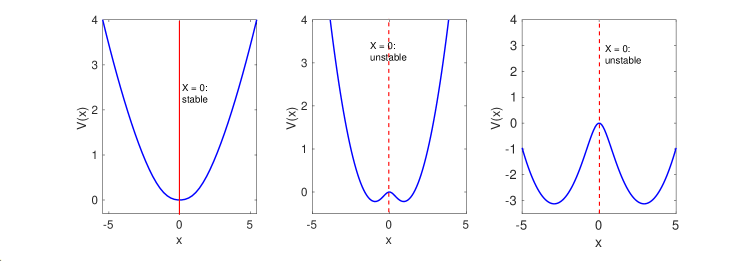
The plot in Fig. 3(a) illustrates the relationship between , , and . An inspection of this figure reveals that the extrema - locations where the gradient of the potential function is zero - lies along the line. For regions when , the point lies in a valley and signifies stable equilibrium, while for regions when , the point lies at the peak and corresponds to unstable configuration. In the latter case, while is unstable, there exists two additional stable equilibrium points. It is to be emphasized here that a stable equilibrium at implies no further information propagation and hence corresponds to a stable state of consensus.
(a) (b)
(c) (d) (e)
These features are better explained through the contour plot in the plane shown in Fig. 3(b). Here, the full white lines represent the stable equilibrium points, while the dashed lines represent the unstable equilibria. This figure demonstrates that as transitions from negative to positive values, the stable consensus state at zero (marked in solid white line) becomes unstable, and simultaneously results in the birth of two additional stable equilibrium points on either side of . The formation of these coexisting stable points implies polarization. This can also be observed from the potential plots in Fig.3(c), (d) and (e) for , and respectively. This transition mirrors the characteristics of a supercritical pitchfork bifurcation. Hence it can be concluded that, exposure to information conflicting with individual opinions tends to facilitate consensus formation, whereas gradual exposure to information aligning with preexisting beliefs triggers a supercritical pitchfork bifurcation, ultimately leading to polarization. In the subsequent sections, the cases where and are explored in detail to study the influence of social media on polarization prevailing in the society.
3.1 Negative media influence:
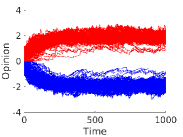
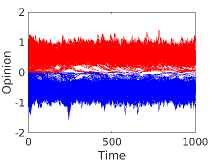
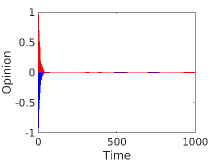
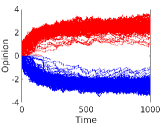
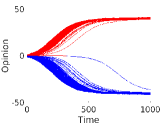
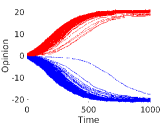
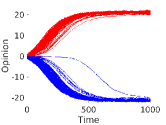
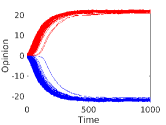
This section analyzes the effects of negative social media influence (i.e. when ) on a society which has the tendency to polarize. The numerical values of and are fixed at , which ensures that the society is in polarized state in the absence of external effects. Eq. (2) is numerically integrated for different values of and . Fig. 4 shows the temporal evolution of the opinion of all the agents, denoted by their state variable , for different values of and . The top panel in Fig. 4 depicts the time histories of for fixed values of but for three distinct values of , while the bottom panel shows the temporal evolution of the same fixed values of but two distinct values of .
(a) (b) (c)
(d) (e)
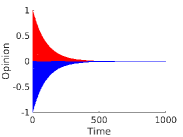
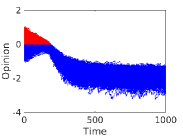
From the top panel of Fig. 4, it is observed that as becomes more negative for a fixed value of , the echo chambers depicted as two groups of time series - those with (shown in red) and those with (shown in blue), come closer to each other and beyond a critical value of , the polarization disappears with both clusters attaining the state of , representing consensus; see Fig. 4(c). From Figure 4 (d) and (e), it is seen that as the value of is increased for a fixed value of , the society reaches consensus at a much faster rate.
A physical interpretation of these results are as follows: A high negative media influence () creates an environment where agents are exposed to dominant but opposite narrative, and as a result become aware of diverse perspectives and gradually move towards a consensus. Additionally, a society where individuals are more open-minded (high value of ) and willing to consider opposing views tends to reach a consensus more rapidly. This underscores the importance of individual openness and willingness to embrace diverse opinions in fostering societal unity and shared understanding.
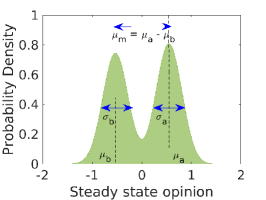
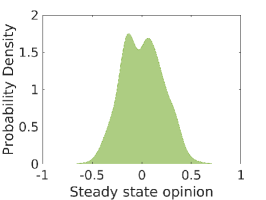
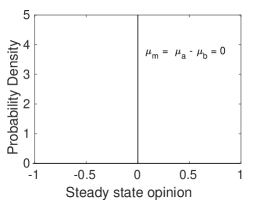
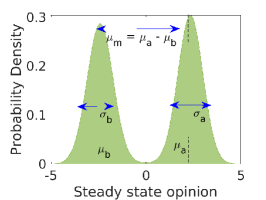
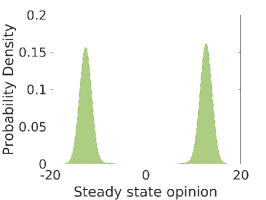
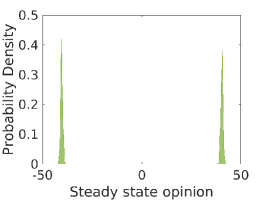
The collective dynamical behavior of the agents in the network can be analyzed through the stationary probability density function (pdf) of the state variables, after sufficiently long time integration for the coupled equations of the network. Fig. 5 shows the pdf for a fixed value of and for different cases of . From the figure it is observed that for less negative values of , the resulting pdf is bimodal, indicating the formation of echo chambers in a polarized society; see Fig. 5(a) . As becomes more negative, the two peaks in the pdf move towards each other (see Fig.5(b)) and finally results in a Dirac-Delta pdf as seen in Fig. 5(c). The Dirac-delta pdf indicates the formation of consensus in the society. This transition in the pdf as is varied can be quantified by defining the following order parameters: Let denote the distance between the two peaks in the pdf [21], where and are the position of the two peaks. and be the spread of opinions with respect to and respectively and let . These order parameters are indicated in Fig. 5(a). The order parameters and for a fixed value of and varying is shown in Fig. 6.
(a) (b) (c)
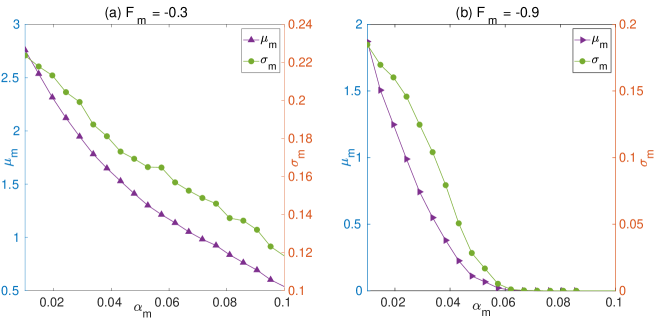
As the value of is increased, both and decreases. This indicates that the two peaks in the bimodal pdf move closer to each other. Additionally, it can be observed that the spread of opinions about the mean value and decreases for ; see Fig. 6(a). But for , as the value of is increased, and decreases and finally makes a transition to zero as shown in Fig. 6(b). This zero value indicates a Dirac-delta pdf as seen in Figure 5(c). In summary, these order parameters, and , quantify the convergence or divergence of opinions within a society influenced by social media and individual openness to diverse perspectives. As individuals become more receptive to opposing views, societal segregation decreases, leading to a narrowing of opinion differences and, ultimately, to consensus.
The evolution of opinions for a wide range of values of and in the parameter space is next explored. For each point in the parameter space in the plane, Eq.(2) is numerically integrated till the system reaches the steady state. At the steady state time , average of the absolute opinions is calculated. The metric is treated as the order parameter for further investigations. It is observed that by increasing both and , the society undergoes a transition from polarization to consensus. A polarized state is obtained when , whereas implies a state of consensus. Fig. 7 showcases the results obtained from this analysis.
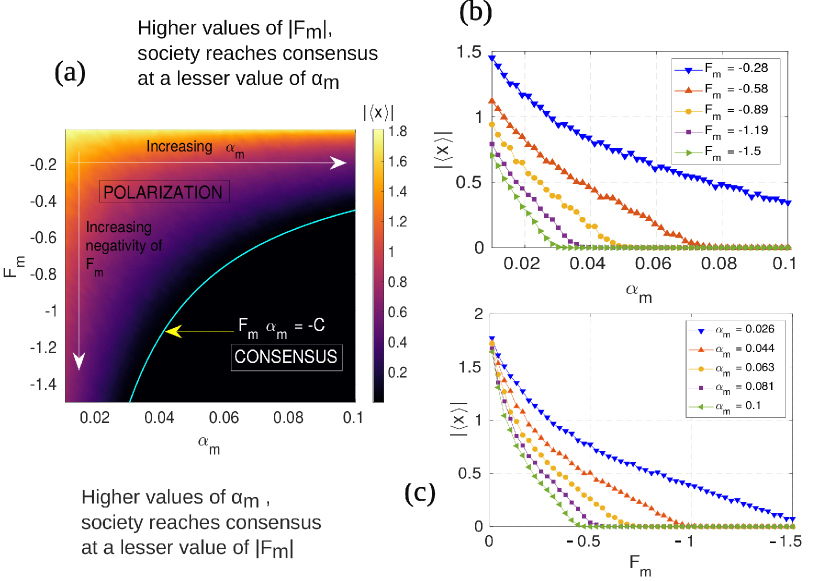
Fig.7(a) shows the parameter plot of obtained for a wide range of values in the parameter space . When , an increase in leads to a gradual decrease in . However, when , further increments in eventually reaches a threshold where becomes zero, indicating a transition from polarized state to consensus. This result can also be observed in Fig. 7(b), where is plotted for different values of against . Note that for increasingly negative values of , the threshold of required for to reach zero decreases. Fig. 7(c) specifically displays the relationship of as varies across different values. Notably, the value of for which the system transitions from polarization to consensus shifts to the left (see Fig. 7(c)) when is set at higher levels.
Next, the critical transition points indicating the shift from polarization to consensus triggered by the influence of social media effects is derived using the procedure outlined in [9]. To obtain the transition point, the Jacobian of Eq.(7) is evaluated at the fixed point , and is given by
| (10) |
The largest eigenvalue of denoted by is given as
| (11) |
As the consensus state destabilizes when becomes greater that zero, is the critical case. This leads to the following critical condition
| (12) |
and in the limit of , Eq. (12) leads to the condition
| (13) |
The above equation can be written in a compact form as where . This equation which separates the state of network polarization from consensus is plotted in Figure 7(a), shown as a cyan line, and validates the results obtained through numerical simulations. In the absence of social media effects (), Eq.(3) in [9] is obtained.
3.2 Positive media influence:
The case of is investigated next. Here, the media reinforces the existing opinions of the agents and therefore, the social media provides a reinforcing influence in a society that has the tendency to polarize. As in the earlier case, the numerical values of and are taken to be . Eq.(2) is numerically integrated for different values of and and the results are shown in Fig. 8.
(a) (b) (c)
(d) (e) (f)
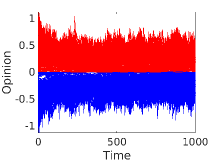
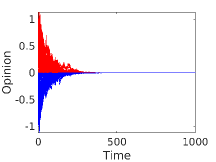
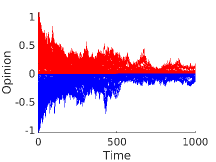
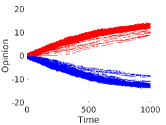
The top panel of Fig. 8 shows the evolution of opinions of all the agents for three cases of for a fixed value of . As can be seen, with an increase in , there is an observable rise in the steady-state opinions. Simultaneously, the divergence within the echo chambers diminishes, converging towards a scenario where opinions among all agents within each echo chamber tend to approach a common steady state opinion value. Different behaviour is observed when is varied for a constant . From the bottom panel of Fig.8, it is observed that for higher values of , the steady state opinions remain same for all values of but the time taken to reach the steady state reduces as increases.
(a) (b) (c)
The collective behaviour exhibited by varying and can be better understood by plotting the pdf of the steady state values of the opinions. Fig. 9 shows the pdfs of steady state values of opinions plotted for different with . Across all values of , the pdf consistently shows a bimodal nature, signaling polarization within the society; this is in contrast to the behavior observed in Fig. 5. Upon increasing the value of , there is a noticeable amplification in the separation between the peaks, accompanied by an increased peak sharpness within the distribution. This is effectively captured by the parameters , , , and shown in Fig. 9(a).
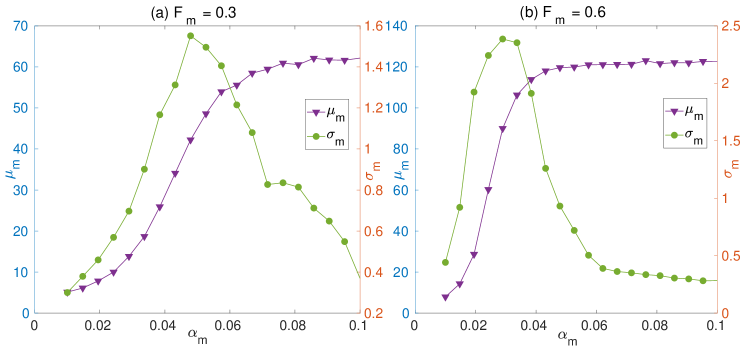
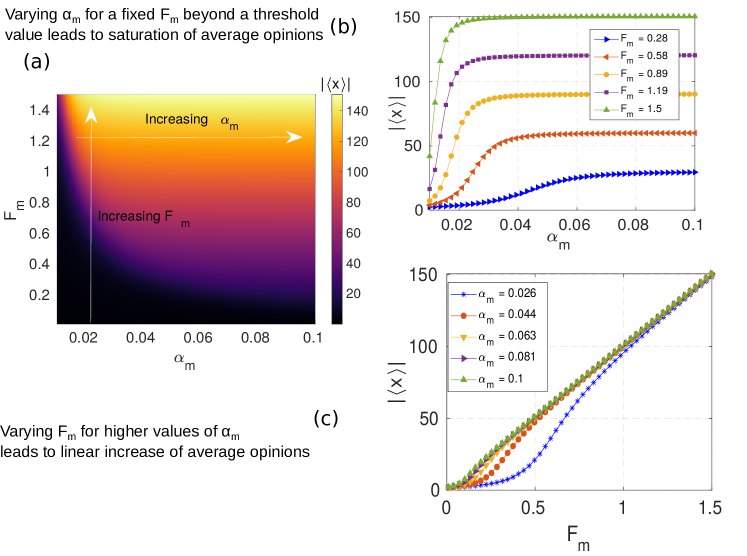
Fig. 10 shows the variation of and with for two different values of . As increases, the parameter , representing the distance between the peaks, initially increases before stabilizing at a constant value. However, a distinct trend is observed in . Initially, an increase in results in an escalation of . This initial widening of implies that as individuals become more receptive to varied viewpoints, the range of opinions within each echo chamber becomes broader. The consistent value of is counterbalanced by a decline in . This decrease means that although the distance between the peaks remains constant, the opinions within these clusters become more concentrated or tightly packed around each peak.
The findings presented in Fig. 8 are based on specific values of and . To gain a comprehensive understanding of how positive media influence () impacts societal polarization, an analysis is conducted across the - parameter space. The range of values of and is taken to be and respectively. For each point in the parameter space, Eq.(2) is evaluated till the steady state is reached. Once the system reaches steady state, as defined in Fig. 7 is evaluated for every point in the parameter space and the resulting plot is shown in Fig. 11(a). The color code shown in Fig. 11(a) represents the value of calculated at steady state. For a constant and varying , the behavior of shows a progressive increase until it reaches a particular value, upon which it stabilizes. This trend is depicted in Fig. 11(a), where, initially, there is a shift in color gradation for varying , followed by a stable color representation; refer to the colorbar for values. A higher corresponds to a greater saturated value for . These observations are also presented in Fig. 11(b), where is plotted for various values of with varying . It should also be noted that, the threshold value of at which stabilizes is less for a higher value of .
Next, the change in for a fixed and varying is analysed. As shown in Fig. 11(a), the progressive rise in corresponds to a consistent increase in . This trend is visually apparent through the transition in color from black to yellow ( from bottom to top) , indicating a shift from lower to higher values. In Fig. 11(c), is plotted for different values of against . For higher values of , increase in with is approximately linear (see green line in Fig. 11(c)) whereas, for lower values of , the linear trend is observed for higher values of . This suggests that individuals who are more open-minded tend to be receptive to media input and are influenced even with relatively weaker media impact. Conversely, individuals less open to new perspectives require a stronger media influence for alignment with the viewpoint in the social media.
4 Conclusion
The interaction patterns on social media platforms often foster polarization and the formation of echo chambers. For instance, research indicates that recommendation algorithms used by popular social media platforms like YouTube can intensify political polarization. Furthermore, studies suggest that when individuals have significant control over the information they consume, it tends to deepen partisan divisions within society [50]. This phenomenon arises from people’s inclination to seek information that aligns with their existing beliefs. Given the significant influence of social media in shaping public opinion, this study uses a recent opinion dynamics model that incorporates the concept of homophily. The aim is to investigate how social media usage affects a society prone to polarization. The findings reveal that when individuals select information based solely on their preferences, it reinforces existing polarization. However, when individuals remain receptive to ideas which are contradictory to their own beliefs, a shift toward consensus is observed via supercritical pitchfork bifurcation. This underscores the dual nature of social media, which has the potential to either mitigate or amplify polarization within society. Consequently, individuals consuming information on social media should exercise caution and not solely rely on recommendation algorithms. Additionally, this study reveals that a society that is less zealot and more open to ideas that are divergent from their own beliefs are less likely to lead to a polarized society.
Acknowledgments
The authors would like to acknowledge the funding received from the Ministry of Education, Government of India towards Center on Complex Systems and Dynamics under the Institute of Eminence scheme.
Author Declarations
Conflict of Interest
The authors have no conflicts of interest to declare.
Author Contributions
SP:Conceptualization (equal); Formal analysis (equal); Investigation (lead); Methodology (equal); Software (lead); Validation (equal); Visualization (lead); Writing – original draft (equal).
SG: Conceptualization (equal); Funding acquisition (lead); Investigation (supporting); Methodology (supporting); Project administration (lead); Supervision (lead); Visualization (supporting); Writing – review & editing (lead).
Data Availability
No data has been used in this study.
References
- [1] M. Moussaïd, J. E. Kämmer, P. P. Analytis, and H. Neth, “Social influence and the collective dynamics of opinion formation,” PloS One, vol. 8, no. 11, p. e78433, 2013.
- [2] P. Lorenz-Spreen, B. M. Mønsted, P. Hövel, and S. Lehmann, “Accelerating dynamics of collective attention,” Nature Communications, vol. 10, no. 1, p. 1759, 2019.
- [3] T. T. Hills, “The dark side of information proliferation,” Perspectives on Psychological Science, vol. 14, no. 3, pp. 323–330, 2019.
- [4] A. Bessi, F. Petroni, M. D. Vicario, F. Zollo, A. Anagnostopoulos, A. Scala, G. Caldarelli, and W. Quattrociocchi, “Homophily and polarization in the age of misinformation,” The European Physical Journal Special Topics, vol. 225, pp. 2047–2059, 2016.
- [5] M. Conover, J. Ratkiewicz, M. Francisco, B. Gonçalves, F. Menczer, and A. Flammini, “Political polarization on Twitter,” in Proceedings of the international AAAI conference on web and social media, vol. 5, pp. 89–96, 2011.
- [6] R. K. Garrett, “Echo chambers online?: Politically motivated selective exposure among Internet news users,” Journal of Computer-Mediated Communication, vol. 14, no. 2, pp. 265–285, 2009.
- [7] K. H. Jamieson and J. N. Cappella, Echo chamber: Rush Limbaugh and the conservative media establishment. Oxford University Press, 2008.
- [8] K. Sasahara, W. Chen, H. Peng, G. L. Ciampaglia, A. Flammini, and F. Menczer, “Social influence and unfollowing accelerate the emergence of echo chambers,” Journal of Computational Social Science, vol. 4, no. 1, pp. 381–402, 2021.
- [9] F. Baumann, P. Lorenz-Spreen, I. M. Sokolov, and M. Starnini, “Modeling echo chambers and polarization dynamics in social networks,” Physical Review Letters, vol. 124, no. 4, p. 048301, 2020.
- [10] F. Baumann, P. Lorenz-Spreen, I. M. Sokolov, and M. Starnini, “Emergence of polarized ideological opinions in multidimensional topic spaces,” Physical Review X, vol. 11, no. 1, p. 011012, 2021.
- [11] F. P. Santos, Y. Lelkes, and S. A. Levin, “Link recommendation algorithms and dynamics of polarization in online social networks,” Proceedings of the National Academy of Sciences, vol. 118, no. 50, p. e2102141118, 2021.
- [12] M. Cinelli, G. De Francisci Morales, A. Galeazzi, W. Quattrociocchi, and M. Starnini, “The echo chamber effect on social media,” Proceedings of the National Academy of Sciences, vol. 118, no. 9, p. e2023301118, 2021.
- [13] M. Del Vicario, G. Vivaldo, A. Bessi, F. Zollo, A. Scala, G. Caldarelli, and W. Quattrociocchi, “Echo chambers: Emotional contagion and group polarization on facebook,” Scientific Reports, vol. 6, no. 1, p. 37825, 2016.
- [14] W. Cota, S. C. Ferreira, R. Pastor-Satorras, and M. Starnini, “Quantifying echo chamber effects in information spreading over political communication networks,” EPJ Data Science, vol. 8, no. 1, p. 35, 2019.
- [15] K. Garimella, G. De Francisci Morales, A. Gionis, and M. Mathioudakis, “Political discourse on social media: Echo chambers, gatekeepers, and the price of bipartisanship,” in Proceedings of the 2018 world wide web conference, pp. 913–922, 2018.
- [16] A. S. Cardenal, C. Aguilar-Paredes, C. Cristancho, and S. Majó-Vázquez, “Echo-chambers in online news consumption: Evidence from survey and navigation data in spain,” European Journal of Communication, vol. 34, no. 4, pp. 360–376, 2019.
- [17] A. Hanna, C. Wells, P. Maurer, L. Friedland, D. Shah, and J. Matthes, “Partisan alignments and political polarization online: A computational approach to understanding the french and us presidential elections,” in Proceedings of the 2nd Workshop on Politics, Elections and Data, pp. 15–22, 2013.
- [18] J. Borge-Holthoefer, W. Magdy, K. Darwish, and I. Weber, “Content and network dynamics behind Egyptian political polarization on Twitter,” in Proceedings of the 18th ACM Conference on Computer Supported Cooperative Work & Social Computing, pp. 700–711, 2015.
- [19] P. Barberá, J. T. Jost, J. Nagler, J. A. Tucker, and R. Bonneau, “Tweeting from left to right: Is online political communication more than an echo chamber?,” Psychological Science, vol. 26, no. 10, pp. 1531–1542, 2015.
- [20] X. Wang and Y. Song, “Viral misinformation and echo chambers: The diffusion of rumors about genetically modified organisms on social media,” Internet Research, vol. 30, no. 5, pp. 1547–1564, 2020.
- [21] C. B. Currin, S. V. Vera, and A. Khaledi-Nasab, “Depolarization of echo chambers by random dynamical nudge,” Scientific Reports, vol. 12, no. 1, p. 9234, 2022.
- [22] R. Pal, A. Kumar, and M. Santhanam, “Depolarization of opinions on social networks through random nudges,” Physical Review E, vol. 108, no. 3, p. 034307, 2023.
- [23] S. Redner, “Reality-inspired voter models: A mini-review,” Comptes Rendus Physique, vol. 20, no. 4, pp. 275–292, 2019.
- [24] J. P. Gleeson, “High-accuracy approximation of binary-state dynamics on networks,” Physical Review Letters, vol. 107, no. 6, p. 068701, 2011.
- [25] N. Masuda, N. Gibert, and S. Redner, “Heterogeneous voter models,” Physical Review E, vol. 82, no. 1, p. 010103, 2010.
- [26] V. Sood and S. Redner, “Voter model on heterogeneous graphs,” Physical Review Letters, vol. 94, no. 17, p. 178701, 2005.
- [27] I. Benczik, S. Benczik, B. Schmittmann, and R. K. Zia, “Opinion dynamics on an adaptive random network,” Physical Review E, vol. 79, no. 4, p. 046104, 2009.
- [28] K. Suchecki, V. M. Eguiluz, and M. San Miguel, “Conservation laws for the voter model in complex networks,” Europhysics Letters, vol. 69, no. 2, p. 228, 2004.
- [29] B. L. Granovsky and N. Madras, “The noisy voter model,” Stochastic Processes and their Applications, vol. 55, no. 1, pp. 23–43, 1995.
- [30] F. Herrerías-Azcué and T. Galla, “Consensus and diversity in multistate noisy voter models,” Physical Review E, vol. 100, no. 2, p. 022304, 2019.
- [31] A. F. Peralta, J. Kertész, and G. Iñiguez, “Opinion dynamics in social networks: From models to data,” arXiv preprint arXiv:2201.01322, 2022.
- [32] G. Deffuant, D. Neau, F. Amblard, and G. Weisbuch, “Mixing beliefs among interacting agents,” Advances in Complex Systems, vol. 3, no. 01n04, pp. 87–98, 2000.
- [33] H. Rainer and U. Krause, “Opinion dynamics and bounded confidence: models, analysis and simulation,” 2002.
- [34] S. C. Fennell, K. Burke, M. Quayle, and J. P. Gleeson, “Generalized mean-field approximation for the deffuant opinion dynamics model on networks,” Physical Review E, vol. 103, no. 1, p. 012314, 2021.
- [35] L. Pedraza, J. P. Pinasco, N. Saintier, and P. Balenzuela, “An analytical formulation for multidimensional continuous opinion models,” Chaos, Solitons & Fractals, vol. 152, p. 111368, 2021.
- [36] A. Carro, R. Toral, and M. San Miguel, “The role of noise and initial conditions in the asymptotic solution of a bounded confidence, continuous-opinion model,” Journal of Statistical Physics, vol. 151, pp. 131–149, 2013.
- [37] S. Krishnagopal and M. A. Porter, “Bounded-confidence models of opinion dynamics with neighborhood effects,” arXiv preprint arXiv:2402.05368, 2024.
- [38] H. Z. Brooks, P. S. Chodrow, and M. A. Porter, “Emergence of polarization in a sigmoidal bounded-confidence model of opinion dynamics,” SIAM Journal on Applied Dynamical Systems, vol. 23, no. 2, pp. 1442–1470, 2024.
- [39] J. Ojer, M. Starnini, and R. Pastor-Satorras, “Modeling explosive opinion depolarization in interdependent topics,” Physical Review Letters, vol. 130, no. 20, p. 207401, 2023.
- [40] J. Ojer, M. Starnini, and R. Pastor-Satorras, “Vanishing threshold in depolarization of correlated opinions on social networks,” arXiv preprint arXiv:2306.01329, 2023.
- [41] Ł. G. Gajewski, J. Sienkiewicz, and J. A. Hołyst, “Transitions between polarization and radicalization in a temporal bilayer echo-chamber model,” Physical Review E, vol. 105, no. 2, p. 024125, 2022.
- [42] J. Dong, Y.-C. Zhang, and Y. Kong, “The evolution dynamics of collective and individual opinions in social networks,” Expert Systems with Applications, p. 124813, 2024.
- [43] R. S. Nickerson, “Confirmation bias: A ubiquitous phenomenon in many guises,” Review of General Psychology, vol. 2, no. 2, pp. 175–220, 1998.
- [44] N. Perra, B. Gonçalves, R. Pastor-Satorras, and A. Vespignani, “Activity driven modeling of time varying networks,” Scientific Reports, vol. 2, no. 1, p. 469, 2012.
- [45] M. Starnini and R. Pastor-Satorras, “Topological properties of a time-integrated activity-driven network,” Physical Review E, vol. 87, no. 6, p. 062807, 2013.
- [46] A. Moinet, M. Starnini, and R. Pastor-Satorras, “Burstiness and aging in social temporal networks,” Physical Review Letters, vol. 114, no. 10, p. 108701, 2015.
- [47] J. Cho, S. Ahmed, M. Hilbert, B. Liu, and J. Luu, “Do search algorithms endanger democracy? an experimental investigation of algorithm effects on political polarization,” Journal of Broadcasting & Electronic Media, vol. 64, no. 2, pp. 150–172, 2020.
- [48] W. Lee, S.-G. Yang, and B. J. Kim, “The effect of media on opinion formation,” Physica A: Statistical Mechanics and its Applications, vol. 595, p. 127075, 2022.
- [49] S. H. Strogatz, Nonlinear dynamics and chaos: with applications to physics, biology, chemistry, and engineering. CRC press, 2018.
- [50] N. J. Stroud, “Polarization and partisan selective exposure,” Journal of Communication, vol. 60, no. 3, pp. 556–576, 2010.