ADRS-CNet: An adaptive models of dimensionality reduction methods for DNA storage clustering algorithms ††thanks: Citation: Authors. Title. Pages…. DOI:000000/11111.
Abstract
DNA storage technology, with its high density, long-term preservation capability, low maintenance requirements, and compact physical size, is emerging as a promising option for large-scale data storage. However, extracting features from DNA sequences of varying lengths can lead to the problem of dimensionality, which needs to be addressed. Techniques such as PCA, UMAP, and t-SNE are commonly used to project high-dimensional data into a lower-dimensional space, but their effectiveness varies across different datasets. To address this challenge, this paper proposes a model based on a multilayer perceptron (MLP) that classifies DNA sequence features and intelligently selects the optimal dimensionality reduction method, thereby enhancing subsequent clustering performance. Experimental results, tested on open-source datasets and compared with multiple benchmark methods, demonstrate that our model not only excels in classification performance but also significantly improves clustering accuracy, indicating that this approach effectively mitigates the challenges posed by high-dimensional features in clustering models.
1 Introduction
DNA storage technology utilizes artificially synthesized DNA as a medium for information storage, offering a "breakthrough" potential for addressing the challenges of storing and applying massive amounts of data. In the downstream information retrieval process of DNA storage technology, specific hybridization techniques, such as Polymerase Chain Reaction (PCR) or magnetic bead separation, are commonly used to access data [1]. However, this technology faces several challenges, including high base error rates (insertions, deletions, substitutions, etc.) and the loss of storage sequences, which pose significant threats to the reliability of stored data [2].
To address these issues, clustering and alignment of sequencing data can be employed. A commonly used feature extraction method is based on k-mer frequency matrices, where the dimensionality of the extracted features increases exponentially with the value of k [3] [4] [5]. Therefore, selecting an appropriate dimensionality reduction technique becomes a critical challenge that needs to be addressed.
This study aims to develop an adaptive classification model to identify the optimal dimensionality reduction method, thereby mitigating the curse of dimensionality caused by k-mer feature extraction and enhancing the effectiveness of K-means clustering in restoring the original sequence information.
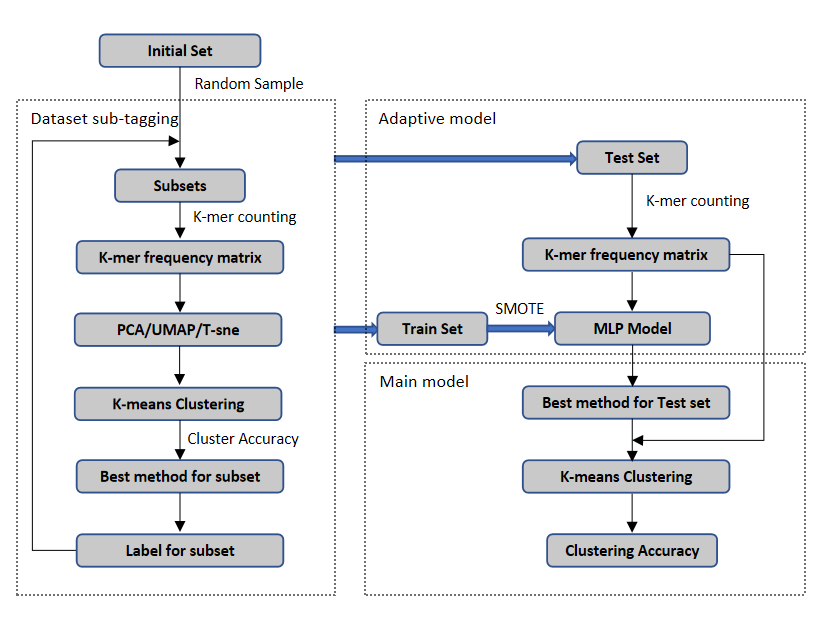
Specifically, among the numerous available algorithms, Principal Component Analysis (PCA) [6], t-distributed Stochastic Neighbor Embedding (t-SNE) [7], and Uniform Manifold Approximation and Projection (UMAP) [8] are particularly prominent in the fields of cell biology, bioinformatics, and data visualization [9]. This study addresses the challenge of selecting the appropriate dimensionality reduction method to mitigate the curse of dimensionality in K-means clustering. The study involves extracting a comprehensive set of features from DNA sequence datasets using k-mer frequency matrices. PCA, UMAP, and t-SNE are individually employed to reduce the dimensionality of these feature datasets, and their effectiveness is evaluated based on clustering accuracy, allowing the identification and categorization of the most suitable method for each dataset. This categorization process, referred to as dataset sub-tagging, organizes the labeled datasets into a cohesive group, which is subsequently used to train a multilayer perceptron (MLP) [10] model to achieve model adaptability.
2 Related works
Errors can occur during DNA sequencing, necessitating the use of error correction codes or the combination of clustering methods with error correction codes to enhance error correction capabilities [11].
2.1 Error Correction Coding
Shubham Chandak [12] developed an approach that uses a large block-length LDPC code to handle both errors and erasures, incorporating new methods to address insertion and deletion errors during DNA synthesis. This approach, tested with experimental data, significantly reduced reading costs, thereby enhancing the overall efficiency and reliability of DNA storage systems.
Yaniv Erlich’s team [13] employed the DNA Fountain strategy along with an advanced error-correction system, successfully retrieving information from complex sequencing data. Their method pushed the limits of storage density, achieving results that far exceeded previous benchmarks.
However, using only error correction codes to address sequencing errors has its limitations. By first reconstructing encoded data through clustering techniques before applying error correction, the likelihood of accurately recovering original sequences improves, while reducing redundancy, costs, and complexity [11].
2.2 Clustered Error Correction Coding
Clustered Error Correction Coding combines the strengths of both clustering and error correction codes, offering a unified methodology. In the clustering process, it mainly involves sequence clustering methods that use alignment strategies, as well as clustering techniques based on k-mer counting.
2.2.1 Alignment-Based Clustering Methods
Weizhong Li and Adam Godzik [14] developed the CD-HIT program, which accelerates large-scale sequence clustering by simplifying sequence alignment while maintaining accuracy.
Eduard Zorita [15] introduced the "Starcode" algorithm, which enhances the correction of sequencing errors and reduction of data redundancy through optimized sequence matching.
2.2.2 K-mer Counting-Based Clustering Methods
Bao et al. [19] introduced an entropy-based alignment-free model called CPF, which improves sequence clustering by leveraging a 12-dimensional feature vector. This vector includes elements such as word frequency, positional data, and local frequency sequences. By incorporating k-mer technology, the model achieved notable clustering purity, precision, recall, and F-measure across various datasets. The effectiveness and consistency of CPF are further enhanced by adjusting the sliding window length, underscoring its efficiency and reliability.
James et al. [20] created MeShClust, an unsupervised learning tool designed for DNA sequence clustering that relies on k-mer frequencies and the mean shift algorithm. This tool utilizes a General Linear Model (GLM) to efficiently identify and group similar sequences. Compared to existing tools like UCLUST and CD-HIT, MeShClust excels in efficiency, consistency, and resource utilization.
Yana Hrytsenko et al. [21] utilized k-mer frequencies and PCA to analyze population structures. By transforming DNA sequences into k-mer frequency matrices and applying PCA followed by K-means clustering, they effectively identified population structures, successfully distinguishing between admixed and non-admixed individuals. The method proved to be as accurate as traditional model-based approaches.
Inspired by the work of Yana Hrytsenko et al. [21] and Yuta Hozumi et al. [9], our research focuses on optimizing dimensionality reduction techniques in bioinformatics. We developed an adaptive model to select the most suitable dimensionality reduction method based on specific data structures. By integrating this model with k-mer frequency matrices and K-means clustering, we aim to improve error analysis in DNA storage technologies. Our approach involves enhancing feature capture by increasing the dimensions of k-mer frequency matrices and applying the optimal dimensionality reduction technique to address challenges associated with sparse matrices and computational costs in traditional K-means clustering.
3 Methodology
3.1 K-means clustering algorithm
The K-means clustering algorithm is one of the most powerful and popular data mining algorithms in the research community. As a commonly used unsupervised learning algorithm, it is used to partition observations in a dataset into k different groups (clusters) with similar features. Despite its popularity, this clustering algorithm requires the predefinition of the number of clusters, which leads to different cluster shapes and outlier effects [22]. However, determining the value of k is relatively straightforward in DNA storage technology clustering analysis, as the DNA chains amplified by PCR originate from a known number of original sequences, making the number of clusters obvious. This is a significant advantage of the K-means clustering algorithm in DNA storage clustering analysis.
3.2 MLP
Multilayer Perceptrons (MLPs) are a commonly used type of artificial neural network (ANN) designed for function approximation. It is capable of handling both linear and nonlinear functions, making it suitable for a variety of data relationships. Inspired by the functionality of the brain, the MLP is a powerful modelling tool. Through supervised training algorithms, MLPs can be trained with labelled data, allowing them to make accurate predictions even in previously unseen situations [10].
The multilayer perceptron is a type of layered feedforward neural network composed of multiple hidden layers. To facilitate a comprehensive understanding of the functioning of multilayer perceptrons, we begin our exploration with linear problems.
3.3 Dimensionality reduction techniques
Dimensionality reduction techniques such as PCA, t-SNE, and UMAP have been widely discussed due to their unique strengths, weaknesses, and the contexts in which they are most effective.
When reducing high-dimensional data to higher-dimensional subspaces, PCA generally outperforms t-SNE and UMAP. This is because PCA identifies the directions in the data that exhibit the most variance and projects the data onto these directions, creating a lower-dimensional space. By retaining as many principal components as feasible, PCA can maximize the explained variance ratio, thus preserving the overall structure and variance information of the original data. However, as a linear technique, PCA may struggle to capture complex nonlinear relationships in the data.
On the other hand, when reducing data to lower-dimensional spaces, t-SNE and UMAP typically deliver better results than PCA. t-SNE, a nonlinear method, works by modeling a probability distribution of the high-dimensional data and then finding a corresponding distribution in the lower-dimensional space that minimizes the difference between the two. This approach effectively retains the local structure of the data, grouping similar data points together in the reduced space. However, its application is often limited by high computational costs and challenging hyperparameter tuning. UMAP, a more recent nonlinear technique, is designed to preserve both local and global structures. Based on manifold learning theory, UMAP can handle large datasets more efficiently and excels in maintaining data structure at both the local and global levels. Compared to t-SNE, UMAP is faster and less sensitive to hyperparameter settings, making it more practical in various applications.
Becht et al. (Nature Biotechnology) [23] argued that UMAP is superior to t-SNE because it better preserves the global structure of the data and produces more consistent results across different runs. However, further studies suggest that this perceived advantage is largely due to different initialization methods. Becht et al. used random initialization for t-SNE and Laplacian eigenmaps for UMAP. Research indicates that UMAP with random initialization performs as poorly in preserving global structure as t-SNE with random initialization. In contrast, t-SNE with an informative initialization performs as well as UMAP with a similar setup. Therefore, Becht et al.’s findings do not conclusively demonstrate that UMAP inherently surpasses t-SNE in preserving global structure.
In conclusion, the choice of dimensionality reduction technique should be guided by the specific characteristics of the data and the requirements of the analysis. The optimal method should be selected based on factors such as data properties, computational resources, and the specific goals of the study, warranting further exploration in this area.
4 Experimental results
4.1 Dataset
The Clustered Nanopore Reads Dataset [24] we used consists of two files:
-
•
Centers.txt: Contains 10,000 random DNA strings of length 110.
-
•
Clusters.txt: Contains 269,709 noisy nanopore DNA reads corresponding to the strings in Centers.txt, organized into multiple clusters separated by lines of "====".
4.2 Training and Testing Strategies
The classification performance of a multilayer perceptron (MLP), a fundamental neural network model, is highly dependent on the strategies used for training and testing. Thus, designing scientifically robust training and testing protocols is essential for improving the classification effectiveness of MLPs. By refining these strategies, we can significantly enhance the model’s generalization capability and predictive accuracy.
Our methodology follows these steps:
First, we split the dataset into an initial training set and an initial test set. The training set is then subjected to random resampling, creating several subsets, which are subsequently processed using dataset sub-tagging. This process is repeated, and the resulting subsets are combined into a unified group. For each subset, we calculate the frequency of each column in the k-mer frequency matrix of the DNA sequences. These frequency vectors, along with those dimensions reduced during dataset sub-tagging using dimensionality reduction techniques, are used as feature vectors for clustering. After balancing the class labels using the SMOTE algorithm, we apply normalization and Recursive Feature Elimination (RFE) to these feature vectors, which are then used to train the MLP. We use grid search to determine the optimal MLP architecture, and this training allows us to adaptively select the best dimensionality reduction method.
During dataset sub-tagging, to compare the dimensionality reduction methods—PCA, t-SNE, and UMAP—more effectively, we fine-tuned t-SNE parameters. Specifically, we set t-SNE’s initial state to PCA, limited iterations to 300, set the learning rate to 200, and switched the computation mode to “exact.” These adjustments are designed to maximize t-SNE’s accuracy in dimensionality reduction while also improving computational efficiency.
The testing procedure mirrors the training process. We randomly sample 54 sub-test sets from the initial test set and evaluate the trained MLP’s performance in terms of weighted classification accuracy, recall, and F1-score. The optimal dimensionality reduction method, as identified by the MLP, is applied to the main model to calculate the average clustering accuracy of the sub-test sets. By comparing the average clustering accuracy when using PCA, UMAP, and t-SNE, we can more clearly assess our model’s classification performance.
It is important to highlight that our training and testing strategy draws inspiration from the Boosting classification algorithm, where each model iteration builds on the information from previous iterations. We have integrated this concept into our MLP model, enabling it to learn from prior iterations. The process is as follows:
We train the model on the training set, then test it. Samples that yield unsatisfactory test results are reintroduced into the training set for another round of training and testing. This iterative process continues until the classification metrics reach the desired levels. Theoretically, with more iterations, the classification performance should improve progressively. Since our method involves randomly sampling the test set from the initial test set, the likelihood of identical DNA sequences appearing in all subsets is extremely low. This effectively minimizes the risk of data leakage in our strategy.
For clarity and comparison, we have named our model the "Adaptive Dimensionality Reduction Selection and Classification Network" (ADRS-CNet), reflecting its core functionality.
4.3 Evaluation criteria
To validate the performance of our model, we will calculate the following comparison metrics: Accuracy, Recall/Precision and F1-Score. To accurately assess the quality of dimensionality reduction techniques, we have defined the following K-means clustering evaluation metrics. Since K-means clustering is an unsupervised learning algorithm, it does not have labels to explicitly evaluate clustering performance. However, we can test the accuracy of K-means clustering by using the labels from the dataset after dataset sub-tagging. For this purpose, we choose the number of clusters to be equal to the number of categories in the sub-dataset and then compare the clustering results with the corresponding labels. This approach enables us to quantify the accuracy and, consequently, the performance of the dimensionality reduction-assisted K-means clustering method.
The specific principle is as follows:
For classification problems, we assume the training set is
| (1) |
where is the number of samples, is the number of features, and is the number of labels.
We set the number of clusters equal to the number of labels . After applying the K-means clustering algorithm, we obtain different clusters . In each cluster , we define the K-means clustering predictor as:
| (2) |
where is the frequency of label in cluster .
Then, the clustering accuracy can be defined as:
| (3) |
where is the predicted label, and is the indicator function, which equals 1 if , otherwise 0.
4.4 Experimental evaluation
To thoroughly assess the effectiveness of our model, we structured our experiments into three segments: testing on clusters ranging from 100 to 199, clusters from 9800 to 9899, and clusters sampled randomly. The classification model was built using the optimal parameter set identified via grid search, which includes two hidden layers with 50 neurons each, the ReLU activation function, a regularization coefficient of 0.05, a learning rate of 0.001, and a maximum of 5000 iterations. This configuration was chosen to ensure the model’s robust performance and ability to generalize across diverse data distributions.
The experiment commenced with the implementation of the outlined training and testing methodology, followed by three rounds of iterative testing. From these, we selected the iteration that demonstrated superior classification performance under dimensionality reductions to 2, 3, 300, 500, and 700 dimensions. The results of these tests are depicted in Figures 2 through 7.
Throughout the three experimental phases, while classification performance varied slightly due to the randomness in test set sampling, a consistent improvement in performance was observed with an increase in the number of iterations, provided that appropriate features were selected. Our model consistently achieved high weighted precision, recall, and F1 scores across the iterations. High precision indicates a low rate of false positives, while high recall shows the model’s ability to correctly identify instances across all classification categories. The F1-score, which balances precision and recall, offers a comprehensive measure of the model’s accuracy. These results confirm the model’s effectiveness, particularly in the third random sampling experiment, where it successfully captured the patterns within the dimensionality reduction techniques, demonstrating strong capability in modeling the overall data structure.
It is also noteworthy that classification errors in the low-dimensional space were primarily associated with the selection of t-SNE and UMAP, whereas in the high-dimensional space, higher error rates were linked to PCA and UMAP. Despite these errors, t-SNE and UMAP exhibited comparable performance in low-dimensional space, and PCA and UMAP demonstrated similar effectiveness in high-dimensional space, both maintaining strong dimensionality reduction performance. This suggests that although our model may experience classification errors within these ranges, the overall accuracy remains high, making it viable for practical applications.
5 Conclusion
We present ADRS-CNet, an adaptive model specifically designed to select the most suitable dimensionality reduction techniques within a K-means clustering framework. This model aims to enhance the dimensionality reduction process for DNA datasets, addressing challenges posed by the high dimensionality of k-mer frequency matrices. Through experiments conducted on the Clustered Nanopore Reads (CNR) dataset, we demonstrate that ADRS-CNet not only successfully identifies and selects the optimal dimensionality reduction method but also significantly improves clustering accuracy when compared to K-means clustering supported by PCA, t-SNE, and UMAP. This adaptive model effectively minimizes noise and redundant information in DNA sequencing data, offering a promising approach for clustering analysis of DNA storage sequences in the era of big data.
References
- [1] P. Xu. Dna storage and its research progress. ResearchGate. https://www.researchgate.net/publication/342945230_DNA_Storage_and_Its_Research_Progress.
- [2] Y. Nakamura, K. Oshima, T. Moriya, et al. Sequence-specific error profile of illumina sequencers. Nucleic Acids Research, 39(13):e90–e90, 2011.
- [3] N. Singh. Demystify dna sequencing with machine learning. Kaggle. https://www.kaggle.com/code/nageshsingh/demystify-dna-sequencing-with-machine-learning/notebook.
- [4] C. de Boer and A. Regev. Brockman: Deciphering variance in epigenomic regulators by k-mer factorization. BMC Bioinformatics, 19(1), 2018.
- [5] S. Wilkinson. Introduction to the kmer r package. CRAN. https://cran.r-project.org/web/packages/kmer/vignettes/kmer-vignette.html.
- [6] A. Maćkiewicz and W. Ratajczak. Principal components analysis (pca). Computers and Geosciences, 19(3):303–342, Mar 1993.
- [7] L. van der Maaten and G. Hinton. Visualizing data using t-sne. Journal of Machine Learning Research, 9(86):2579–2605, 2008.
- [8] L. McInnes, J. Healy, and J. Melville. Umap: Uniform manifold approximation and projection for dimensionality reduction. arXiv.org. https://arxiv.org/abs/1802.03426.
- [9] Y. Hozumi, R. Wang, C. Yin, and G.-W. Wei. Umap-assisted k-means clustering of large-scale sars-cov-2 mutation datasets. Computers in Biology and Medicine, 131:104264, Apr 2021.
- [10] C. M. Bishop. Neural networks for pattern recognition. Oxford University Press, Oxford, U.K., 1995.
- [11] S. Sankar, H. Sun, J. Gehring, A. Singhal, and C. M. Ajo-Franklin. Comparative analysis of clustering methodologies in dna storage. In Proceedings of the 2022 26th International Computer Science and Engineering Conference (ICSEC), 2022.
- [12] S. Chandak, P. Tatwawadi, J. Koch, et al. Improved read/write cost tradeoff in dna-based data storage using ldpc codes. bioRxiv, 2019.
- [13] Y. Erlich and D. Zielinski. Dna fountain enables a robust and efficient storage architecture. Science, 355(6328):950–954, 2017.
- [14] W. Li and A. Godzik. Cd-hit: a fast program for clustering and comparing large sets of protein or nucleotide sequences. Bioinformatics, 22(13):1658–1659, 2006.
- [15] E. Zorita, P. Cusco, and G. J. Filion. Starcode: sequence clustering based on all-pairs search. Bioinformatics, 31(12):1913–1919, 2015.
- [16] R. C. Edgar. Search and clustering orders of magnitude faster than blast. Bioinformatics, 26(19):2460–2461, 2010.
- [17] R. C. Edgar. Uclust algorithm. https://www.drive5.com/usearch/manual/uclust_algo.html. Accessed: 10-Jul-2024.
- [18] T. Chappell, S. Geva, and J. Hogan. K-means clustering of biological sequences. In Proceedings of the 22nd Australasian Document Computing Symposium, 2017.
- [19] Z. Bao, J. Zhu, H. Yan, et al. An improved alignment-free model for dna sequence similarity metric. BMC Bioinformatics, 15(1):1–12, 2014.
- [20] B. Johnson, C. Salinas, C. Nelson, et al. Meshclust: an intelligent tool for clustering dna sequences. Nucleic Acids Research, 46(14):e83–e83, 2018.
- [21] Y. Hrytsenko, N. M. Daniels, and R. S. Schwartz. Determining population structure from k-mer frequencies. Research Square, 2022. Preprint.
- [22] M. Ahmed, R. Seraj, and S. M. Islam. The k-means algorithm: A comprehensive survey and performance evaluation. Electronics, 9(8):1295, Aug 2020.
- [23] E. Becht, L. McInnes, J. Healy, C.-A. Dutertre, I. W. H. Kwok, L. G. Ng, F. Ginhoux, and E. W. Newell. Dimensionality reduction for visualizing single-cell data using umap. Nature Biotechnology, 37(1):38–44, Dec 2018.
- [24] S. R. Srinivasavaradhan, S. Gopi, H. D. Pfister, and S. Yekhanin. Trellis bma: Coded trace reconstruction on ids channels for dna storage. In Proceedings of the 2021 IEEE International Symposium on Information Theory (ISIT), pages 2453–2458, Melbourne, Australia, 2021.