Evaluating Four Methods for Detecting Differential Item Functioning in Large-Scale Assessments with More Than Two Groups
Abstract
This study evaluated four multi-group differential item functioning (DIF) methods (the root mean square deviation approach, Wald-1, generalized logistic regression procedure, and generalized Mantel-Haenszel method) via Monte Carlo simulation of controlled testing conditions. These conditions varied in the number of groups, the ability and sample size of the DIF-contaminated group, the parameter associated with DIF, and the proportion of DIF items. When comparing Type-I error rates and powers of the methods, we showed that the RMSD approach yielded the best Type-I error rates when it was used with model-predicted cutoff values. Also, this approach was found to be overly conservative when used with the commonly used cutoff value of 0.1. Implications for future research for educational researchers and practitioners were discussed.
keywords:
differential item functioning, DIF, measurement equivalence, measurement invariance, multi-group DIF, item response theory, RMSD1 Introduction
Differential item functioning (DIF) refers to systematic differences in item responses among examinee groups with similar ability levels but from different backgrounds [65]. Traditionally, DIF analysis has focused on pairwise comparisons between groups. When more than two groups are involved, one common practice is to use traditional DIF methods designed to analyze two groups at a time [[, e.g.,]]stark_detecting_2006. This approach can be computationally demanding, inflate Type-I error rates, reduce power, and obscure important patterns of DIF across more than two groups [109, 97]. Additionally, it requires multiple-comparison tests along with the Bonferroni adjustment, which can be conservative and inefficient [102].
To address these limitations, researchers have developed various multi-group DIF detection methods for analyzing more than two groups. One such method, the root mean square deviation (RMSD), has gained traction in large-scale assessments (LSAs), which involve more than two educational systems, ethnicities, languages, cultures, and geographic areas. RMSD’s early applications appeared in [79] and [127]. Today, RMSD is commonly used in LSAs like PISA, PIAAC, TIMSS, and PIRLS [107, 108, 104, 103]. Despite its widespread use, the application of a fixed RMSD cutoff lacks empirical grounding. For example, TIMSS employs a cutoff of 0.1 [104], while PISA uses cutoffs of 0.15 and 0.12 [123], all without justification. While [121] found that no universal RMSD cutoff exists due to RMSD’s inherent limitations,
RMSD continues to be used with a fixed cutoff [[, e.g.,]]fahrmann_practical_2022,joo_evaluating_2021,buchholz_comparing_2019,kohler_bias-corrected_2020, and new approaches are emerging based on RMSD using a fixed RMSD cutoff [[, e.g.,]]silva_diaz_performance_2022-1,kohler_semiparametric_2021.
Although numerous multi-group DIF methods exist, a thorough evaluation comparing their performance has yet to be conducted. Other multi-group DIF methods include the generalized Mantel-Haenszel method [[, GMH;]]somes_generalized_1986, the generalized logistic regression procedure [[, GLR;]]magis_test-length_2011, and the improved Wald test [70] with Wald-1 [71] linking algorithm (hereafter referred to as ?Wald-1?). While some studies have attempted to compare multi-group DIF methods [[, e.g.,]]kohler_dif_2024,woods_langer-improved_2013,penfield_assessing_2001,chun_mimic_2016,magis_generalized_2011,chen_performance_2020, none of them has simultaneously scrutinized the methods mentioned here.
The objective of our study is twofold: We aim to evaluate the performance of commonly used multi-group DIF methods, and to inform the selection of appropriate DIF methods for LSAs. Our evaluation criteria comprised the Type-I error rate and power, assessed using simulated data for each of the selected methods. The Type-I error rate is defined as the proportion of incorrectly identified DIF items out of the total number of items in a test, and the power refers to the proportion of correctly identified DIF items. Both are averaged across replications for each simulated condition.
We focus on frequentist, unidimensional methods within the conventional DIF framework that analyze observed groups without covariates or random effects. They include the following: RMSD, Wald-1, GLR, and GMH. These methods were established for multi-group DIF analyses and have not been compared with each other.
We exclude mixed-measurement item response theory (IRT) approaches [[, e.g.,]]tay_using_2011 and multi-group latent class analysis [78] as they examine measurement invariance across unobserved classes. We do not consider
latent factor modeling approaches like multiple-group confirmatory factor analysis [[, MGCFA;]]joreskog_general_1969 and the multiple-indicator multiple-cause method [[, MIMIC;]]joreskog_estimation_1975, because they analyze latent factors [76, 122].
Also, we do not involve Bayesian methods such as the Bayesian factor analysis alignment approach [67]
and random effects methods such as GLMM, because they are relatively novel and less frequently used.
2 Four Multi-Group DIF Methods
2.1 Wald-1
Wald-1 [71] examines the homogeneity of item parameters based on item response theory [[, IRT;]]richardson_relation_1936, applicable to multi-group DIF analysis. It uses a linking algorithm along with the approach in [92] that extended Lord’s Wald test [100] to three- and four-group analyses. Previous research suggests that Wald-1 outperforms Wald-2 [97], while Wald-2 is recommended for identifying anchor items [126].
Wald-1 involves fitting the three-parameter logistic regression model [[, 3PL;]]birnbaum_latent_1968 to each item, expressed as
| (1) |
where
is a random variable that denotes the item response ( = 1 for correct, = 0 for incorrect);
is the item discrimination parameter;
is the item difficulty parameter;
is the item pseudo-guessing parameter (also known as the lower asymptote);
is the scaling factor in IRT, set to 1 throughout this study, following TIMSS practice.
Two-parameter logistic regression model [[, 2PL;]]birnbaum_latent_1968 items can be seen as a special case of 3PL items where the parameter is fixed at zero.
Given the conceptualization of uniform and nonuniform DIF [84], in Wald-1, for testing the nonuniform and uniform DIF separately, the null hypothesis is that the IRT-based parameter or remains approximately the same across groups. The alternative hypothesis is about the reverse. The null hypotheses are expressed as
where
denotes item discrimination for the reference group, and to for focal groups;
denotes item difficulty for the reference group, and to for focal groups.
The alternative hypotheses are
2.2 RMSD
Similar to Wald-1, RMSD is an IRT-based method. However, RMSD captures DIF by measuring the deviation between a pseudo-observed item characteristic curve (ICC)222ICC is also known as the probability to answer an item correctly, or ?proportion correct.? Pseudo-observed ICC is estimated based on pseudocounts representing the relative prior expected probabilities of different possibilities. based on IRT and the predicted ICC for the studied item [106]. The RMSD statistic is expressed as
| (2) |
where
is examinees’ abilities;
is the pseudo-observed ICC;
is the estimated model-based ICC;
is the the probability density of the ability in the population considered in analysis.
For estimation, (2) is rewritten using the Gauss-Hermite quadrature [110] as
| (3) |
where
is the (posterior) probability of the examinees observed with a correct answer at the quadrature point .
The RMSD statistic in nature is a misfit statistic, making RMSD versatile and applicable to more than two groups. As shown in (2), RMSD inherently measures the degree of deviation between pseudo-observed and estimated item response probabilities. Although the RMSD can take the form similar to a pairwise group comparison statistic, shown in (3), its core utility lies in evaluating model fit – identifying discrepancies between the pseudo-observed ICCs and the model-predicted ICCs for the studied item.
The choice of the RMSD cutoff is crucial, as it determines whether the RMSD statistic indicates a significant deviation. The item is seen as DIF-free if its RMSD statistic is below this cutoff, or DIF-contaminated if otherwise. [95] demonstrated that using arbitrary cutoff values, such as 0.1 in TIMSS [104] and 0.15 and 0.12 in PISA [123], leads to unsatisfactory Type-I error rates and statistical power. [74] showed that the optimal RMSD cutoff value can be determined using a quadratic regression model. This model takes into account various factors involved in multi-group DIF analysis, with an emphasis on the number of groups.
2.3 GLR
GLR [101] is an extension of the logistic regression procedure [119]. Hypothesis testing in GLR is accomplished through the Wald test [75], similar to the one used for Wald-1 except that different parameters and contrasts are employed [102]. Unlike Wald-1, GLR uses the examinees’ total scores as the matching criterion instead of their latent ability, and it does not depend on an IRT model. Its function for DIF analysis is specified below for each group:
where
is the probability of answering the item correctly;
is the item intercept parameter;
is the item slope parameter;
is an examinee’s total score.
It can be rewritten into the function below:
where can be compared to in (1) for Wald-1. The slope parameter and the intercept parameter correspond to and - in Wald-1. Despite these similarities, GLR differs from Wald-1 in that it does not account for the parameter in 3PL items, and its proxy of the ability, the total score , is an observed variable.
2.4 GMH
GMH [117] is an extension of the Mantel-Haenszel method [[, MH;]]holland_alternate_1985, applicable to multi-group DIF analysis. Its test statistic is more generalizable than the MH chi-square statistic, useful when more than two categories exist in the condition or the response for each of the strata, expressed as
where
, where the count of response in condition of stratum is ;
, for which the expected value of is where ;
.
Unlike Wald-1 and GLR, which rely on estimated model parameters to compute the test statistic, GMH uses observed response frequencies. Similar to MH, GMH uses examinees’ total scores to proxy the ability in DIF testing. Hence, GMH shares some limitations of MH such as the loss of information due to the discretization of the ability parameter and unrealistic assumptions about equally spaced ability values and a constant common odds ratio across distinct ability levels [128]. Despite these limitations, GMH has demonstrated superior power and adequate control over Type-I error [109]. [81] found that GMH provides an optimal balance of Type-I error control and power among the tested frequentist methods.
3 Method
The current literature suggests that more variation is needed in Monte Carlo simulations to evaluate multi-group DIF methods. Previous studies have limited their scope to three groups for Wald-1 [126], up to six groups for GLR and GMH [81], but up to 50 groups for RMSD [93]. Also, there is a lack of scrutiny when manipulating the groups’ ability level, the item discrimination parameter , or the sample sizes of multiple groups, while the existing literature has unveiled the following: RMSD cannot consistently detect DIF associated with low-performing groups [121] or the item discrimination parameter [69]; GLR’s performance can be affected by unequal sample sizes [81].
Our study was intended to address these limitations. We enhanced the scope of existing literature by including up to 15 examinee groups, reflecting the common scenario in LSAs, which often involve 15 or more country-differentiated examinee groups. For a baseline comparison, we also included two-group analyses. We manipulated several understudied factors such as the ability distribution of the DIF-contaminated focal group, the DIF-related item parameter, the sample size of the DIF-contaminated focal group, in addition to commonly studied factors. To maintain clear and interpretable results, we focused on the simplest simulated conditions where only one focal group was affected by DIF.
We set the significance level at 0.05 and the prior power at 0.8, and reported the Type-I error rate and power averaged across 100 replications for each simulated condition. This number of replications was chosen given the latest publications in this field [[, e.g.,]]lim_residualbased_2022,kohler_dif_2024 as well as our computation: We used the formula [99, 77] where , , , and and are means and standard deviations of Type-I error rates from an initial exploration with 30 replications across all of our simulated conditions333The numbers we obtained were averaged at 7, with the 25th percentile at 2 and the 75th percentile at 21.. Our acceptable range for the Type-I error rate was 0.01 to 0.09, calculated based on a Bernoulli distribution using the formula , following [126].
Our simulations were divided into Study 1, where we assessed the methods with DIF-free data, and Study 2, where we examined the methods when one focal group was set to be DIF-contaminated. Specifically, Study 1 varied the number of groups (i.e., 2, 5, 10, 15), the ability level (i.e., low, high), and the sample size (i.e., small, large) of the focal group set to be DIF-contaminated in Study 2. Study 2 manipulated additional factors: the parameter associated with DIF (difference of 0.4 in the or parameter) and the proportion of DIF items (around 20% and 30%, corresponding to 6 and 9 items). We randomized DIF-contaminated items for each replication to attenuate item-associated effects, following [126]. Also, we assigned the DIF-contaminated focal group consistently higher values in either the a parameter or the b parameter compared to the other groups, following [109]. Overall, these conditions were determined given the ones that have appeared in the existing literature and our experience with DIF analyses using the real-world LSA data. Consequently, for two variations of the four methods we tested, there were 16 simulated conditions in Study 1 (4 group numbers 2 ability levels 2 sample sizes) and 64 simulated conditions in Study 2 (16 conditions from Study 1 2 parameters for DIF 2 proportions of DIF items).
3.1 Procedures for data simulation
The groups in our simulation refer to examinee groups differentiated by national or regional education systems. Our data was simulated to align with actual data from the TIMSS 2019 Mathematics Grade-8 assessment [82]. TIMSS’s Booklet 13 was randomly selected for obtaining the test length, item parameter estimates, ability distributions, and sample sizes for various groups that were used in this simulation. Table 1 documents the mean and standard deviations of the ability distribution and the sample size we used for each group.
For each simulated condition, 100 data sets were generated for replications using values drawn randomly from the ability distribution for each group.
We chose ?Western Cape, RSA? as the reference group because its estimated average was close to 0 and because it was included as a benchmark region for TIMSS 2019.
We used ?Kuwait,? ?Romania,? ?Morocco,? and ?Australia? to simulate the DIF-contaminated focal group in each scenario: (1) small sample size, low ability ( = 327, = -0.393 for Kuwait); (2) small sample size, high ability ( = 326, = 0.344 for Romania); (3) large sample size, low ability ( = 598, = -0.560 for Morocco); (4) large sample size, high ability ( = 642, = 0.773 for Australia). We randomly selected the DIF-free focal groups from the rest of the groups, ensuring that they were a balanced mix of low- and high-ability groups, each with more than 300 examinees.
It is worth noting that we chose ?small? and ?large? to label sample sizes here to ensure relevance and applicability to LSAs like TIMSS. While the sample sizes we labeled as ?large? (598 for Morocco or 642 for Australia) may seem modest within the broader context of LSAs, they correspond to the large sample sizes that truly exist in the TIMSS assessment data set. These varying sample sizes are sufficient to reveal whether the tested methods may be influenced by sample size. By defining ?large? and ?small? sample sizes using real-world data, we strike a balance between theoretical exploration and practical relevance.
Table 2 documents the IRT model, item parameters and other information about 29 items from the selected booklet. All these item parameters aligned with the appropriate range in testing. All items were utilized as 3PL items since 2PL is a special case of 3PL where the parameter is fixed at zero. We primarily followed the latest practice to manipulate differences in the IRT item parameters to simulate DIF [[, e.g.,]]lim_residualbased_2022,kohler_dif_2024,rutkowski_assessing_2014. To allow the comparison with early DIF simulation studies, we also computed the corresponding difference in terms of the ICC area [113] and the effect size of DIF [86, 128], shown in the last six columns of Table 2. This computation was done when using 41 quadrature points of the ability on the scale [-4, 4] (or Q41, which has increments of 0.2), given the existing evidence about different scaling options supporting measurement precision [[, e.g.,]]antal_adaptive_2007,mazumder_numerical_2016.
The ICC area difference varied from 0.041 to 0.309 for the parameter and from 0.270 to 0.400 for the parameter. The effect size ranged from 0.000 to 0.057 for the parameter and from 0.416 to 2.551 for the parameter. Manipulating the parameter resulted in DIF items flagged with an ?A? rating, while changes in the parameter led to a mix of ?A,? ?B,? and ?C? ratings [128].
| Abilityii | |||
|---|---|---|---|
| Group | i | ||
| Australia | 642 | 0.773 | 0.826 |
| Bahrain | 410 | 0.296 | 1.058 |
| Iran | 432 | -0.008 | 0.851 |
| Jordan | 518 | -0.316 | 0.728 |
| Kuwait | 327 | -0.393 | 0.794 |
| Lebanon | 340 | -0.272 | 0.675 |
| Morocco | 598 | -0.560 | 0.589 |
| Oman | 483 | -0.204 | 0.817 |
| New Zealand | 437 | 0.524 | 0.872 |
| Romania | 326 | 0.344 | 0.933 |
| Saudi Arabia | 405 | -0.409 | 0.718 |
| South Africa | 1480 | -0.369 | 0.729 |
| Egypt | 521 | -0.240 | 0.828 |
| Gauteng, RSA | 409 | -0.230 | 0.708 |
| Western Cape, RSA | 374 | -0.119 | 0.841 |
-
i
Sample size of examinees in the selected booklet data.
-
ii
Estimates based on the selected booklet data.
| DIF-Free Groupsi | DIF Groupsii | DIF in a | DIF in b | ||||||||||
|---|---|---|---|---|---|---|---|---|---|---|---|---|---|
| No. | Item | Model | iii | Area | Flag | Area | Flag | ||||||
| 1 | MP62001 | 3PL | 1.219 | 1.134 | 0.299 | 1.619 | 1.534 | 0.184 | 0.018 | A | 0.270 | 0.416 | A |
| 2 | MP62067 | 3PL | 2.050 | 0.360 | 0.312 | 2.450 | 0.760 | 0.076 | 0.000 | A | 0.275 | 0.522 | A |
| 3 | MP62072 | 2PL | 1.682 | 0.275 | 0.000 | 2.082 | 0.675 | 0.158 | 0.002 | A | 0.399 | 1.581 | C |
| 4 | MP62120 | 3PL | 2.466 | 0.903 | 0.145 | 2.866 | 1.303 | 0.067 | 0.000 | A | 0.342 | 0.843 | A |
| 5 | MP62146 | 3PL | 2.079 | 1.181 | 0.109 | 2.479 | 1.581 | 0.095 | 0.002 | A | 0.355 | 0.906 | A |
| 6 | MP62154 | 2PL | 2.050 | 0.278 | 0.000 | 2.450 | 0.678 | 0.110 | 0.001 | A | 0.400 | 1.927 | C |
| 7 | MP62192 | 2PL | 1.440 | 1.696 | 0.000 | 1.840 | 2.096 | 0.194 | 0.057 | A | 0.384 | 1.354 | C |
| 8 | MP62214 | 2PL | 1.826 | 0.849 | 0.000 | 2.226 | 1.249 | 0.135 | 0.005 | A | 0.398 | 1.716 | C |
| 9 | MP62242 | 3PL | 2.014 | 0.524 | 0.189 | 2.414 | 0.924 | 0.092 | 0.000 | A | 0.324 | 0.708 | A |
| 10 | MP62250A | 2PL | 1.988 | 0.552 | 0.000 | 2.388 | 0.952 | 0.116 | 0.002 | A | 0.399 | 1.869 | C |
| 11 | MP62250B | 2PL | 2.485 | 1.211 | 0.000 | 2.885 | 1.611 | 0.077 | 0.001 | A | 0.399 | 2.336 | C |
| 12 | MP62341 | 3PL | 2.356 | 1.873 | 0.225 | 2.756 | 2.273 | 0.065 | 0.002 | A | 0.307 | 0.538 | A |
| 13 | MP72005 | 3PL | 1.105 | 0.093 | 0.026 | 1.505 | 0.493 | 0.309 | 0.004 | A | 0.381 | 0.941 | A |
| 14 | MP72021 | 2PL | 1.526 | 0.604 | 0.000 | 1.926 | 1.004 | 0.185 | 0.008 | A | 0.397 | 1.435 | C |
| 15 | MP72026 | 2PL | 1.131 | 0.990 | 0.000 | 1.531 | 1.390 | 0.297 | 0.055 | A | 0.385 | 1.064 | C |
| 16 | MP72041A | 2PL | 1.645 | 0.275 | 0.000 | 2.045 | 0.675 | 0.164 | 0.002 | A | 0.399 | 1.547 | C |
| 17 | MP72041B | 2PL | 2.038 | 0.615 | 0.000 | 2.438 | 1.015 | 0.111 | 0.002 | A | 0.399 | 1.916 | C |
| 18 | MP72059 | 2PL | 2.159 | 0.978 | 0.000 | 2.559 | 1.378 | 0.100 | 0.002 | A | 0.399 | 2.030 | C |
| 19 | MP72080 | 3PL | 2.428 | 1.269 | 0.098 | 2.828 | 1.669 | 0.073 | 0.001 | A | 0.360 | 1.008 | B |
| 20 | MP72081 | 2PL | 1.314 | 1.415 | 0.000 | 1.714 | 1.815 | 0.229 | 0.056 | A | 0.385 | 1.235 | C |
| 21 | MP72094 | 2PL | 1.970 | 0.238 | 0.000 | 2.370 | 0.638 | 0.118 | 0.001 | A | 0.400 | 1.852 | C |
| 22 | MP72120 | 2PL | 1.820 | 1.284 | 0.000 | 2.220 | 1.684 | 0.135 | 0.011 | A | 0.397 | 1.711 | C |
| 23 | MP72131 | 2PL | 2.126 | 1.811 | 0.000 | 2.526 | 2.211 | 0.100 | 0.013 | A | 0.395 | 1.998 | C |
| 24 | MP72140 | 2PL | 1.327 | 0.761 | 0.000 | 1.727 | 1.161 | 0.234 | 0.021 | A | 0.393 | 1.248 | C |
| 25 | MP72147 | 2PL | 2.714 | 1.625 | 0.000 | 3.114 | 2.025 | 0.065 | 0.002 | A | 0.399 | 2.551 | C |
| 26 | MP72154 | 3PL | 2.021 | 0.581 | 0.179 | 2.421 | 0.981 | 0.093 | 0.001 | A | 0.328 | 0.728 | A |
| 27 | MP72161 | 2PL | 1.911 | 1.149 | 0.000 | 2.311 | 1.549 | 0.124 | 0.007 | A | 0.398 | 1.796 | C |
| 28 | MP72192 | 3PL | 2.013 | 0.901 | 0.216 | 2.413 | 1.301 | 0.089 | 0.001 | A | 0.313 | 0.616 | A |
| 29 | MP72223 | 3PL | 2.995 | 0.967 | 0.244 | 3.395 | 1.367 | 0.041 | 0.000 | A | 0.302 | 0.604 | A |
-
i
Estimates based on the selected booklet data.
-
ii
Estimates set to be 0.4 higher than the DIF-free group.
-
iii
The scaling factor in IRT was set to 1, following TIMSS practice.
3.2 Settings for data analysis
We used three software packages for analyses: the R package mirt [72] for RMSD, the program flexMIRT [88] for Wald-1, and the R package difR [72] for GLR and GMH. The base R version was R 4.2.1 [111]. We employed the default options implemented in the software programs to recover the asymptotic covariance matrix.
We used maximum likelihood [[, ML;]]fisher_mathematical_1922 for parameter estimation for RMSD and maximum a posteriori (MAP) for Wald-1, following the common practice for parameter estimation in different methods. We used both the arbitrary cutoff or RMSD (i.e., 0.1 from TIMSS 2019) and model-predicted cutoffs from [74] (i.e., 0.060, 0.070, 0.075, and 0.075 for 2-, 5-, 10- and 15-group analyses, respectively).
Wald-1, GLR, and GMH require anchor items. We utilized the constant anchor item method, analyzing the non-anchor items for DIF, due to its superiority over other methods [[, e.g.,]]wang_effects_2003,wang_effects_2004,kopf_anchor_2015. We identified anchor items using Wald-2, following [126]. If all items were found DIF-free, we used the second half of the test items as anchor items.
For -value adjustment in GLR and GMH, we used Holm’s adjustment method [87], preferred over the Bonferroni procedure [116]. This adjustment is deemed necessary for GLR due to inflated Type-I errors associated with analyzing numerous groups [102]. For GMH, we reported results with and without the -value adjustment to explore the optimal option due to limited research in this area.
4 Results
4.1 Study 1
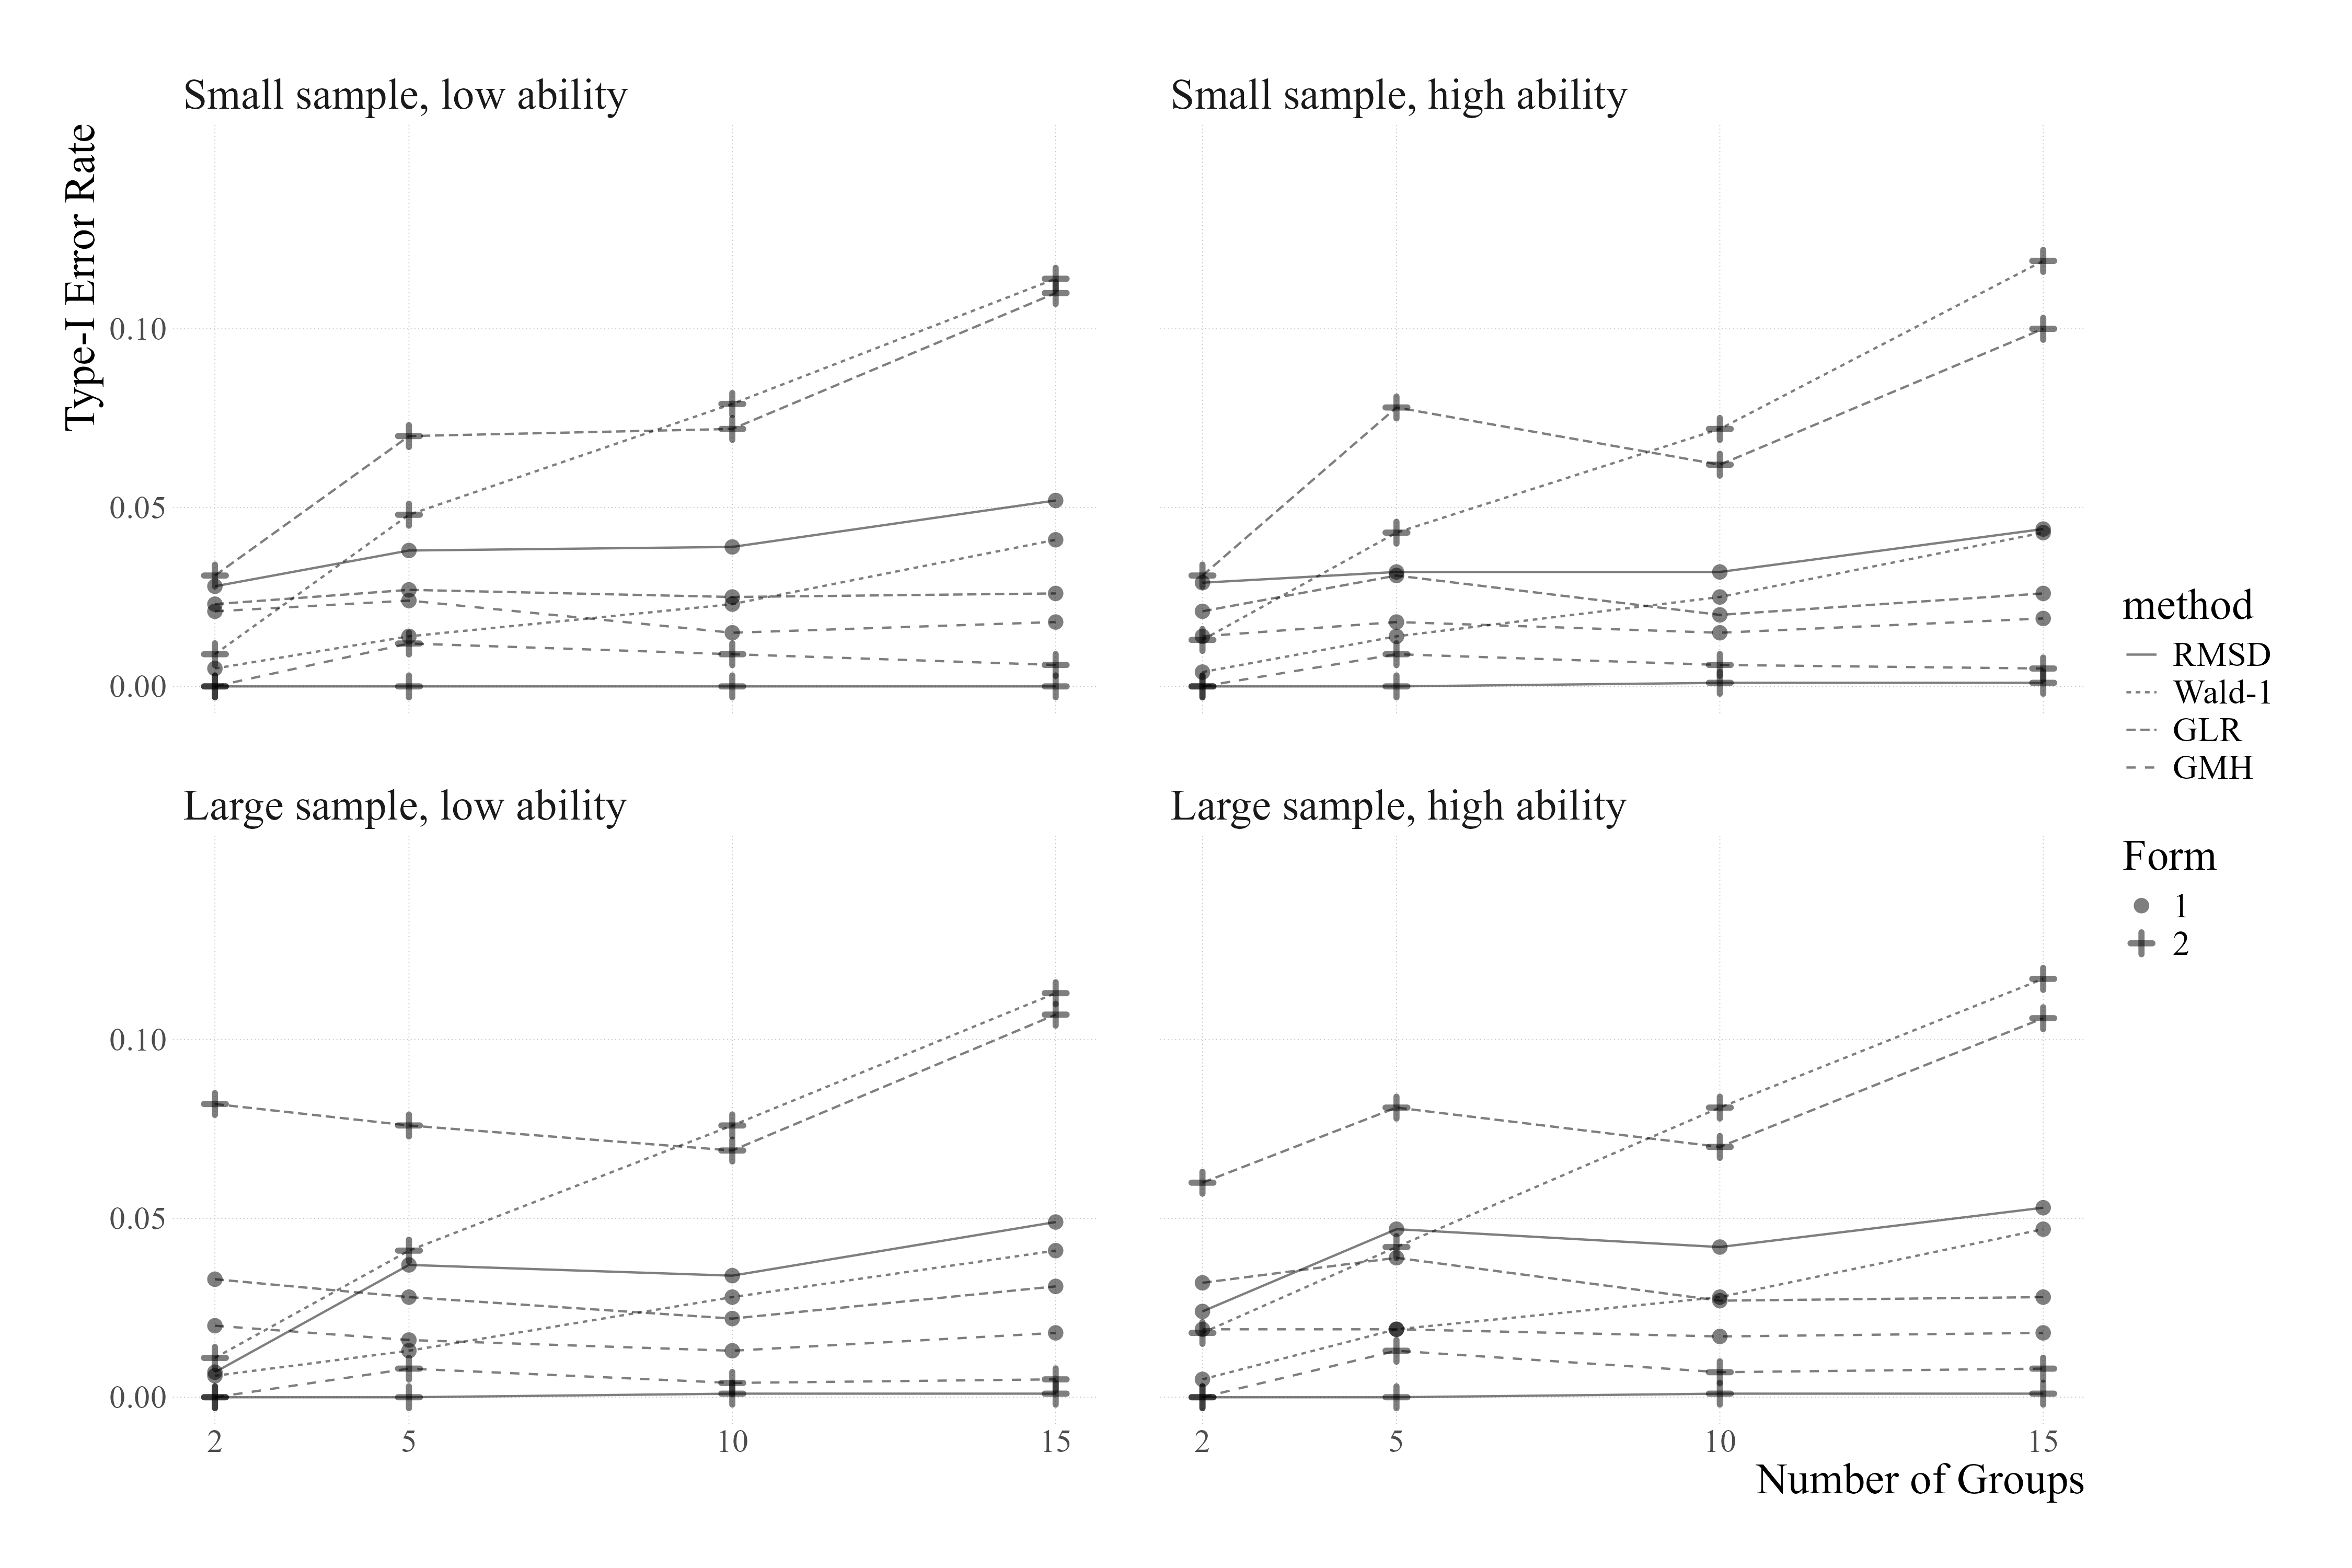
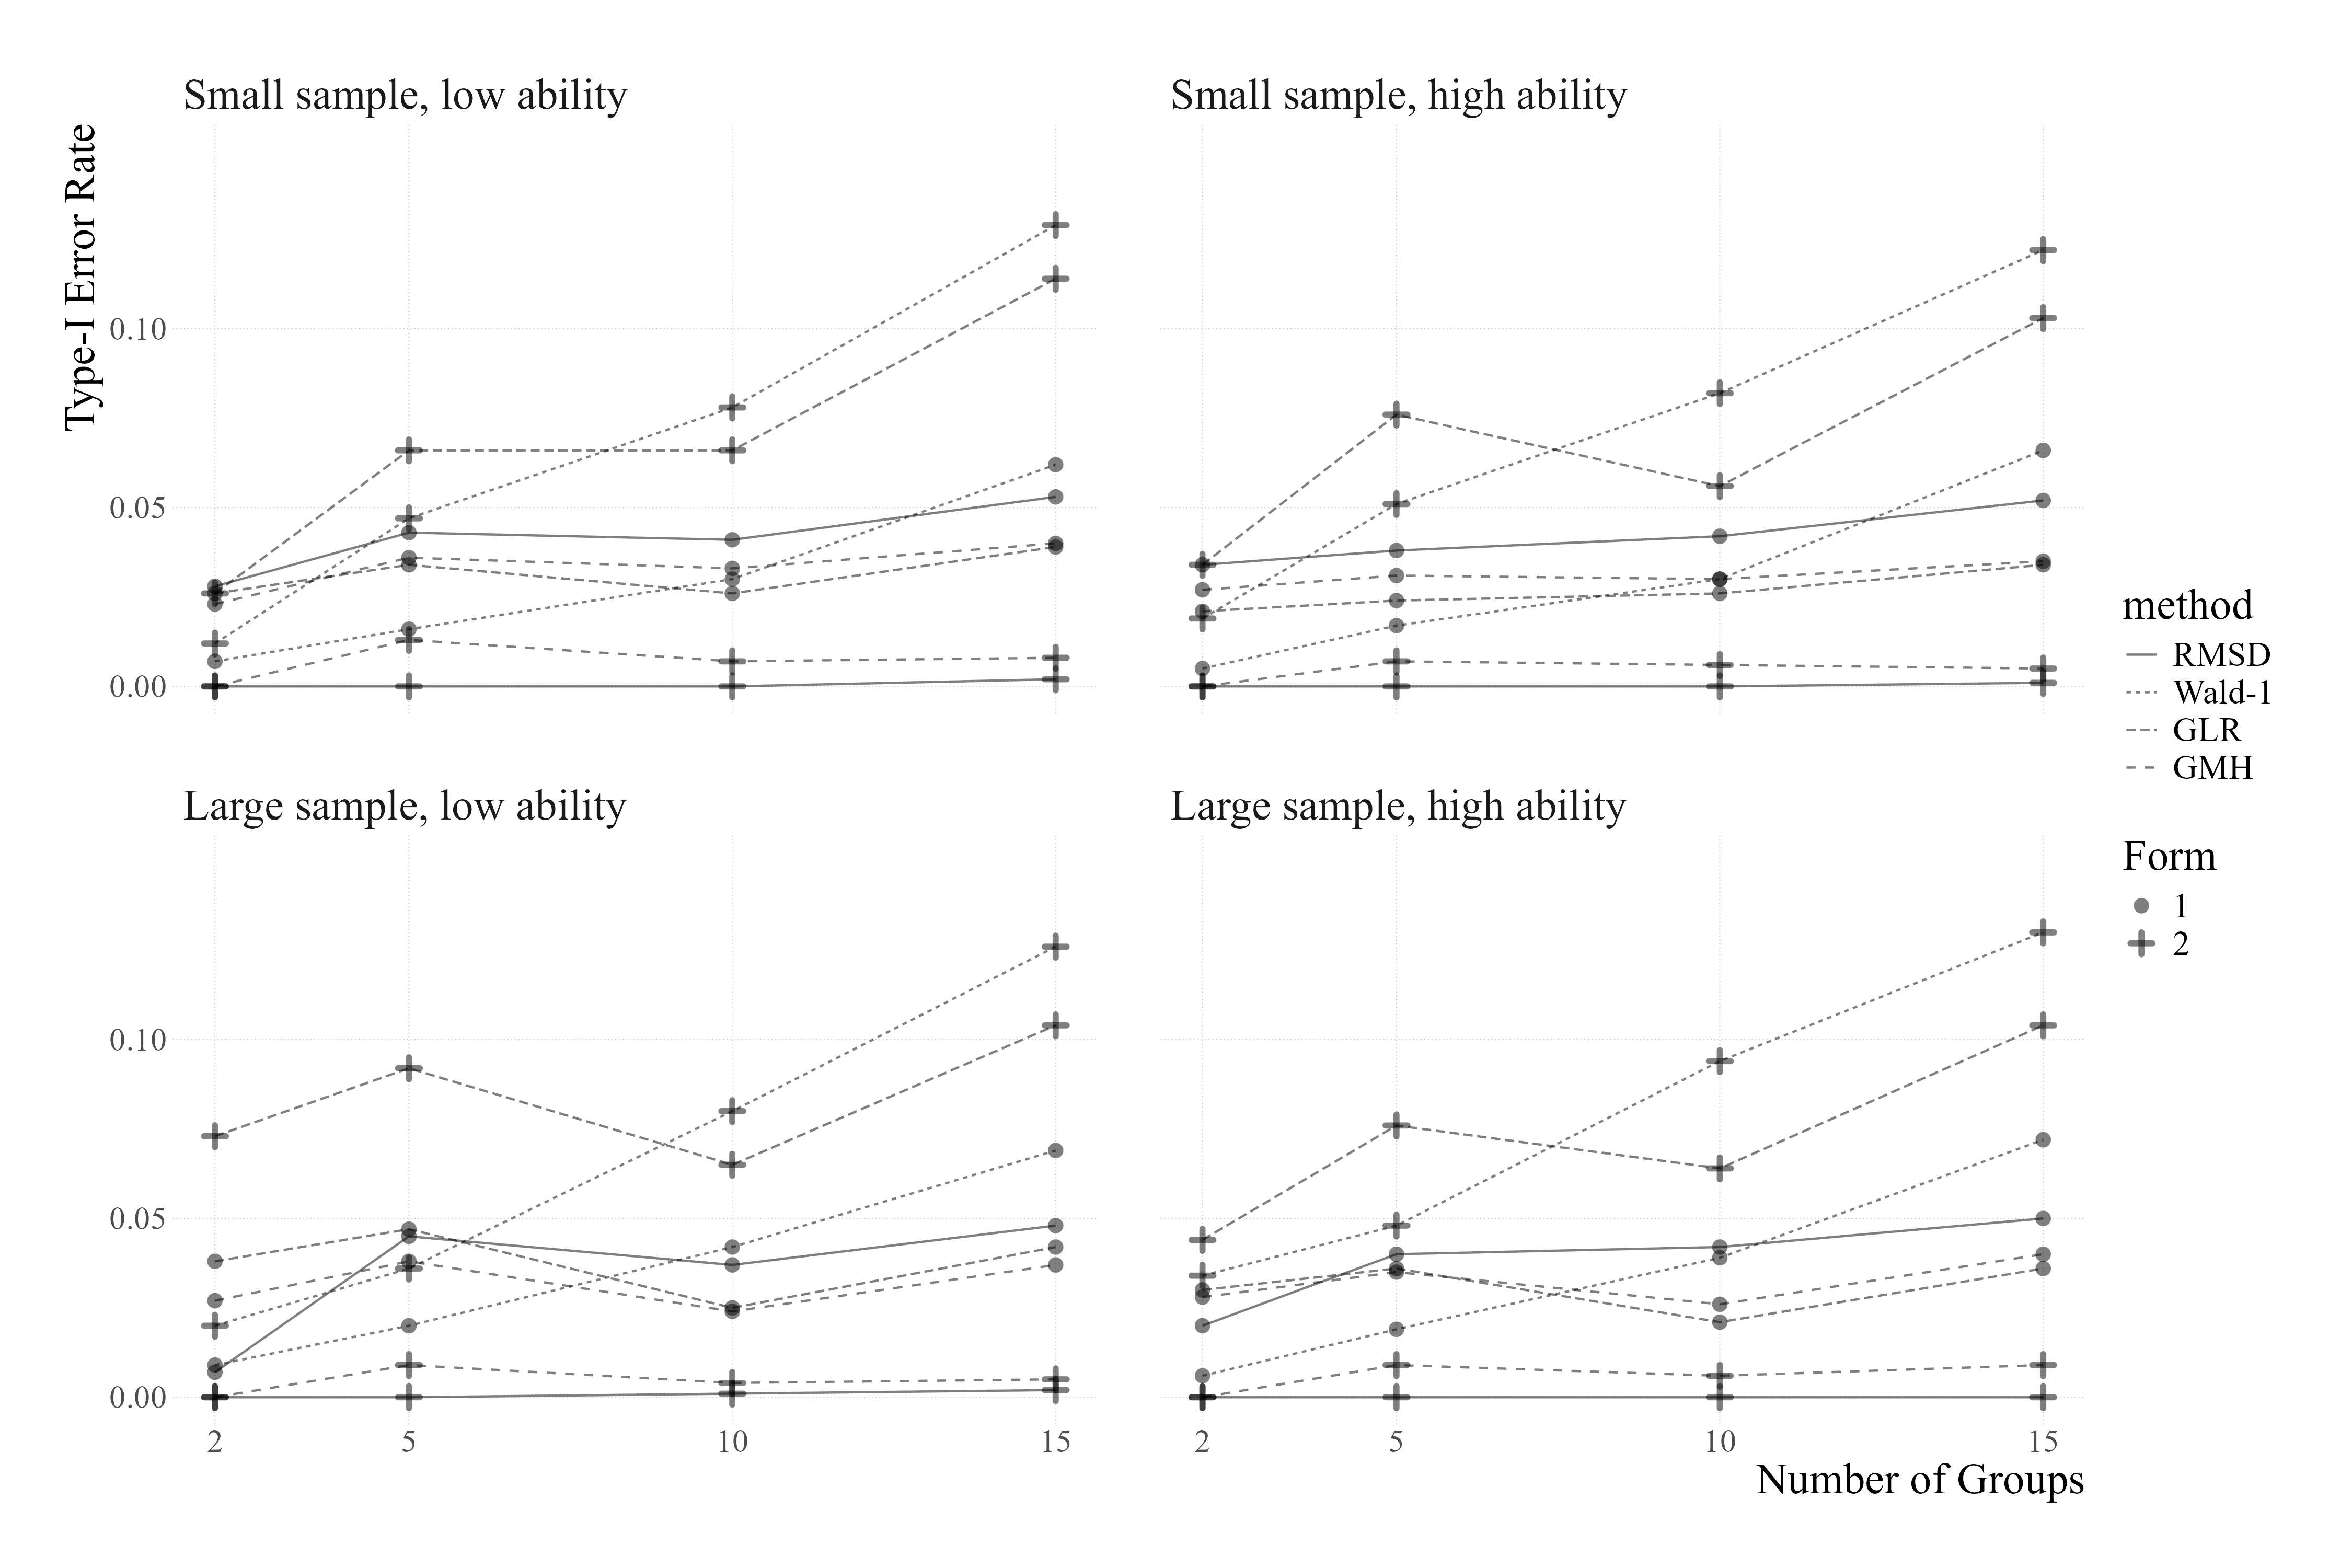
Table 3 and Figure 1 show the statistics about Type-I error rates in simulated DIF-free conditions. They present error rates across various conditions, for two variations of each method (i.e., Form 1 and Form 2), when varying the DIF-contaminated focal group in the sample size and the ability level and varying the number of groups from two to 15.
The results indicate that RMSD with the arbitrary cutoff exhibited near-zero Type-I error rates. They were overly conservative, meaning RMSD with the arbitrary cutoff is less likely to flag items as having DIF even in cases where some DIF might be present. However, RMSD with model-predicted cutoffs displayed acceptable Type-I error rates, which were particularly noteworthy because they were the closest to the nominal alpha level, indicating that RMSD correctly identified items without DIF most of the time when using with model-predicted cutoffs.
GMH method showed satisfactory performance when not using the -value adjustment, as these rates were within the acceptable range. However, GMH became overly conservative when using the -value adjustment, demonstrated by its excessively low Type-I error rates. This conservative nature with -value adjustment, while reducing false positives, may inadvertently increase the risk of false negatives, making GMH less suitable for scenarios where identifying all potential DIF items is critical.
Wald-1 and GLR were shown to be useful for detecting both uniform and nonuniform DIF. However, they exhibited inflated Type-I error rates when detecting nonuniform DIF. Also, their performance varied greatly with the number of groups involved in the analysis. In particular, their Type-I error rates for nonuniform DIF analyses with 15 groups exceeded the acceptable range [0.01, 0.09]. This suggests that Wald-1 and GLR may be less reliable when dealing with a large number of groups, particularly for nonuniform DIF detection.
In summary, while each method has its strengths and limitations, RMSD with its model-predicted cutoff showed optimal performance in maintaining low Type-I error rates. GMH turned overly conservative with the -value adjustment. Wald-1 and GLR were versatile for DIF detection but struggled with larger group analyses, particularly for nonuniform DIF detection.
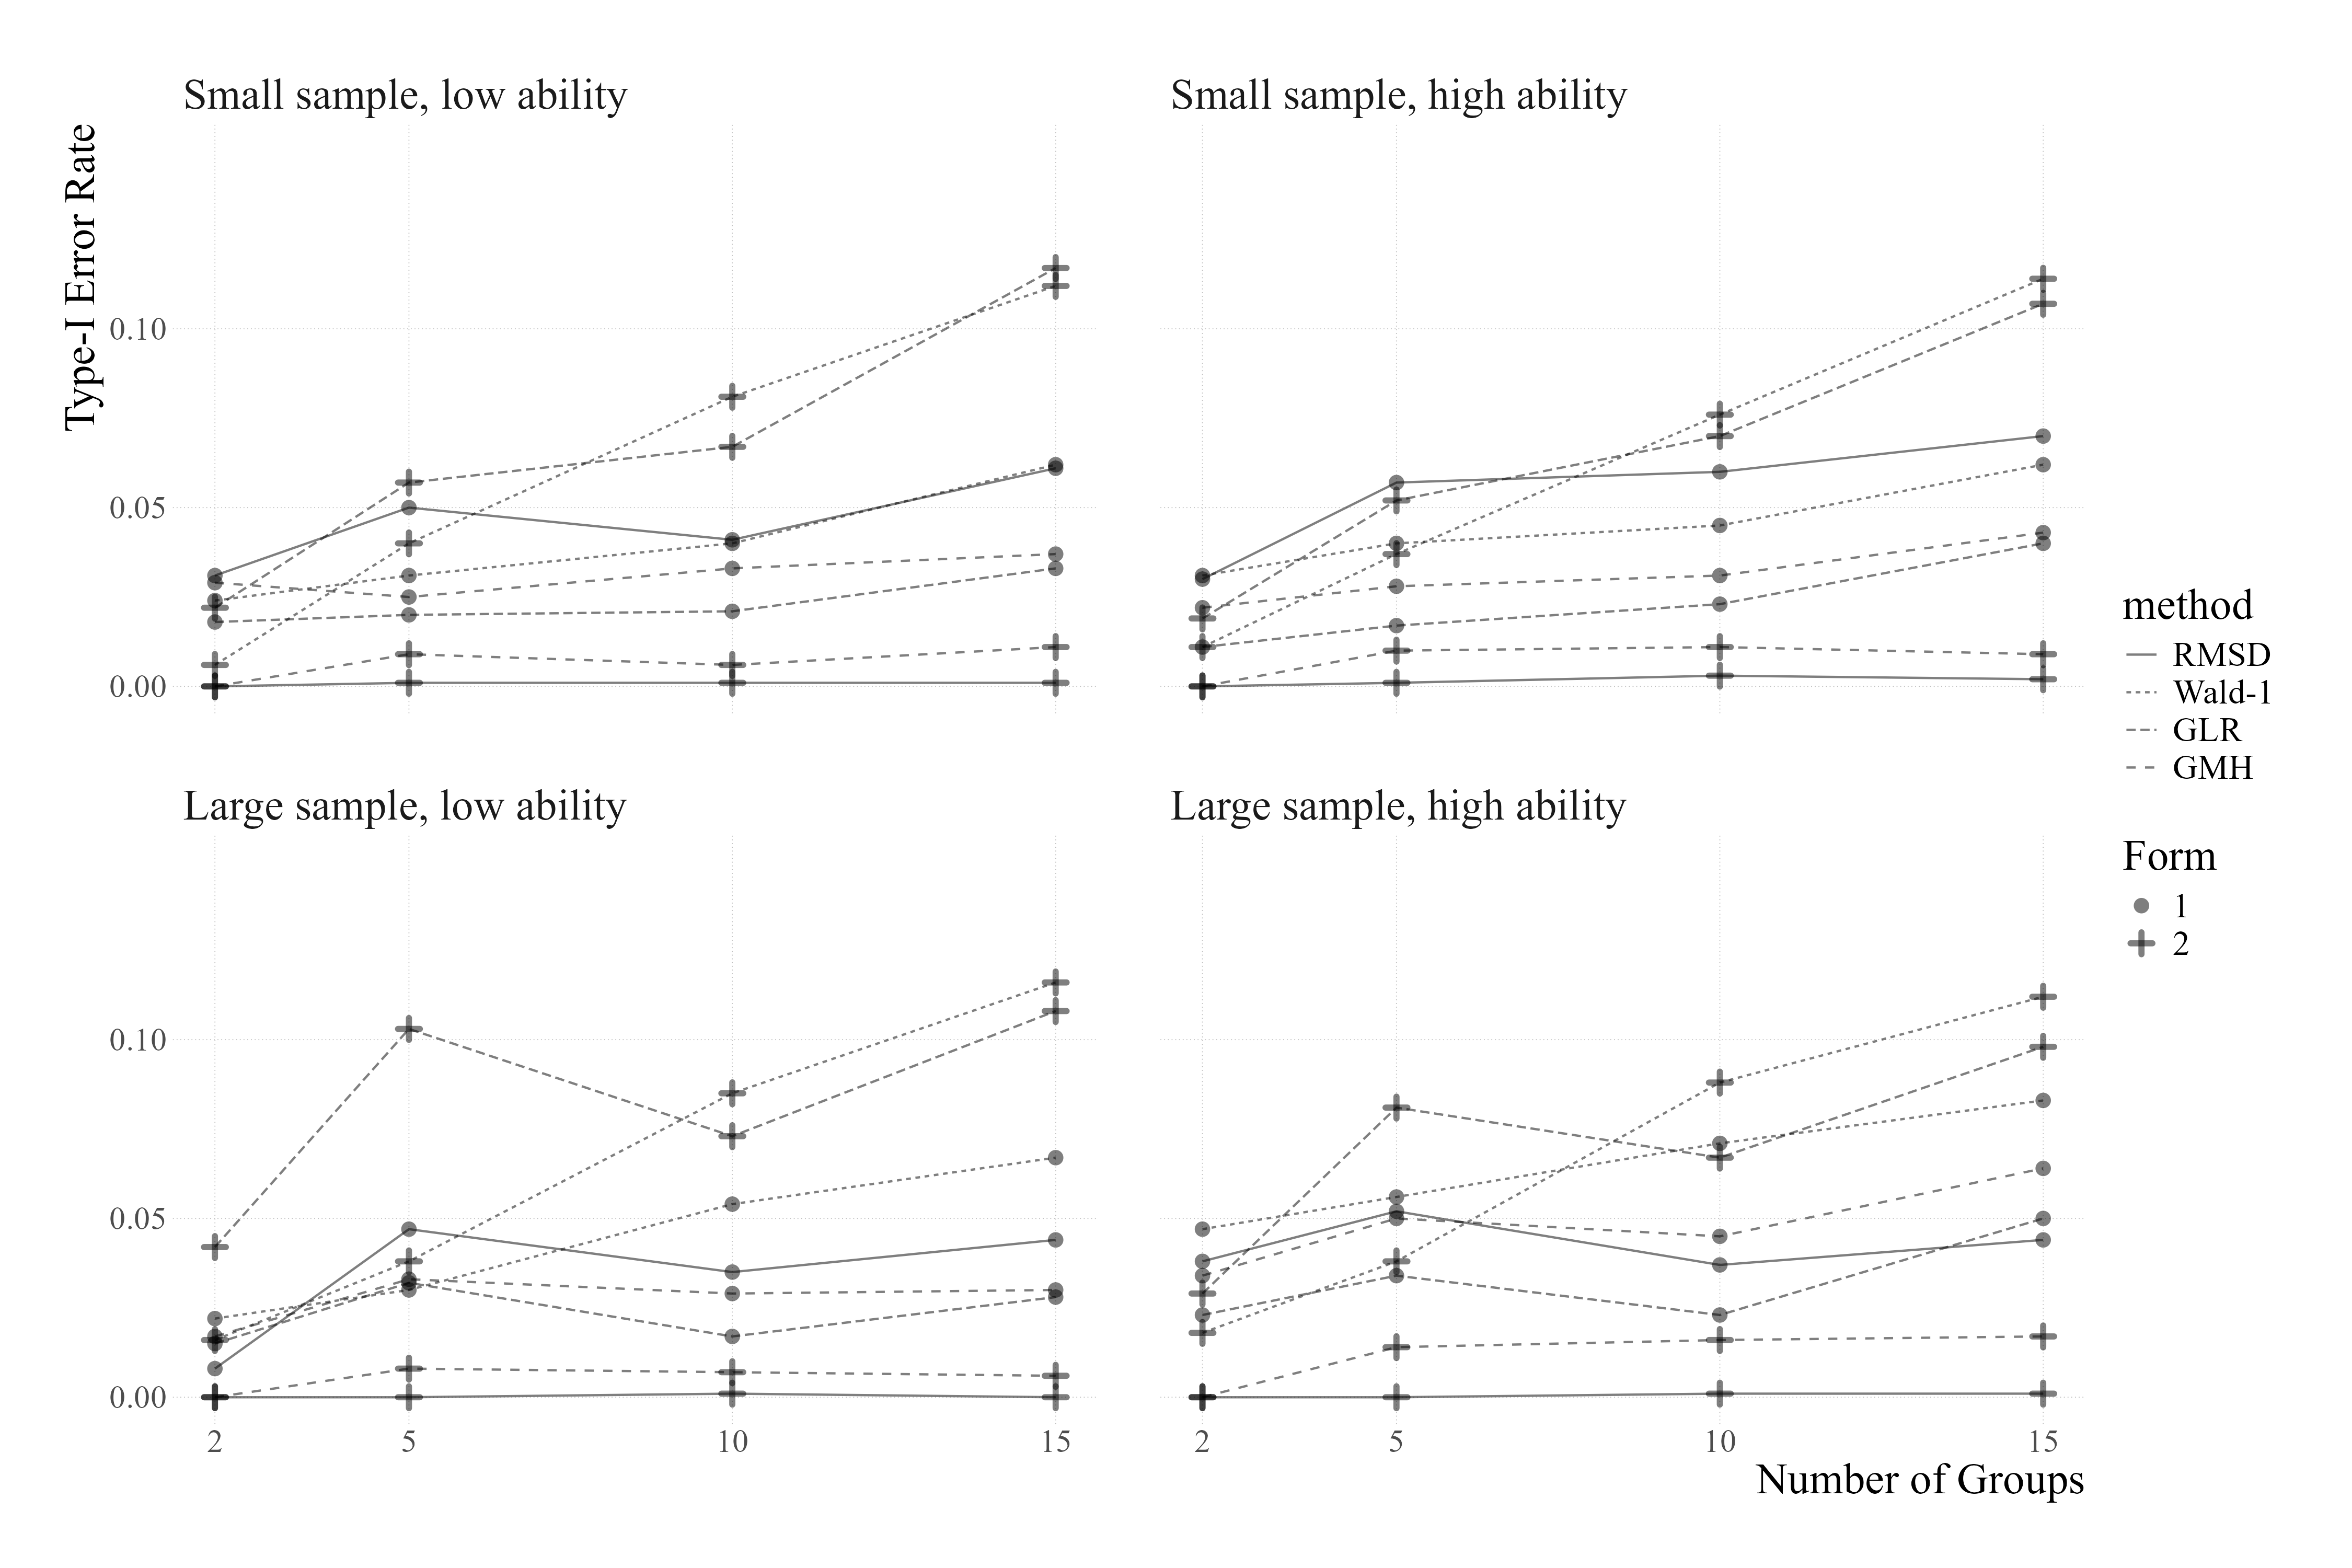
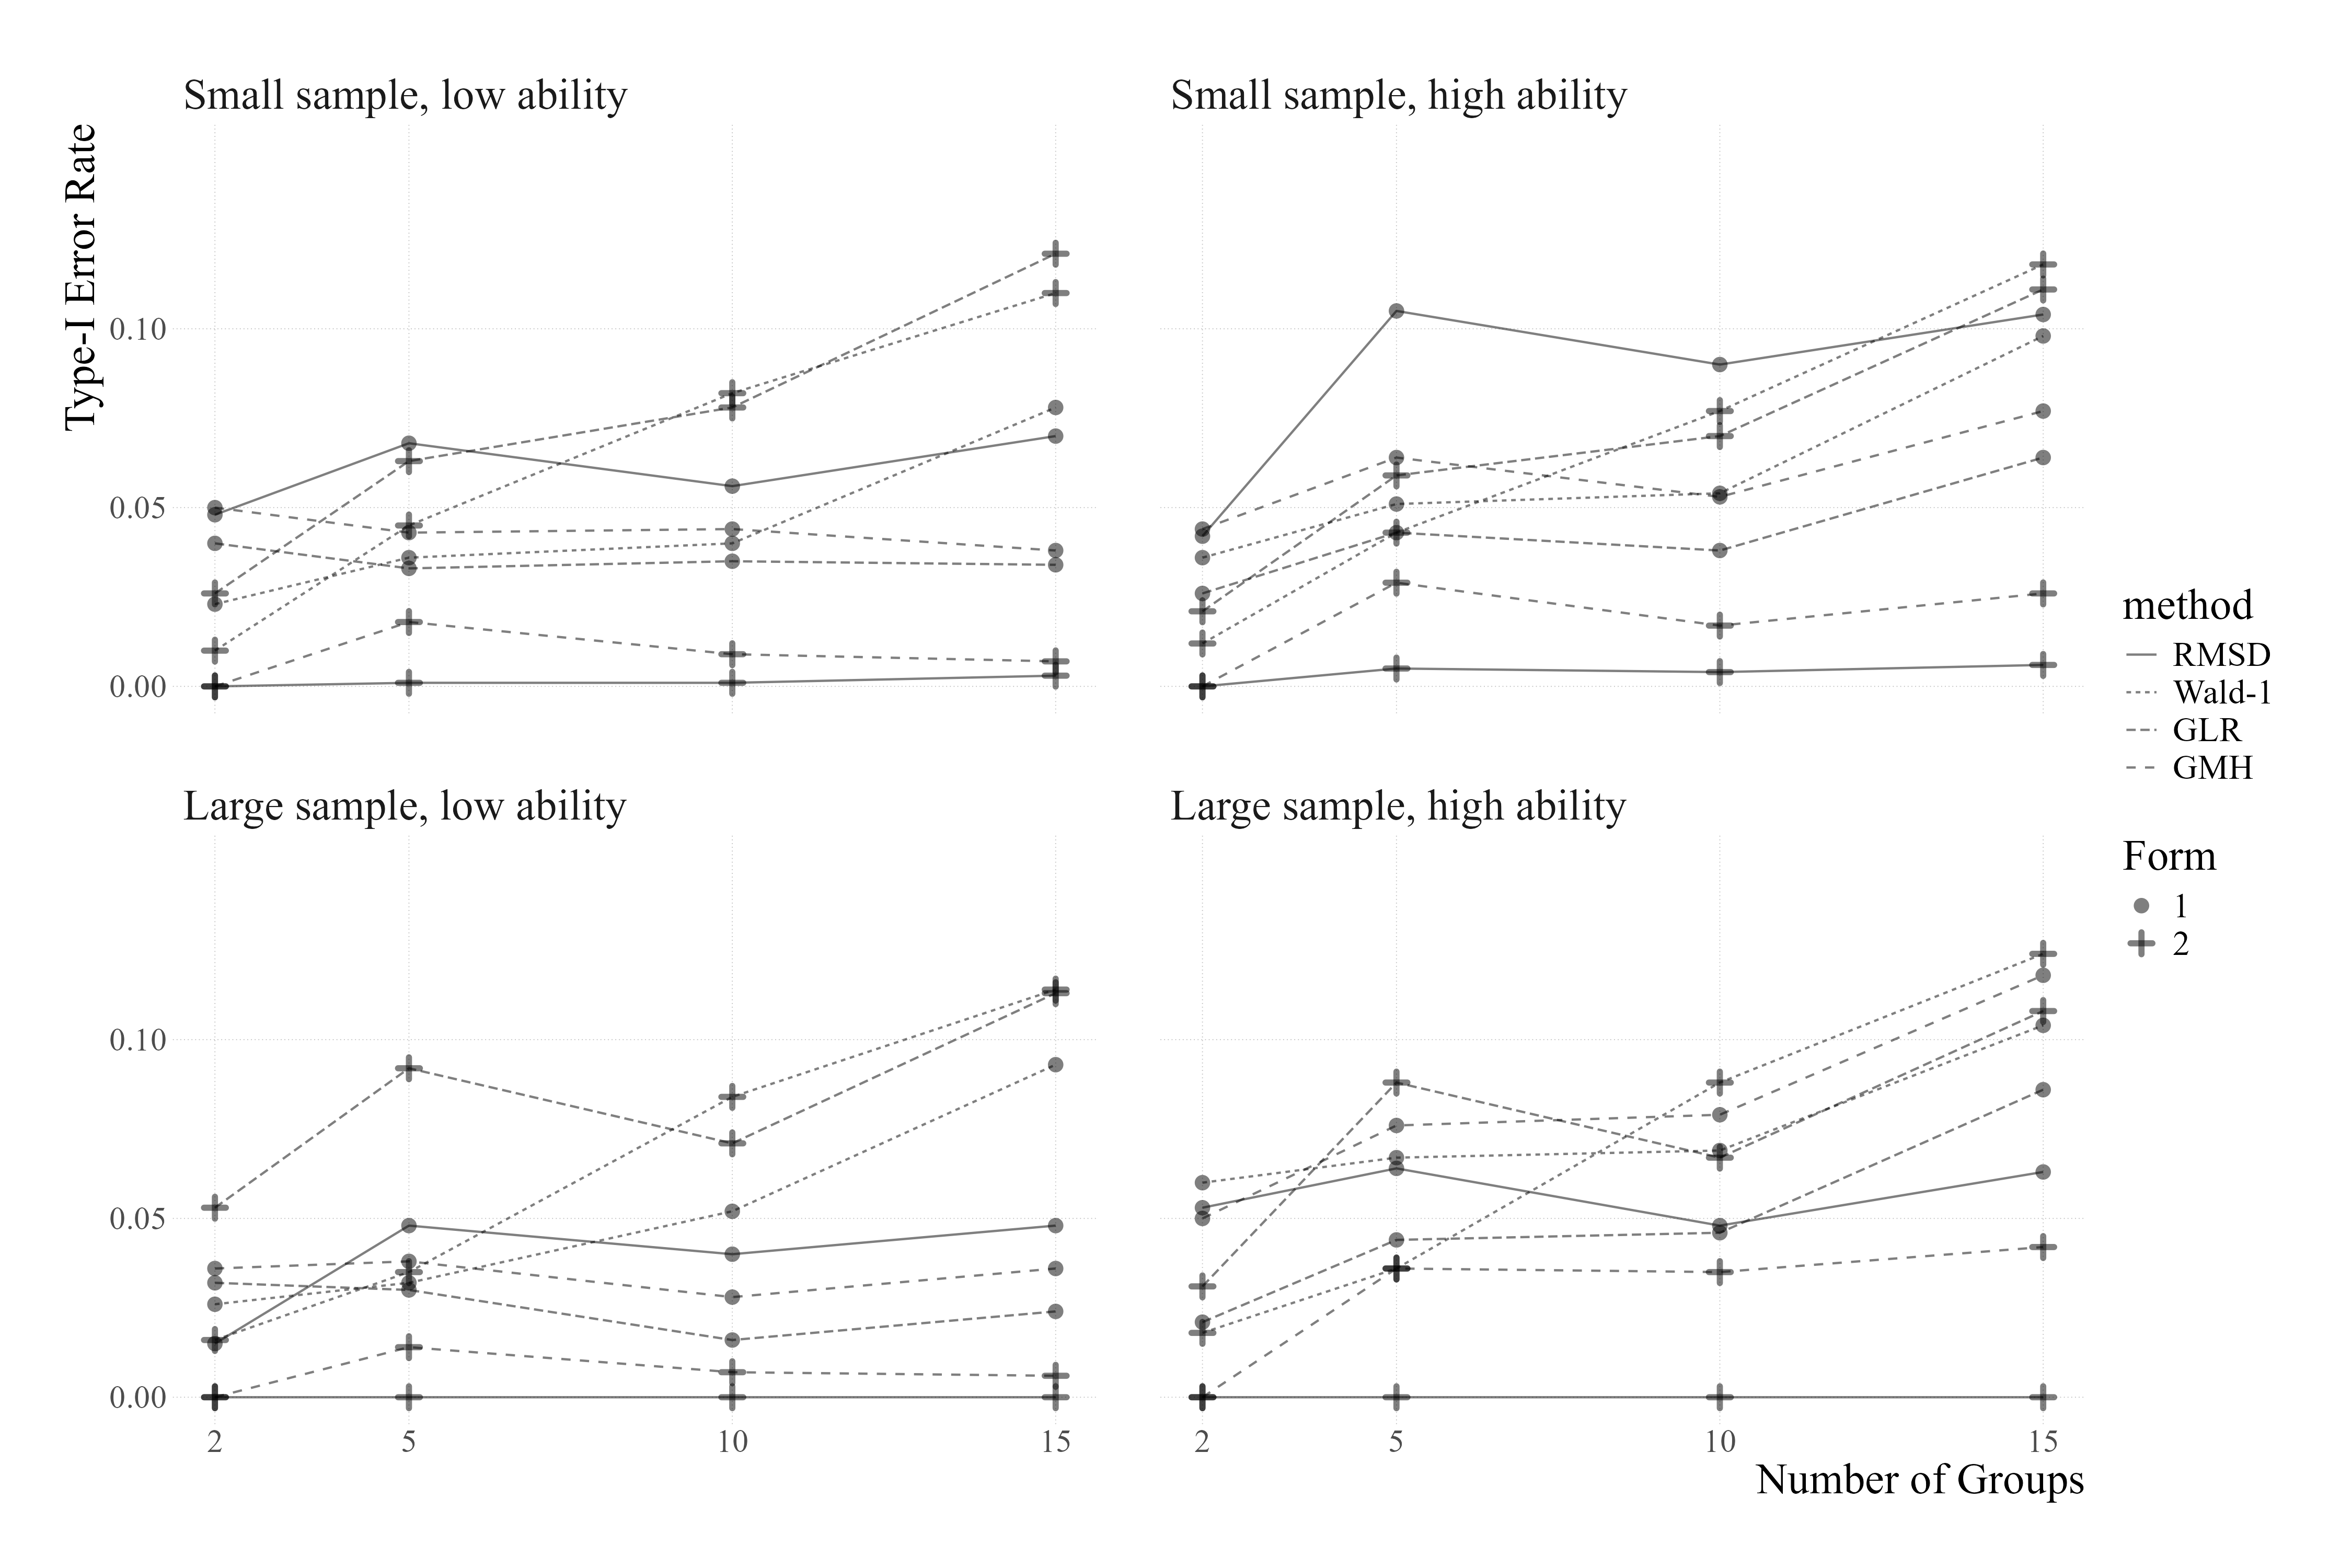
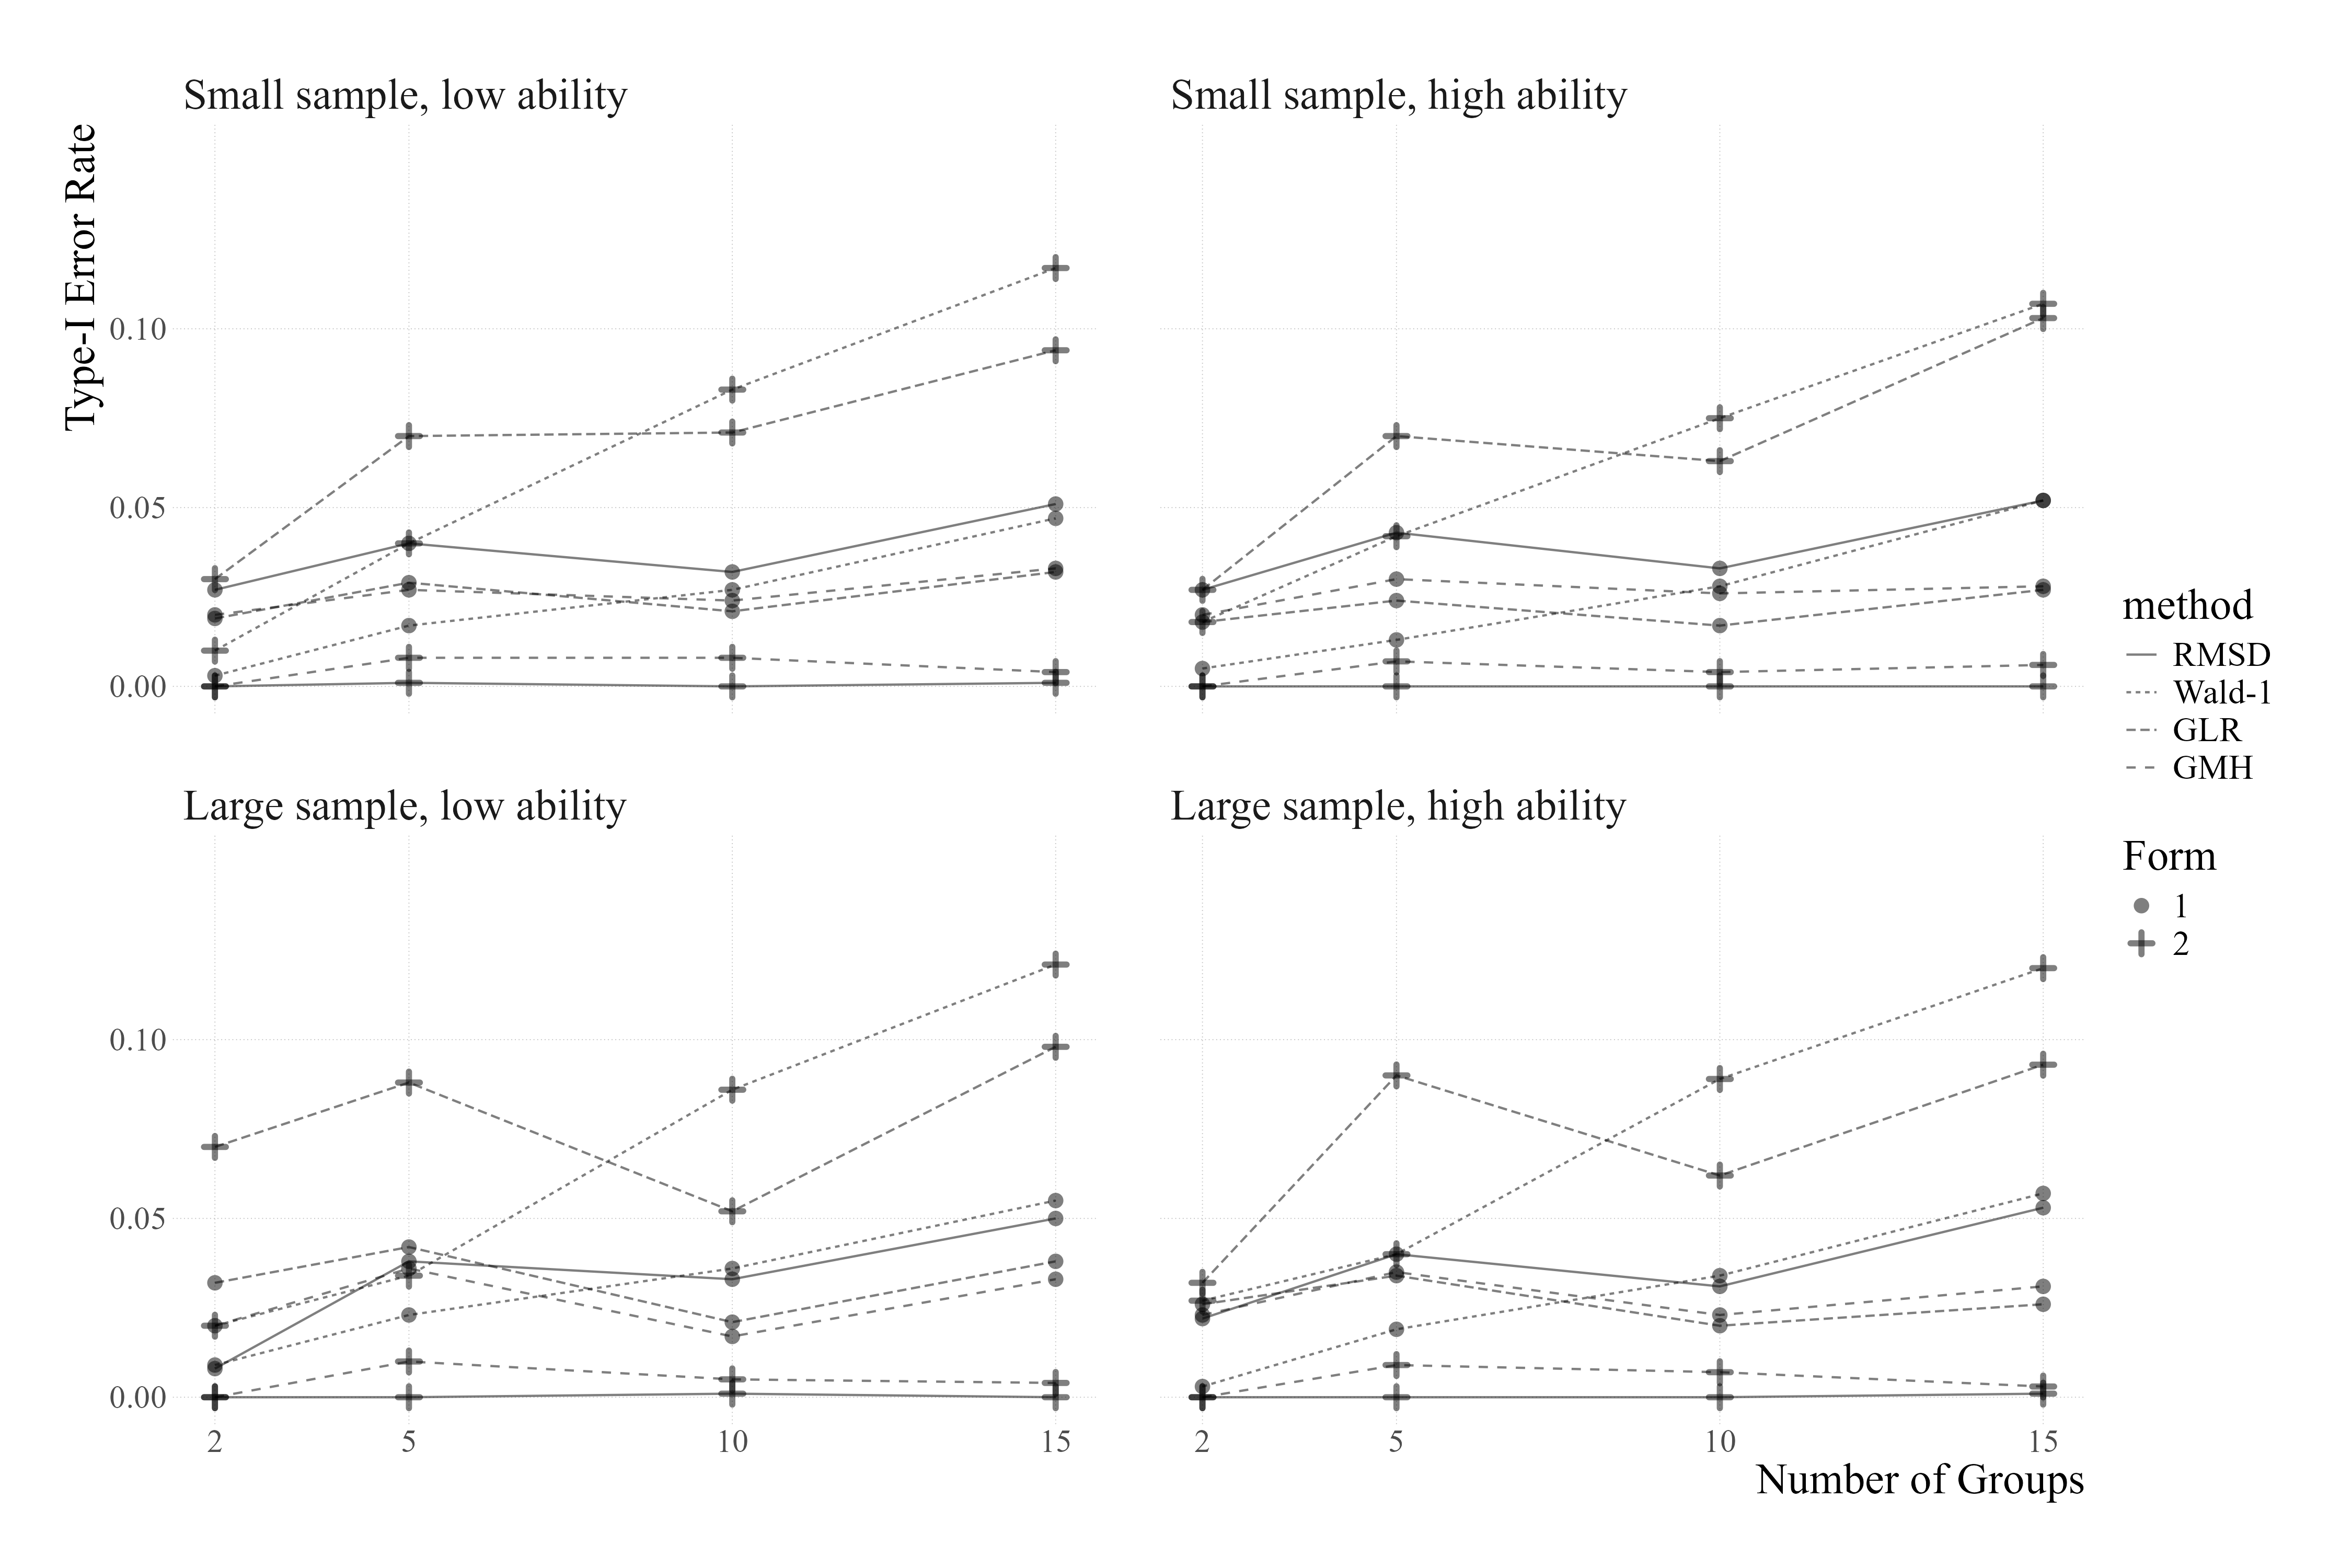
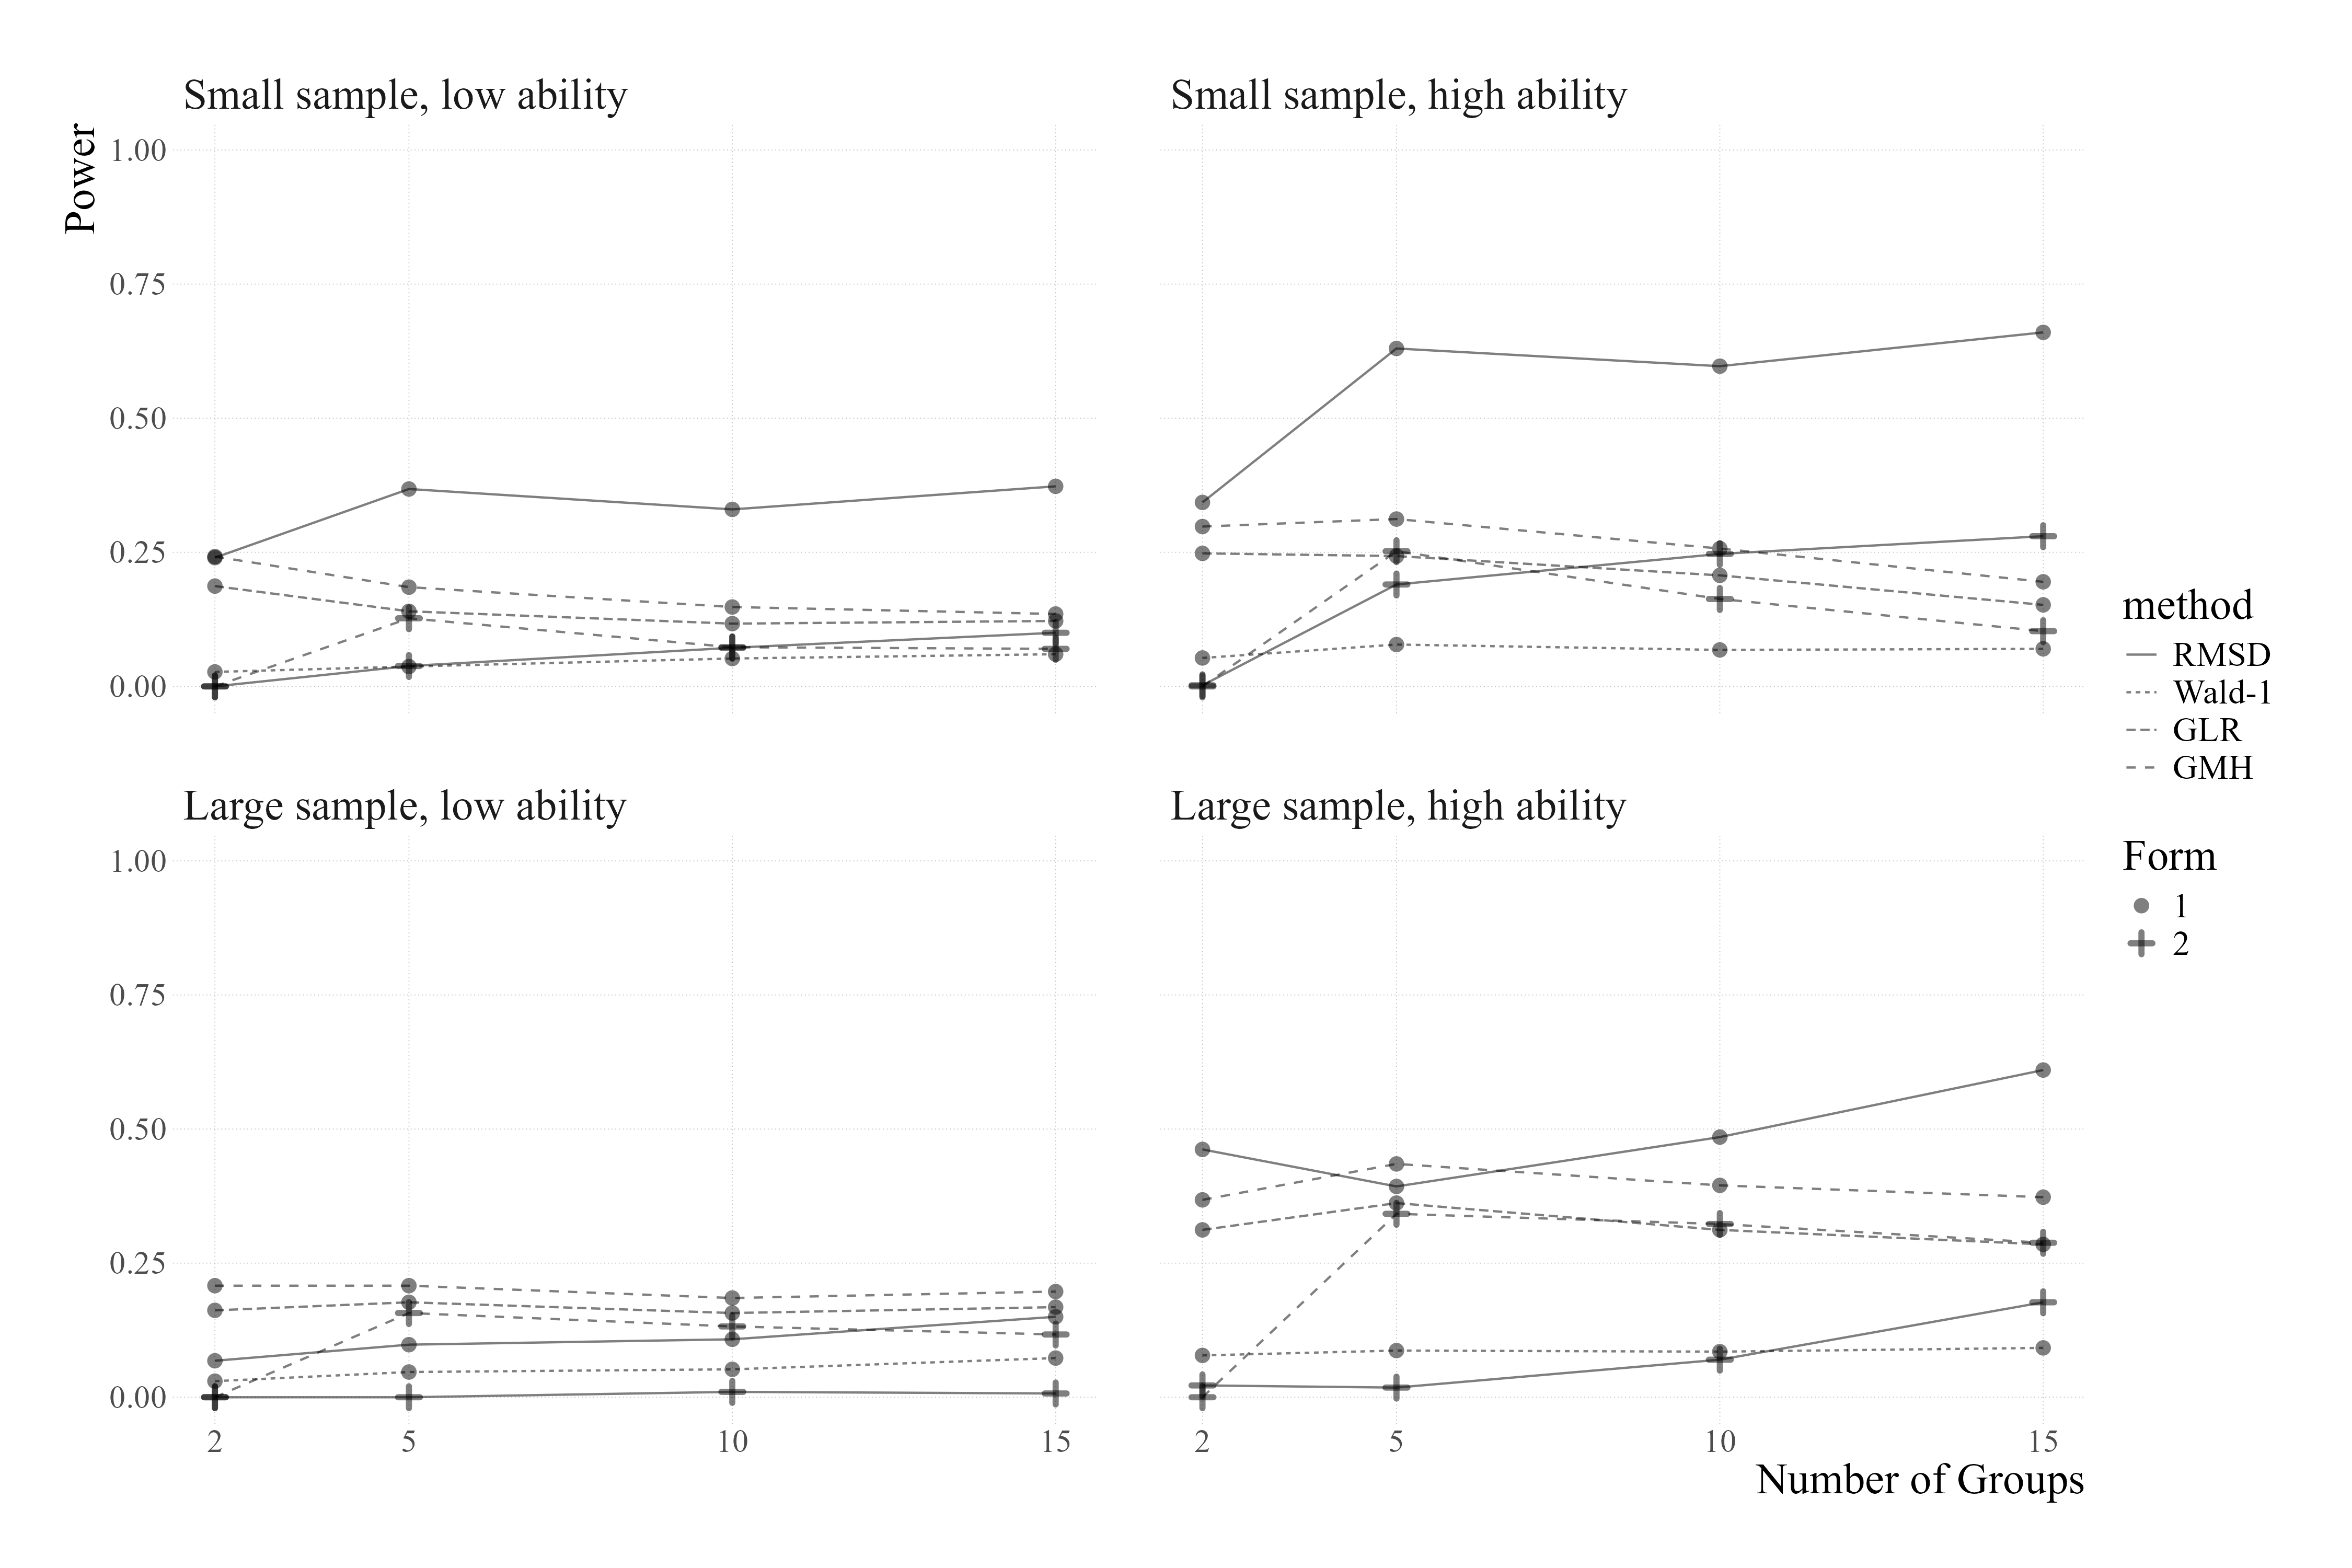
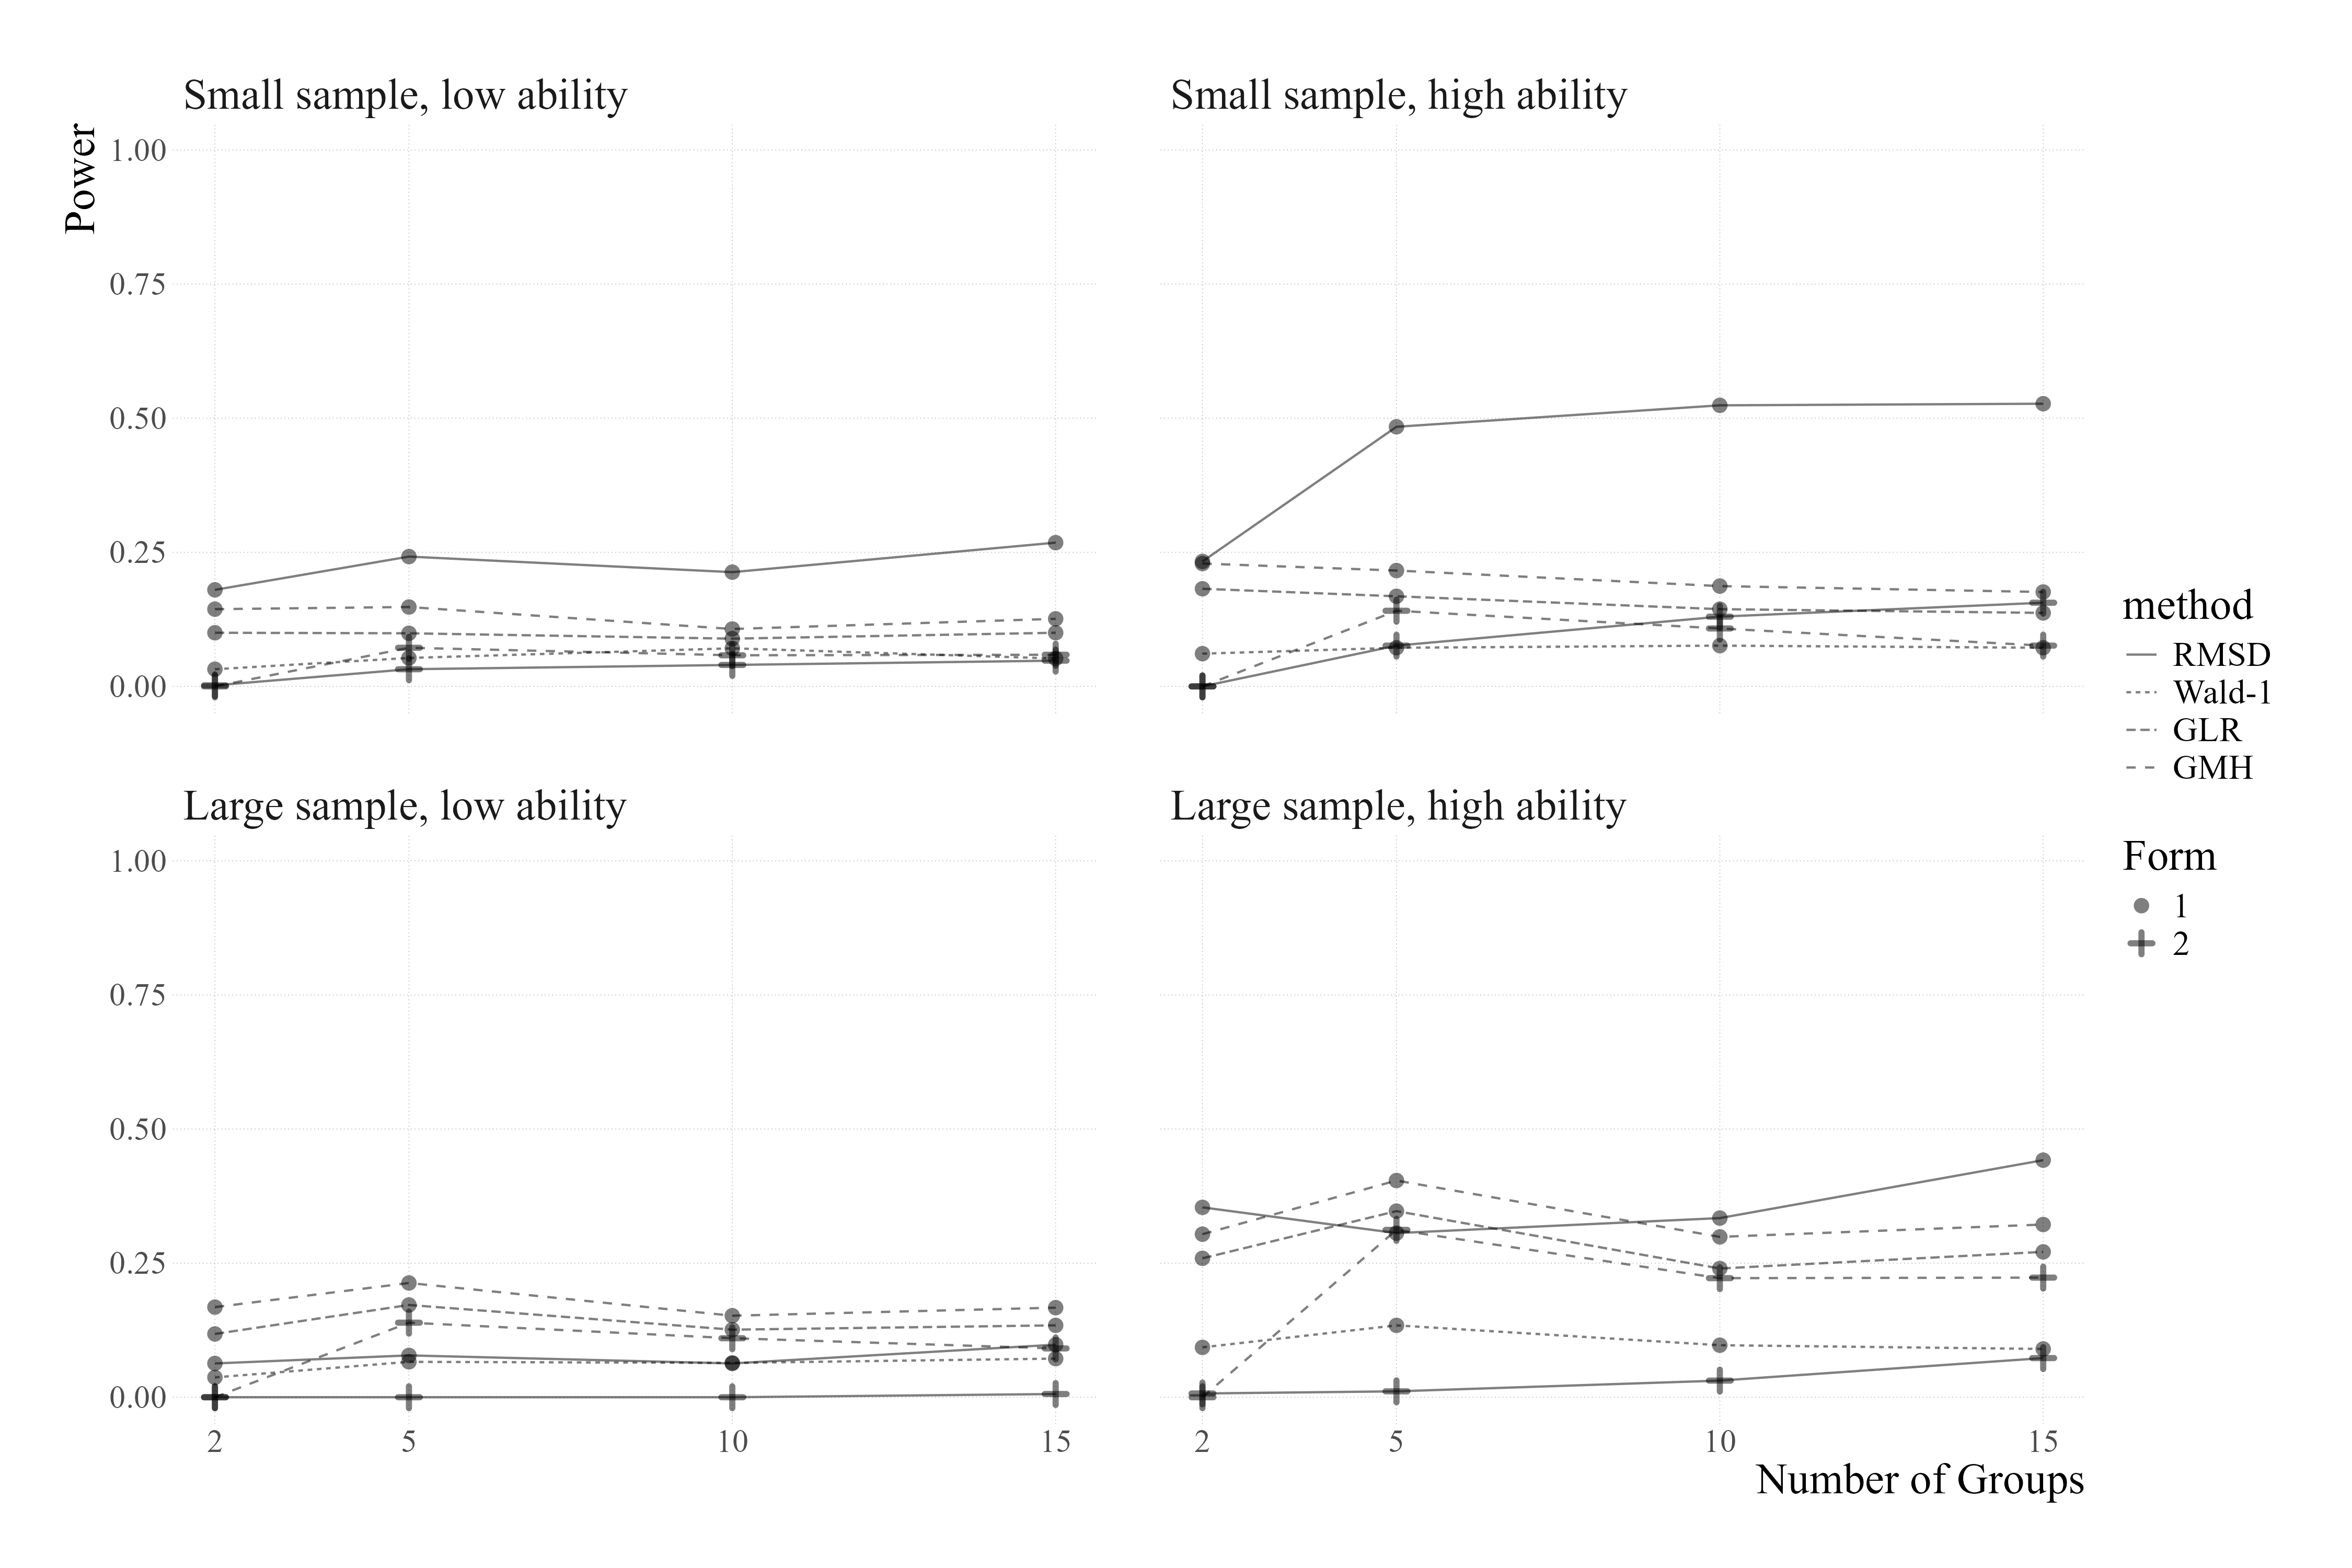
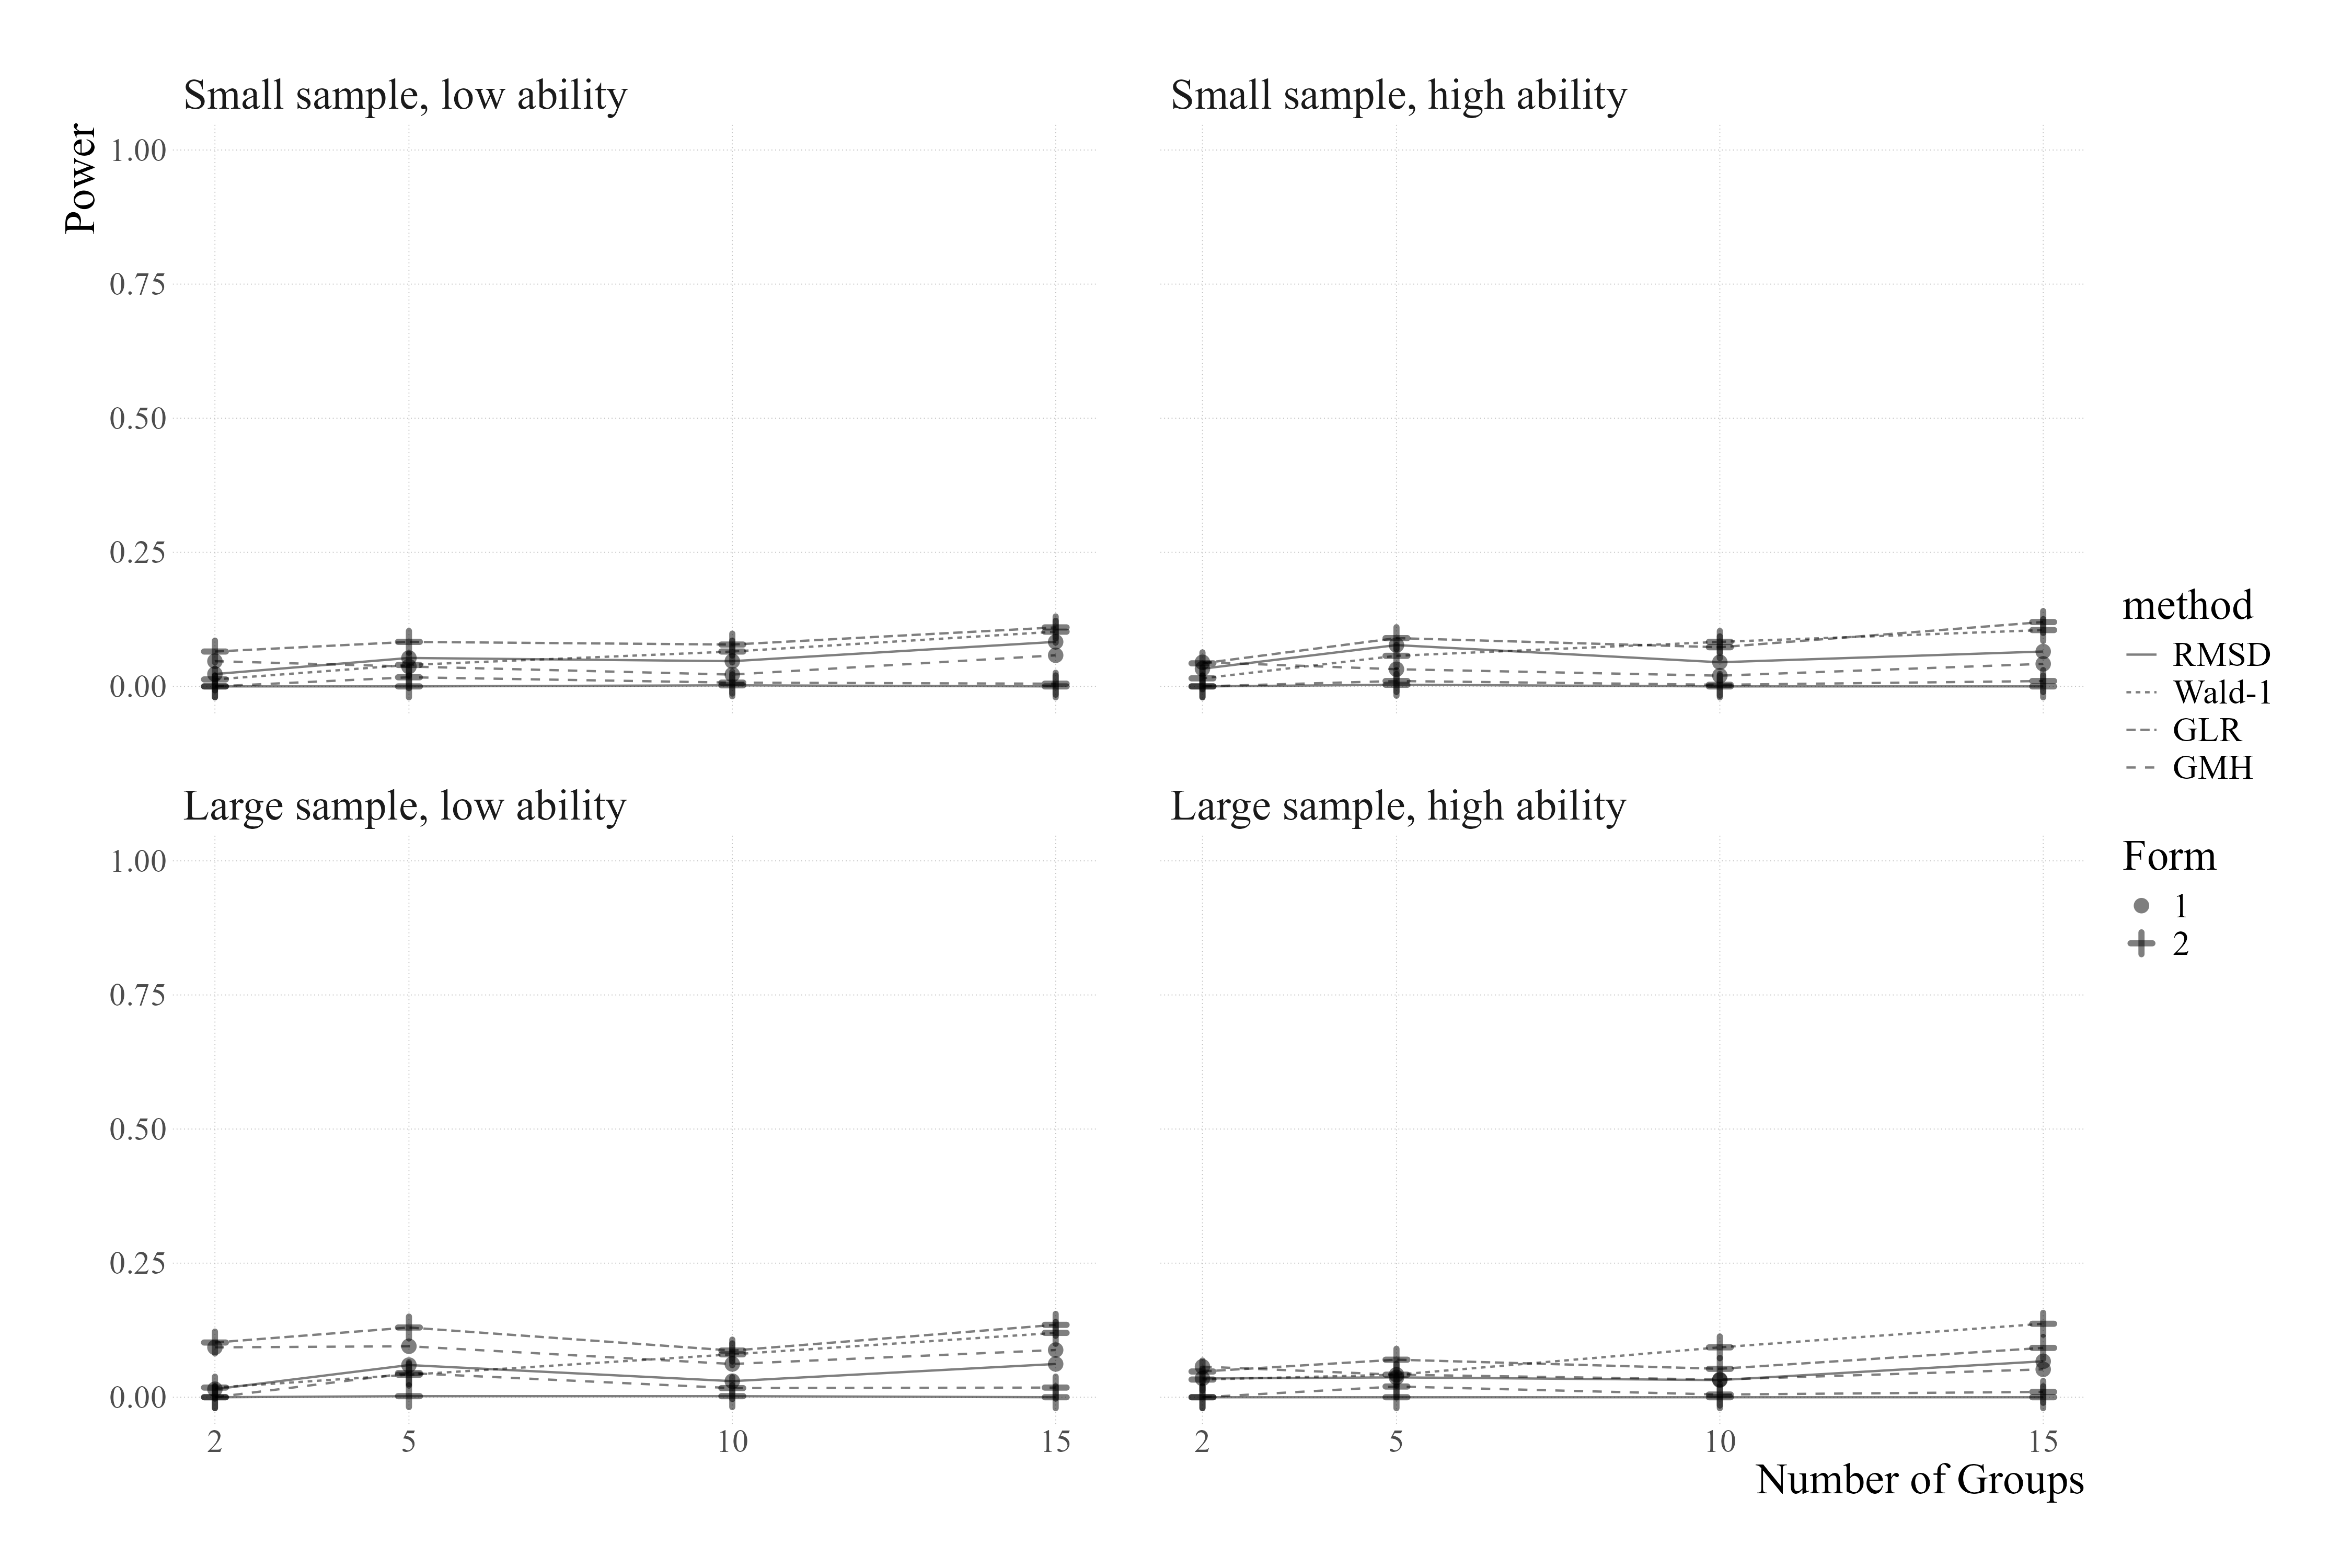
4.2 Study 2
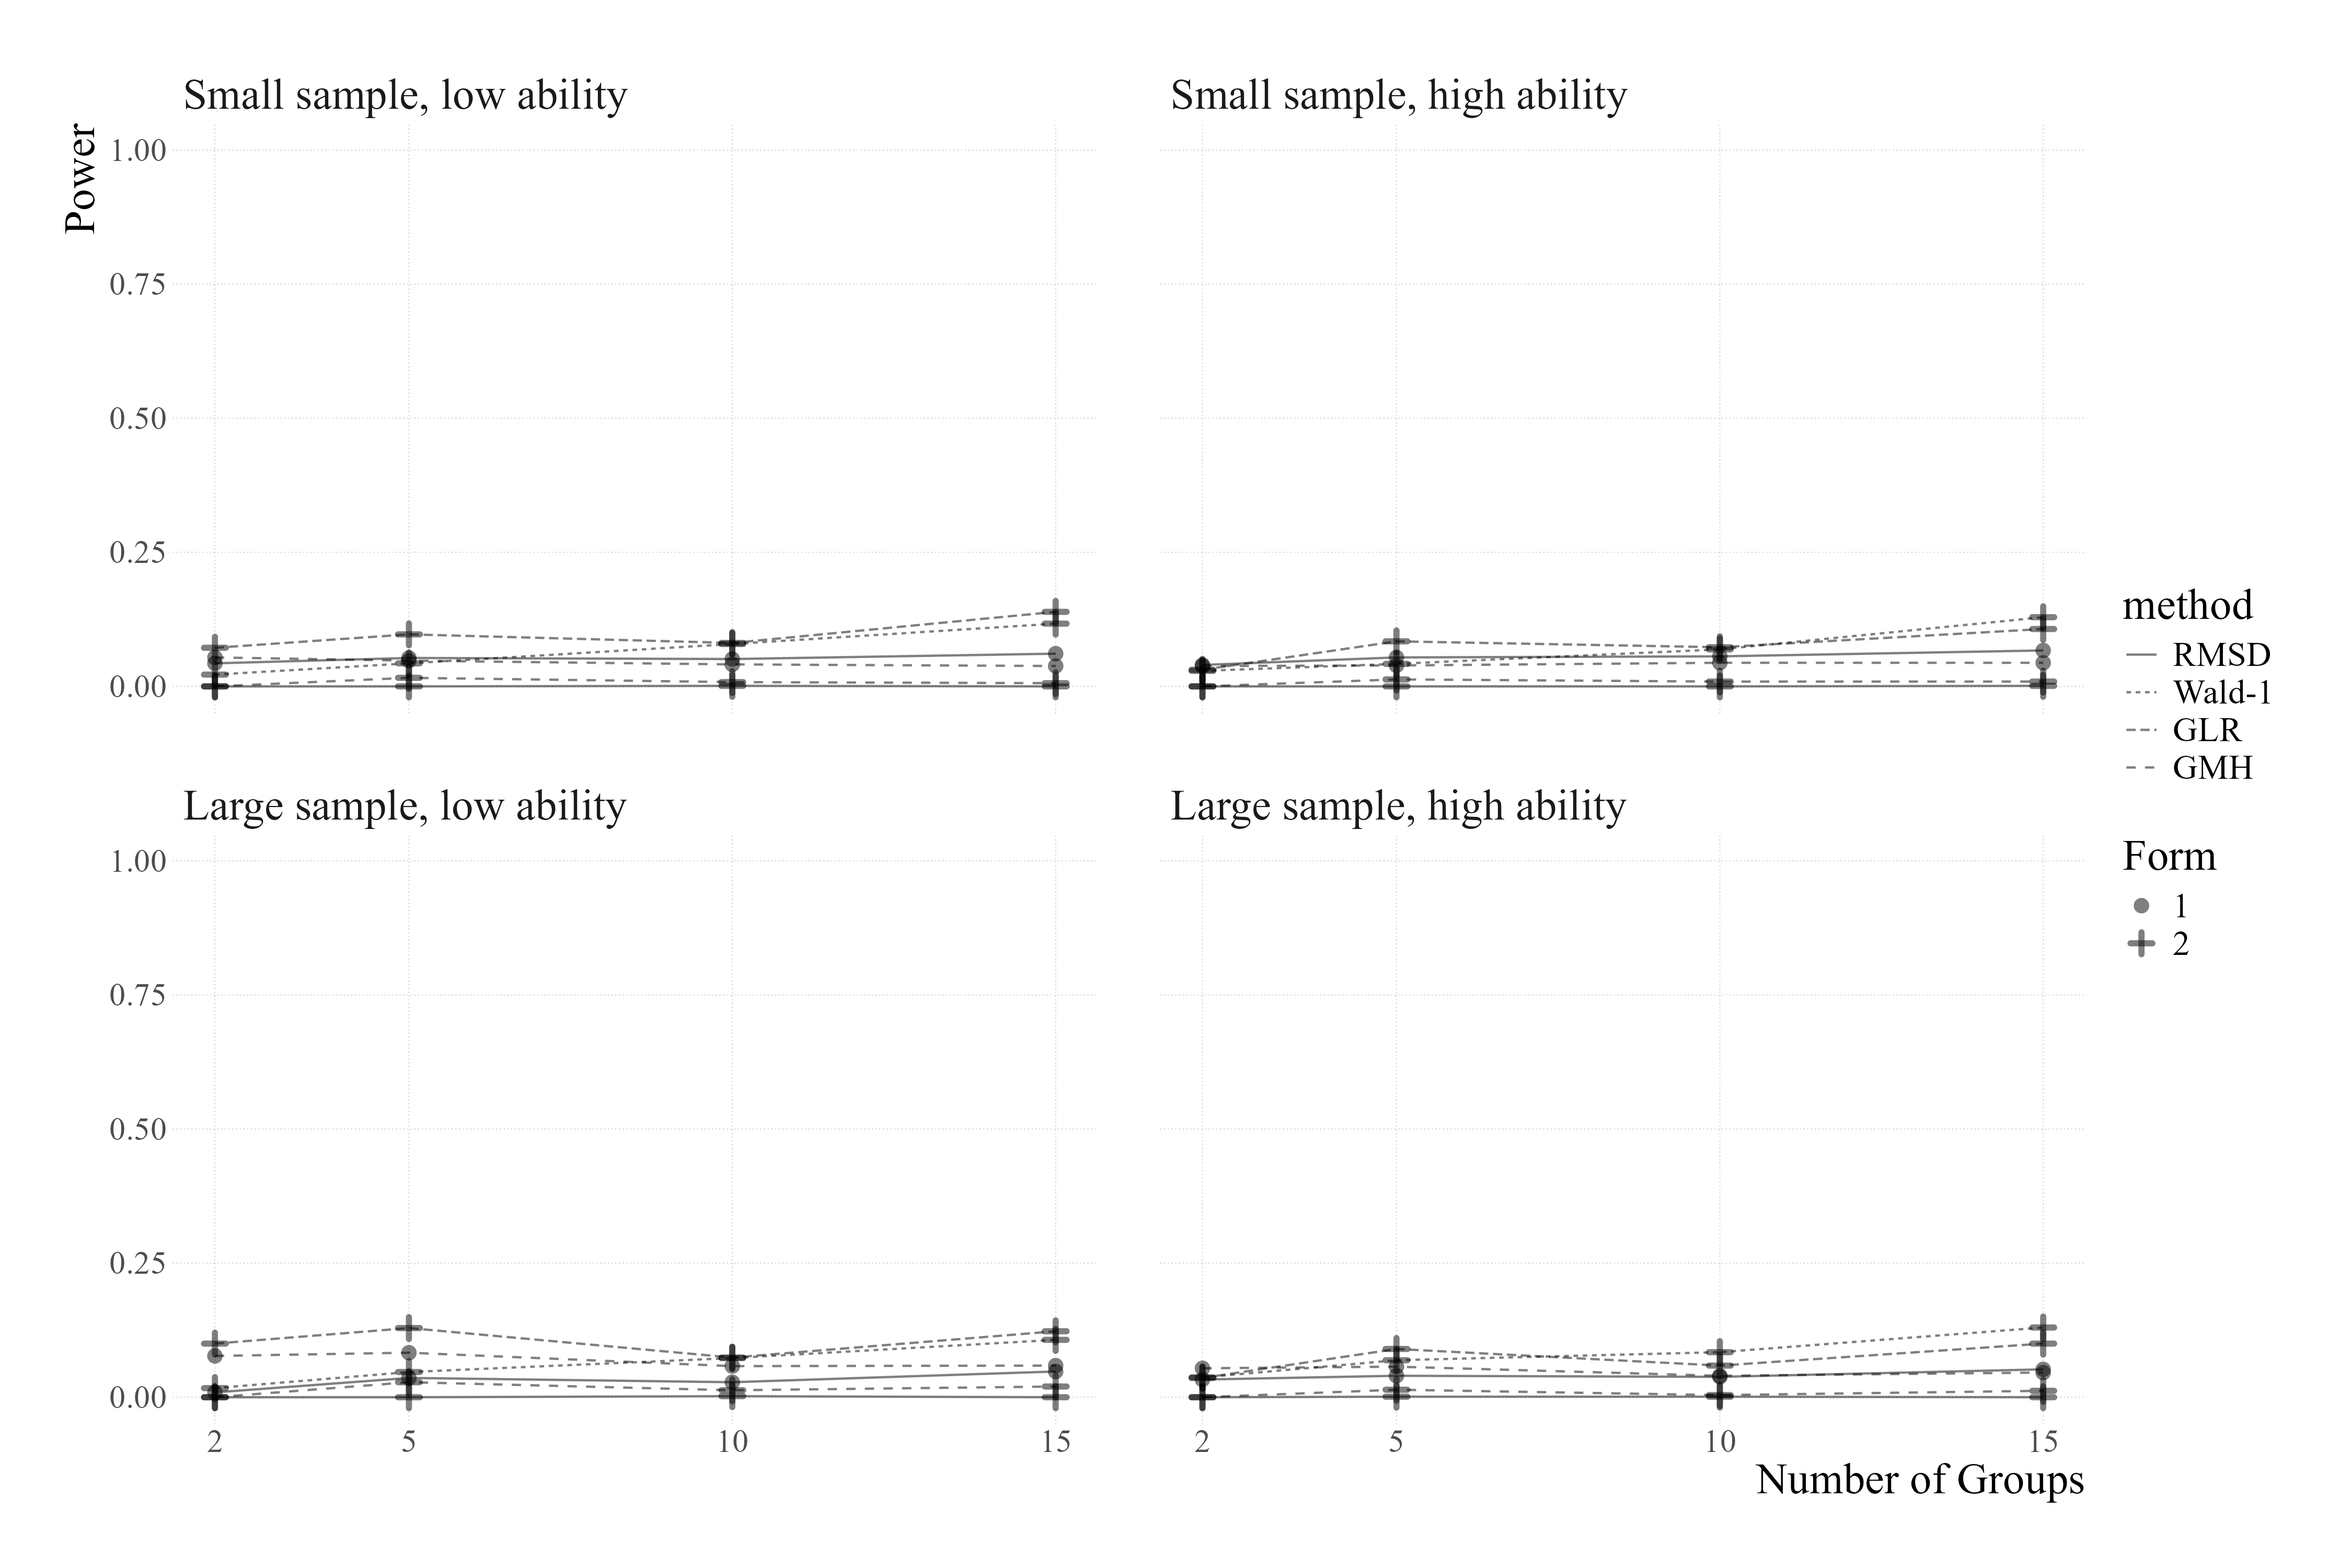
Study 2 extends the findings from Study 1 by exploring the different DIF detection methods with DIF-contaminated conditions. Figures 3-9 visualize the means of Type-I and power rates for each method tested for each simulated condition. Tables 4-5 present the statistics for one condition (i.e., with DIF in for 20% of items) as an example. Similar tables about other conditions are provided in supplementary materials. Since high error rates can lead to unreliable power results, we did not discuss power estimates from conditions in Study 1 that exhibited excessively high Type I error rates (i.e., when evaluating Wald-1 and GLR for nonuniform DIF detection with 15 groups).
Shown in Table 4, similar to what we found in Study 1, RMSD with the model-predicted cutoff had the best Type-I error rate, mostly around the middle of the acceptable range. GMH had ideal Type-I error rates when not adjusted for the -value. RMSD with a fixed cutoff of 0.01 was extremely conservative, with Type-I error rates being approximately zero. Wald-1 and GLR again showed inflated Type-I error rates when detecting nonuniform DIF with 15 groups, and their Type-I error rates increased as the number of groups increased. While Type I error rates for RMSD and GMH increased slightly with the addition of DIF-contaminated items, this increase was more pronounced when DIF was present in the parameter than in the parameter.
Table 5 displays powers of each method. When DIF was present in the parameter, RMSD with the model-predicted cutoff exhibited an acceptable power when analyzing five or more groups with a DIF-contaminated group featuring a small sample size and a high ability, or 15 groups with a DIF-contaminated group featuring a large sample size and a high ability. In other cases, the power to detect DIF was low. Especially, when DIF was present in the parameter, the power for all the methods remained below 0.25 across all simulated conditions. This suggests that the selected methods struggled to detect DIF associated with the paramater.
In summary, the RMSD method with the model-predicted cutoff demonstrated the best balance of controlling Type I error rates and achieving acceptable power. It was the case when DIF was associated with the parameter, the DIF-contaminated group had a high ability level, and five or more groups were involved in the analysis.
| Form 1i | Form 2ii | ||||||||
| Conditions | Method | 2grps | 5grps | 10grps | 15grps | 2grps | 5grps | 10grps | 15grps |
| Small sample | |||||||||
| Low ability | RMSD | 0.028 | 0.038 | 0.039 | 0.052 | 0.000 | 0.000 | 0.000 | 0.000 |
| (0.032) | (0.038) | (0.034) | (0.037) | (0.000) | (0.000) | (0.000) | (0.003) | ||
| Wald-1 | 0.005 | 0.014 | 0.023 | 0.041 | 0.009 | 0.048 | 0.079 | 0.114 | |
| (0.013) | (0.021) | (0.027) | (0.045) | (0.019) | (0.038) | (0.052) | (0.069) | ||
| GLR | 0.023 | 0.027 | 0.025 | 0.026 | 0.031 | 0.070 | 0.072 | 0.110 | |
| (0.028) | (0.031) | (0.032) | (0.031) | (0.033) | (0.086) | (0.058) | (0.068) | ||
| GMH | 0.021 | 0.024 | 0.015 | 0.018 | 0.000 | 0.012 | 0.009 | 0.006 | |
| (0.025) | (0.028) | (0.017) | (0.017) | (0.000) | (0.019) | (0.015) | (0.013) | ||
| High ability | RMSD | 0.029 | 0.032 | 0.032 | 0.044 | 0.000 | 0.000 | 0.001 | 0.001 |
| (0.032) | (0.032) | (0.030) | (0.033) | (0.000) | (0.003) | (0.005) | (0.006) | ||
| Wald-1 | 0.004 | 0.014 | 0.025 | 0.043 | 0.013 | 0.043 | 0.072 | 0.119 | |
| (0.011) | (0.020) | (0.027) | (0.042) | (0.019) | (0.036) | (0.050) | (0.069) | ||
| GLR | 0.021 | 0.031 | 0.020 | 0.026 | 0.031 | 0.078 | 0.062 | 0.100 | |
| (0.030) | (0.040) | (0.026) | (0.026) | (0.030) | (0.089) | (0.058) | (0.057) | ||
| GMH | 0.014 | 0.018 | 0.015 | 0.019 | 0.000 | 0.009 | 0.006 | 0.005 | |
| (0.017) | (0.017) | (0.017) | (0.017) | (0.000) | (0.015) | (0.013) | (0.012) | ||
| Large sample | |||||||||
| Low ability | RMSD | 0.007 | 0.037 | 0.034 | 0.049 | 0.000 | 0.000 | 0.001 | 0.001 |
| (0.015) | (0.034) | (0.031) | (0.039) | (0.000) | (0.003) | (0.006) | (0.005) | ||
| Wald-1 | 0.006 | 0.013 | 0.028 | 0.041 | 0.011 | 0.041 | 0.076 | 0.113 | |
| (0.014) | (0.022) | (0.034) | (0.046) | (0.021) | (0.038) | (0.053) | (0.066) | ||
| GLR | 0.033 | 0.028 | 0.022 | 0.031 | 0.082 | 0.076 | 0.069 | 0.107 | |
| (0.035) | (0.036) | (0.028) | (0.037) | (0.075) | (0.087) | (0.065) | (0.072) | ||
| GMH | 0.02 | 0.016 | 0.013 | 0.018 | 0.000 | 0.008 | 0.004 | 0.005 | |
| (0.017) | (0.017) | (0.017) | (0.017) | (0.000) | (0.014) | (0.011) | (0.012) | ||
| High ability | RMSD | 0.024 | 0.047 | 0.042 | 0.053 | 0.000 | 0.000 | 0.001 | 0.001 |
| (0.028) | (0.041) | (0.035) | (0.041) | (0.000) | (0.003) | (0.006) | (0.006) | ||
| Wald-1 | 0.005 | 0.019 | 0.028 | 0.047 | 0.018 | 0.042 | 0.081 | 0.117 | |
| (0.012) | (0.027) | (0.033) | (0.049) | (0.024) | (0.032) | (0.050) | (0.068) | ||
| GLR | 0.032 | 0.039 | 0.027 | 0.028 | 0.060 | 0.081 | 0.070 | 0.106 | |
| (0.037) | (0.046) | (0.034) | (0.034) | (0.058) | (0.087) | (0.059) | (0.067) | ||
| GMH | 0.019 | 0.019 | 0.017 | 0.018 | 0.000 | 0.013 | 0.007 | 0.008 | |
| (0.017) | (0.017) | (0.017) | (0.017) | (0.000) | (0.017) | (0.014) | (0.014) | ||
-
•
Values in parentheses are standard deviations.
-
i
Using a predicted cutoff for RMSD, uniform DIF for Wald-1 and GLR, and non-adjusted for GMH.
-
ii
Using Cutoff=0.1 for RMSD, nonuniform DIF for Wald-1 and GLR, and adjusted for GMH.
| Form 1i | Form 2ii | ||||||||
| Conditions | Method | 2grps | 5grps | 10grps | 15grps | 2grps | 5grps | 10grps | 15grps |
| Small sample | |||||||||
| Low ability | RMSD | 0.031 | 0.050 | 0.041 | 0.061 | 0.000 | 0.001 | 0.001 | 0.001 |
| (0.037) | (0.042) | (0.044) | (0.047) | (0.000) | (0.006) | (0.006) | (0.006) | ||
| Wald-1 | 0.024 | 0.031 | 0.040 | 0.062 | 0.006 | 0.040 | 0.081 | 0.112 | |
| (0.031) | (0.034) | (0.040) | (0.053) | (0.014) | (0.031) | (0.047) | (0.065) | ||
| GLR | 0.018 | 0.020 | 0.021 | 0.033 | 0.022 | 0.057 | 0.067 | 0.117 | |
| (0.028) | (0.038) | (0.036) | (0.048) | (0.037) | (0.054) | (0.048) | (0.068) | ||
| GMH | 0.029 | 0.025 | 0.033 | 0.037 | 0.000 | 0.009 | 0.006 | 0.011 | |
| (0.040) | (0.041) | (0.045) | (0.050) | (0.000) | (0.024) | (0.016) | (0.026) | ||
| High ability | RMSD | 0.030 | 0.057 | 0.060 | 0.070 | 0.000 | 0.001 | 0.003 | 0.002 |
| (0.034) | (0.046) | (0.053) | (0.052) | (0.000) | (0.006) | (0.012) | (0.010) | ||
| Wald-1 | 0.031 | 0.040 | 0.045 | 0.062 | 0.011 | 0.037 | 0.076 | 0.114 | |
| (0.035) | (0.042) | (0.038) | (0.052) | (0.017) | (0.035) | (0.052) | (0.060) | ||
| GLR | 0.011 | 0.017 | 0.023 | 0.040 | 0.019 | 0.052 | 0.070 | 0.107 | |
| (0.029) | (0.032) | (0.035) | (0.049) | (0.024) | (0.053) | (0.056) | (0.066) | ||
| GMH | 0.022 | 0.028 | 0.031 | 0.043 | 0.000 | 0.010 | 0.011 | 0.009 | |
| (0.042) | (0.045) | (0.047) | (0.050) | (0.000) | (0.019) | (0.022) | (0.021) | ||
| Large sample | |||||||||
| Low ability | RMSD | 0.008 | 0.047 | 0.035 | 0.044 | 0.000 | 0.000 | 0.001 | 0.000 |
| (0.018) | (0.041) | (0.035) | (0.037) | (0.000) | (0.004) | (0.006) | (0.004) | ||
| Wald-1 | 0.022 | 0.030 | 0.054 | 0.067 | 0.016 | 0.038 | 0.085 | 0.116 | |
| (0.029) | (0.031) | (0.041) | (0.055) | (0.019) | (0.039) | (0.053) | (0.054) | ||
| GLR | 0.015 | 0.032 | 0.017 | 0.028 | 0.042 | 0.103 | 0.073 | 0.108 | |
| (0.029) | (0.048) | (0.029) | (0.045) | (0.061) | (0.097) | (0.056) | (0.062) | ||
| GMH | 0.017 | 0.033 | 0.029 | 0.030 | 0.000 | 0.008 | 0.007 | 0.006 | |
| (0.032) | (0.043) | (0.048) | (0.042) | (0.000) | (0.020) | (0.017) | (0.019) | ||
| High ability | RMSD | 0.038 | 0.052 | 0.037 | 0.044 | 0.000 | 0.000 | 0.001 | 0.001 |
| (0.041) | (0.048) | (0.037) | (0.037) | (0.000) | (0.004) | (0.007) | (0.006) | ||
| Wald-1 | 0.047 | 0.056 | 0.071 | 0.083 | 0.018 | 0.038 | 0.088 | 0.112 | |
| (0.054) | (0.047) | (0.050) | (0.053) | (0.021) | (0.036) | (0.050) | (0.056) | ||
| GLR | 0.023 | 0.034 | 0.023 | 0.050 | 0.029 | 0.081 | 0.067 | 0.098 | |
| (0.081) | (0.049) | (0.032) | (0.060) | (0.033) | (0.080) | (0.037) | (0.063) | ||
| GMH | 0.034 | 0.050 | 0.045 | 0.064 | 0.000 | 0.014 | 0.016 | 0.017 | |
| (0.062) | (0.071) | (0.066) | (0.071) | (0.000) | (0.025) | (0.031) | (0.034) | ||
-
•
Values in parentheses are standard deviations.
-
i
Using a predicted cutoff for RMSD, uniform DIF for Wald-1 and GLR, and non-adjusted for GMH.
-
ii
Using Cutoff=0.1 for RMSD, nonuniform DIF for Wald-1 and GLR, and adjusted for GMH.
| Form 1i | Form 2ii | ||||||||
| Conditions | Method | 2grps | 5grps | 10grps | 15grps | 2grps | 5grps | 10grps | 15grps |
| Small sample | |||||||||
| Low ability | RMSD | 0.240 | 0.368 | 0.330 | 0.373 | 0.000 | 0.038 | 0.072 | 0.100 |
| (0.168) | (0.163) | (0.177) | (0.176) | (0.000) | (0.070) | (0.093) | (0.109) | ||
| Wald-1 | 0.027 | 0.037 | 0.052 | 0.060 | |||||
| (0.061) | (0.073) | (0.088) | (0.090) | ||||||
| GLR | 0.187 | 0.140 | 0.117 | 0.122 | |||||
| (0.148) | (0.144) | (0.133) | (0.144) | ||||||
| GMH | 0.242 | 0.185 | 0.148 | 0.135 | 0.000 | 0.127 | 0.073 | 0.070 | |
| (0.175) | (0.179) | (0.176) | (0.151) | (0.000) | (0.123) | (0.112) | (0.114) | ||
| High ability | RMSD | 0.343 | 0.630 | 0.597 | 0.660 | 0.002 | 0.190 | 0.247 | 0.280 |
| (0.195) | (0.202) | (0.190) | (0.174) | (0.017) | (0.128) | (0.147) | (0.160) | ||
| Wald-1 | 0.053 | 0.078 | 0.068 | 0.070 | |||||
| (0.097) | (0.115) | (0.111) | (0.106) | ||||||
| GLR | 0.248 | 0.243 | 0.207 | 0.152 | |||||
| (0.141) | (0.170) | (0.161) | (0.157) | ||||||
| GMH | 0.298 | 0.312 | 0.257 | 0.195 | 0.000 | 0.252 | 0.163 | 0.103 | |
| (0.197) | (0.236) | (0.224) | (0.188) | (0.000) | (0.173) | (0.150) | (0.116) | ||
| Large sample | |||||||||
| Low ability | RMSD | 0.068 | 0.098 | 0.108 | 0.150 | 0.000 | 0.000 | 0.010 | 0.007 |
| (0.092) | (0.116) | (0.131) | (0.139) | (0.000) | (0.000) | (0.040) | (0.033) | ||
| Wald-1 | 0.03 | 0.047 | 0.052 | 0.073 | |||||
| (0.069) | (0.089) | (0.097) | (0.109) | ||||||
| GLR | 0.162 | 0.177 | 0.157 | 0.168 | |||||
| (0.145) | (0.129) | (0.148) | (0.143) | ||||||
| GMH | 0.208 | 0.208 | 0.185 | 0.197 | 0.000 | 0.157 | 0.132 | 0.117 | |
| (0.183) | (0.178) | (0.177) | (0.176) | (0.000) | (0.123) | (0.126) | (0.129) | ||
| High ability | RMSD | 0.462 | 0.393 | 0.485 | 0.610 | 0.022 | 0.018 | 0.070 | 0.177 |
| (0.195) | (0.186) | (0.177) | (0.168) | (0.061) | (0.052) | (0.095) | (0.151) | ||
| Wald-1 | 0.078 | 0.087 | 0.085 | 0.092 | |||||
| (0.143) | (0.137) | (0.122) | (0.115) | ||||||
| GLR | 0.312 | 0.362 | 0.312 | 0.285 | |||||
| (0.218) | (0.193) | (0.183) | (0.178) | ||||||
| GMH | 0.368 | 0.435 | 0.395 | 0.373 | 0.000 | 0.342 | 0.323 | 0.288 | |
| (0.261) | (0.269) | (0.283) | (0.272) | (0.000) | (0.215) | (0.192) | (0.189) | ||
-
•
Values in parentheses are standard deviations.
-
i
Using a predicted cutoff for RMSD, uniform DIF for Wald-1 and GLR, and non-adjusted for GMH.
-
ii
Using Cutoff=0.1 for RMSD, nonuniform DIF for Wald-1 and GLR, and adjusted for GMH.
5 Discussion
Our study contributed to the advancement of the current knowledge base. Firstly, our results showed that the RMSD approach used in LSAs should use a model-predicted cutoff instead of a fixed cutoff like 0.1. We found that using a fixed cutoff made RMSD overly conservative, confirming the finding in [121] that no fixed cutoff could universally fit the RMSD approach. Secondly, we filled the literature gap about GMH’s performance hwne using the -value adjustment. GMH was found to exhibit an acceptable Type-I error rate without a -value adjustment. Finally, this study provided the first simulation-based evaluation of GLR’s performance and compared it with other multi-group methods.
Our simulation design aligned with [109] in that we consistently set the focal groups to have higher parameter estimates. However, unlike their study, we set only one focal group to be DIF-contaminated to ensure simplicity and interpretability. The low power of GMH found in this study confirmed the low-power situation in [109] for GMH with a group sample size smaller than 500 when the parameter is DIF-contaminated. While we revealed that all the four tested methods exhibited low power to detect DIF in the parameter, this pattern aligned with what was found in [98] when assessing powers for nonuniform DIF detection. Our reported low power of Wald-1 partly contradicted the high power (over 90%) reported for Wald-1 in [126]. However, their simulation design differed from ours, as they set all the focal groups to be DIF-contaminated and introduced DIF in opposite directions for the and parameters in the focal groups.
This study shed light on future research directions for multi-group DIF methods. First, exploring how the sample size and the number of DIF groups interact in DIF studies would be valuable. [109] found GMH power increased significantly with a sample size of 500 or more per group. Past studies have manipulated the number of DIF-contaminated focal groups (e.g., 2-10 or more) when holding the sample size constant for each group (e.g., 500, 1000, 1500 per group or in cherry-picked combinations). In contrast, our study adopted a more ecologically valid approach by utilizing the real-world sample sizes of education systems participating in the TIMSS 2019 as the sample sizes for each group. These real-world sample sizes varied considerably across groups, ranging from 326 to 1480. While this approach aligned the analysis with the complexities of actual testing situations, it presented a challenge for future research, as the power of DIF detection methods might be impacted by uneven sample sizes across groups. Future studies could explore methods that are more robust to such variations in sample size.
Second, future studies could systematically vary the direction of DIF in the focal group relative to the reference group (e.g., opposite vs. same direction for and parameters). [126] set opposite directions for DIF in the and parameters, whereas [109] used the same direction. Further exploration is needed in this regard to check the associated impact on DIF results. Third, how the magnitude of DIF would vary given the difference in the and parameters would be worth investigating. The same amount of shift in parameter estimates may vary in impact given the parameter (e.g., 0.4 might be large for but not ). Importantly, further research would be needed to develop methods more robust to DIF in the parameter, as prior research on DIF detection mostly focused on methods’ performance in identifying DIF in the parameter about item difficulty.
In addition, research is needed in fundamental methodological aspects of multi-group DIF analysis. First, the effect size of DIF in multi-group DIF analysis has not been extensively studied. Currently, no method provides estimates of the effect size in multi-group DIF analysis [109]. Second, the recovery of asymptotic covariance matrices remains a challenge for IRT-based DIF methods. This issue has been a long-standing problem when estimating IRT models with the EM algorithm [70].
Third, more evidence is needed to investigate possible benefits of the -value adjustment for Wald-1. Our findings showed that the Type-I error rate of Wald-1 increased as the number of groups increased, warranting further investigation of solutions such as the -value adjustment in this regard.
6 Conclusion
We compared four frequentist, unidimensional methods in terms of their Type-I error and power via Monte Carlo simulation of controlled assessment settings. Our findings provided valuable insights into the strengths and limitations of the different DIF detection methods under various conditions. These insights are crucial for selecting appropriate methods based on the specific requirements and conditions of DIF analysis. Our primary finding is that RMSD with model-predicted cutoffs (i.e., 0.060, 0.070, 0.075, and 0.075 for 2-, 5-, 10-, and 15-group analyses, respectively) yielded the best Type-I error rates. While power rates were low across the methods, RMSD with model-predicted cutoffs exhibited a relatively acceptable power when analyzing five or more groups with a DIF-contaminated group featuring a small sample size and a high ability, or 15 groups with a DIF-contaminated group featuring a large sample size and a high ability. The fixed cutoff of 0.01 used in TIMSS is not suitable for RMSD, as it results in overly low Type-I error rates and powers. Caution should be exercised when using any of the tested methods here when expecting DIF to occur in the parameter of an item, as these methods are not sensitive enough to DIF associated with this parameter.
References
- [1] American Educational Research Association, American Psychological Association and National Council on Measurement in Education “Standards for Educational and Psychological Testing”, 2014
- [2] Tamás Antal and Andreas Oranje “Adaptive Numerical Integration for Item Response Theory”, 2007, pp. i–11 URL: https://onlinelibrary.wiley.com/doi/10.1002/j.2333-8504.2007.tb02048.x
- [3] Tihomir Asparouhov and Bengt Muthén “Multiple-Group Factor Analysis Alignment” In Structural Equation Modeling: A Multidisciplinary Journal 21.4 Routledge, 2014, pp. 495–508 DOI: 10.1080/10705511.2014.919210
- [4] A Birnbaum “Some Latent Trait Models and Their Use in Inferring an Examinee’s Ability” In Statistical Theories of Mental Test Scores Reading, MA: Addison-Wesley, 1968, pp. 397–479
- [5] Janine Buchholz and Johannes Hartig “Comparing Attitudes across Groups: An IRT-based Item-Fit Statistic for the Analysis of Measurement Invariance” In Applied Psychological Measurement 43.3 SAGE Publications Inc, 2019, pp. 241–250 DOI: 10.1177/0146621617748323
- [6] L Cai “SEM of Another Flavour: Two New Applications of the Supplemented EM Algorithm” In British Journal of Mathematical and Statistical Psychology 61.2, 2008, pp. 309–329 DOI: 10.1348/000711007X249603
- [7] L Cai, D Thissen and S Toit “IRTPRO: Flexible, Multidimensional, Multiple Categorical IRT Modeling”, 2011 Scientific Software International
- [8] P Chalmers et al. “Multidimensional Item Response Theory”, 2021 URL: https://cran.r-project.org/web/packages/mirt/mirt.pdf
- [9] Dandan Chen “Performance of Multi-Group DIF Methods in Assessing Cross-Country Score Comparability of International Large-Scale Assessments”, 2020 DOI: 10.48550/arXiv.2007.15814
- [10] Dandan Chen “Modeling Item Bias in Fixed-Item Tests and Computerized Adaptive Tests”, 2023 URL: https://www.ideals.illinois.edu/items/127410
- [11] Dandan Chen and Carolyn J. Anderson “Categorical Data Analysis” In International Encyclopedia of Education (Fourth Edition) Oxford: Elsevier, 2023, pp. 575–582 DOI: 10.1016/B978-0-12-818630-5.10070-3
- [12] Seokjoon Chun, Stephen Stark, Eun Sook Kim and Oleksandr S. Chernyshenko “MIMIC Methods for Detecting DIF among Multiple Groups: Exploring a New Sequential-Free Baseline Procedure” In Applied Psychological Measurement 40.7 SAGE Publications Inc, 2016, pp. 486–499 DOI: 10.1177/0146621616659738
- [13] Claremont Graduate University “Power calculations for one-sample Z test” URL: https://wise1.cgu.edu/power/computing.asp
- [14] Clifford C. Clogg and Leo A. Goodman “Simultaneous Latent Structure Analysis in Several Groups” In Sociological Methodology 15 [American Sociological Association, Wiley, Sage Publications, Inc.], 1985, pp. 81–110 DOI: 10.2307/270847
- [15] Tim Davey, M Nering and T Thompson “Realistic Simulation of Item Response Data”, ACT Research Report Series 97-4, 1997
- [16] Katharina Fährmann, Carmen Köhler, Johannes Hartig and Jörg-Henrik Heine “Practical Significance of Item Misfit and Its Manifestations in Constructs Assessed in Large-Scale Studies” In Large-scale Assessments in Education 10.1, 2022, pp. 7 DOI: 10.1186/s40536-022-00124-w
- [17] H Finch “Detection of Differential Item Functioning for More than Two Groups: A Monte Carlo Comparison of Methods” In Applied Measurement in Education 29.1, 2016, pp. 30–45 DOI: 10.1080/08957347.2015.1102916
- [18] B Fishbein, P Foy and L Yin “TIMSS 2019 User Guide for the International Database” Chestnut Hill, MA: TIMSS & PIRLS International Study Center, 2021
- [19] R.. Fisher and Edward John Russell “On the Mathematical Foundations of Theoretical Statistics” In Philosophical Transactions of the Royal Society of London (Series A) 222.594-604 Royal Society, 1922, pp. 309–368 DOI: 10.1098/rsta.1922.0009
- [20] Ronald K. Hambleton and Hariharan Swaminathan “Item Response Theory: Principles and Applications” Boston : Hingham, MA, U.S.A: Kluwer-Nijhoff Pub. ; Distributors for North America, Kluwer Boston, 1985
- [21] P Holland and Dorothy T. Thayer “An Alternate Definition of the ETS Delta Scale of Item Difficulty”, ETS Research Report Series 85-43, 1985, pp. i–10 URL: https://onlinelibrary.wiley.com/doi/10.1002/j.2330-8516.1985.tb00128.x
- [22] P Holland and Dorothy T. Thayer “Differential Item Performance and the Mantel-Haenszel Procedure”, 1986 URL: https://eric.ed.gov/?id=ED272577
- [23] Sture Holm “A Simple Sequentially Rejective Multiple Test Procedure” In Scandinavian Journal of Statistics 6.2, 1979, pp. 65–70 JSTOR: http://www.jstor.org/stable/4615733
- [24] C Houts and L Cai “FlexMIRT® User’s Manual Version 3.52: Flexible Multilevel Multidimensional Item Analysis and Test Scoring”, 2020
- [25] Seang-Hwane Joo et al. “Evaluating Item Fit Statistic Thresholds in PISA: Analysis of Cross-Country Comparability of Cognitive Items” In Educational Measurement: Issues and Practice 40.2, 2021, pp. 37–48 DOI: 10.1111/emip.12404
- [26] K Jöreskog “A General Approach to Confirmatory Maximum Likelihood Factor Analysis” In Psychometrika 34.2, 1969, pp. 183–202 DOI: 10.1007/BF02289343
- [27] K Jöreskog and Arthur S. Goldberger “Estimation of a Model with Multiple Indicators and Multiple Causes of a Single Latent Variable” In Journal of the American Statistical Association 70.351 [American Statistical Association, Taylor & Francis, Ltd.], 1975, pp. 631–639 DOI: 10.2307/2285946
- [28] Seock-Ho Kim, Allan S. Cohen and Tae-Hak Park “Detection of Differential Item Functioning in Multiple Groups” In Journal of Educational Measurement 32.3 [National Council on Measurement in Education, Wiley], 1995, pp. 261–276 JSTOR: http://www.jstor.org/stable/1435297
- [29] Carmen Köhler, Alexander Robitzsch and Johannes Hartig “A Bias-Corrected RMSD Item Fit Statistic: An Evaluation and Comparison to Alternatives” In Journal of Educational and Behavioral Statistics 45.3 American Educational Research Association, 2020, pp. 251–273 DOI: 10.3102/1076998619890566
- [30] Carmen Köhler et al. “A Semiparametric Approach for Item Response Function Estimation to Detect Item Misfit” In British Journal of Mathematical and Statistical Psychology 74.S1, 2021, pp. 157–175 DOI: 10.1111/bmsp.12224
- [31] Carmen Köhler, Lale Khorramdel, Artur Pokropek and Johannes Hartig “DIF Detection for Multiple Groups: Comparing Three-Level GLMMs and Multiple-Group IRT Models” In Journal of Educational Measurement 61.2, 2024, pp. 325–344 DOI: 10.1111/jedm.12384
- [32] Julia Kopf, Achim Zeileis and Carolin Strobl “Anchor Selection Strategies for DIF Analysis” In Educational and Psychological Measurement 75.1, 2015, pp. 22–56 DOI: 10.1177/0013164414529792
- [33] Michelle M Langer “A Reexamination of Lord’s Wald Test for Differential Item Functioning Using Item Response Theory and Modern Error Estimation”, 2008 URL: https://cdr.lib.unc.edu/concern/dissertations/fb4948756
- [34] Hwanggyu Lim, Edison M. Choe and Kyung T. Han “A residual-based differential item functioning detection framework in item response theory” In Journal of Educational Measurement 59.1, 2022, pp. 80–104 DOI: 10.1111/jedm.12313
- [35] Richard G. Lomax and Debbie L. Hahs-Vaughn “An Introduction to Statistical Concepts” New York, NY: Routledge, 2012
- [36] F Lord “Applications of Item Response Theory to Practical Testing Problems” Hillsdale, NJ: Lawrence Erlbaum Associates, Inc, 1980
- [37] David Magis, Sébastien Béland and Gilles Raîche “A Test-Length Correction to the Estimation of Extreme Proficiency Levels” In Applied Psychological Measurement 35.2 SAGE Publications Inc, 2011, pp. 91–109 DOI: 10.1177/0146621610378289
- [38] David Magis, Gilles Raîche, Sébastien Béland and Paul Gérard “A Generalized Logistic Regression Procedure to Detect Differential Item Functioning among Multiple Groups” In International Journal of Testing 11.4, 2011, pp. 365–386 DOI: 10.1080/15305058.2011.602810
- [39] “Methods and Procedures in PIRLS 2016” Chestnut Hill, MA: TIMSS & PIRLS International Study Center, 2017
- [40] “Methods and Procedures: TIMSS 2019 Technical Report”, Progress in International Reading Literacy Study PIRLS Chestnut Hill, MA: TIMSS & PIRLS International Study Center, 2020
- [41] Sandip Mazumder “Numerical Methods for Partial Differential Equations: Finite Difference and Finite Volume Methods” San Diego, CA: Academic Press, 2016
- [42] OECD “PISA 2015 Technical Report”, 2017 URL: https://www.oecd.org/pisa/data/2015-technical-report/PISA2015_TechRep_Final.pdf
- [43] OECD “PISA 2018 Assessment and Analytical Framework”, 2019
- [44] OECD “Technical Report of the Survey of Adult Skills (PIAAC) (3rd Ed.)”, 2019
- [45] Randall D. Penfield “Assessing Differential Item Functioning among Multiple Groups: A Comparison of Three Mantel-Haenszel Procedures” In Applied Measurement in Education 14.3 Routledge, 2001, pp. 235–259 DOI: 10.1207/S15324818AME1403_3
- [46] José C. Pinheiro and Douglas M. Bates “Approximations to the Log-Likelihood Function in the Nonlinear Mixed-Effects Model” In Journal of Computational and Graphical Statistics 4.1 [American Statistical Association, Taylor & Francis, Ltd., Institute of Mathematical Statistics, Interface Foundation of America], 1995, pp. 12–35 DOI: 10.2307/1390625
- [47] R Core Team “R: A Language and Environment for Statistical Computing”, 2021 R Foundation for Statistical Computing URL: https://www.R-project.org/
- [48] M Richardson “The Relation between the Difficulty and the Differential Validity of a Test” In Psychometrika 1 Germany: Springer, 1936, pp. 33–49 DOI: 10.1007/BF02288003
- [49] Lawrence M Rudner “An Approach to Biased Item Identification Using Latent Trait Measurement Theory”, 1977 URL: https://files.eric.ed.gov/fulltext/ED137337.pdf
- [50] Leslie Rutkowski and Dubravka Svetina “Assessing the Hypothesis of Measurement Invariance in the Context of Large-Scale International Surveys” In Educational and Psychological Measurement 74.1 SAGE Publications Inc, 2014, pp. 31–57 DOI: 10.1177/0013164413498257
- [51] John Alexander Silva Diaz, Carmen Köhler and Johannes Hartig “Performance of Infit and Outfit Confidence Intervals Calculated via Parametric Bootstrapping” In Applied Measurement in Education 35.2 Routledge, 2022, pp. 116–132 DOI: 10.1080/08957347.2022.2067540
- [52] R.. Simes “An Improved Bonferroni Procedure for Multiple Tests of Significance” In Biometrika 73.3, 1986, pp. 751–754 DOI: 10.1093/biomet/73.3.751
- [53] Grant W. Somes “The Generalized Mantel-Haenszel Statistic” In The American Statistician 40.2 [American Statistical Association, Taylor & Francis, Ltd.], 1986, pp. 106–108 DOI: 10.2307/2684866
- [54] Stephen Stark, Oleksandr S. Chernyshenko and Fritz Drasgow “Detecting Differential Item Functioning with Confirmatory Factor Analysis and Item Response Theory: Toward a Unified Strategy” In The Journal of Applied Psychology 91.6, 2006, pp. 1292–1306 DOI: 10.1037/0021-9010.91.6.1292
- [55] Hariharan Swaminathan and H. Rogers “Detecting Differential Item Functioning Using Logistic Regression Procedures” In Journal of Educational Measurement 27.4, 1990, pp. 361–370 DOI: 10.1111/j.1745-3984.1990.tb00754.x
- [56] Louis Tay, Daniel A. Newman and Jeroen K. Vermunt “Using Mixed-Measurement Item Response Theory with Covariates (MM-IRT-C) to Ascertain Observed and Unobserved Measurement Equivalence” In Organizational Research Methods 14.1 SAGE Publications Inc, 2011, pp. 147–176 DOI: 10.1177/1094428110366037
- [57] Jesper Tijmstra et al. “Sensitivity of the RMSD for Detecting Item-Level Misfit in Low-Performing Countries” In Journal of Educational Measurement 57.4, 2020, pp. 566–583 DOI: 10.1111/jedm.12263
- [58] Fons J.. Vijver et al. “Invariance Analyses in Large-Scale Studies”, 2019 DOI: 10.1787/254738dd-en
- [59] M Davier et al. “Evaluating Item Response Theory Linking and Model Fit for Data from PISA 2000–2012” In Assessment in Education: Principles, Policy & Practice 26.4 Routledge, 2019, pp. 466–488 DOI: 10.1080/0969594X.2019.1586642
- [60] W Wang “Effects of Anchor Item Methods on the Detection of Differential Item Functioning within the Family of Rasch Models” In The Journal of Experimental Education 72.3 Taylor & Francis, Ltd., 2004, pp. 221–261 JSTOR: https://www.jstor.org/stable/20157369
- [61] W Wang and Ya-Li Yeh “Effects of Anchor Item Methods on Differential Item Functioning Detection with the Likelihood Ratio Test” In Applied Psychological Measurement 27.6 SAGE Publications Inc, 2003, pp. 479–498 DOI: 10.1177/0146621603259902
- [62] Carol M. Woods, Li Cai and Mian Wang “The Langer-improved Wald Test for DIF Testing with Multiple Groups: Evaluation and Comparison to Two-Group IRT” In Educational and Psychological Measurement 73.3, 2013, pp. 532–547 DOI: 10.1177/0013164412464875
- [63] J Zhang, S Isham and L Worthington “Chapter 16. Data Analysis of the National Reading Assessment” In The NAEP 1998 Technical Report, NCES 2001-509 Washington, DC: National Center for Education Statistics, 2001, pp. 283–305
- [64] R Zwick “A Review of ETS Differential Item Functioning Assessment Procedures: Flagging Rules, Minimum Sample Size Requirements, and Criterion Refinement”, Research Report ETS RR-12-08, 2012
References
- [65] American Educational Research Association, American Psychological Association and National Council on Measurement in Education “Standards for Educational and Psychological Testing”, 2014
- [66] Tamás Antal and Andreas Oranje “Adaptive Numerical Integration for Item Response Theory”, 2007, pp. i–11 URL: https://onlinelibrary.wiley.com/doi/10.1002/j.2333-8504.2007.tb02048.x
- [67] Tihomir Asparouhov and Bengt Muthén “Multiple-Group Factor Analysis Alignment” In Structural Equation Modeling: A Multidisciplinary Journal 21.4 Routledge, 2014, pp. 495–508 DOI: 10.1080/10705511.2014.919210
- [68] A Birnbaum “Some Latent Trait Models and Their Use in Inferring an Examinee’s Ability” In Statistical Theories of Mental Test Scores Reading, MA: Addison-Wesley, 1968, pp. 397–479
- [69] Janine Buchholz and Johannes Hartig “Comparing Attitudes across Groups: An IRT-based Item-Fit Statistic for the Analysis of Measurement Invariance” In Applied Psychological Measurement 43.3 SAGE Publications Inc, 2019, pp. 241–250 DOI: 10.1177/0146621617748323
- [70] L Cai “SEM of Another Flavour: Two New Applications of the Supplemented EM Algorithm” In British Journal of Mathematical and Statistical Psychology 61.2, 2008, pp. 309–329 DOI: 10.1348/000711007X249603
- [71] L Cai, D Thissen and S Toit “IRTPRO: Flexible, Multidimensional, Multiple Categorical IRT Modeling”, 2011 Scientific Software International
- [72] P Chalmers et al. “Multidimensional Item Response Theory”, 2021 URL: https://cran.r-project.org/web/packages/mirt/mirt.pdf
- [73] Dandan Chen “Performance of Multi-Group DIF Methods in Assessing Cross-Country Score Comparability of International Large-Scale Assessments”, 2020 DOI: 10.48550/arXiv.2007.15814
- [74] Dandan Chen “Modeling Item Bias in Fixed-Item Tests and Computerized Adaptive Tests”, 2023 URL: https://www.ideals.illinois.edu/items/127410
- [75] Dandan Chen and Carolyn J. Anderson “Categorical Data Analysis” In International Encyclopedia of Education (Fourth Edition) Oxford: Elsevier, 2023, pp. 575–582 DOI: 10.1016/B978-0-12-818630-5.10070-3
- [76] Seokjoon Chun, Stephen Stark, Eun Sook Kim and Oleksandr S. Chernyshenko “MIMIC Methods for Detecting DIF among Multiple Groups: Exploring a New Sequential-Free Baseline Procedure” In Applied Psychological Measurement 40.7 SAGE Publications Inc, 2016, pp. 486–499 DOI: 10.1177/0146621616659738
- [77] Claremont Graduate University “Power calculations for one-sample Z test” URL: https://wise1.cgu.edu/power/computing.asp
- [78] Clifford C. Clogg and Leo A. Goodman “Simultaneous Latent Structure Analysis in Several Groups” In Sociological Methodology 15 [American Sociological Association, Wiley, Sage Publications, Inc.], 1985, pp. 81–110 DOI: 10.2307/270847
- [79] Tim Davey, M Nering and T Thompson “Realistic Simulation of Item Response Data”, ACT Research Report Series 97-4, 1997
- [80] Katharina Fährmann, Carmen Köhler, Johannes Hartig and Jörg-Henrik Heine “Practical Significance of Item Misfit and Its Manifestations in Constructs Assessed in Large-Scale Studies” In Large-scale Assessments in Education 10.1, 2022, pp. 7 DOI: 10.1186/s40536-022-00124-w
- [81] H Finch “Detection of Differential Item Functioning for More than Two Groups: A Monte Carlo Comparison of Methods” In Applied Measurement in Education 29.1, 2016, pp. 30–45 DOI: 10.1080/08957347.2015.1102916
- [82] B Fishbein, P Foy and L Yin “TIMSS 2019 User Guide for the International Database” Chestnut Hill, MA: TIMSS & PIRLS International Study Center, 2021
- [83] R.. Fisher and Edward John Russell “On the Mathematical Foundations of Theoretical Statistics” In Philosophical Transactions of the Royal Society of London (Series A) 222.594-604 Royal Society, 1922, pp. 309–368 DOI: 10.1098/rsta.1922.0009
- [84] Ronald K. Hambleton and Hariharan Swaminathan “Item Response Theory: Principles and Applications” Boston : Hingham, MA, U.S.A: Kluwer-Nijhoff Pub. ; Distributors for North America, Kluwer Boston, 1985
- [85] P Holland and Dorothy T. Thayer “An Alternate Definition of the ETS Delta Scale of Item Difficulty”, ETS Research Report Series 85-43, 1985, pp. i–10 URL: https://onlinelibrary.wiley.com/doi/10.1002/j.2330-8516.1985.tb00128.x
- [86] P Holland and Dorothy T. Thayer “Differential Item Performance and the Mantel-Haenszel Procedure”, 1986 URL: https://eric.ed.gov/?id=ED272577
- [87] Sture Holm “A Simple Sequentially Rejective Multiple Test Procedure” In Scandinavian Journal of Statistics 6.2, 1979, pp. 65–70 JSTOR: http://www.jstor.org/stable/4615733
- [88] C Houts and L Cai “FlexMIRT® User’s Manual Version 3.52: Flexible Multilevel Multidimensional Item Analysis and Test Scoring”, 2020
- [89] Seang-Hwane Joo et al. “Evaluating Item Fit Statistic Thresholds in PISA: Analysis of Cross-Country Comparability of Cognitive Items” In Educational Measurement: Issues and Practice 40.2, 2021, pp. 37–48 DOI: 10.1111/emip.12404
- [90] K Jöreskog “A General Approach to Confirmatory Maximum Likelihood Factor Analysis” In Psychometrika 34.2, 1969, pp. 183–202 DOI: 10.1007/BF02289343
- [91] K Jöreskog and Arthur S. Goldberger “Estimation of a Model with Multiple Indicators and Multiple Causes of a Single Latent Variable” In Journal of the American Statistical Association 70.351 [American Statistical Association, Taylor & Francis, Ltd.], 1975, pp. 631–639 DOI: 10.2307/2285946
- [92] Seock-Ho Kim, Allan S. Cohen and Tae-Hak Park “Detection of Differential Item Functioning in Multiple Groups” In Journal of Educational Measurement 32.3 [National Council on Measurement in Education, Wiley], 1995, pp. 261–276 JSTOR: http://www.jstor.org/stable/1435297
- [93] Carmen Köhler, Lale Khorramdel, Artur Pokropek and Johannes Hartig “DIF Detection for Multiple Groups: Comparing Three-Level GLMMs and Multiple-Group IRT Models” In Journal of Educational Measurement 61.2, 2024, pp. 325–344 DOI: 10.1111/jedm.12384
- [94] Carmen Köhler et al. “A Semiparametric Approach for Item Response Function Estimation to Detect Item Misfit” In British Journal of Mathematical and Statistical Psychology 74.S1, 2021, pp. 157–175 DOI: 10.1111/bmsp.12224
- [95] Carmen Köhler, Alexander Robitzsch and Johannes Hartig “A Bias-Corrected RMSD Item Fit Statistic: An Evaluation and Comparison to Alternatives” In Journal of Educational and Behavioral Statistics 45.3 American Educational Research Association, 2020, pp. 251–273 DOI: 10.3102/1076998619890566
- [96] Julia Kopf, Achim Zeileis and Carolin Strobl “Anchor Selection Strategies for DIF Analysis” In Educational and Psychological Measurement 75.1, 2015, pp. 22–56 DOI: 10.1177/0013164414529792
- [97] Michelle M Langer “A Reexamination of Lord’s Wald Test for Differential Item Functioning Using Item Response Theory and Modern Error Estimation”, 2008 URL: https://cdr.lib.unc.edu/concern/dissertations/fb4948756
- [98] Hwanggyu Lim, Edison M. Choe and Kyung T. Han “A residual-based differential item functioning detection framework in item response theory” In Journal of Educational Measurement 59.1, 2022, pp. 80–104 DOI: 10.1111/jedm.12313
- [99] Richard G. Lomax and Debbie L. Hahs-Vaughn “An Introduction to Statistical Concepts” New York, NY: Routledge, 2012
- [100] F Lord “Applications of Item Response Theory to Practical Testing Problems” Hillsdale, NJ: Lawrence Erlbaum Associates, Inc, 1980
- [101] David Magis, Sébastien Béland and Gilles Raîche “A Test-Length Correction to the Estimation of Extreme Proficiency Levels” In Applied Psychological Measurement 35.2 SAGE Publications Inc, 2011, pp. 91–109 DOI: 10.1177/0146621610378289
- [102] David Magis, Gilles Raîche, Sébastien Béland and Paul Gérard “A Generalized Logistic Regression Procedure to Detect Differential Item Functioning among Multiple Groups” In International Journal of Testing 11.4, 2011, pp. 365–386 DOI: 10.1080/15305058.2011.602810
- [103] “Methods and Procedures in PIRLS 2016” Chestnut Hill, MA: TIMSS & PIRLS International Study Center, 2017
- [104] “Methods and Procedures: TIMSS 2019 Technical Report”, Progress in International Reading Literacy Study PIRLS Chestnut Hill, MA: TIMSS & PIRLS International Study Center, 2020
- [105] Sandip Mazumder “Numerical Methods for Partial Differential Equations: Finite Difference and Finite Volume Methods” San Diego, CA: Academic Press, 2016
- [106] OECD “PISA 2015 Technical Report”, 2017 URL: https://www.oecd.org/pisa/data/2015-technical-report/PISA2015_TechRep_Final.pdf
- [107] OECD “PISA 2018 Assessment and Analytical Framework”, 2019
- [108] OECD “Technical Report of the Survey of Adult Skills (PIAAC) (3rd Ed.)”, 2019
- [109] Randall D. Penfield “Assessing Differential Item Functioning among Multiple Groups: A Comparison of Three Mantel-Haenszel Procedures” In Applied Measurement in Education 14.3 Routledge, 2001, pp. 235–259 DOI: 10.1207/S15324818AME1403_3
- [110] José C. Pinheiro and Douglas M. Bates “Approximations to the Log-Likelihood Function in the Nonlinear Mixed-Effects Model” In Journal of Computational and Graphical Statistics 4.1 [American Statistical Association, Taylor & Francis, Ltd., Institute of Mathematical Statistics, Interface Foundation of America], 1995, pp. 12–35 DOI: 10.2307/1390625
- [111] R Core Team “R: A Language and Environment for Statistical Computing”, 2021 R Foundation for Statistical Computing URL: https://www.R-project.org/
- [112] M Richardson “The Relation between the Difficulty and the Differential Validity of a Test” In Psychometrika 1 Germany: Springer, 1936, pp. 33–49 DOI: 10.1007/BF02288003
- [113] Lawrence M Rudner “An Approach to Biased Item Identification Using Latent Trait Measurement Theory”, 1977 URL: https://files.eric.ed.gov/fulltext/ED137337.pdf
- [114] Leslie Rutkowski and Dubravka Svetina “Assessing the Hypothesis of Measurement Invariance in the Context of Large-Scale International Surveys” In Educational and Psychological Measurement 74.1 SAGE Publications Inc, 2014, pp. 31–57 DOI: 10.1177/0013164413498257
- [115] John Alexander Silva Diaz, Carmen Köhler and Johannes Hartig “Performance of Infit and Outfit Confidence Intervals Calculated via Parametric Bootstrapping” In Applied Measurement in Education 35.2 Routledge, 2022, pp. 116–132 DOI: 10.1080/08957347.2022.2067540
- [116] R.. Simes “An Improved Bonferroni Procedure for Multiple Tests of Significance” In Biometrika 73.3, 1986, pp. 751–754 DOI: 10.1093/biomet/73.3.751
- [117] Grant W. Somes “The Generalized Mantel-Haenszel Statistic” In The American Statistician 40.2 [American Statistical Association, Taylor & Francis, Ltd.], 1986, pp. 106–108 DOI: 10.2307/2684866
- [118] Stephen Stark, Oleksandr S. Chernyshenko and Fritz Drasgow “Detecting Differential Item Functioning with Confirmatory Factor Analysis and Item Response Theory: Toward a Unified Strategy” In The Journal of Applied Psychology 91.6, 2006, pp. 1292–1306 DOI: 10.1037/0021-9010.91.6.1292
- [119] Hariharan Swaminathan and H. Rogers “Detecting Differential Item Functioning Using Logistic Regression Procedures” In Journal of Educational Measurement 27.4, 1990, pp. 361–370 DOI: 10.1111/j.1745-3984.1990.tb00754.x
- [120] Louis Tay, Daniel A. Newman and Jeroen K. Vermunt “Using Mixed-Measurement Item Response Theory with Covariates (MM-IRT-C) to Ascertain Observed and Unobserved Measurement Equivalence” In Organizational Research Methods 14.1 SAGE Publications Inc, 2011, pp. 147–176 DOI: 10.1177/1094428110366037
- [121] Jesper Tijmstra et al. “Sensitivity of the RMSD for Detecting Item-Level Misfit in Low-Performing Countries” In Journal of Educational Measurement 57.4, 2020, pp. 566–583 DOI: 10.1111/jedm.12263
- [122] Fons J.. Vijver et al. “Invariance Analyses in Large-Scale Studies”, 2019 DOI: 10.1787/254738dd-en
- [123] M Davier et al. “Evaluating Item Response Theory Linking and Model Fit for Data from PISA 2000–2012” In Assessment in Education: Principles, Policy & Practice 26.4 Routledge, 2019, pp. 466–488 DOI: 10.1080/0969594X.2019.1586642
- [124] W Wang “Effects of Anchor Item Methods on the Detection of Differential Item Functioning within the Family of Rasch Models” In The Journal of Experimental Education 72.3 Taylor & Francis, Ltd., 2004, pp. 221–261 JSTOR: https://www.jstor.org/stable/20157369
- [125] W Wang and Ya-Li Yeh “Effects of Anchor Item Methods on Differential Item Functioning Detection with the Likelihood Ratio Test” In Applied Psychological Measurement 27.6 SAGE Publications Inc, 2003, pp. 479–498 DOI: 10.1177/0146621603259902
- [126] Carol M. Woods, Li Cai and Mian Wang “The Langer-improved Wald Test for DIF Testing with Multiple Groups: Evaluation and Comparison to Two-Group IRT” In Educational and Psychological Measurement 73.3, 2013, pp. 532–547 DOI: 10.1177/0013164412464875
- [127] J Zhang, S Isham and L Worthington “Chapter 16. Data Analysis of the National Reading Assessment” In The NAEP 1998 Technical Report, NCES 2001-509 Washington, DC: National Center for Education Statistics, 2001, pp. 283–305
- [128] R Zwick “A Review of ETS Differential Item Functioning Assessment Procedures: Flagging Rules, Minimum Sample Size Requirements, and Criterion Refinement”, Research Report ETS RR-12-08, 2012
7 Statements and Declarations
7.1 Disclosure Statement
The authors report there are no competing interests to declare.
7.2 Acknowledgements
The authors want to express sincere appreciation and gratitude to many people who provided helpful feedback on early drafts of this manuscript, including Dr. Jane Rogers at the University of Connecticut, Drs. Carolyn Anderson and Justin Kern at the University of Illinois Urbana-Champaign, and the journal editor and anonymous reviewers. Also, the authors appreciate the support and opportunities to present preliminary findings at national conferences and weekly seminars of the Quantitative and Qualitative Methodology, Measurement, and Evaluation (QUERIES) program at the College of Education, University of Illinois Urbana-Champaign. This work was supported by the Conference Travel Grant at the College of Education, University of Illinois Urbana-Champaign.