NutrifyAI: An AI-Powered System for Real-Time Food Detection, Nutritional Analysis, and Personalized Meal Recommendations
††thanks: Date: August 12, 2024
Abstract
With diet and nutrition apps reaching 1.4 billion users in 2022 [1], it’s no surprise that health apps like MyFitnessPal, Noom, and Calorie Counter, are surging in popularity. However, one major setback [2] of nearly all nutrition applications is that users must enter food data manually, which is time-consuming and tedious. Thus, there has been an increasing demand for applications that can accurately identify food items, analyze their nutritional content, and offer dietary recommendations in real-time. This paper introduces a comprehensive system that combines advanced computer vision techniques with nutrition analysis, implemented in a versatile mobile and web application. The system is divided into three key components: 1) food detection using the YOLOv8 model, 2) nutrient analysis via the Edamam Nutrition Analysis API, and 3) personalized meal recommendations using the Edamam Meal Planning and Recipe Search APIs. Designed for both mobile and web platforms, the application ensures fast processing times with an intuitive user interface, with features such as data visualizations using Chart.js, a login system, and personalized settings for dietary preferences, allergies, and cuisine choices. Preliminary results showcase the system’s effectiveness, making it a valuable tool for users to make informed dietary decisions.
Index Terms:
computer vision, YOLO model, artificial intelligence, machine learning, food recognitionI Introduction
The rise of artificial intelligence has significantly impacted various aspects of human daily life, ranging from healthcare to entertainment. Among the numerous advancements in artificial intelligence, computer vision stands out for its potential in how users interact and interpret visual data. Particularly, computer vision offers a promising application in the domain of food recognition and nutrient analysis [3]. As the global population is becoming increasingly health conscious, there is a growing demand for technologies that can accurately identify food items and subsequently provide detailed nutritional information. This research aims to explore the capabilities of a computer vision model, specifically a YOLO (You Only Look Once) model, to accurately recognize food dishes and perform a reliable analysis of their nutritional content.
I-A YOLO Models
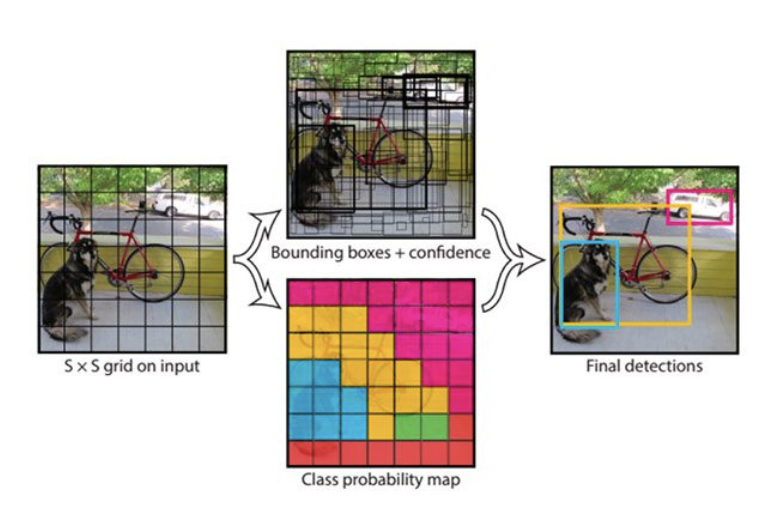
YOLO (You Only Look Once) models are a family of real-time object detection algorithms that excel at processing images in a single evaluation, predicting bounding boxes and class probabilities simultaneously. Unlike traditional object detection models, which process images in multiple stages, YOLO’s single-stage approach allows for much faster detection times without compromising accuracy [4]. This makes YOLO models particularly suitable for this application, which requires rapid and precise object detection. Other fields YOLO models are applicable include autonomous driving, surveillance [5], and notably, food recognition, where quick and accurate results are essential.
YOLOv5 and YOLOv8 are two advanced versions of YOLO models, each incorporating techniques such as multi-scale predictions and anchor boxes [6], along with various architectural improvements to enhance detection performance. YOLOv5 is known for its balance between speed and accuracy, making it versatile for diverse applications, while YOLOv8 offers even better accuracy and efficiency through further optimization. In this paper, we test variations of both models.
II Literature Review
Table I reviews key studies relevant to the development of NutrifyAI, focusing on food detection using YOLO models, the integration of nutritional APIs for real-time analysis, and AI-driven meal recommendations.
| Title | Authors | Description | Benefits | Limitations |
| Precision and Adaptability of YOLOv5 and YOLOv8 in Dynamic Robotic Environments | Kich, V., Muttaqien, M., Toyama, J., Miyoshi, R., Ida, Y., Ohya, A., & Date, H. | Explores the use of YOLO models in detecting food items in real-time applications. [10] | High accuracy with YOLOv8; optimized for real-time detection. | Limited performance in detecting less common food items; high computational resources needed. |
| RecipeIS—Recipe Recommendation System Based on Recognition of Food Ingredients | Rodrigues, M., & Fidalgo, F., & Oliveira, A. | Discusses the integration of nutritional APIs, like Edamam, for real-time nutrient analysis. [11] | Comprehensive nutrient breakdowns; enhances user experience. | Depends on correct food identification; API call rate limits. |
| AI-powered in the digital age: Ensemble innovation personalizes the food recommendations | Yaiprasert, C., & Hidayanto, A. | Explores AI-driven approaches to creating personalized meal recommendations. [12] | High customization based on user data; supports dietary goals. | Potential inaccuracies if input data is incomplete; may not accommodate all dietary needs. |
| A Comprehensive Survey of Image-Based Food Recognition and Volume Estimation Methods for Dietary Assessment | Tahir, G., & Loo, C. | Analyzes challenges in food image recognition, particularly focusing on class imbalance. [13] | Insights into overcoming class imbalance; improves model robustness. | Requires large, diverse datasets; complex model tuning. |
| Development and User Evaluation of a Food-recognition app (FoodRec): Experimental Data and Qualitative Analysis | Battiato, S., & Caponnetto, S., & Leotta, R., et al. | Surveys AI-powered food recognition systems, evaluating their impact on user health. [14] | Improves engagement through accurate food recognition; aids dietary management. | Performance can be affected by lighting conditions and image quality; privacy concerns. |
III Methodology
III-A Overview
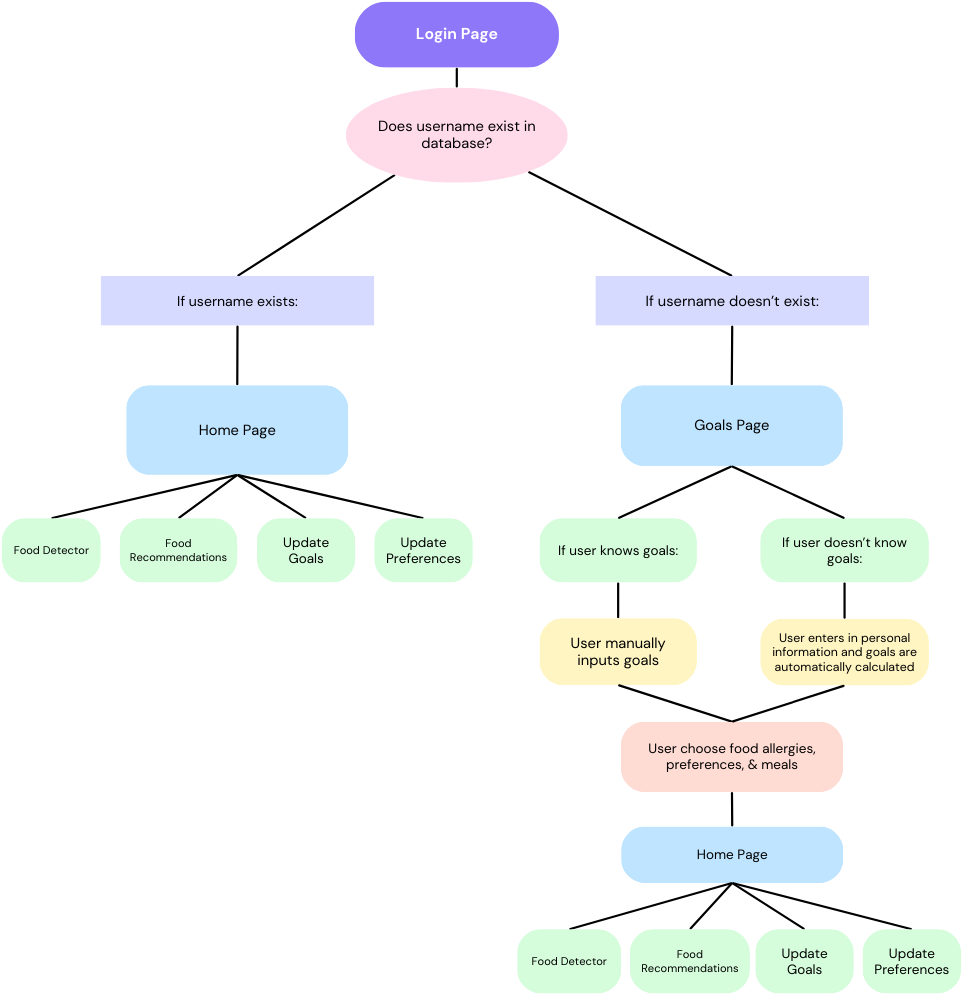
In this research, we set out to explore the potential of AI technologies in enhancing daily food tracking through detection, analysis, and recommendations. Thus, we developed NutrifyAI, a web application, as the medium for this research to highlights its practicality and usability in people’s daily lives. By offering a user-friendly interface, the app allows individuals to seamlessly integrate nutritional tracking into their routines. Users can simply capture an image of their meal, which the app processes to detect and identify the food items present.
Leveraging the power of the YOLOv8 computer vision model, NutrifyAI accurately recognizes various food items within the image. Once detected, the app retrieves detailed nutritional information for each identified food item using the Edamam API. This data is then aggregated to provide users with a comprehensive nutritional breakdown, including key metrics such as total calories, fat, protein, carbohydrate, and fiber content.
Beyond just tracking, NutrifyAI builds a history of the foods scanned by the user. Using this data, the app offers personalized meal recommendations tailored to the user’s nutritional goals.
III-B Data Collection and Preprocessing
III-B1 Training Datasets
The training of our food detection model was based on datasets that had already been aggregated and preprocessed by the repository available at GitHub [7]. This repository integrates multiple datasets, that were publically accessible and available, to provide a comprehensive collection of food images for training. 5 datasets were used:
Open Images V6-Food Dataset
We began by extracting relevant food-related images from the Open Images V6 dataset, a comprehensive dataset developed by Google for computer vision tasks. Our extraction focused on 18 specific food labels, resulting in a subset of over 20,000 images. Each image was associated with detailed annotations, including bounding boxes and labels corresponding to the food items present. This dataset served as the primary source of food images, becoming a foundation for the model’s initial training.
School Lunch Dataset
The next dataset integrated into our training data was the School Lunch Dataset, which includes 3,940 images of Japanese high school students’ lunches. Each image in this dataset is captured from a consistent frontal angle, with precise labels indicating the coordinates and types of dishes. The dataset categorizes dishes into 21 distinct classes, with an additional ”Other Foods” category for items that do not fit into the predefined classes. This dataset was valuable for introducing variations in food presentation and ensuring the model’s ability to handle real-world school lunch scenarios.
Vietnamese Food Dataset
To incorporate cultural diversity, we included a self-collected Vietnamese Food dataset. This dataset contains images of 10 traditional Vietnamese dishes, such as Pho, Com Tam, Hu Tieu, and Banh Mi. Each dish category comprises approximately 20-30 images, which were split 80-20 for training and evaluation. This dataset’s inclusion was essential for improving the model’s recognition capabilities across different cultural contexts.
MAFood-121 Dataset
This dataset was included to introduce a broader range of global cuisines. This dataset contains 21,175 images of 121 different dishes, selected from the top 11 most popular cuisines worldwide based on Google Trends. The dishes are categorized into 10 food types, such as Bread, Eggs, Fried, Meat, Noodles, Rice, Seafood, Soup, Dumplings, and Vegetables. We used 85% of these images for training and the remaining 15% for evaluation.
Food-101 Dataset
We also integrated the Food-101 dataset, which includes 101,000 images of 101 different dish types. For each dish, 750 images were designated for training and 250 for testing.
The final expanded dataset comprised 93,748 training images and 26,825 evaluation images, covering a total of 180 distinct dishes. This comprehensive dataset ensured that the model was exposed to a wide variety of food items, enhancing its classification performance.

III-C Model Architecture
The YOLOv8 model was trained using the aforementioned datasets, each labeled with food categories and bounding boxes. The dataset was split into 80% for training and 20% for validation. To enhance the model’s generalization ability, we applied data augmentation techniques such as rotations, scaling, and flips to simulate different viewing conditions.
The training process utilized of Stochastic Gradient Descent with a momentum optimizer. We started with an initial learning rate of 0.01, which was adjusted throughout the training process using a learning rate scheduler to ensure steady improvement and prevent overfitting. The model was trained for 50 epochs, with early stopping used to halt training if the validation loss did not improve after 10 consecutive epochs.
In addition to YOLOv8, we used EfficientNet-B4 for further classification. EfficientNet-B4 was fine-tuned on our dataset, starting with pre-trained weights from ImageNet. The fine-tuning process involved training for 30 epochs using the Adam optimizer with a learning rate of 0.001, with similar data augmentation techniques applied to improve the model’s robustness in recognizing diverse food items.
III-D Model Evaluation
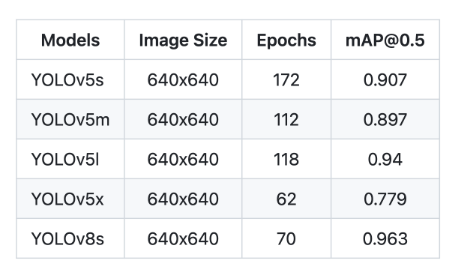
The evaluation of our food detection model was conducted using the Food Recognition 2022 dataset [8], a comprehensive annotated dataset specifically designed for semantic segmentation tasks, which includes 43,962 images with 95,009 labeled objects belonging to 498 different classes. The GitHub repository [7] from which we obtained our training data tested five variations of the YOLO model (YOLOv5s, YOLOv5m, YOLOv5l, YOLOv5x, YOLOv8s) with results measured based on mAP at 0.5 IoU. The chart in Fig. 8 presents the mAP results for each YOLO variant, highlighting the superior performance of YOLOv8s with a mAP of 0.963. This high accuracy is why we chose YOLOv8s to power the NutrifyAI application.
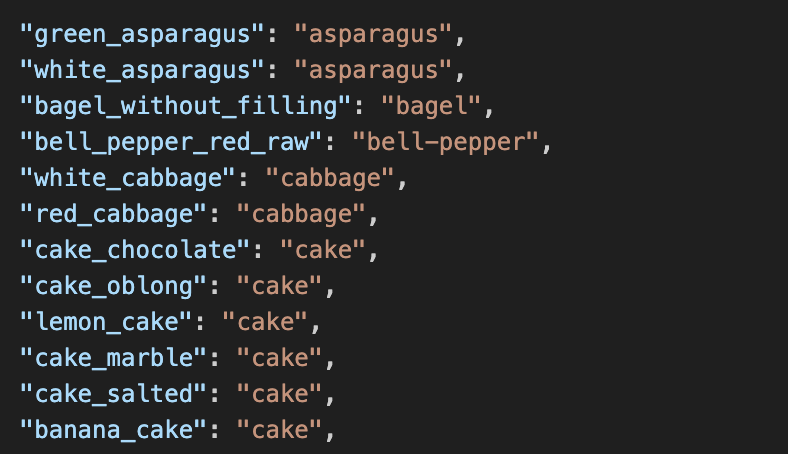
To assess our model’s performance, we selected a subset of the Food Recognition 2022 dataset that intersected with the classes present in our training data. This resulted in a test set comprising 55 food categories. Given that the Food Recognition 2022 dataset contains 498 different classes, many of which were not present in our training data, a crucial step in the evaluation process was label mapping. This involved aligning the labels from the Food Recognition 2022 dataset with those used during training. For example, while our original training dataset had a single class labeled as ”wine,” the Food Recognition 2022 dataset included more specific classes such as ”rose-wine” and ”red-wine.” In cases like these, we mapped these specific classes back to the more general ”wine” label to ensure consistency in evaluation.
III-E API Integration
Edamam Nutrient Analysis API
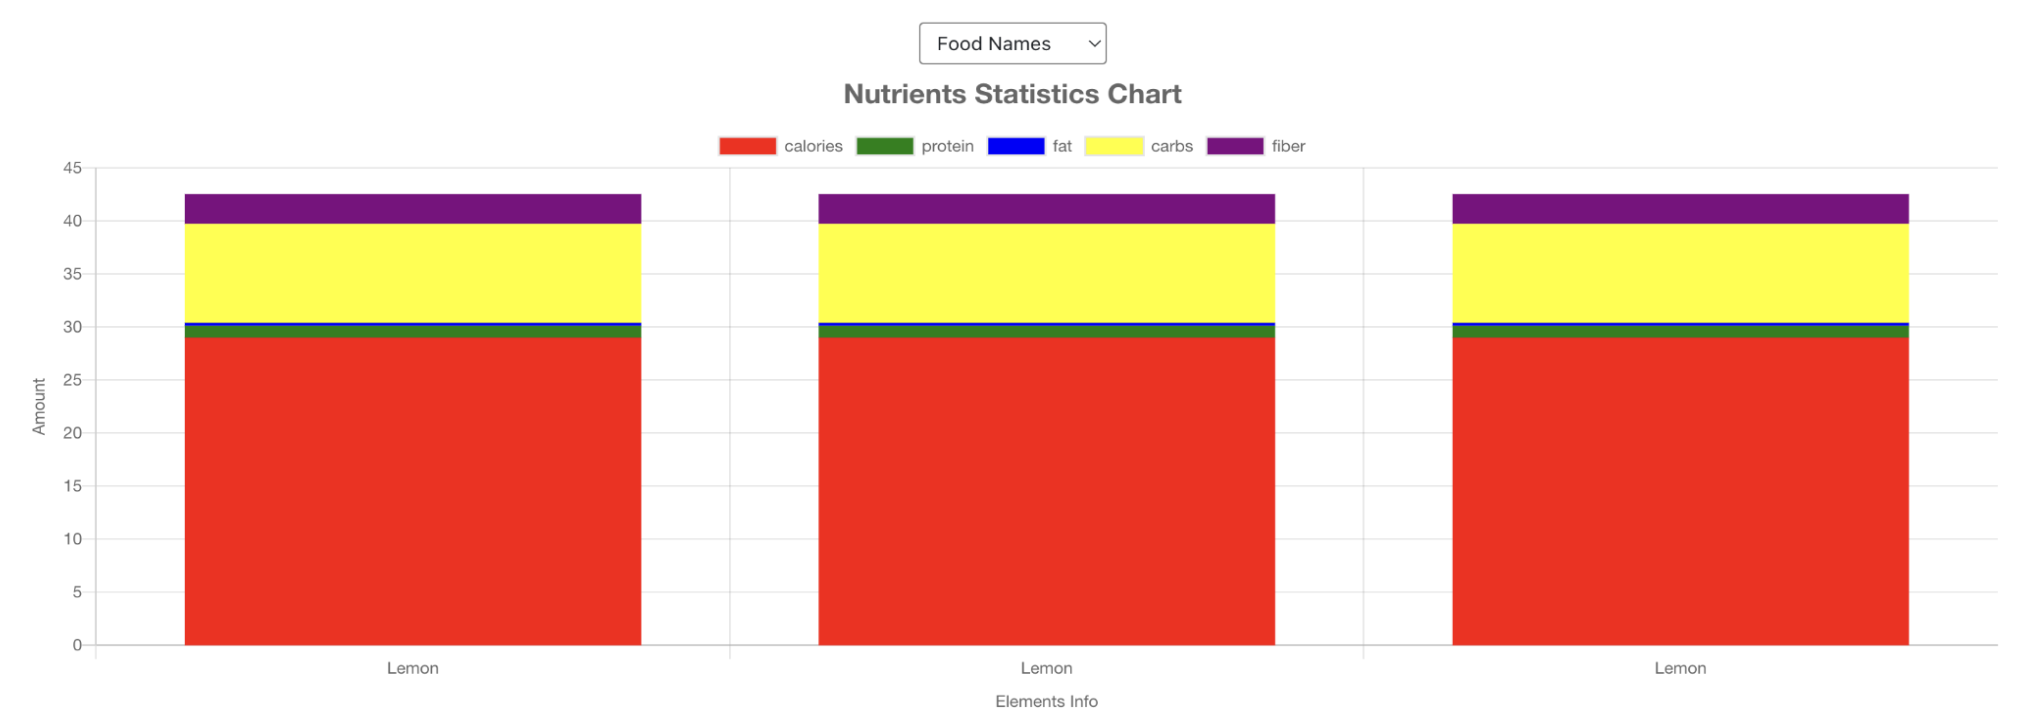
This API was used to retrieve detailed nutritional information for the detected food items. After the YOLOv8 model identifies the food in an image, a request is sent to the Edamam API with the name of the detected food item. The API returns comprehensive nutritional data, including calories, fat, protein, fiber, and other key nutrients. In our user interface, the nutritional information retrived from the Edamam API is visualized using Chart.js. This allows users to quickly see the nutritional breakdown of their meals. This information is then stored in a Google Sheets database via the Google Sheets API for further processing and display.
Edamam Recipe and Meal Planning API
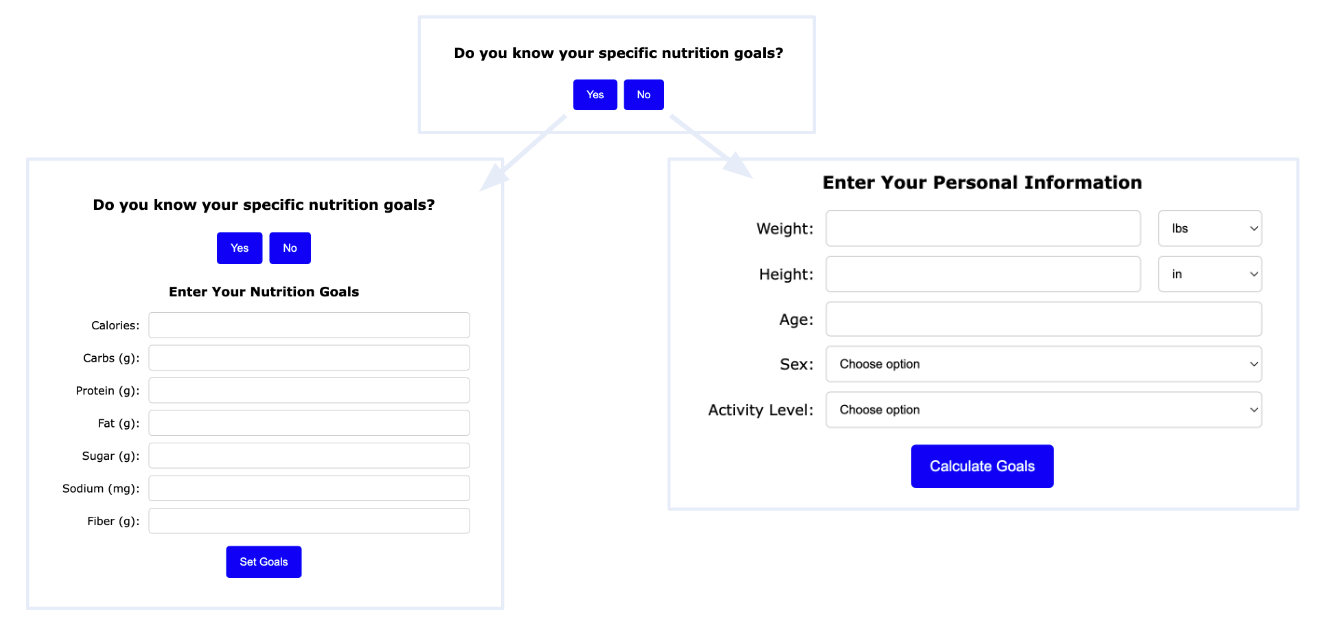
To provide personalized meal recommendations based on the user’s nutritional goals, the Edamam Recipe and Meal Planning APIs were integrated into the application. These APIs allow NutrifyAI to suggest recipes and meal plans that align with the user’s dietary preferences, restrictions, and nutritional targets. Recommendations are generated based on the history of foods scanned by the user, offering tailored meal suggestions to help users meet their health objectives.
Google Sheets API
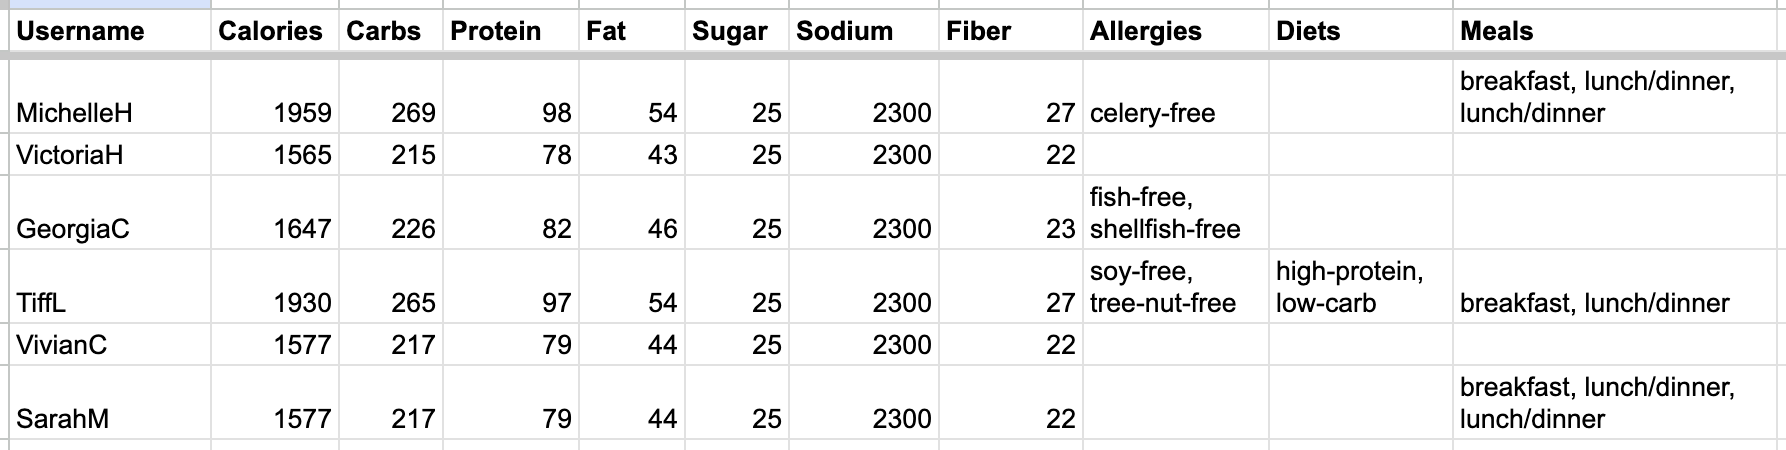
This API was used to store and manage the nutritional data and meal recommendations retrieved from the Edamam APIs. Each time a food item is detected and analyzed, the nutritional information is automatically logged into a Google Sheet. This approach ensures that all user data is securely stored and easily accessible for future reference and analysis.
Server-Side Implementation
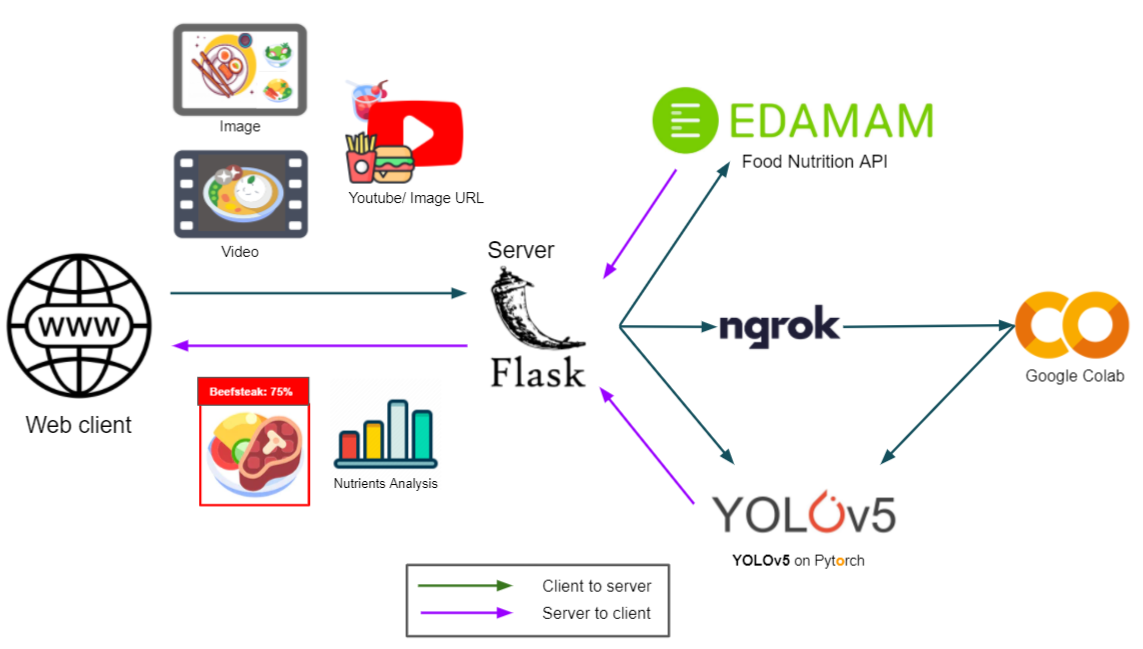
The entire process is managed by a Flask server, which handles communication between the client-side web application, the YOLOv8 model, and the various APIs. Flask serves as the backbone of the server-side logic, managing requests, processing data, and returning results to the user. The Flask server is connected to a YOLOv8 model hosted on Google Colab via ngrok, which enables secure tunneling and facilitates real-time image processing.
Client-Server Implementation
As illustrated in the attached image, the web client interacts with the server by sending images, videos, or URLs for food detection. Once the image is processed by the YOLOv8 model on the server, the detected food items are sent to the Edamam APIs for nutritional analysis and meal recommendations. The results are then returned to the web client, where they are displayed to the user through a user-friendly interface that utilizes Chart.js for visualizing nutritional data.
IV Results
After evaluation on the Food Recognition 2022 dataset as previously mentioned, we noted that while the original authors of the GitHub repository conducted mAP testing on five YOLO model variations, achieving the highest mAP of 0.963 with YOLOv8s at 0.5 IoU, we did not specifically test our model on mAP for this dataset during the final testing phase. Instead, we assessed the model’s accuracy using metrics such as precision, recall, F1 score, and overall accuracy.
The evaluation script was designed to compare the model’s predictions against ground truth labels on a per-image basis. For each image, the script counted true positives, false positives, and false negatives, which were then aggregated across all images to calculate the overall metrics.
Accuracy was determined by calculating the ratio of correctly predicted labels to the total number of ground truth labels across all images. The model achieved an accuracy of 75.4%, indicating that the majority of the food items were correctly identified.
Precision measured the proportion of true positive predictions out of all positive predictions (both true and false positives). The model achieved an overall precision of 78.5%, reflecting its ability to minimize false positives.
Recall was calculated as the proportion of true positives out of the total number of actual positives (true positives plus false negatives). The model demonstrated an overall recall of 72.8%, which indicates how well it detected relevant food items.
F1 Score, the harmonic mean of precision and recall, was also calculated to provide a balanced measure of the model’s performance. The model achieved an F1 score of 75.5%.
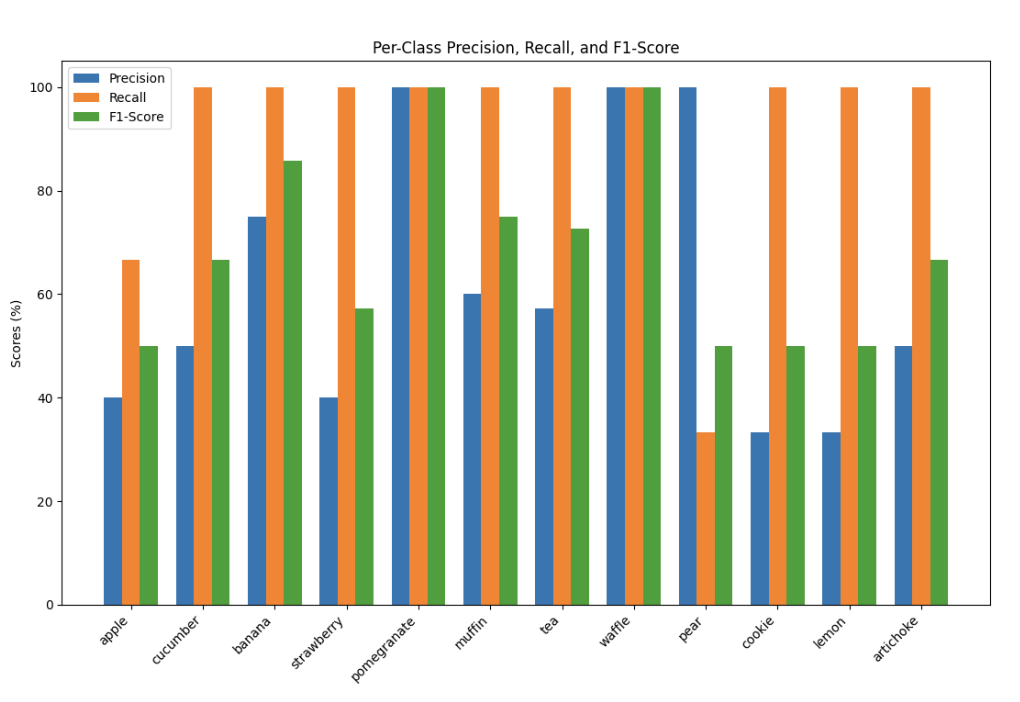
In addition to overall metrics, we also separated the results based on food classes to see which foods the model performed the best on. It was observed that the model performed exceptionally well on images containing distinct-looking food items, such as pomegranates and waffles, which were correctly identified with near 100% accuracy. However, the model struggled with more common or visually similar items like different types of apples and pears, likely due to class imbalance in the training data. The distribution for some sample classes are shown in Fig. 10 below.
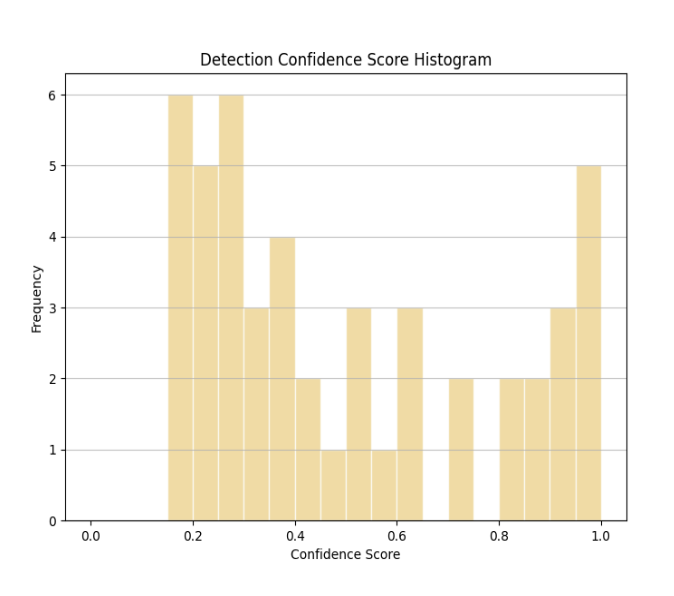
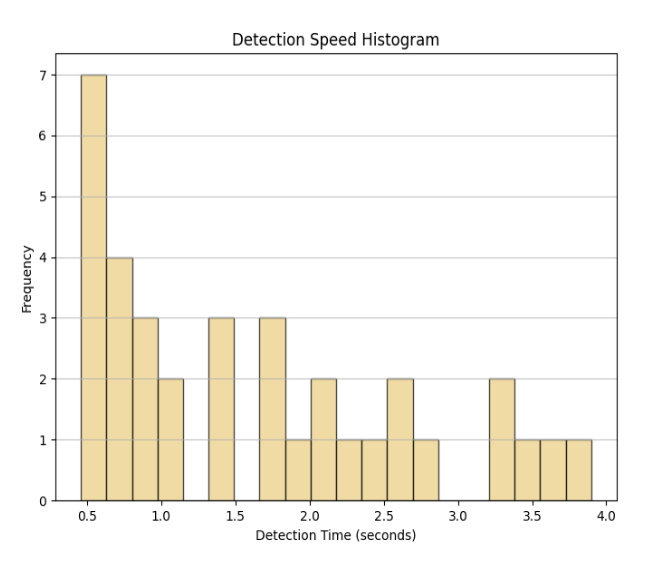
We also evaluated the model on other aspects including detection confidence scores and detection speeds. As seen in Fig. 11, the histogram reveals a bimodal distribution, with peaks around 0.2 and 0.8. This indicates that the model often either had high confidence in its predictions or was relatively uncertain. In Fig. 12, the median time taken by the model to process each image and produce a result was approximately 1.5 seconds. This indicates that the model is efficient enough for real-time applications, ensuring a smooth user experience.
V Discussion
The primary objective of this study was to develop and evaluate a system that utilizes computer vision models and nutritional APIs for advanced food profiling and recommendations. The findings from our evaluation indicate that the system performs well in identifying food items and providing detailed nutritional analysis, supporting our original hypothesis that an AI-powered tool can streamline and enhance the process of dietary tracking.
The data moderately supports our hypothesis. NutrifyAI achieved a fair accuracy of 75.4%, with precision, recall, and F1 scores that indicate an acceptable detection system. The successful integration of the Edamam Nutrient Analysis API and the real-time visualization of nutritional data through Chart.js further reinforce the effectiveness of our approach. The personalized meal recommendations generated by the Edamam Recipe and Meal Planning APIs were also well-received, demonstrating the system’s potential in helping users make informed dietary choices. However, the bimodal distribution of the confidence scores and the variability in the model’s performance across different food categories suggest areas where the system can be further refined.
When comparing our findings to other research in the field of food recognition and dietary tracking, our results are in line with previous studies that have utilized deep learning for food detection. For instance, other studies employing YOLO models have reported similar accuracy and precision metrics, validating our choice of model and approach. However, most research utilize mean Average Precision (mAP) as a primary evaluation metric, which provides a more nuanced understanding of model performance across different thresholds. We did not measure mAP in this study, which could have provided additional insights into the model’s performance and comparison with other systems. Incorporating mAP as a metric in future evaluations would allow for a more comprehensive assessment of our model’s capabilities and would enable more direct comparisons with existing literature.
V-A Future Improvements
There are several ways we could improve the system’s overall performance. Firstly, incorporating mean Average Precision (mAP) can better gauge the model’s precision and recall across various confidence thresholds. This would provide a more detailed understanding of the model’s strengths and weaknesses.
Furthermore, one of the main limitations identified was the class imbalance and limited diversity in the training dataset. Expanding the dataset to include a broader range of food categories, particularly those that are underrepresented, could improve the model’s generalization and recognition capabilities. A more diverse dataset would also help the model perform better on visually similar items, which currently present a challenge.
We also noticed that the detection confidence score histogram revealed a significant number of predictions clustered around the 0.2 confidence level, indicating uncertainty in those predictions. To improve the model’s reliability, future work should focus on refining the confidence calibration, potentially through better training technique.
Finally, introducing feedback mechanisms where users can correct or adjust predictions would allow the system to learn from real-world usage. This could lead to continuous improvement in accuracy and personalization, making the meal recommendation system more relevant and tailored to individual users.
VI Conclusion
In summary, NutrifyAI demonstrates the potential of integrating computer vision models with nutritional APIs to create an effective tool for food recognition and nutritional analysis. While the system achieved promising results, several areas remain for further exploration and enhancement. Future research should focus on expanding the diversity of training datasets to improve the model’s ability to recognize a wider array of food items. Additionally, refining the model’s confidence calibration and incorporating advanced evaluation metrics, such as mAP, will be crucial for achieving greater reliability. Developing mechanisms for user feedback will enable the system to adapt to real-world usage, offering more personalized and accurate meal recommendations. As the field of AI-powered nutrition continues to evolve, there is significant potential for this technology to be applied in various domains, including healthcare and personalized diet planning, making the pursuit of these improvements highly worthwhile.
Acknowledgment
This project would not have been possible without the support and guidance of Junyao Chen and Professor Zhengyuan Zhou from the NYU Stern School of Business, Department of Technology, Operations, and Statistics. Their mentorship and insights were crucial in shaping the direction of this research. Furthermore, special thanks to the Winston Data Foundation for their financial support through their merit scholarship for the NYU GSTEM Program.
References
- [1] A. Sharma, “Diet and Nutrition Apps Statistics: Exploring the Impact on Health,” Market.us Media, 28 Aug. 2023. [Online]. Available: https://media.market.us/diet-and-nutrition-apps-statistics/.
- [2] L. Young, “Featured Blogs,” ACSM CMS, 2024. [Online]. Available: https://www.acsm.org/blog-detail/fitness-index-blog/2024/06/12/eating-healthy-nutrition-apps.
- [3] A. Busad et al., “Computer Vision Based Food Recognition with Nutrition Analysis,” IJCRT, vol. 11, no. 1, pp. 2320–882, 2023. [Online]. Available: https://www.ijcrt.org/papers/IJCRT2301042.pdf.
- [4] “You Only Look Once (YOLO): The Best Model for AI-Integrated Video Analytics?,” I3international.com, 2016. [Online]. Available: https://i3international.com/resources/media/yolo-the-best-model-for-ai-integrated-video-analytics.
- [5] T. Diwan et al., “Object Detection Using YOLO: Challenges, Architectural Successors, Datasets and Applications,” Multimedia Tools and Applications, vol. 82, pp. 9243–75, Aug. 2022. [Online]. Available: https://doi.org/10.1007/s11042-022-13644-y.
- [6] “YOLO Models for Object Detection Explained [Yolov8 Updated],” Encord.com, 4 Apr. 2024. [Online]. Available: https://encord.com/blog/yolo-object-detection-guide/.
- [7] H.-L. Nguyen, “Meal Analysis with Theseus,” GitHub, 21 Sept. 2022. [Online]. Available: https://github.com/lannguyen0910/food-recognition.
- [8] “Food Recognition 2022 - Dataset Ninja,” Dataset Ninja, 2022. [Online]. Available: https://datasetninja.com/food-recognition.
- [9] J. Redmon et al., “You Only Look Once: Unified, Real-Time Object Detection,” 9 May 2016. [Online]. Available: https://arxiv.org/pdf/1506.02640v5.pdf.
- [10] K. Victor et al., “Precision and Adaptability of YOLOv5 and YOLOv8 in Dynamic Robotic Environments,” Arxiv.org, 2023. [Online]. Available: https://arxiv.org/html/2406.00315v1.
- [11] M. S. Rodrigues et al., “RecipeIS—Recipe Recommendation System Based on Recognition of Food Ingredients,” Applied Sciences, vol. 13, no. 13, p. 7880, Jan. 2023. [Online]. Available: https://doi.org/10.3390/app13137880.
- [12] C. Yaiprasert and A. N. Hidayanto, “AI-powered in the Digital Age: Ensemble Innovation Personalizes the Food Recommendations,” Journal of Open Innovation: Technology, Market, and Complexity, vol. 10, no. 2, p. 100261, 2024. [Online]. Available: https://doi.org/10.1016/j.joitmc.2024.100261.
- [13] G. A. Tahir and C. K. Loo, “A Comprehensive Survey of Image-Based Food Recognition and Volume Estimation Methods for Dietary Assessment,” Healthcare, vol. 9, no. 12, p. 1676, Dec. 2021. [Online]. Available: https://doi.org/10.3390/healthcare9121676.
- [14] S. Battiato et al., “Development and User Evaluation of a Food-recognition App (FoodRec): Experimental Data and Qualitative Analysis,” Health Psychology Research, vol. 11, p. 70401, 21 Feb. 2023. [Online]. Available: https://doi.org/10.52965/001c.70401.