Galaxy Zoo: Morphologies based on UKIDSS NIR Imaging for 71,052 Galaxies
Abstract
We present morphological classifications based on Galaxy Zoo analysis of 71,052 galaxies with imaging from the United Kingdom Infrared Telescope Infrared Deep Sky Survey (UKIDSS). Galaxies were selected out of the Galaxy Zoo 2 (GZ2) sample, so also have imaging from the Sloan Digital Sky Survey. An identical classification tree, and vote weighting/aggregation was applied to both UKIDSS and GZ2 classifications enabling direct comparisons. With this Research Note we provide a public release of the GZ:UKIDSS morphologies and discuss some initial comparisons with GZ2.
1 Introduction
Historically, most morphological classification of galaxies has been conducted using optical images. In the photographic era, B-band images were the primary source (e.g. Hubble, 1926; Sandage, 1961; de Vaucouleurs, 1963). More recent morphological catalogs also derive their classifications from rest-frame optical images, e.g. B-band (de Vaucouleurs et al., 1991), ACS I-F814W (Scarlata et al., 2007), Sloan Digital Sky Survey (SDSS) -band (Fukugita et al., 2007; Nair & Abraham, 2010) or SDSS color-composite (Lintott et al., 2008; Willett et al., 2013).
Optical galaxy flux is dominated by young, hot stars, highlighting structures where star formation is ongoing. Optical light is also impacted by extinction due to dust, which can obscure features. Longer wavelengths are less impacted by these effects. Near infra-red (NIR) galaxy flux is dominated by lower mass, redder stars, thus should reveal the underlying “stellar backbone” of galaxies. Indeed, studies of individual or small numbers of galaxies have have found significant differences between optical and NIR morphology (Hackwell & Schweizer, 1983; Thronson et al., 1989; Mirabel et al., 1999; Block et al., 1994; Block & Puerari, 1999); although, in larger samples IR morphology has been found to be well-correlated with optical morphology (Eskridge et al., 2002; Buta et al., 2010).
With this Research Note, we publish Galaxy Zoo classifications for a sample of 71,052 galaxies with imaging from the United Kingdom Infrared Telescope (UKIRT) Infrared Deep Sky Survey (UKIDSS; Lawrence et al. 2007). These data have been used to investigate the difference between optical (Galaxy Zoo 2 or GZ2; Willett et al., 2013) and NIR morphology (Galloway, 2018; Warrick, 2021).
2 UKIDSS Imaging and Sample Selection
UKIDSS (Lawrence et al., 2007; Warren et al., 2007) was a large imaging program on UKIRT from 2005-2012. The Large Area Survey (LAS) of UKIDSS, obtained ZYJHK imaging across almost 4000 sq degs at high Galactic latitude. The UKIDSS Galaxy Zoo sample is comprised of 71,052 galaxies with LAS imaging selected out of GZ2 (previously classified based on SDSS images, Willett et al. 2013). GZ2 selected the brightest 25% of galaxies (magnitude and angular size petroR90_r″) from the SDSS Main Galaxy Sample (Strauss et al., 2002).
UKIDSS image cutouts were generated using YJK data (1–2.4m) implementing the Lupton et al. (2004) algorithm to create color images with a comparable color balance to SDSS (0.48–0.76m).111The same algorithm is implemented in the ColourImage service at http://wsa.roe.ac.uk/ The resolution of both sets of images are comparable (1.2-1.4″ with a pixel scale around 0.4″), however SDSS imaging is typically 1 mag deeper than UKIDSS (SDSS has typical magnitude limits of 22.2-21.3 across compared to 20.3-21.1 across YJK in UKIDSS; with bluest bands being deepest in both surveys). Example images from each survey are shown in Figure 1a,b.
3 Galaxy Zoo UKIDSS Classifications
Morphological classifications for this UKIDSS sample were collected via Galaxy Zoo222www.galaxyzoo.org from October 2013-May 2014. More than 80,000 individual volunteers contributed classifications. The classification tree and methods to count and weight raw votes by user consistency were both identical to that in GZ2 (Willett et al., 2013), to allow for a direct comparison. The reader is referred to Willett et al. (2013) for more details.
The UKIDSS Galaxy Zoo classification catalog is available at data.galaxyzoo.org and both images and catalog are available at HuggingFace333https://huggingface.co/datasets/mwalmsley/gz_ukidss, as part of a large Galaxy Zoo multi-campaign dataset used to train Zoobot (Walmsley et al., 2023).
4 NIR Compared to Optical Morphologies
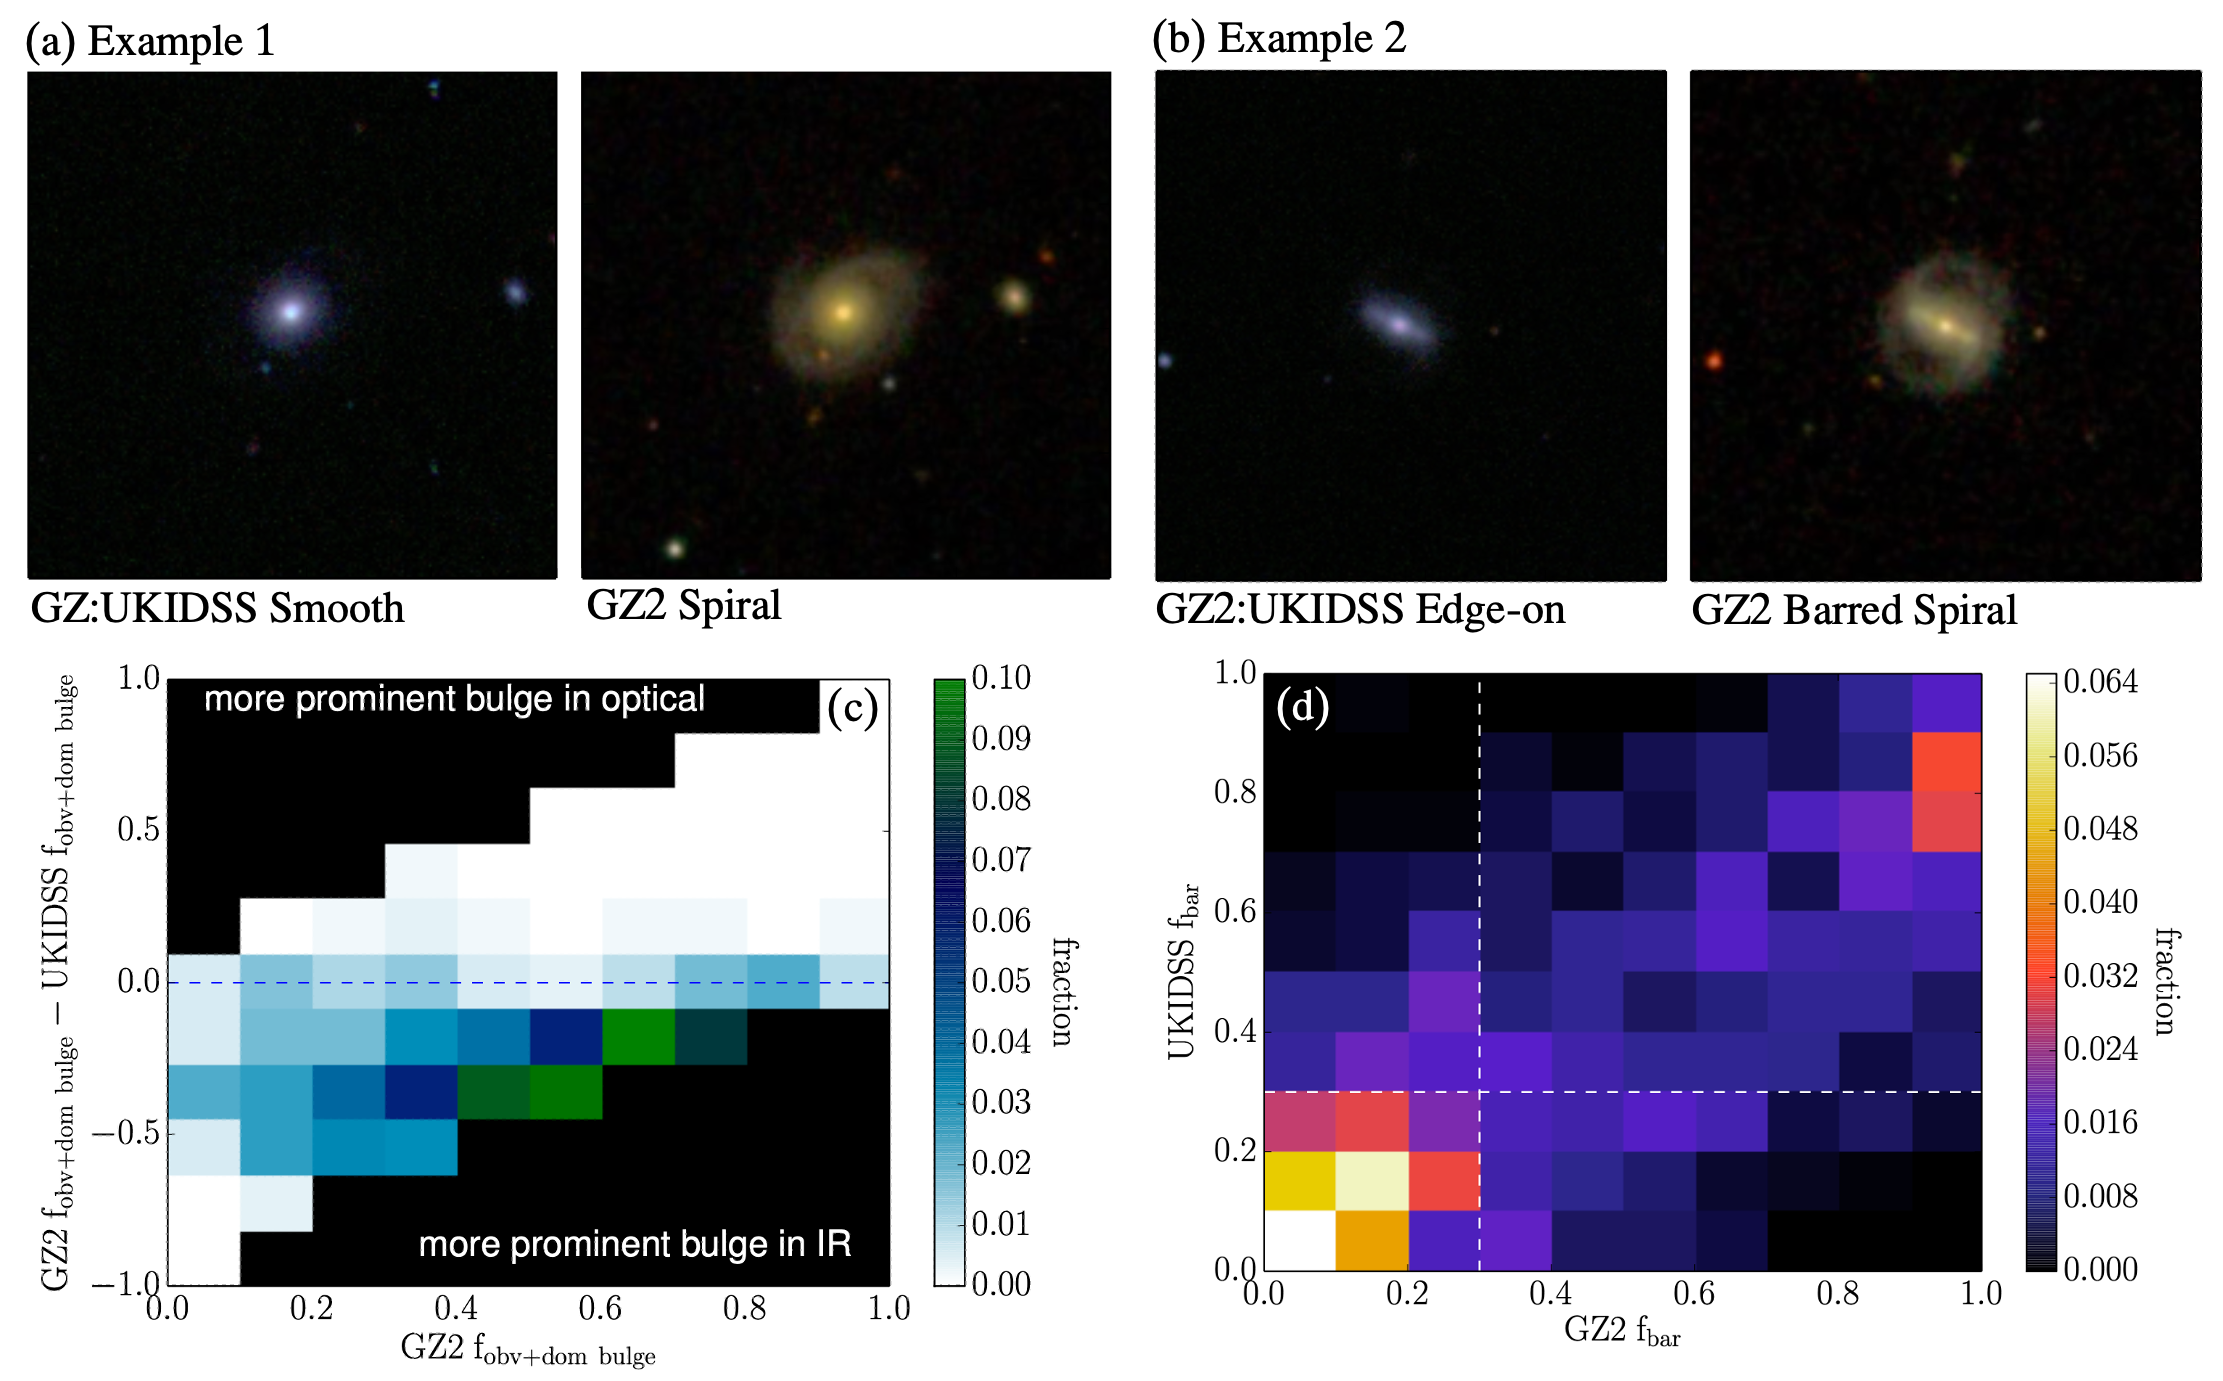
Galloway (2018) made a comparison of morphologies of 6,484 bright nearby galaxies clearly visible in both GZ2 (SDSS) and GZ:UKIDSS. This selection was an attempt to mitigate the impact of shallower UKIDSS imaging. Galloway (2018) found that galaxies as seen in UKIDSS tended to have lower vote fractions for visible features () and larger vote fractions for obvious or dominant bulges (, see Figure 1c). Thus galaxies in UKIDSS had slightly earlier-appearing morphologies, consistent with the NIR imaging revealing more of the older stellar populations than optical. Where spirals were identified in both sets of images, they tended to appear smoother and looser in UKIDSS, but often, spirals visible in SDSS were invisible in the UKIDSS imaging. Bars () were not significantly more obvious in the UKIDSS imaging than SDSS (see Figure 1d).
Galloway (2018) concluded that the majority of the differences in morphology between UKIDSS and SDSS imaging were driven by the difference in depth of the images compared to the typical brightness of galaxies at those wavelengths (as illustrated in Figure 1a,b). For a more useful comparison of NIR to optical morphologies in a large sample, analysis will be needed on a large sample with much deeper NIR imaging. This should be possible in the near future with the Galaxy Zoo: Euclid project (Euclid Collaboration et al., 2024), which has both optical and YJH imaging.
References
- Block et al. (1994) Block, D. L., Bertin, G., Stockton, A., et al. 1994, A&A, 288, 365
- Block & Puerari (1999) Block, D. L., & Puerari, I. 1999, A&A, 342, 627. https://arxiv.org/abs/astro-ph/9811060
- Buta et al. (2010) Buta, R. J., Sheth, K., Regan, M., et al. 2010, ApJS, 190, 147, doi: 10.1088/0067-0049/190/1/147
- de Vaucouleurs (1963) de Vaucouleurs, G. 1963, ApJS, 8, 31, doi: 10.1086/190084
- de Vaucouleurs et al. (1991) de Vaucouleurs, G., de Vaucouleurs, A., Corwin, Herold G., J., et al. 1991, Third Reference Catalogue of Bright Galaxies
- Eskridge et al. (2002) Eskridge, P. B., Frogel, J. A., Pogge, R. W., et al. 2002, ApJS, 143, 73, doi: 10.1086/342340
- Euclid Collaboration et al. (2024) Euclid Collaboration, Aussel, B., Kruk, S., et al. 2024, arXiv e-prints, arXiv:2402.10187, doi: 10.48550/arXiv.2402.10187
- Fukugita et al. (2007) Fukugita, M., Nakamura, O., Okamura, S., et al. 2007, AJ, 134, 579, doi: 10.1086/518962
- Galloway (2018) Galloway, M. 2018, PhD thesis, University of Minnesota
- Hackwell & Schweizer (1983) Hackwell, J. A., & Schweizer, F. 1983, ApJ, 265, 643, doi: 10.1086/160710
- Hubble (1926) Hubble, E. P. 1926, ApJ, 64, 321, doi: 10.1086/143018
- Lawrence et al. (2007) Lawrence, A., Warren, S. J., Almaini, O., et al. 2007, MNRAS, 379, 1599, doi: 10.1111/j.1365-2966.2007.12040.x
- Lintott et al. (2008) Lintott, C. J., Schawinski, K., Slosar, A., et al. 2008, MNRAS, 389, 1179, doi: 10.1111/j.1365-2966.2008.13689.x
- Lupton et al. (2004) Lupton, R., Blanton, M. R., Fekete, G., et al. 2004, PASP, 116, 133, doi: 10.1086/382245
- Mirabel et al. (1999) Mirabel, I. F., Laurent, O., Sanders, D. B., et al. 1999, A&A, 341, 667. https://arxiv.org/abs/astro-ph/9810419
- Nair & Abraham (2010) Nair, P. B., & Abraham, R. G. 2010, ApJS, 186, 427, doi: 10.1088/0067-0049/186/2/427
- Sandage (1961) Sandage, A. 1961, The Hubble Atlas of Galaxies
- Scarlata et al. (2007) Scarlata, C., Carollo, C. M., Lilly, S., et al. 2007, ApJS, 172, 406, doi: 10.1086/516582
- Strauss et al. (2002) Strauss, M. A., Weinberg, D. H., Lupton, R. H., et al. 2002, AJ, 124, 1810, doi: 10.1086/342343
- Thronson et al. (1989) Thronson, Harley A., J., Hereld, M., Majewski, S., et al. 1989, ApJ, 343, 158, doi: 10.1086/167693
- Walmsley et al. (2023) Walmsley, M., Allen, C., Aussel, B., et al. 2023, The Journal of Open Source Software, 8, 5312, doi: 10.21105/joss.05312
- Warren et al. (2007) Warren, S. J., Hambly, N. C., Dye, S., et al. 2007, MNRAS, 375, 213, doi: 10.1111/j.1365-2966.2006.11284.x
- Warrick (2021) Warrick, E. 2021, B.Sc. Thesis Bryn Mawr College
- Willett et al. (2013) Willett, K. W., Lintott, C. J., Bamford, S. P., et al. 2013, MNRAS, 435, 2835, doi: 10.1093/mnras/stt1458