Measurement-based Resource Allocation and Control in Data Centers: A Survey
Abstract
Data centers have become ubiquitous for today’s businesses. From banks to startups, they rely on cloud infrastructure to deploy user applications. In this context, it is vital to provide users with application performance guarantees. Network interference is one of the causes of unpredictable application performance, and many solutions have been proposed over the years. The main objective of this survey is to familiarize the reader with research into network measurement-based resource allocation and control in data centers, focusing on network resources in order to provide cloud performance guarantees. We start with a primer on general network measurement techniques and data center network and applications to give the reader context. We then summarize the characteristics of network traffic and cluster workloads in data centers, which are pivotal for measurement-based allocation and control. We study and compare network monitoring in data centers, giving an overview on their evolution from Software-Defined Networking (SDN) to programmable dataplanes-based. The network monitoring information can serve as input to cluster allocation and scheduling decisions. We next categorize cluster scheduling frameworks, and perform an analysis of those that provide network guarantees in data centers, and we also look at emergent Machine Learning-driven resource allocation and control. We conclude with a discussion about future research directions.
I Introduction
Networks represent an important component of modern computing, shaping an interconnected world. While high-level applications, such as games, music and video streaming, office tools, play an important role in people’s lifes, the importance of communication between computers cannot be overstated. Without a fast and reliable means of communication, these applications would be running only on the local computers with no external input, safe for the information obtained through compact disks or memory sticks. The Internet has evolved over the years into such a fast and reliable means of communication. At the heart of this evolution have been the strong need of people to communicate with each other, and the information that people want to disseminate to the world. As a result, a person can contact anyone over the Internet through electronic mail, voice or video call, and information on just about anything is nowadays easily available worldwide to anyone with an Internet connection. These two key needs have fueled the development of networks over the years, making the Internet ubiquitous.
Services such as web search, social networking, online shopping, content streaming, instant messaging, video calling, digitised newspapers, books, or research articles, form the online landscape today. Because of the huge number of people that access these services, enormous computing resources are needed. This demand has led to the development of specialised warehouse-scale computers (WSCs) [1] that are housed in data centres. Data centres contain many hundreds of thousands of such computers, powering the above-mentioned services and many more. But designing and operating such complex systems require expert knowledge. As a result, only a few companies, such as Amazon, Google, IBM, Oracle or Microsoft, develop and manage their own data centers. This complexity has given rise to cloud computing: businesses rent compute, storage and network resources from specialised companies, cloud providers, to power their services, instead of developing and maintaining their own infrastructure. Naturally, businesses require and expect predictability from the rented resources, which translates into predictable performance for their applications. The customer, or tenant, expectations are encoded into contracts called Service Level Agreements (SLAs), with specific objectives, Service Level Objectives (SLOs), defined in collaboration with the cloud provider. The objectives refer to quantifiable metrics, such as availability, throughput, or response time [2].
The infrastructure in data centers is shared amongst different tenants, giving rise to possible interference between different applications, which in turn can lead to unpredictable application performance [3]. Interference can appear in multiple places in the data center: at the servers (hosts or end-hosts), where tenant applications that run inside virtual machines (VMs) share the underlying server hardware, or in the network, with some tenants sending traffic that causes packets to queue behind each other in switches, increasing the packets’ network latency, or network delay, or one-way delay (OWD) (the time a packet takes to travel from the source to the destination across the network) [4, 5]. Several approaches to minimise interference have been proposed, both at the end-host and in-network. Avoiding or reducing the interference at the end-host can be achieved through thoughtful cluster scheduling: avoiding the colocation of applications that compete for the same end-host resources by placing these applications on different hosts that meet their resource requirements. In the network, interference effects can be avoided or reduced through flow scheduling [6, 7, 8, 9, 10] and traffic load balancing [11, 12, 13]. Pinpointing the exact cause of the interference is as challenging as data center systems are complex [14].
This survey is organized as follows. Section II discusses related survey and defines the scope for our survey. Section III presents general network measurement definitions and techniques. Section IV gives an overview data center network architecture, and presents the type of applications that run in data centers. Section V summarizes the main findings of several studies on data center network traffic characteristics. Section VI presents the cluster workloads characteristics. Section VII discusses the evolution of network monitoring systems for data centers, from SDN to programmable data planes. Section VIII presents conventional cluster schedulers, network-aware cluster schedulers and emergent ML-driven ones. We conclude in Section IX and present future research directions for each area discussed in our survey.
II Related surveys and scope of this survey
Several works dealt with issues related data center networking. [15] surveys models for energy consumption in data centers. [16] discusses virtualization in data centers. [17] surveys load balancing mechanisms in data centers. [18] presents proposals for traffic control in data centers: traffic management, transmission control, traffic shaping, prioritization, load balancing, multipathing, and traffic scheduling. [19] discusses data center network infrastructure and operations. [20] surveys resource management techniques and categories depending on the resource granularity: virtual machines, physical machines and applicatios. [21] presents cluster frameworks for scheduling in data centers at the application, network and switch level.
Our survey presents a network measurement-based perspective on resource allocation and control in data centers, and it distinguishes itself from earlier surveys from the following perspectives:
-
•
We focus on network measurement and how measurement systems are used for resource allocation and control mechanisms.
-
•
We discuss the state-of-the-art across different areas (network measurement, data centers network and applications, network monitoring systems, cluster scheduling) to highlight the synergies between these areas and show how these areas fit together to improve application performance in data centers by leveraging network monitoring information.
-
•
We analyze the literature and we identify gaps across different areas, which can only be solved by taking a holistic approach across the data center management stack.
III Network measurement 101
III-A Network measurement definitions
Before looking into measurement techniques, we give a brief overview of traffic properties which are usually measured, as presented in [22]. Packet delay is an additive metric and is the sum of routing delay (time spent inside a router), transmission delay (time needed to put a packet onto a link) and propagation delay (time needed by a packet to traverse the link from one end to another). Further, the routing delay can be decomposed into packet processing delay (time to determine the output port for the packet), queueing delay (time spent waiting in router’s output queues) and other additional delay, such as marshalling and unmarshalling. The queueing delay can be seen as a measure of congestion on the output link. Another property is the rate of packet loss: the phenomenon which occurs when a network device drops the packet due to congestion, or because the packet is identified corrupted and then dropped. Throughput is the rate at which traffic flows through the network and is measured in bits per time unit. Packet jitter represents the variability of packet interarrival time. An important property for application performance is goodput, which is the rate at which the application endpoint successfully receives data. There are other properties that can be used to characterise the traffic: time series of byte counts (to quantify the workload represented by traffic), and the distribution of packet sizes encountered. Another property is the ON/OFF activity in network traffic (ON state represents activity, OFF state means silence). The activity can be viewed at three different levels: the packets themselves are an ON/OFF process, packets form trains from a source to a destination (defined by a given interarrival threshold), and a collection of trains form a session. A flow can be defined as a set of packets having the same predefined properties, and that are exchanged between two endpoints.
There are two types of measurement methods: active and passive methods [22]. Active measurement methods imply injecting additional packets into the network and observing their behaviour. The best known active measurement tools are ping and traceroute (see Table I). Network latency from a source host to a destination host is often measured as Round-Trip Time (RTT) using ping. A disadvantage of active methods is that they create additional network load and can thus bias the measurements. On the other hand, passive measurement methods rely solely on observing the traffic without generating additional traffic.
III-B Network monitoring techniques and tools
Table I presents classical network monitoring techniques and tools, and the measurements they offer. One of the most well known method to get network statistics is through the Simple Network Management Protocol (SNMP) counters [23]. The information that can be obtained by polling these counters regularly is the number of bytes received and sent on each interface of the network device or the number of packets received and sent on each interface. Although maintaining these counters does not have a significant performance overhead on the network device, they offer only a course-grained view of the network traffic, because they are limited by the polling interval (typically 300s), and by imprecise timestamps. The timestamp is supplied externally, and it is limited in numerical range, leading to the need to detect roll over. SNMP’s resolution is sufficient for low throughput traffic.
Packet sampling, as used in NetFlow [24], sFlow [25], PSAMP [26], entails capturing only a subset of packets to reduce the number of records [22]. Packet sampling can be done using a constant or variable sampling rate. In the case of constant sampling, there are several possibilities: i) random sampling (packets are sampled with a fixed probability ); ii) deterministic sampling (packets are sampled periodically, meaning every th packet is sampled); iii) stratified sampling (packets are first divided into subsets, and then sampling is applied within each subset). Another type of sampling is trajectory sampling [27, 22]. In this technique, if a packet is selected for sampling at some device in the network, then it will be selected at all the other devices in the network. Amongst the uses of trajectory sampling are obtaining packet delays (important for SLAs), or tracing denial of service attacks.
NetFlow [24] is a standard introduced by Cisco to monitor IP flows, which are usually identified by the tuple (source and destination IP address, source and destination port and protocol number). The active TCP and UDP flows are kept in a cache. When a packet is received at the switch, NetFlow checks to see if the packet pertains to a cached flow by matching on the header fields. If it does, then the associated flow counters are incremented, and if it does not, a new flow entry is created in the cache. For deciding when to send flow records to the collector for analysis, several policies can be configured: i) on a TCP flow completion, which can be detected when seeing a packet with a FIN or RST flag; ii) when a flow has been idle for a configured timeout; iii) if a hard timeout is configured; iv) when the cache is full and an entry must be evicted. Timeouts can be specified at granularity of seconds. Sampled NetFlow [28] can sample in consecutive packets that traverse the switch.
sFlow [25] is a standard implemented in most new switches to provide packet sampling and port counter sampling. For packet sampling, a switch selects in packets on each input port. The sampled packets’ headers are forwarded to a collector along with metadata that includes the sampling rate, the switch ID, the timestamp of capture, the input and output port numbers.
Port mirroring [29] involves copying all packets seen on a switch port to a different switch port for further analysis.
| Tool | Measurement |
|---|---|
| Ping | RTT; packet loss ratio |
| Traceroute | route ’guess’; RTT |
| SNMP [23] | switch port counters |
| NetFlow [24] | flow counters |
| sFlow [25] | packet sampling |
| iperf [30] | throughput |
| Cisco IP SLA [31] | RTT (average); one-way delay; packet loss |
| Port mirroring [29] | copies of all packets from a port |
| NTP [32] | round-trip delay |
| PTP [33] | master-to-slave delay; slave-to-master delay; estimated one-way delay |
IV Data centres 101
IV-A Data centre network architecture
A data center network architecture is comprised of the topology of the network that interconnects the servers, of the switches deployed in the network, of the end-host network configuration and of the communication protocols used. Companies do not reveal full details of their data center architectures, since the performance given by their infrastructure can be an advantage over competitors, especially in the cloud computing business.
Network hardware and topology The most common topology used for data centers is fat tree [34], which is based on Clos networks [35]. Clos networks, originally designed for telephone circuit switches, are multi-stage circuit-switching networks, with three stages: the ingress stage, the middle stage, and the egress stage. Clos networks are strict-sense non-blocking networks, meaning that any input can be connected to an unused output without having to rearrange existing connections. Fat trees, on the other hand, are rearrangeable non-blocking networks, meaning that with a certain arrangement of the connections, any input can be connected with any unused output. An important feature of a network topology is the bisection bandwidth. The bisection bandwidth of a network is the bandwidth available between the two partitions when the network is partitioned in half. Full bisection bandwidth means that any input can communicate with any unused output at full line-rate. Non-blocking networks provide full bisection bandwidth. The edge of the network is usually oversubscribed. Fat tree topologies can offer full bisection bandwidth, but it may be difficult to achieve this while also avoiding packet reordering in TCP flows [34].
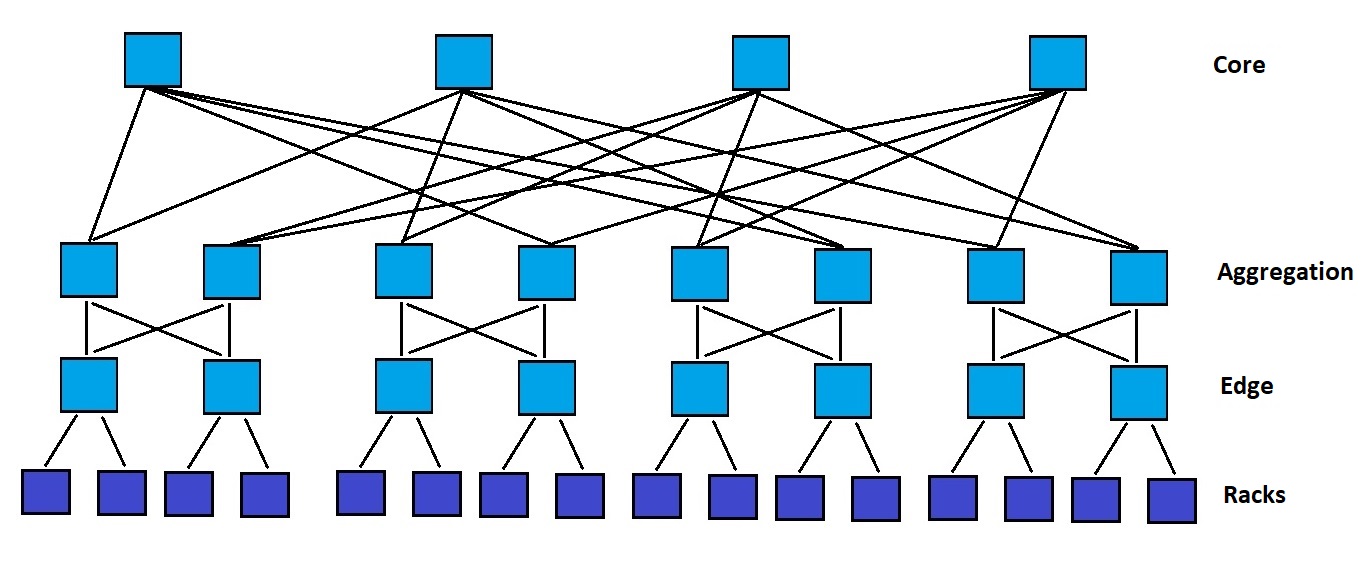
Google [36], Microsoft [37] and Facebook [38] data center network topologies follow the fat tree design. A -ary fat tree, shown in Figure 1, has layers of -port switches: core (the top layer), aggregation (the middle layer) and edge (the lowest layer, which is connected to the host layer). The hosts are grouped into racks, and are connected to edge switches, called Top-of-Rack (ToR) switches. The fat tree has pods, and a pod contains two layers of switches, each layer having switches, and hosts. A -port switch from the edge layer is connected to hosts and to switches from the aggregation layer. The fat tree topology has core switches. A -port core switch is connected to every pod, having its -th port connected to the -th pod such that an aggregation switch is connected to consecutive core switches. The fat tree topology provides multiple equal cost paths between every two hosts. Switches use Equal Cost Multipath routing (ECMP) [39] to decide on which of the equal cost paths a flow should be sent. ECMP hashes the 5-tuple (IP source and destination address, source and destination port and protocol ID) of a packet, and based on the hash determines which path the flow will take.
The Google [36] network has evolved over the years. Google develops their own switches using Gb/s merchant silicon. In the Jupiter network, a ToR switch has Gb/s connections to hosts in the rack and Gb/s to the aggregation switches. Four such switches form a Middle Block (MB), which serves as building block in the aggregation block. The logical topology of an MB is a 2-stage blocking network, with Gb/s connections to ToRs and Gb/s connections to the spine. Each ToR connects to eight MBs with dual redundant Gb/s links. An aggregation block has Gb/s or Gb/s links towards the spine blocks. A spine block has six switches with Gb/s ports to the aggregation blocks. There are 64 aggregation blocks.
The Facebook data center architecture [38] has four planes of spine (core) switches. Each plane can accommodate up to spine switches. Each fabric (aggregation) switch of each pod connects to each spine switch within its plane. A pod has 48 server racks, with each pod being served by four fabric switches, one from every plane. A rack can have up to hosts. Each ToR has Gbs/s uplinks. End-host have 10Gb/s connections. There is a 4:1 fabric oversubscription from rack to rack, with spine switches per plane. Facebook also develops their own switches.
VL2 [37] is a 3-tier architecture where the core tier and the aggregation tier form a folded Clos topology. Other proposed data center network designs include Dcell [40], BCube [41], CamCube [42], Jellyfish [43], Xpander [44]. BCube [41] is a data center network architecture based on a hyper-cube topology. Jellyfish [43] is a random graph topology designed to support easy incremental expansion of the data center.
Hardware resource disaggregation is an emerging trend that will see the traditional rack replaced by pools of different resources (CPU, DRAM, disk) [45, 46, 47] communicating over a high-speed network. This architecture presents several benefits: improved resource utilisation, failure isolation, and flexibility in adding or removing resources.
Network protocols The data center protocol stack is based on the traditional TCP/IP stack, but it has evolved to deal with the challenges inherent to this type of environment: scale, cost, competing demands of applications (high throughput vs. low latency), unpredictable network traffic patterns. Most of the data center operators today are using IP version 4 (IPv4) within their networks. Facebook uses only IP version 6 (IPv6) in their internal networks.
Traditional broadcast mechanisms such as Address Resolution Protocol (ARP) [48] do not scale in data centers [37, 49]. To solve this issue, data centers are managed via IP layer routing protocols, such as the Border Gateway Protocol (BGP) [50]. For example, Facebook uses BGP4, which is complemented by a centralised BGP controller that is able to override routing paths. Google developed its own protocol, named FirePath [36], which is a custom Interior Gateway Protocol (IGP). FirePath implements a centralised topology state distribution, and a distributed forwarding table computation. Microsoft’s data center protocol is thought to be similar to that of VL2 [37]: traffic originating from the edge switches is forwarded first to a randomly selected intermediate switch and then to the actual destination.
TCP’s congestion control algorithm is not optimal for environments which have the characteristics of a data center network (high-bandwidth, low latency). Consequently, TCP’s performance suffers because of different issues, such as incast, bursty packet drops, and large queue buildup [51]. Thus, different TCP variants customised for data centers were developed over the years [51, 52, 53]. The first such transport protocol variant was DCTCP [51]. DCTCP signals queue buildup earlier on through the use of the Explicit Congestion Notification (ECN) feature supported by certain switches. Source end-hosts estimate the fraction of packets marked through ECN, and deduce the amount of congestion. Google’s data centers run a variant of DCTCP [36].
Moreover, clean slate designs have been proposed in this space [7, 10]. Fastpass [7] is a centralised packet scheduler that aims to reduce in-network queueing. It proposes a timeslot allocation algorithm to determine when each packet is sent, along with a path assignment algorithm for each packet. Fastpass moves the queueing at end-hosts. NDP [10] is a radically different approach that requires a new end-host stack and new switches. It uses switches with small buffers. The senders send a full window from the start, with no initial handshake. When congestion occurs, the switches trim packets, removing their payload. The headers are sent to notify the receiver of which senders wish to send to it. Then, the receivers pull data from the senders who want to send to them, since the receivers have received the headers and know from whom to expect data.
IV-B Data centre applications
A key role in the data center ecosystem is played by the applications that produce network traffic. Due to the scale of the input data and of the user demands, data center applications are distributed. Data centre applications can be split in the following categories:
- •
- •
-
•
Applications serving users’ needs: data processing frameworks (MapReduce [60] style processing, graph processing (e.g., Apache Giraph [61], Pregel [62]), stream processing (e.g., Apache Storm [63]), machine learning analytics (e.g., Tensorflow [64]), Web traffic [65], search engine and social network backends. In addition to these, tenant applications running in VMs, which can be any of the previous applications or custom applications, have to be mentioned.
There are two aspects of the applications that are important for determining their networking requirements: the communication pattern of the application (which can be mapped to the underlying network) and the properties of representative workloads.
Communication patterns The most common communication patterns [66, 67] are MapReduce [60], partition-aggregate (search engine and social networks backend) [51, 67, 66], dependent-sequential (constructing a user’s home page in a social networking application) [67], star-like (machine learning parameter server [68]), and Bulk Synchronous Parallel (BSP) (e.g., Pregel [62]). In the MapReduce [60, 69] pattern, a mapper reads its input from the distributed file system, performs computations on the input read and then writes its intermediate result to disk. A reducer reads the intermediate result from different mappers (the shuffle phase), performs computations on the data, and writes the output to the distributed file system. In the shuffle phase there are flows if there are mappers and reducers, and at least flows for writing the final results.
In the partition-aggregation pattern [51, 67], in order to provide an answer to a request received from a user, several responses from workers need to be aggregated. The aggregation tree can have multiple levels, with the leafs being the workers and the root being the final aggregator. The dependent-sequential pattern [67] entails that the next request is dependent on the previous request’s results. These patterns are common in applications such as Web search and social network content backends.
A Bulk Synchronous Parallel (BSP) computation, named superstep, consists of concurrent computation, communication between worker processes, and barrier synchronisation. This pattern is common in graph processing frameworks [62, 61].
Machine learning (ML) applications represent a common workload for data centers [70, 64]. In general, an ML application fits a model to input data, and requires multiple iterations until the model’s parameters convergence. Due to the huge amount of input data that has to be processed, ML frameworks have a distributed architecture [68, 69, 71, 72, 64]. A machine learning framework usually has server nodes that store the globally shared parameters (parameter servers), and worker nodes that do local computations on their part of data or of the model, depending on the chosen approach. In a data parallel approach, the input data is partitioned across the machines and the ML model is shared. In a model parallel approach, the ML model is partitioned across the machines and the input data is shared. In the data parallel approach, each worker node can read and update all the model parameters, while in the model parallel approach, each worker node can access and update only its model parameter partition. In this context, the network plays an important role due to the inherent synchronisation between worker nodes and server nodes to update the model. If the computation is synchronous, after each iteration, the parameter serves aggregate the parameters from the workers. For example, if one of the workers is unreachable over the network or is slow to reply, the overall training time increases due to the wait for that worker’s parameter updates. To lessen the importance of communication latency to the completion time of the training, some frameworks [64, 71] use asynchronous communication, or bounded staleness synchronisation [72], where a certain degree of staleness in the parameters (meaning using parameters from previous iterations) is tolerated, but this can potentially lead to slower converge of the model [71].
Workloads There are a few studies which analyse the workloads of some data centre applications. One such study is the analysis and modelling of Memcached workloads based on data provided by Facebook [73]. The authors describe an analytical model that can be used to generate synthetic workloads whose properties are similar to the real world workloads, and which is implemented in the Mutilate load generator [74]. MapReduce workloads from Facebook and Cloudera are discussed in [75], providing insights about job size, storage access patterns, and cluster load. ML applications usually can be tested with well-known datasets, e.g., MNIST dataset [76] for handwritten digit recognition, ImageNet [77] dataset for image classification tasks.
V Data centre network traffic characteristics
Data centres network traffic characteristics are seen as sensitive information by companies, as they could reveal details about their network infrastructure to their competitors. As such, there is little information available on this topic. Still, there are three main studies [78, 79, 80] which shed some light on this matter. Additionally, several papers [37, 51, 81, 82, 83] (see Table II and Table III) present limited measurement studies from different data centres.
| Study | Data centre | Duration | Workload | Measurements | Flow sizes |
|---|---|---|---|---|---|
| [79] | 10 data centres (3 university data centers, 2 private enterprise data centers, 5 commercial cloud data centers) | several weeks | Web services, MapReduce, file storage, authentication, business applications, custom software applications, email and messaging |
• network topology;
• packet traces from switches; • SNMP |
• 80% of the flows are smaller than 10KB in size.
• 80% of flows are less than 11 seconds long. |
| [78] | 1500 servers | 1 PB of measurement data |
• MapReduce style jobs;
• Cosmos distributed file system |
• socket level logs;
• user application logs; |
• most flows are short, 80% of the flows lasting less than 10s
• only less than 0.1% last longer than 200s • more than half of the bytes are found in flows that last less than 25s |
| [37] | 1500 node cluster | - | data mining on petabytes of data |
• SNMP
• NetFlow |
• 99% of flows are smaller than 100MB
• 90% of bytes are in flows whose lengths are between 100MB and 1 GB |
| [51] | 6000 servers in over 150 racks | 1 month; 150 TB | web search and other services |
• socket level logs;
• packet level logs; • application level logs |
• most background flows are small, but most of the bytes in
background traffic come from large flows
|
| [83] |
• pre-production cluster with O(1K) servers running Dryad (Cosmos)
• production cluster with O(10K) servers where the web search index is stored and where search results are assembled (IndexSrv) |
hours and terabytes of data |
• a data mining workload for a large web search engine + jobs which are
a mix of repetitive production scripts (e.g., hourly summaries) and
jobs submitted by users
• web search (latency sensitive) |
estimate demand matrices and determine hotspot occurrence and predictability
|
• medium-sized flows |
| [81] |
IBM Global Services
• DC 1: VMs • DC 2: VMs |
days | - |
latency measurements between each two servers;
TCP incoming/outgoing connections |
- |
| [80] | Facebook data centres | brief periods of time | Web services, MapReduce, MySQL, caching |
• sampled traffic;
• packet traces from switches; • packet traces from host |
• Hadoop flows are short;
• for other type of applications, flows are long-lived, internally bursty and do not carry a significant number of bytes. |
Benson et al. [79] present a study of the network traffic characteristics of 10 data centres (3 university data centers, 2 private enterprise data centers, 5 commercial cloud data centers). The data sets used in characterising the network traffic are the following: network topology, packet traces from switches and SNMP polls. The data was collected over several weeks. There are several important findings. Firstly, perhaps predictably, the applications that run in the data centers depend on the organisation. There is a wide range of applications in each data center: Web services, MapReduce, file storage, authentication, business applications, custom software applications, email and messaging. Secondly, there are important findings regarding flow sizes and interarrival times, as well as traffic locality. The number of active flows per second is under 10,000 per rack. 80% of the flows are smaller than 10KB in size. 80% of the flows have interarrival times of less than 1 in private enterprise data centers, while 80% of the flows in university data centers and in most data centers have interarrival times between 4-40. 80% of flows are less than 11s long. Traffic originating from a rack has an ON/OFF pattern with properties that fit heavy-tailed distributions, and traffic that leaves the edge switches is bursty. In cloud data centers, 80% of the traffic coming from servers stays within the rack, because administrators colocate dependent applications, whereas in the case of university and private enterprise data centres 40-90% of the traffic leaves the rack. Link utilisation is higher in the core layer, while the edge layer is lightly utilised. A maximum of 25% of the core links are highly utilised (hot-spots). Losses are not correlated with high link utilisation, but are due to temporary bursts. Lastly, time of day/week influences link utilisation, especially in the core, and to a moderate degree in the other levels of the data center.
The second main study about data centre traffic is [78]. Over 1 PB of measurement data was collected from 1,500 servers. The workloads were MapReduce style jobs using the Cosmos distributed file system. The servers were instrumented, and then socket level logs were collected along with user application logs. Similarly to the characteristics found in [79] for cloud data centers, jobs that require high bandwidth are placed near each other (on the same server, in the same rack, in the same VLAN) by the internal placement algorithm. Regarding traffic locality, the paper observes that there is a probability of 89% that servers within the same rack do not exchange traffic and 99.5% in the case of servers in different racks. Regarding congestion, 86% of the links have congestion periods of at least 10s, while 15% of the links have congestion periods of at least 100s. Over 90% of the congestion periods are less than 2s, but more than 1s. Regarding flow sizes, like the previous study [79], most flows were short, 80% of the flows lasting less than 10s. Less than 0.1% last longer than 200s. However, more than half of the bytes are found in flows that last less than 25s. Another observation is that there is significant variability in the traffic matrix, both in magnitude and in the pairs of servers which exchange data. Even if the total traffic exchanged remains the same, the pairs of servers involved in this exchange change considerably. Moreover, the traffic experiences periodic short-term bursts, with the interarrival time 15 at servers and ToR switches. The median arrival rate of all flows is 100 flows/ms. Lastly, there was no evidence of incast in the cluster.
| Study | Concurrent flows | Interarrival times | Link utilisation | Communication between servers | Other |
|---|---|---|---|---|---|
| [79] |
• the number of active flows per second is under 10,000 per rack
|
• 80% of the flows have interarrival times of less than 1 ms in private enterprise DCs
• 80% of the flows in university DCs and in most DCs have interarrival times between 4-40. • traffic originating from a rack has an ON/OFF pattern with properties that fit heavy-tailed distributions • traffic that leaves the edge switches is bursty. |
• link utilisation is higher in the core, while the edge is lightly utilised
• a maximum of 25% of the core links are highly utilized (hot-spots) • losses are not correlated with link high utilisation, but are due to temporary bursts. |
• in cloud data centres, 80% of the traffic coming from servers stays within the rack
• in the case of university and private enterprise data centres 40%-90% of the traffic leaves the rack. |
• time of day/week influences link utilisation especially in the core and moderate in the other levels of the DC. |
| [78] | - |
• periodic short-term bursts
• interarrival time 15 at servers and ToR switches • the median arrival rate of all flows is 100 flows/ms |
• 86% of the links have congestion periods of at least 10 seconds
• 15% of the links have congestion periods of at least 100 seconds • over 90% of the congestion periods are less than 2 seconds and more than 1 second. |
• jobs requiring high bandwidth are placed near each other (on the same server, in the same rack, in the same VLAN)
• probability of 89% that servers within the same rack do not exchange traffic and 99.5% in the case of servers in different racks. |
• significant variability in the traffic matrix, both in magnitude and in the pairs of servers which exchange data
• no evidence of incast |
| [37] | - |
• a machine has 50% of the time about 10 concurrent flows
|
- | - | • lack of traffic predictability, no stable traffic matrix |
| [51] |
• median number of concurrent flows per server is 36
• 99.99th percentile number of concurrent flows per server is more than 1600 |
• the variance in interarrival time is very high, with a very heavy
tail; spikes occur; large number of outgoing flows happen periodically
|
- | - |
• division between query traffic (latency critical) and background traffic
|
| [83] | - | - |
• only a few ToR pairs send or receive a large volume of traffic
• these ToRs exchange much of their data with few of the other ToRs • over 60% of the demand matrices have fewer than 10% of their links hot at any time • hot links are associated with a high fan-in (or fan-out) • fewer than 10% of hot links repeat |
- | - |
| [81] |
• 80% of VMs have average traffic rate (over two-week period) less than 800 KBytes/min
• 4% of VMs have average traffic rate (over two-week period) 8000KBytes/min |
- | - | - |
• overall stable per-VM traffic at large timescales ( min) for more than 82% of the VMs
• weak correlation between traffic rate and latency |
| [80] |
• Web servers and cache servers have 100s to 1000s of concurrent connections;
• Hadoop nodes have 25 concurrent connections on average; |
• median flow interarrival times are 2ms for Hadoop;
• median flow interarrival times are 3ms and 8ms for cache leaders and followers; |
• between hosts and the ToR is quite low;
• the median utilisation between the ToR and aggregation switches is between 10-20% across clusters; • between the aggregation and core switches the utilisation is even higher; • load varies significantly between clusters; |
• cache followers and leaders communicate
with 175-350 different racks concurrently;
• Web servers communicate with 10-125 racks concurrently; • most of the traffic is destined to only a few 10s of racks; |
• load balancing is effective;
• traffic demands are stable over intervals as long as 10 seconds; • heavy hitters’ sizes are not much larger than the median flow sizes, and they change rapidly; • packet sizes are small, median length for non-Hadoop traffic 200 bytes. |
The most recent study is on Facebook’s data center network traffic characteristics [80]. The data was collected using Fbflow (an internal monitoring system that samples packet headers with a sampling rate of 1:), through port mirroring on the ToR, and mirroring of all traffic from one server. The traffic is one of the following: Web, MapReduce, MySQL, or traffic served from cache servers (leader and follower). Network traffic characteristics regarding flow sizes and traffic locality for Hadoop jobs are similar to the ones found by the previously mentioned studies. However, the traffic patterns for the other types of applications differ substantially from the ones described in [78, 79]. The majority of traffic is intra-cluster (57.5%, from caching follower servers), with only 12.9% intra-rack. Also, there is a significant portion of intra-datacentre and inter-datacentre traffic, in particular from the caching leader servers. The Hadoop traffic is more rack-local than other types of applications. Frontend traffic has minimal rack-local traffic, but significant intra-cluster traffic. Overall, the locality patterns are stable over time periods ranging from seconds to days. Regarding flow sizes, most Hadoop flows are short, while for the other types of services, they are long-lived, but internally bursty and do not carry a significant number of bytes. Cache flows are larger than Hadoop flows, and Web server flows are between the two. Facebook’s use of load balancing is effective. It distributes the traffic across hosts, except in the case of Hadoop servers, which see jobs of different sizes, and traffic demands are quite stable over sub-second intervals. Consequently, heavy hitters’ sizes are not much larger than the median flow sizes, and they change rapidly, making it hard to predict them. Packet sizes are small, median length for non-Hadoop traffic being less than 200 bytes, while for Hadoop the distribution is bimodal (1500 bytes or TCP ACKs size). The traffic does not exhibit ON/OFF arrival behaviour, unlike the traffic in the previous studies [78, 79]. Web servers and cache servers have 100s to 1,000s of concurrent connections, while Hadoop nodes have 25 concurrent connections on average, similar to the values reported in [78]. Median flow interarrival times are 2 for Hadoop, and 3 and 8 for cache leaders and followers respectively. Cache followers and leaders communicate with 175-350 different racks concurrently, while Web servers communicate with 10-125 racks. However, most of the traffic is destined to only a few 10s of racks. Link utilisation on links between hosts and the ToR is quite low, with the average 1-minute link utilisation less than 1%. Load varies significantly between clusters, a Hadoop cluster being five times more loaded than a Frontend cluster. The median utilisation between the ToR and aggregation switches is between 10-20% across clusters. At this level, the difference between clusters is not as significant as in the previous case, with the most loaded clusters being three times more loaded than the lightly loaded ones. Between the aggregation and core switches the utilisation is even higher.
Lessons Learned: To sum up, data center traffic characteristics depend on the type of applications deployed, e.g., Hadoop, Web, caches, on diurnal patterns, and on the data center operators’ strategies for application placement and load balancing.
VI Cluster workloads in data centers
We start by defining common terms used in the cluster scheduling literature. An application is called a job. A job may have multiple tasks. A task is an application instance of the job represented by one or multiple processes that run inside a container or virtual machine, usually on a single core. The tasks of a job must be placed on the available machines. A cluster scheduler decides on which machines to place the tasks of the jobs. Cluster scheduling in its simplest form is bin-packing of tasks on the available machines. However, this simple allocation mechanism might not yield the optimal performance for applications due to lack of adequate resources, or possible interference between tasks that share the underlying host hardware and network. These issues can be solved by respecting the job’s resource demands or by defining placement constraints. Resource demands usually comprise the number of cores, the amount of memory, disk throughput, or network bandwidth that a task needs. Placement constraints can be defined to avoid colocation between tasks that might interfere, or to allocate a task to a machine with certain characteristics. Solving these issues has given rise to a large body of work on how to best map job demands and constraints to job allocation systems.
We next discuss the characteristics of the main cluster workloads released by companies in the past years [84, 85, 86].
Google workload The most well-known cluster trace is from Google [84]. It is a 2011 cluster trace from a machines cluster. The Google workload is a 29-day trace of jobs that run on bare-metal hosts. Task runtimes are not uniform, with % of tasks running for less than 12 minutes [86]. A similar observation can be done with regards to task resource requests, where % of the smallest jobs request 16 CPU cores or fewer [86]. The trace has sub-second job interarrival times. An updated trace from 2019 was released [87]. The authors compare the two traces, finding that the workload arrival rate has increased, with the job submission rate times higher than in 2011. The workload mix has also changed, with jobs having moved from the free tier to the best-effort batch tier. The workload continues to exhibit a heavy-tailed distribution where the top 1% use up over 99% of resources. Microsoft Azure workload The Microsoft Azure VM workload [85] is the first of its kind publicly released. It spans three months, and it includes first-party workloads (internal VMs and first-party services offered to third-party customers), and third-party workloads (VMs created by external customers). More than % of VMs run for less than a day, and a small percentage of long-running VMs use up more than % of the total core hours. In terms of VM core count, almost % of VMs have a maximum of two cores, with almost % of VMs using only one core. In terms of memory, % of VMs use less than GBytes. In terms of deployment sizes, around % have a single VM and % have at most VMs. Regarding VM workloads, % of core hours are categorised as delay-insensitive (batch workloads, internal workloads), and around % are interactive, while the remaining % are not categorised. The VM arrival times are bursty and diurnal, and there are less VMs running during the weekend.
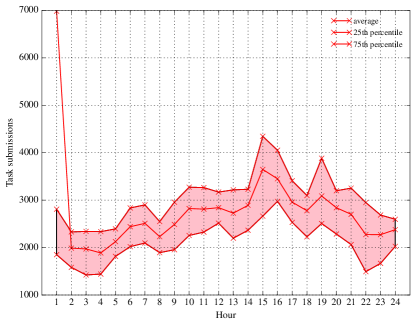
Both Google and Azure workloads have a high number of tasks placed (more than 140K tasks) at the beginning of the trace (timestamp 0) to setup the cluster state. Afterwards, the average number of task arrivals per hour is between 1800-3500 for the Azure trace (Figure 2), and 40K-70K for the Google trace [86].
Two Sigma and Los Alamos National Laboratory workloads These traces share some of the characteristics of the Google workload. They have sub-second job interarrival times, requiring sub-second scheduling decisions. On the other hand, they display diurnal patterns in job submissions, similar to the Microsoft Azure workload, but not present in the Google workload. While most of the jobs have short durations and request a small number of cores in the Google workload, this is not true for the Two Sigma and LANL traces. The median Google job is times shorter, and requests fewer CPU cores. Similarly, most of the VM deployments in the Microsoft Azure workload are small, with % of VMs having a maximum of two cores. Regarding job duration, % of Google jobs are less than 12 minutes, whereas in the other traces the same fraction of jobs are several hours long (2-6 hours). The Google workload has a long tail, with some jobs running for at least the duration of the whole trace.
Lessons Learned: A commonality of the cluster workloads released is that they do not include information related to networking demands, e.g., network bandwidth, or how latency-sensitive the application is. The closest that is available is the Microsoft Azure workload, which mentions which VM workload is interactive. Still, this information is insufficient, since it does not offer a quantifiable metric, e.g., what is the job’s SLO. Therefore, this lack of information represents a challenge when developing new cluster scheduling policies that try to improve application performance while considering networking demands.
VII Network monitoring systems
Table IV summarizes the network monitoring systems presented in this section.
VII-A Network monitoring in SDN-enabled networks
Software Defined Networking (SDN) is a paradigm in which the control plane is separated from the data forwarding plane, enabling the centralisation of network control and offering the possibility of programming the network. The control plane is represented by a controller and the data plane consists of networking devices, such as switches and routers. This separation is made possible by a programming interface, which allows the controller to communicate with the forwarding devices, for example to install forwarding rules at switches. OpenFlow [88] is the most popular such application programming interface (API). In an OpenFlow network, the controller can collect statistics about the flows (duration, number of packets, number of bytes) by polling the switches. These statistics can be either per-flow values or aggregates across multiple flows that match a rule. SDN monitoring tools use flow events that the controller receives and the statistics collected by the controller. We discuss several such tools in the following paragraphs.
OpenTM [89] is a traffic matrix (TM) estimator for OpenFlow networks. It determines the current active flows in the network based on flow initiation and termination events. OpenTM uses routing information from the OpenFlow controller to discover the flow paths, and then it periodically polls switches on the flow path, obtaining byte and packet counters. OpenTM assumes that all the packets of a flow follow the same path in the network.
FlowSense [90] is a monitoring tool that uses OpenFlow control messages to determine average link utilisation in OpenFlow-enabled networks. When a flow expires, the controller receives information about the duration and size of that flow. The link utilisation is computed only at certain times, e.g., when all the flows on a link have expired. In the case of long flows, or if rules have large timeouts, the link utilisation is rarely computed. While the FlowSense approach does not present any overhead in terms of additional messages injected in the network, the delay between obtaining average link utilisation estimates can be 10 seconds with 90% accuracy. Given these limitations, an adaptive monitoring method was proposed in PayLess [91], which additionally polls the switches. In doing so, it obtains flow statistics more often than FlowSense, which gathered statistics only when a flow terminated.
DREAM [92] is a network-wide measurement architecture that uses OpenFlow to coordinate the measurement devices. DREAM implements an algorithm for allocating switch memory resources depending on the measurement task needs, traffic and expected accuracy, multiplexing the resources both temporally and spatially.
OpenSketch [93] is a measurement architecture inspired by the software-defined networking paradigm, dubbed software-defined traffic measurement. In the switch data plane, a packet goes through basic blocks: hashing (certain packet fields are hashed), classification (matching on fields according to predefined rules), and counting (gathering statistics). The control plane manages the data plane, and configures the measurement tasks according to available resources. OpenSketch uses sketches, data structures from streaming algorithms, to store information about packets. Sketches have two main advantages compared to flow-based counters: low memory usage and the possibility of setting the desired accuracy in relation to the memory used.
SLAM [94] is a latency monitoring framework for SDN-enabled data centers. It sends probe packets to trigger control messages from the first and the last switch of a network path. Based on the arrival times at the controller of the control messages, it computes a latency distribution for that network path, being able to detect increases in latency of tens of milliseconds.
Lessons Learned: The information and the granularity provided by OpenFlow counters is limited, hence other approaches sought to use known ways of acquiring statistics from the network (e.g., sampling [95], port mirroring [96]). Still, SDN monitoring has some benefits. It offers the possibility of greater control and reduced human overhead for configuring each switch individually to collect network statistics. Another benefit of SDN for monitoring is the centralised view of the network, which allows for a better allocation of network resources [92] to gather data. Also, the centralised view can help in reducing the collection of redundant data (e.g., the same flow being sampled at several places in the network). These aspects are exploited in some network monitoring frameworks for data centres.
| Study | Measurement techniques | Measurement task |
|---|---|---|
| OpenTM [89] | OpenFlow | traffic matrix |
| FlowSense [90], PayLess [91] | OpenFlow | link utilization |
| SLAM [94] | OpenFlow | path latency |
| DREAM [92] | OpenFlow | heavy hitter detection, hierarchical heavy hitter detection, anomaly detection |
| OpenSketch [93] | FPGA | heavy hitters, superspreader/DDoS, traffic changes detection, flow size distribution, count traffic |
| NetNORAD [97] | UDP probes | RTT; packet loss |
| Everflow [98] | TCP probes | RTT |
| Pingmesh [99] | TCP probes | RTT; packet drops |
| VNET Pingmesh [14] | TCP probes | RTT |
| PTPmesh [100, 101, 102] | UDP probes | one-way delay; packet loss |
| UnivMon [103], ElasticSketch [104], SketchLearn [105], NitroSketch [106], CocoSketch [107], HashPipe [108], ElasticTrie [109, 110], FlowRadar [111] | Programmable switches | heavy hitters, change detection, DDoS, flow size distribution, flow size estimation |
| Marple [112], LossRadar [113] | Programmable switches | packet loss; packet latency per flow |
| In-band Network Telemetry (INT) [114], PINT [115] | Programmable switches | path latency |
VII-B Data centre network monitoring systems
A data center network monitoring system needs to not use many resources (both at the servers and in-network), should be always-on and it should be able to monitor the whole network in a scalable manner. Large-scale data center monitoring systems, such as NetNORAD [97], Everflow [98], Pingmesh [99], VNET Pingmesh [14], have been deployed by cloud providers in their data centers. NetNORAD [97] is a system used in Facebook’s data centers to measure RTT and packet loss ratio, and uses ping between servers. Everflow [98] is a system that monitors control packets and special TCP packets (TCP SYN, FIN, RST). Additionally, it supports guided probing by injecting custom packets, which are used to measure link RTTs. Pingmesh [99] is a system that runs RTT measurements between every two servers in data centers, and it measures inter-server latencies at three levels: Top-of-Rack switch, intra data center and inter data center. Also, the system reports the packet drop rate, which is inferred based on the TCP connection setup time. VNET Pingmesh [14] monitors latency for tenant virtual networks (VNETs), with the TCP probes being sent from the virtual switch at the end-host. PTPmesh [100, 101, 102] is a cloud monitoring tool that uses the Precision Time Protocol (PTP) statistics to infer the one-way delay and packet loss in data centers.
Fault localisation A common goal of most of these large scale measurement systems is fault localisation. For example, NetNORAD is used in conjuction with fbtracert [97], which traces multiple paths between two endpoints in the network in parallel to determine the location of the fault. Pingmesh is used to detect switch silent packet drops. NetPoirot [116] presents a classification algorithm that identifies the root cause of failures using TCP statistics collected at one of the endpoints. The work in [117] looks from the end-host to identify the faulty links and switches, by correlating anomalies in end-host statistics with the network path of the packets. 007 [118] tracks the path of TCP connections that display retransmissions through traceroute, and identifies the links with the most retransmissions as the faulty ones. PathDump [119] traces packets through data center networks, and can report poor TCP performance when the number of consecutive packet retransmissions is above a certain threshold for a flow. [120] presents a sampling framework which can poll a subset of switch counters at microsecond-level granularity to determine microbursts in data centers.
Programmable data planes The monitoring approaches that use SDN presented in VII-A do not have the granularity necessary for data centres. This drawback lead to the increasing use of programmable switches [121] for monitoring tasks [111, 113, 103, 114, 109, 110, 108, 104, 105, 122, 106, 107]. FlowRadar [111] keeps track of all the flows in the network with their associated counters, and exports this information periodically to a remote collector, which ultimately uses them for different monitoring applications targeted to datacenters. UnivMon [103], ElasticSketch [104], SketchLearn [105], NitroSketch [106] and CocoSketch [107] use sketch-based data structures in the dataplane to record network traffic statistics that are exported at fixed time intervals to the control plane that processes them to perform different measurement tasks. HashPipe [108] and ElasticTrie [109, 110] focus on determining the largest flows (heavy hitters). Sonata [122] proposes a query interface for network telemetry, uses sketches in the dataplane, and the controller zooms-in the network traffic of interest by refining the network query. In-band Network Telemetry (INT) [114] measures the end-to-end latency between virtual switches, by appending the switch per-hop latency to the packet that traverses the network path between the two virtual switches. The end-to-end latency is computed by adding the per-hop latencies, while the propagation delays are considered negligible. PINT [115] is also an in-band network telemetry framework, but it bounds the amount of measurement information added to each packet by enconding it across multiple packets. PINT can compute tail latencies and can help applications such as path tracing and congestion control. LossRadar [113] detects packet losses in data centers within tens of milliseconds, and it reports the 5-tuple flow identifiers and the switches where these losses were detected. Marple [112] uses a programmable key-value store implementation on switches for measurements such as packet loss per connection, packet latencies per flow, or determining packets that have high end-to end-queueing latency.
Lessons Learned: Programmable switches offer high-speed, complex monitoring and fault localisation functions. The network monitoring information can be leveraged further for resource allocation and control. One drawback is that legacy switches have to be replaced with programmable switches to be able to take advantage of this rich set of monitoring functions, and this can be costly in the short-term for companies. On the other hand, simple network monitoring techniques such as active probing and end-host and legacy switches statistics coupled with SDN can still provide benefits to data center operators.
VIII Cluster scheduling
Most of the cluster schedulers take into account any other constraints but those related to networking requirements or the state of the network. These constraints generally represent the needs of a job with respect to the number of cores, CPU utilisation, memory, affinity with other tasks, data locality, placement constrains, and low placement latency. We call these cluster schedulers conventional. Network-aware cluster schedulers try to ensure tail latency and bandwidth guarantees, incorporating such constraints in their placement algorithms. Recently, ML-driven cluster schedulers have been proposed, however their current algorithms do not consider networking monitoring data or resources as an input. We discuss these categories in the next sections.
VIII-A Conventional cluster schedulers
In Section VIII-A, we discuss the features of the most important conventional cluster schedulers. Gog [123] and Schwarzkopf [124] identify the most important features of cluster schedulers: architecture, multi-dimensional resource allocation, resource allocation and dynamic adjustment, task interference, constraint handling, data locality and low placement latency.
Scheduler architecture There are several types of cluster scheduler architectures.
Centralised schedulers, such as Borg [56], Bistro [125], Quincy [126], Firmament [127], TetriSched [128], have the advantage of having access to all of the information related to the cluster’s state (e.g., where the tasks are running, which tasks should be scheduled, and which machines have free cores). Consequently, these schedulers compute high-quality task placements. On the other hand, task placement latency can be significant because the computation delay grows in proportion to the cluster size [126]. Significant task placement latency can be detrimental for short-running tasks that might end up waiting to be scheduled for a time greater than their actual duration.
Distributed schedulers (Apollo [129], Sparrow [130]) can solve this issue, but since they do not have the full view of the cluster state, they trade off high-quality task placements for lower task placement latency.
Hybrid schedulers’ architecture is comprised of a centralised scheduler and one or more distributed schedulers. Examples of hybrid schedulers are Hawk [131], Eagle [132], Mercury [133]. The long-running tasks are usually placed by the centralised scheduler, while the short tasks are placed by the distributed schedulers.
Another architecture is that of two-level schedulers (Mesos [134], YARN [135]), which have an application-level scheduler that maps the tasks to the resource allocations determined by a resource scheduler. For example, the MapReduce jobs are scheduled by YARN’s job manager, while resources are allocated by YARN’s resource manager.
Multi-dimensional resource allocation Nowadays complex data center applications have different resource requirements (section IV-B). Some cluster schedulers [126, 136, 130, 131, 133, 132] allocate the same amount of resources to all tasks regardless of their needs, and this may hurt application performance. Other schedulers [134, 135, 137, 138, 125, 129, 139, 128, 56] support specifying job resource requirements.
Resource allocation and dynamic adjustment In most cases, users can specify their jobs’ resource requirements [56], but often overestimate their requirements [123], or they do not know how much to request [4]. This can be solved in several ways: i) profiling the job before the actual execution [138], ii) decreasing or redistributing the initial resource allocation after an observation period [56, 140], or iii) analysing historical traces of jobs to build a performance model of the expected performance depending on the job resource allocation [136, 141, 142, 143, 144]. Some performance models were developed for specific types of jobs (MapReduce and Dryad in Jockey [136], deep learning jobs in Optimus [144]). Also, techniques such as Bayesian optimisation [143] or non-negative least square [142, 144] have been used to build performance models for different applications.
Task interference To achieve high cluster utilisation, multiple tasks are colocated on each machine. But tasks compete for the same resources (memory, cache, disk, network), and they may then interfere with each other, causing a decrease in application performance. As a consequence, some schedulers (Paragon [145], Quasar [138]) first determine whether the tasks waiting to be scheduled interfere with each other, and only then place the tasks based on the result.
Constraint handling Tasks can have different placement constraints. For example, an application’s performance would benefit from running on a certain type of hardware, e.g., machine learning tasks require specialist hardware such as General Purpose Graphics Processing Units (GPGPUs) or Tensor Processing Units [146] (TPUs). Constraints can be hard (mandatory), soft (not mandatory) or complex (combination of soft and hard constraints).
Hard constraints must be satisfied, the tasks not being scheduled until machines that satisfy these constraints are available. Hard constraints usually refer to hardware architecture and kernel version [147]. In the Google cluster workload, approximately 6% of all tasks have hard constraints.
Soft constraints, on the other hand, are not mandatory, and tasks can be scheduled to run even if their constraints are not met. Quincy [126] and Firmament [127] model the cluster scheduling problem as a min-cost max-flow optimisation over a flow network. The nodes in the flow network represent the tasks that are submitted and the machines of a cluster. The task and machine nodes are connected through task placement preference arcs which represent soft constraints. A min-cost max-flow algorithm run over the flow network computes task placements. In Medea [148] the constraints are soft by default, and weights can be assigned to the constraints to rate their importance. In Kubernets [149], one can specify if a constraint is hard or soft.
Complex constraints are a combination of hard and soft constraints, and involve satisfying the requirements of multiple tasks or machines. They are supported by few schedulers, an example of such scheduler being TetriSched [128]. An important type of complex constraint is task affinity or anti-affinity. Task affinity refers to placing two or more tasks that have a dependency on the same resource. In contrast, task anti-affinity means placing the tasks on different resources. Kubernetes [149] supports affinity/anti-affinity constraints.
Satisfying constraints generally increases task placement latency [147] and limits the scheduler’s scalability.
Data locality Data locality used to be an important feature of cluster schedulers [126, 150], since disk throughput is higher than network bandwidth, it is desirable for the data to be stored as close as possible to the application that uses it. However, the current data center networks can provide one Pbps of bisection bandwidth [36] and the recent trend in resource disaggregation in data centers [45, 46] make this feature less important, since the data is now accesible over a very fast network. Nevertheless, generating less network traffic by reading from local disks in a traditional server architecture lowers network utilisation, and thus reduces network congestion, providing more predictable application performance [9].
Low placement latency The time it takes to compute a placement for a task is an important feature for a cluster scheduler. A low placement latency favours high cluster utilisation, and reduces the waiting time of the tasks before being scheduled. Cluster schedulers that support complex constraints may be slow in placing tasks, but they compute high-quality task placements. Quincy’s algorithm [126], for example, can take minutes for the Google workload on a cluster with 12,500 machines [127]. This runtime is too large for workloads that have sub-second job interarrival times (section VI), and it can lead to an increase in task wait time, which is especially detrimental for short-running tasks. On the other hand, Firmament’s algorithm runtime [127] is sub-second for the same scenario, achieving both high-quality placements and low placement latency. Other cluster schedulers use less complex algorithms which take less time, but do not offer high-quality task-placements, since they do not take into account the tasks’ constraints. Such an example is Sparrow [130], which places short-running tasks in a random manner.
VIII-B Network-aware cluster schedulers
Few cluster schedulers consider the networking demands of the applications and the network conditions in the data center. Managing the network traffic to achieve short flow completion times is left to data center transport designs [51, 6, 8, 9, 10] and flow schedulers [7], this happening after the applications have been scheduled to run in the data center. In general, incorporating network demands within the cluster scheduler has been treated as a separate problem from cluster schedulers that take into account only the host resources required by a job. Table V describes the mechanisms to allocate network bandwidth between tenants and to provide tail latency guarantees to ensure predictable performance.
VIII-B1 Network bandwidth guarantees
In the past, network throughput variability in cloud providers was an important issue, with bandwidth varying by a factor of five in some cases [151], leading to uncertain application performance and, consequently, tenant cost. The throughput variability was the result of different factors, such as network load, tenant VM placement, and oversubscribed data center networks.
Nowadays, data center networks often utilise full bisection bandwidth [36, 85]. Also, cloud providers’ commercial offerings list the expected network bandwidth for each type of VM, be it an exact value (Microsoft Azure, Google Cloud Platform) or qualitative estimate (Amazon EC2). These changes fit with the observation that network bandwidth guarantees have improved in recent years. Recent studies have shown that cloud providers like Amazon EC2 [152] and Microsoft Azure [153] see less throughput variability. In the case of Microsoft Azure, larger VMs and which are placed within the same affinity group or virtual network have better network throughput and observe small variability, whereas medium sized VMs experience higher variability regardless of the policy applied, with some regions offering better performance than others. On the other hand, % of the tenants of Microsoft Azure use the smallest VM size (1 core) and % the medium VM size (2 cores) [85], which means that most of the tenants do not have strict network bandwidth guarantees even in today’s data centers. In the case of Amazon EC2 [152], the network throughput is stable over time regardless of VM size, larger VMs can achieve higher throughput compared to smaller ones, and there was no difference between regions observed.
Allocating network bandwidth between endpoints was first described in the context of Virtual Private Networks (VPN) [154]. In the cloud computing model, the VPN customers can be assimilated with the tenants from the cloud, and a VPN endpoint’s equivalent is a VM. The customer-pipe model is the allocation of bandwidth on paths between source-destination pairs of endpoints of the VPN. In this model, a full mesh between customers is required to satisfy the SLAs. In the hose model, an endpoint is connected with a set of endpoints, but the bandwidth allocation is not specified between pairs. Instead, the aggregate bandwidth required for the outgoing traffic to the other endpoints and the aggregate bandwidth required for the incoming traffic from the other endpoints in the hose is specified. These two models served as basis for bandwidth allocation in the cloud, with the hose model being frequently used [155, 156, 151, 157]. SecondNet [155] introduces an abstraction called virtual data centre (VDC) and multiple types of services (type 0 guaranteed bandwidth between VMs, type 1 per ingress/egress bandwidth reservation for VM, and best effort). Gatekeeper [156] supports the hose model and sets minimum bandwidth guarantees for sending and receving traffic for a VM, which can be increased up to a maximum rate if unused capacity is available. It also proposes an extension to the hose model by composing multiple hoses for a VM to incorporate application communication patterns. EyeQ [157] uses a similar mechanism to Gatekeeper.
Several works extend the hose model. ElasticSwitch [158] provides minimum bandwidth guarantees by dividing the hose model guarantees into VM-to-VM guarantees, and taking the minimum between the guarantees of the two VMs. It rate limits the traffic from a VM to the specified guarantee or higher if there is available capacity. The unused capacity on a link is allocated proportionally to the bandwidth guarantees of the VM pairs using that link. Oktopus [151] uses the hose model (named virtual cluster, where all the VMs are connected through a single switch) and virtual oversubscribed cluster model (groups of virtual clusters connected through a switch with an oversubscription factor). Proteus [159] authors analyse the traffic patterns of several MapReduce jobs, finding that there is no need to allocate a fixed network bandwidth from the start to the end of the job, because the network demands of the applications change over time. They propose a time-varying network bandwidth allocation scheme: temporally interleaved virtual cluster, which is a variant of the hose model. CloudMirror [160] derives a network abstraction model, tenant application graph, based on the application’s communication pattern. The applications considered in this work usually have multiple tiers or components, and each tier/component is formed of a number of VMs. Bandwidth within the component is allocated using the hose model. Bandwidth between components is allocated by guaranteeing each VM in a component a send bandwidth to send traffic to the VMs in a component , and each VM in component is guaranteed a receive bandwidth to receive traffic from VMs in component . Pulsar [161] provides end-to-end isolation for VMs and appliances (e.g., load balancing, storage, monitoring). It forms a virtual data center out of dedicated appliances connected to VMs through virtual switches, where each link between VMs and appliances has a throughput guarantee. Implementation-wise, most of the works enforce rate limits at the end-host’s hypervisor.
| BW Guarantees | Work-conserving | Topology | Adaptability | Communication Pattern | Implementation | Latency Guarantees | VM placement | |
|---|---|---|---|---|---|---|---|---|
| SecondNet [155] | Yes, Hose, VM-to-VM | No | No | No | No | Hypervisor, Source routing, MPLS, Central Controller | No | Yes |
| Gatekeeper [156], EyeQ [157] | Yes, Hose | Yes | No congestion in the core | Yes | Yes | Hypervisor | No | No |
| Seawell [162] | No | Yes | No | No | No | Hypervisor | No | No |
| Oktopus [151] | Yes, Hose, Virtual oversubscribed cluster | No | Tree | No | No | Hypervisor, Central Controller | No | Yes |
| Proteus [159] | Yes, Temporally interleaved virtual cluster | No | Tree | Yes | Yes | Profiling, Central controller | No | Yes |
| NetShare [163] | No | Yes | No | No | No | Central Controller, Switches | No | No |
| PS-P [164] | Yes, Hose, Virtual oversubscribed cluster | Yes | Tree, Fat-tree | No | Number of VMs that communicate with a VM | Switches | No | No |
| ElasticSwitch [158] | Yes, Hose | Yes | No | Yes | Yes | Hypervisor | No | No |
| Hadrian [165] | Yes, Hose | Yes | Tree | No | Yes | Hypervisor, switches, central controller | No | Yes |
| Choreo [166] | Yes, Hose, VM-to-VM | No | Yes | No | Yes | Profiling, measurement, placement components | No | Yes |
| CloudMirror [160] | Yes, Tenant Application Graph | No | Tree | No | Yes | Central controller, ElasticSwitch | No | Yes |
| Pulsar [161] | Yes, Virtual data center | Yes | No | Yes | No | Central controller, Hypervisor | No | No |
| Cicada [167] | No | No | No | Yes | Yes | Hypervisor, Switches | No | Yes |
| Silo [168] | Yes | No | Tree | No | No | Central controller, End-host rate limiter | Yes, tail | Yes |
| QJump [9] | Yes | No | No | No | No | End-host rate limiter | Yes, tail | No |
| SNC-Meister [169] | Yes | No | No | No | Yes, traces | Centrall controller and end-host rate limiter | Yes, tail | Yes |
| NoMora [170] | - | - | - | Yes | Yes | Cluster scheduler | Yes | Yes |
Profiling applications to determine their network throughput and keeping historical network throughput values are two aspects that can help to allocate bandwidth in a more efficient manner [159, 167]. Using real-time measurements of the network conditions, in particular throughput, has been employed to improve VM placement [166]. Choreo [166] measures the network throughput between VM pairs through packet trains, estimates the cross traffic, and locates bottleneck links. Based on the network measurements and application profiles (number of bytes sent), it makes VM placement decisions to minimise application completion time. The NoMora cluster scheduling architecture [170] uses network latency measurements between pairs of hosts and application performance predictions dependent upon current network latency to decide where to place tenants’ VMs. The authors determine experimentally the relationship between network latency and application performance for typical cloud applications. This is similar to the profiling phase of applications and building a performance model done by different cluster schedulers, but these frameworks did not consider network latency demands in their profiling phase, nor in their performance model.
VM placement to provide network bandwidth guarantees starts by looking at subtrees in the topology to place the VMs, and goes upward in the tree to find a suitable allocation [151, 159, 165, 160]. This naturally leads to the VMs being allocated within the same rack or within the same pod, which may hurt application availability if the links to the servers that run the application fail [160]. To mitigate this, CloudMirror [160] additionally incorporates an anti-affinity (anti-colocation) constraint in the VM placement algorithm. SecondNet [155] builds a bipartite graph whose nodes are the VMs on the left side and the physical machines on the right side, and then finds a matching based on the weights of the edges of the graph using min-cost max-flow. The weights are assigned based on the available bandwidth of the corresponding server. Hadrian [165] provides bandwidth guarantees for inter-tenant communication. The VM placement algorithm builds a flow network to express the VMs communication patterns and minimum bandwidth constraints. It then uses a greedy first-fit algorithm that respects the constraints to provide placement locality (a tenant’s VMs are placed close to VMs it communicates with) and places a tenant’s VMs in the smallest subtree possible. These approaches are similar to Quincy [126] and Firmament [127], which also model the scheduling problem as a min-cost max-flow problem. Firmament’s network-aware policy avoids bandwidth oversubscription at the end-host by incorporating applications network bandwidth demands into the flow graph. [81] proposes an algorithm for traffic-aware VM placement that takes into account the traffic rates between VMs, and studies how different traffic patterns and data center network architectures impact the algorithm’s outcome.
VIII-B2 Tail network latency guarantees
Tail latencies have been recognised as a source of significant performance degradation [67, 171, 172, 173]. Several systems [168, 9, 169] have been developed in response. Silo [168] controls tenant’s bandwidth to bound network queueing delay through packet pacing at the end-host. It then places VMs using a first-fit algorithm, while trying to place a tenant’s VMs on the same server, in the same rack or further in the same pod, minimising the amount of network traffic that the core links have to cary. QJump [9] computes rate limits for classes of applications, ranging from latency-sensitive applications for which it offers strict latency guarantees to throughput-intensive ones for which latency can be variable. These systems provide worst-case latency guarantees. On the other hand, SNC-Meister [169] bases its design on the observation that tenants do not need worst-case guarantees, and that instead they require latency guarantees for lower percentiles, e.g., thpercentile. SNC-Meister leverages this observation to admit more tenants in a data center while keeping their (lower percentile) latency guarantees.
VIII-B3 Application performance guarantees
All of the previous approaches looked at providing network bandwidth and (tail) latency guarantees for an application. NoMora [170] seeks to provide application-level performance guarantees. NoMora [170] is a cluster scheduling architecture that places applications according to their predicted performance dependent upon network latency. Using application performance predictions dependent upon network latency and dynamic latency measurements obtained from PTPmesh [100], NoMora’s cluster scheduling policy places applications to obtain the best performance under the current network conditions.
VIII-C Machine Learning (ML)-driven resource allocation and control
Machine Learning for Systems promises to improve systems in an automated manner, while getting rid of heuristics and manual tuning. An early application of machine learning to systems is Internet traffic classification [174].
With the advent of machine learning, researchers have turned their attention to learning cluster scheduling policies through ML techniques rather than relying on bespoke scheduling policies and heuristics, which are hard to devise and later tune depending on the cluster workload. Leveraging cluster traces, the challenge in developing a ML-driven cluster scheduler is adapting well-known ML algorithms to the cluster scheduling problem. Out-of-the-box ML algorithms do not necessarily perform well, and necessitate a new way to represent the arrival and scheduling of jobs in a cluster.
Several cluster schedulers used Deep Reinforcement Learning (RL) to determine a scheduling decision. Decima [175] is a cluster scheduler which trains a graph neural network using RL to make decisions. Job Directed Acyclic Graphs (DAGs) are converted into vectors that serve as input to the graph neural network, whose output is used in the policy network, which outputs scheduling decisions. A scheduling agent observes the cluster state, takes a scheduling decision outputed by the network, and receives a reward depending on an objective, such as minimizing job completion time or makespan. Decima outperforms conventional cluster schedulers such as Tetris [139] and Graphene [176]. Decima uses information regarding expected task duration, the number of tasks remaining at each stage, and other cluster metrics. DeepRM [177] and RLScheduler [178] similarly use Deep Reinforcement Learning for cluster scheduling. DeepRM [177] schedules jobs using Reinforcement Learning with Deep Neural Networks (DNNs). The state is represented by the current resource allocation, the resource profiles of the first jobs waiting to be scheduled, and the number of jobs that are in the backlog (beyond the first jobs). The objective is to minimize the average job completion time. RLScheduler [178] is a HPC batch job scheduler, and uses a kernel-based neural network structure that is insensitive to job order, which is the policy network. Based on the scheduling decisions from the policy network, the rewards are used to train a value network to predict the reward for a given job sequence. The input to the policy network is represented by job attributes (job arrival time, number of requested processors, job estimated runtime, requested memory) and available resources. Both Decima and RLScheduler introduce techniques to deal with variance in input in order to ensure that the learning is not affected by different job arrival sequences.
Another area in which machine learning is being applied is scaling automatically a workload in terms of resources [179, 143]. Autopilot [179] uses an exponentially-smoothing sliding window algorithm over historic data for vertical scaling. An ML model is tuned for each job based on historical data. CherryPick [143] builds performance models for applications using Bayesian Optimization in order to find the optimal or near-optimal cloud resource allocation.
Lessons Learned: There has been substantial research in the area of cluster scheduling, both conventional and network-aware. The emergence of ML-driven resource allocation and control offers new opportunities for application performance guarantees in data centers, since the underlying systems that collect network monitoring data already exist. The next step is to customize ML algorithms for the problems at hand, utilizing the rich network monitoring information.
IX Future Directions and Conclusion
Providing network resource guarantees, and thus, predictable application performance in data centers remains challenging. Even though substantial progress has been achieved in the last decade, several open challenges remain.
IX-A Open-source network-related data center traces
Conducting data center network-related research is challenging due to the lack of up-to-date and comprehensive cluster workloads and network traffic traces. The available cluster workloads do not include information related to required network bandwidth and latency for cloud workloads. In absence of this information, one way to mitigate this is to augment current available traces with typical cloud applications networking requirements [170] or to generate synthetic cloud workloads using ML techniques [180]. A similar challenge exists for network traffic. While companies have released network traffic traces, these usually comprise sampled traffic. Traffic generator models for generating synthetic network traffic traces for data centers that have similar complexity have been proposed [181]. A collective effort is needed to have an open-source collection of traces to aid in data center network research, similar to organisations that have organised to standardise benchmark suites in different areas.
IX-B Network flow and cluster scheduling
A substantial body of work deals with network flow scheduling, while cluster scheduling is largely considered an orthogonal problem. The integration of flow scheduling and cluster scheduling into a single monolithic architecture would be interesting to explore. Usually, jobs are placed in a data center without taking into consideration network-related resources. Then the network flow scheduling mechanism has to deal with the network flows originating from the jobs. The research challenge is how do we achieve an integration of the data center management stack by finding an optimal placement for a job both from the computational perspective and from the network perspective. The multi-objective optimization that has to be solved in this case is complex.
IX-C ML-driven network-aware cluster scheduling
Applying machine learning algorithms to the cluster scheduling problem is the obvious next step, since the data center monitoring infrastructure is already in place, collecting data that can be used to train new machine learning models to aid in resource allocation and control. Recent work has already made progress in this area, but the current cluster scheduling ML algorithms do not incorporate any network-related information about jobs. A first step would be to use information such as network bandwidth requested by a job, job flow sizes, packet interarrival times, as additional inputs to these algorithms. However, the current cluster scheduling ML algorithms are agnostic with regards to the network topology, which means that scheduling decisions might be suboptimal and lead to network congestion. Designing ML algorithms that can encode network topology and network state information will be important in automating network-aware data center control. Furthermore, the objective of the ML-driven policy should take into account also flow completion time, not only objectives such as job completion time or makespan.
Our survey presents the reader with a unique perspective on measurement-based resource allocation and control in data centers. Network measurements offer the possibility of improving cloud application performance both statically, by looking at previous application behaviour, and dynamically, by ingesting new measurement data into the loop.
References
- [1] L. A. Barroso and U. Hoelzle, The Datacenter As a Computer: Designing Warehouse-Scale Machines, Third Edition, 3rd ed. Morgan and Claypool Publishers, 2018.
- [2] D. A. Popescu, N. Zilberman, and A. W. Moore, “Characterizing the impact of network latency on cloud-based applications’ performance,” University of Cambridge, Computer Laboratory, Tech. Rep. UCAM-CL-TR-914, Nov. 2017. [Online]. Available: http://www.cl.cam.ac.uk/techreports/UCAM-CL-TR-914.pdf
- [3] D. A. Popescu, “Latency-driven performance in data centres,” University of Cambridge, Computer Laboratory, Tech. Rep. UCAM-CL-TR-937, Jun. 2019. [Online]. Available: https://www.cl.cam.ac.uk/techreports/UCAM-CL-TR-937.pdf
- [4] J. C. Mogul and R. R. Kompella, “Inferring the network latency requirements of cloud tenants,” in Proceedings of the 15th USENIX Conference on Hot Topics in Operating Systems, ser. HOTOS’15. Berkeley, CA, USA: USENIX Association, 2015, pp. 24–24. [Online]. Available: http://dl.acm.org/citation.cfm?id=2831090.2831114
- [5] L. Barroso, M. Marty, D. Patterson, and P. Ranganathan, “Attack of the killer microseconds,” Commun. ACM, vol. 60, no. 4, pp. 48–54, Mar. 2017. [Online]. Available: http://doi.acm.org/10.1145/3015146
- [6] M. Alizadeh, S. Yang, M. Sharif, S. Katti, N. McKeown, B. Prabhakar, and S. Shenker, “pfabric: Minimal near-optimal datacenter transport,” in Proceedings of the ACM SIGCOMM 2013 Conference on SIGCOMM, ser. SIGCOMM ’13. New York, NY, USA: ACM, 2013, pp. 435–446. [Online]. Available: http://doi.acm.org/10.1145/2486001.2486031
- [7] J. Perry, A. Ousterhout, H. Balakrishnan, D. Shah, and H. Fugal, “Fastpass: A centralized "zero-queue" datacenter network,” in Proceedings of the 2014 ACM Conference on SIGCOMM, ser. SIGCOMM ’14. New York, NY, USA: ACM, 2014, pp. 307–318. [Online]. Available: http://doi.acm.org/10.1145/2619239.2626309
- [8] P. X. Gao, A. Narayan, G. Kumar, R. Agarwal, S. Ratnasamy, and S. Shenker, “phost: Distributed near-optimal datacenter transport over commodity network fabric,” in Proceedings of the 11th ACM Conference on Emerging Networking Experiments and Technologies, ser. CoNEXT ’15. New York, NY, USA: ACM, 2015, pp. 1:1–1:12. [Online]. Available: http://doi.acm.org/10.1145/2716281.2836086
- [9] M. P. Grosvenor, M. Schwarzkopf, I. Gog, R. N. M. Watson, A. W. Moore, S. Hand, and J. Crowcroft, “Queues don’t matter when you can jump them!” in Proceedings of the 12th USENIX Conference on Networked Systems Design and Implementation, ser. NSDI’15. Berkeley, CA, USA: USENIX Association, 2015, pp. 1–14. [Online]. Available: http://dl.acm.org/citation.cfm?id=2789770.2789771
- [10] M. Handley, C. Raiciu, A. Agache, A. Voinescu, A. W. Moore, G. Antichi, and M. Wójcik, “Re-architecting datacenter networks and stacks for low latency and high performance,” in Proceedings of the Conference of the ACM Special Interest Group on Data Communication, ser. SIGCOMM ’17. New York, NY, USA: ACM, 2017, pp. 29–42. [Online]. Available: http://doi.acm.org/10.1145/3098822.3098825
- [11] M. Al-Fares, S. Radhakrishnan, B. Raghavan, N. Huang, and A. Vahdat, “Hedera: Dynamic flow scheduling for data center networks,” in Proceedings of the 7th USENIX Conference on Networked Systems Design and Implementation, ser. NSDI’10. Berkeley, CA, USA: USENIX Association, 2010, pp. 19–19. [Online]. Available: http://dl.acm.org/citation.cfm?id=1855711.1855730
- [12] T. Benson, A. Anand, A. Akella, and M. Zhang, “MicroTE: Fine Grained Traffic Engineering for Data Centers,” in Proceedings of the Seventh COnference on Emerging Networking EXperiments and Technologies, ser. CoNEXT ’11. New York, NY, USA: ACM, 2011, pp. 8:1–8:12. [Online]. Available: http://doi.acm.org/10.1145/2079296.2079304
- [13] M. Alizadeh, T. Edsall, S. Dharmapurikar, R. Vaidyanathan, K. Chu, A. Fingerhut, V. T. Lam, F. Matus, R. Pan, N. Yadav, and G. Varghese, “Conga: Distributed congestion-aware load balancing for datacenters,” in Proceedings of the 2014 ACM Conference on SIGCOMM, ser. SIGCOMM ’14. New York, NY, USA: ACM, 2014, pp. 503–514. [Online]. Available: http://doi.acm.org/10.1145/2619239.2626316
- [14] A. Roy, D. Bansal, D. Brumley, H. K. Chandrappa, P. Sharma, R. Tewari, B. Arzani, and A. C. Snoeren, “Cloud datacenter sdn monitoring: Experiences and challenges,” in Proceedings of the Internet Measurement Conference 2018, ser. IMC ’18. New York, NY, USA: ACM, 2018, pp. 464–470. [Online]. Available: http://doi.acm.org/10.1145/3278532.3278572
- [15] M. Dayarathna, Y. Wen, and R. Fan, “Data center energy consumption modeling: A survey,” IEEE Communications Surveys Tutorials, vol. 18, no. 1, pp. 732–794, 2016.
- [16] M. F. Bari, R. Boutaba, R. Esteves, L. Z. Granville, M. Podlesny, M. G. Rabbani, Q. Zhang, and M. F. Zhani, “Data center network virtualization: A survey,” IEEE Communications Surveys Tutorials, vol. 15, no. 2, pp. 909–928, 2013.
- [17] J. Zhang, F. R. Yu, S. Wang, T. Huang, Z. Liu, and Y. Liu, “Load balancing in data center networks: A survey,” IEEE Communications Surveys Tutorials, vol. 20, no. 3, pp. 2324–2352, 2018.
- [18] M. Noormohammadpour and C. S. Raghavendra, “Datacenter traffic control: Understanding techniques and tradeoffs,” IEEE Communications Surveys Tutorials, vol. 20, no. 2, pp. 1492–1525, 2018.
- [19] W. Xia, P. Zhao, Y. Wen, and H. Xie, “A survey on data center networking (dcn): Infrastructure and operations,” IEEE Communications Surveys Tutorials, vol. 19, no. 1, pp. 640–656, 2017.
- [20] X. Sun, N. Ansari, and R. Wang, “Optimizing resource utilization of a data center,” IEEE Communications Surveys Tutorials, vol. 18, no. 4, pp. 2822–2846, 2016.
- [21] K. Wang, Q. Zhou, S. Guo, and J. Luo, “Cluster frameworks for efficient scheduling and resource allocation in data center networks: A survey,” IEEE Communications Surveys Tutorials, vol. 20, no. 4, pp. 3560–3580, 2018.
- [22] M. Crovella and B. Krishnamurthy, Internet Measurement: Infrastructure, Traffic and Applications. New York, NY, USA: John Wiley & Sons, Inc., 2006.
- [23] J. D. Case, M. Fedor, M. L. Schoffstall, and J. Davin, “Simple network management protocol (snmp),” United States, 1990.
- [24] N. Cisco, “Netflow,” https://www.cisco.com/c/en/us/products/ios-nx-os-software/ios-netflow/index.html, [Online; accessed December 2018].
- [25] C. sFlow, “sflow,” https://sflow.org/, [Online; accessed December 2018].
- [26] A. Johnson, J. Quittek, and B. Claise, “Packet Sampling (PSAMP) Protocol Specifications,” RFC 5476, Mar. 2009. [Online]. Available: https://rfc-editor.org/rfc/rfc5476.txt
- [27] N. G. Duffield and M. Grossglauser, “Trajectory sampling for direct traffic observation,” IEEE/ACM Trans. Netw., vol. 9, no. 3, pp. 280–292, Jun. 2001. [Online]. Available: http://dx.doi.org/10.1109/90.929851
- [28] S. N. Cisco, “Sampled netflow,” https://www.cisco.com/c/en/us/td/docs/ios/12_0s/feature/guide/12s_sanf.html, [Online; accessed December 2018].
- [29] Cisco, “Catalyst Switched Port Analyzer (SPAN) Configuration Example,” https://www.cisco.com/c/en/us/support/docs/switches/catalyst-6500-series-switches/10570-41.html, [Online; accessed December 2018].
- [30] L. B. N. L. ESnet, “iPerf,” https://iperf.fr/, [Online; accessed December 2018].
- [31] Cisco, “Cisco ios ip slas configuration guide,” http://www.cisco.com/c/en/us/td/docs/ios/12\_4/ip\_sla/configuration/guide/hsla\_c/hsoverv.html, [Online; accessed December 2018].
- [32] J. Martin, J. Burbank, W. Kasch, and P. D. L. Mills, “Network Time Protocol Version 4: Protocol and Algorithms Specification,” RFC 5905, Jun. 2010. [Online]. Available: https://rfc-editor.org/rfc/rfc5905.txt
- [33] IEEE, “IEEE 1588-2008 Precision Time Protocol,” https://www.nist.gov/el/intelligent-systems-division-73500/introduction-ieee-1588, 2008, [Online; accessed December 2018].
- [34] M. Al-Fares, A. Loukissas, and A. Vahdat, “A scalable, commodity data center network architecture,” in Proceedings of the ACM SIGCOMM 2008 Conference on Data Communication, ser. SIGCOMM ’08. New York, NY, USA: ACM, 2008, pp. 63–74. [Online]. Available: http://doi.acm.org/10.1145/1402958.1402967
- [35] C. Clos, “A study of non-blocking switching networks,” The Bell System Technical Journal, vol. 32, no. 2, pp. 406–424, March 1953.
- [36] A. Singh, J. Ong, A. Agarwal, G. Anderson, A. Armistead, R. Bannon, S. Boving, G. Desai, B. Felderman, P. Germano et al., “Jupiter rising: A decade of clos topologies and centralized control in google’s datacenter network,” ACM SIGCOMM Computer Communication Review, vol. 45, no. 4, pp. 183–197, 2015.
- [37] A. Greenberg, N. Jain, S. Kandula, C. Kim, P. Lahiri, D. Maltz, P. Patel, and S. Sengupta, “Vl2: A scalable and flexible data center network,” in SIGCOMM. Association for Computing Machinery, Inc., August 2009. [Online]. Available: http://research.microsoft.com/apps/pubs/default.aspx?id=80693
- [38] A. Andreyev, “Introducing data center fabric, the next-generation facebook data center network,” https://code.fb.com/production-engineering/introducing-data-center-fabric-the-next-generation-facebook-data-center-network/, 2014, [Online; accessed December 2018].
- [39] C. Hopps, “Analysis of an equal-cost multi-path algorithm,” RFC 2992, Tech. Rep., 2000.
- [40] C. Guo, H. Wu, K. Tan, L. Shi, Y. Zhang, and S. Lu, “Dcell: A scalable and fault-tolerant network structure for data centers,” in Proceedings of the ACM SIGCOMM 2008 Conference on Data Communication, ser. SIGCOMM ’08. New York, NY, USA: ACM, 2008, pp. 75–86. [Online]. Available: http://doi.acm.org/10.1145/1402958.1402968
- [41] C. Guo, G. Lu, D. Li, H. Wu, X. Zhang, Y. Shi, C. Tian, Y. Zhang, and S. Lu, “Bcube: A high performance, server-centric network architecture for modular data centers,” in Proceedings of the ACM SIGCOMM 2009 Conference on Data Communication, ser. SIGCOMM ’09. New York, NY, USA: ACM, 2009, pp. 63–74. [Online]. Available: http://doi.acm.org/10.1145/1592568.1592577
- [42] H. Abu-Libdeh, P. Costa, A. Rowstron, G. O’Shea, and A. Donnelly, “Symbiotic routing in future data centers,” SIGCOMM Comput. Commun. Rev., vol. 40, no. 4, pp. 51–62, Aug. 2010. [Online]. Available: http://doi.acm.org/10.1145/1851275.1851191
- [43] A. Singla, C.-Y. Hong, L. Popa, and P. B. Godfrey, “Jellyfish: Networking data centers randomly,” in Proceedings of the 9th USENIX Conference on Networked Systems Design and Implementation, ser. NSDI’12. Berkeley, CA, USA: USENIX Association, 2012, pp. 17–17. [Online]. Available: http://dl.acm.org/citation.cfm?id=2228298.2228322
- [44] A. Valadarsky, G. Shahaf, M. Dinitz, and M. Schapira, “Xpander: Towards optimal-performance datacenters,” in Proceedings of the 12th International on Conference on Emerging Networking EXperiments and Technologies, ser. CoNEXT ’16. New York, NY, USA: ACM, 2016, pp. 205–219. [Online]. Available: http://doi.acm.org/10.1145/2999572.2999580
- [45] P. X. Gao, A. Narayan, S. Karandikar, J. Carreira, S. Han, R. Agarwal, S. Ratnasamy, and S. Shenker, “Network requirements for resource disaggregation,” in Proceedings of the 12th USENIX Conference on Operating Systems Design and Implementation, ser. OSDI’16. Berkeley, CA, USA: USENIX Association, 2016, pp. 249–264. [Online]. Available: http://dl.acm.org/citation.cfm?id=3026877.3026897
- [46] Y. Shan, Y. Huang, Y. Chen, and Y. Zhang, “Legoos: A disseminated, distributed OS for hardware resource disaggregation,” in 13th USENIX Symposium on Operating Systems Design and Implementation (OSDI 18). Carlsbad, CA: USENIX Association, 2018, pp. 69–87. [Online]. Available: https://www.usenix.org/conference/osdi18/presentation/shan
- [47] Intel, “Intel Disaggregated Servers Drive Data Center Efficiency and Innovation,” https://www.intel.co.uk/content/www/uk/en/it-management/intel-it-best-practices/disaggregated-server-architecture-drives-data-center-efficiency-paper.html, 2018, [Online; accessed December 2018].
- [48] D. C. Plummer, “Ethernet address resolution protocol: Or converting network protocol addresses to 48.bit ethernet address for transmission on ethernet hardware,” United States, 1982.
- [49] R. Niranjan Mysore, A. Pamboris, N. Farrington, N. Huang, P. Miri, S. Radhakrishnan, V. Subramanya, and A. Vahdat, “Portland: A scalable fault-tolerant layer 2 data center network fabric,” in Proceedings of the ACM SIGCOMM 2009 Conference on Data Communication, ser. SIGCOMM ’09. New York, NY, USA: ACM, 2009, pp. 39–50. [Online]. Available: http://doi.acm.org/10.1145/1592568.1592575
- [50] Y. Rekhter and T. Li, “A border gateway protocol 4 (bgp-4),” United States, 1995.
- [51] M. Alizadeh, A. Greenberg, D. A. Maltz, J. Padhye, P. Patel, B. Prabhakar, S. Sengupta, and M. Sridharan, “Data center tcp (dctcp),” in Proceedings of the ACM SIGCOMM 2010 Conference, ser. SIGCOMM ’10. New York, NY, USA: ACM, 2010, pp. 63–74. [Online]. Available: http://doi.acm.org/10.1145/1851182.1851192
- [52] M. Alizadeh, A. Kabbani, T. Edsall, B. Prabhakar, A. Vahdat, and M. Yasuda, “Less is more: Trading a little bandwidth for ultra-low latency in the data center,” in Proceedings of the 9th USENIX Conference on Networked Systems Design and Implementation, ser. NSDI’12. Berkeley, CA, USA: USENIX Association, 2012, pp. 19–19. [Online]. Available: http://dl.acm.org/citation.cfm?id=2228298.2228324
- [53] B. Vamanan, J. Hasan, and T. Vijaykumar, “Deadline-aware datacenter tcp (d2tcp),” in Proceedings of the ACM SIGCOMM 2012 Conference on Applications, Technologies, Architectures, and Protocols for Computer Communication, ser. SIGCOMM ’12. New York, NY, USA: ACM, 2012, pp. 115–126. [Online]. Available: http://doi.acm.org/10.1145/2342356.2342388
- [54] PTPd, “PTP daemon,” https://github.com/ptpd/ptpd, 2018, [Online; accessed December 2018].
- [55] M. Burrows, “The chubby lock service for loosely-coupled distributed systems,” in 7th USENIX Symposium on Operating Systems Design and Implementation (OSDI), 2006.
- [56] A. Verma, L. Pedrosa, M. Korupolu, D. Oppenheimer, E. Tune, and J. Wilkes, “Large-scale cluster management at google with borg,” in Proceedings of the Tenth European Conference on Computer Systems, ser. EuroSys ’15. New York, NY, USA: ACM, 2015, pp. 18:1–18:17. [Online]. Available: http://doi.acm.org/10.1145/2741948.2741964
- [57] S. Ghemawat, H. Gobioff, and S.-T. Leung, “The google file system,” in Proceedings of the 19th ACM Symposium on Operating Systems Principles, Bolton Landing, NY, 2003, pp. 20–43.
- [58] J. C. Corbett, J. Dean, M. Epstein, A. Fikes, C. Frost, J. J. Furman, S. Ghemawat, A. Gubarev, C. Heiser, P. Hochschild, W. Hsieh, S. Kanthak, E. Kogan, H. Li, A. Lloyd, S. Melnik, D. Mwaura, D. Nagle, S. Quinlan, R. Rao, L. Rolig, Y. Saito, M. Szymaniak, C. Taylor, R. Wang, and D. Woodford, “Spanner: Google’s globally-distributed database,” in Proceedings of the 10th USENIX Conference on Operating Systems Design and Implementation, ser. OSDI’12. Berkeley, CA, USA: USENIX Association, 2012, pp. 251–264. [Online]. Available: http://dl.acm.org/citation.cfm?id=2387880.2387905
- [59] Memcached, “Memcached,” https://memcached.org/, 2018, [Online; accessed December 2018].
- [60] J. Dean and S. Ghemawat, “Mapreduce: Simplified data processing on large clusters,” in OSDI’04: Sixth Symposium on Operating System Design and Implementation, San Francisco, CA, 2004, pp. 137–150.
- [61] A. Giraph, “Apache Giraph,” http://giraph.apache.org/, [Online; accessed December 2018].
- [62] G. Malewicz, M. H. Austern, A. J. Bik, J. C. Dehnert, I. Horn, N. Leiser, and G. Czajkowski, “Pregel: A system for large-scale graph processing,” in Proceedings of the 2010 ACM SIGMOD International Conference on Management of Data, ser. SIGMOD ’10. New York, NY, USA: ACM, 2010, pp. 135–146. [Online]. Available: http://doi.acm.org/10.1145/1807167.1807184
- [63] A. Storm, “Apache Storm,” http://storm.apache.org/, [Online; accessed December 2018].
- [64] M. Abadi, P. Barham, J. Chen, Z. Chen, A. Davis, J. Dean, M. Devin, S. Ghemawat, G. Irving, M. Isard, M. Kudlur, J. Levenberg, R. Monga, S. Moore, D. G. Murray, B. Steiner, P. Tucker, V. Vasudevan, P. Warden, M. Wicke, Y. Yu, and X. Zheng, “Tensorflow: A system for large-scale machine learning,” in Proceedings of the 12th USENIX Conference on Operating Systems Design and Implementation, ser. OSDI’16. Berkeley, CA, USA: USENIX Association, 2016, pp. 265–283. [Online]. Available: http://dl.acm.org/citation.cfm?id=3026877.3026899
- [65] A. H. S. Project, “Apache HTTP Server Project,” https://www.mysql.com/, 2018, [Online; accessed December 2018].
- [66] M. Chowdhury and I. Stoica, “Coflow: A networking abstraction for cluster applications,” in Proceedings of the 11th ACM Workshop on Hot Topics in Networks, ser. HotNets-XI. New York, NY, USA: ACM, 2012, pp. 31–36. [Online]. Available: http://doi.acm.org/10.1145/2390231.2390237
- [67] R. Kapoor, G. Porter, M. Tewari, G. M. Voelker, and A. Vahdat, “Chronos: Predictable low latency for data center applications,” in Proceedings of the Third ACM Symposium on Cloud Computing, ser. SoCC ’12. New York, NY, USA: ACM, 2012, pp. 9:1–9:14. [Online]. Available: http://doi.acm.org/10.1145/2391229.2391238
- [68] M. Li, D. G. Andersen, J. W. Park, A. J. Smola, A. Ahmed, V. Josifovski, J. Long, E. J. Shekita, and B.-Y. Su, “Scaling distributed machine learning with the parameter server,” in 11th USENIX Symposium on Operating Systems Design and Implementation (OSDI 14). Broomfield, CO: USENIX Association, 2014, pp. 583–598. [Online]. Available: https://www.usenix.org/conference/osdi14/technical-sessions/presentation/li_mu
- [69] M. Zaharia, M. Chowdhury, T. Das, A. Dave, J. Ma, M. McCauly, M. J. Franklin, S. Shenker, and I. Stoica, “Resilient distributed datasets: A fault-tolerant abstraction for in-memory cluster computing,” in Presented as part of the 9th USENIX Symposium on Networked Systems Design and Implementation (NSDI 12). San Jose, CA: USENIX, 2012, pp. 15–28. [Online]. Available: https://www.usenix.org/conference/nsdi12/technical-sessions/presentation/zaharia
- [70] K. Hazelwood, S. Bird, D. Brooks, S. Chintala, U. Diril, D. Dzhulgakov, M. Fawzy, B. Jia, Y. Jia, A. Kalro, J. Law, K. Lee, J. Lu, P. Noordhuis, M. Smelyanskiy, L. Xiong, and X. Wang, “Applied machine learning at facebook: A datacenter infrastructure perspective,” in 2018 IEEE International Symposium on High Performance Computer Architecture (HPCA), Feb 2018, pp. 620–629.
- [71] J. K. Kim, Q. Ho, S. Lee, X. Zheng, W. Dai, G. A. Gibson, and E. P. Xing, “Strads: A distributed framework for scheduled model parallel machine learning,” in Proceedings of the Eleventh European Conference on Computer Systems, ser. EuroSys ’16. New York, NY, USA: ACM, 2016, pp. 5:1–5:16. [Online]. Available: http://doi.acm.org/10.1145/2901318.2901331
- [72] E. P. Xing, Q. Ho, W. Dai, J. K. Kim, J. Wei, S. Lee, X. Zheng, P. Xie, A. Kumar, and Y. Yu, “Petuum: A new platform for distributed machine learning on big data,” IEEE Transactions on Big Data, vol. 1, no. 2, pp. 49–67, June 2015.
- [73] B. Atikoglu, Y. Xu, E. Frachtenberg, S. Jiang, and M. Paleczny, “Workload analysis of a large-scale key-value store,” in Proceedings of the 12th ACM SIGMETRICS/PERFORMANCE Joint International Conference on Measurement and Modeling of Computer Systems, ser. SIGMETRICS ’12. New York, NY, USA: ACM, 2012, pp. 53–64. [Online]. Available: http://doi.acm.org/10.1145/2254756.2254766
- [74] J. Leverich and C. Kozyrakis, “Reconciling high server utilization and sub-millisecond quality-of-service,” in Proceedings of the Ninth European Conference on Computer Systems, ser. EuroSys ’14. New York, NY, USA: ACM, 2014, pp. 4:1–4:14. [Online]. Available: http://doi.acm.org/10.1145/2592798.2592821
- [75] Y. Chen, S. Alspaugh, and R. Katz, “Interactive analytical processing in big data systems: A cross-industry study of mapreduce workloads,” Proc. VLDB Endow., vol. 5, no. 12, pp. 1802–1813, Aug. 2012. [Online]. Available: http://dx.doi.org/10.14778/2367502.2367519
- [76] Y. LeCun and C. Cortes, “MNIST handwritten digit database,” http://yann.lecun.com/exdb/mnist/, 2010, [Online; accessed December 2018].
- [77] J. Deng, W. Dong, R. Socher, L.-J. Li, K. Li, and L. Fei-Fei, “ImageNet: A Large-Scale Hierarchical Image Database,” in CVPR09, 2009.
- [78] S. Kandula, S. Sengupta, A. Greenberg, P. Patel, and R. Chaiken, “The nature of data center traffic: Measurements & analysis,” in Proceedings of the 9th ACM SIGCOMM Conference on Internet Measurement Conference, ser. IMC ’09. New York, NY, USA: ACM, 2009, pp. 202–208. [Online]. Available: http://doi.acm.org/10.1145/1644893.1644918
- [79] T. Benson, A. Akella, and D. A. Maltz, “Network traffic characteristics of data centers in the wild,” in Proceedings of the 10th ACM SIGCOMM Conference on Internet Measurement, ser. IMC ’10. New York, NY, USA: ACM, 2010, pp. 267–280. [Online]. Available: http://doi.acm.org/10.1145/1879141.1879175
- [80] A. Roy, H. Zeng, J. Bagga, G. Porter, and A. C. Snoeren, “Inside the social network’s (datacenter) network,” in Proceedings of the 2015 ACM Conference on Special Interest Group on Data Communication, ser. SIGCOMM ’15. New York, NY, USA: ACM, 2015, pp. 123–137. [Online]. Available: http://doi.acm.org/10.1145/2785956.2787472
- [81] X. Meng, V. Pappas, and L. Zhang, “Improving the Scalability of Data Center Networks with Traffic-aware Virtual Machine Placement,” in Proceedings of the 29th Conference on Information Communications, ser. INFOCOM’10. Piscataway, NJ, USA: IEEE Press, 2010, pp. 1154–1162. [Online]. Available: http://dl.acm.org/citation.cfm?id=1833515.1833690
- [82] M. Chowdhury, M. Zaharia, J. Ma, M. I. Jordan, and I. Stoica, “Managing Data Transfers in Computer Clusters with Orchestra,” in Proceedings of the ACM SIGCOMM 2011 Conference, ser. SIGCOMM ’11. New York, NY, USA: ACM, 2011, pp. 98–109. [Online]. Available: http://doi.acm.org/10.1145/2018436.2018448
- [83] D. Halperin, S. Kandula, J. Padhye, P. Bahl, and D. Wetherall, “Augmenting Data Center Networks with Multi-gigabit Wireless Links,” in Proceedings of the ACM SIGCOMM 2011 Conference, ser. SIGCOMM ’11. New York, NY, USA: ACM, 2011, pp. 38–49. [Online]. Available: http://doi.acm.org/10.1145/2018436.2018442
- [84] C. Reiss, A. Tumanov, G. R. Ganger, R. H. Katz, and M. A. Kozuch, “Heterogeneity and dynamicity of clouds at scale: Google trace analysis,” in Proceedings of the Third ACM Symposium on Cloud Computing, ser. SoCC ’12. New York, NY, USA: ACM, 2012, pp. 7:1–7:13. [Online]. Available: http://doi.acm.org/10.1145/2391229.2391236
- [85] E. Cortez, A. Bonde, A. Muzio, M. Russinovich, M. Fontoura, and R. Bianchini, “Resource central: Understanding and predicting workloads for improved resource management in large cloud platforms,” in Proceedings of the 26th Symposium on Operating Systems Principles, ser. SOSP ’17. New York, NY, USA: ACM, 2017, pp. 153–167. [Online]. Available: http://doi.acm.org/10.1145/3132747.3132772
- [86] G. Amvrosiadis, J. W. Park, G. R. Ganger, G. A. Gibson, E. Baseman, and N. DeBardeleben, “On the diversity of cluster workloads and its impact on research results,” in 2018 USENIX Annual Technical Conference (USENIX ATC 18). Boston, MA: USENIX Association, 2018, pp. 533–546. [Online]. Available: https://www.usenix.org/conference/atc18/presentation/amvrosiadis
- [87] M. Tirmazi, A. Barker, N. Deng, M. E. Haque, Z. G. Qin, S. Hand, M. Harchol-Balter, and J. Wilkes, “Borg: The next generation,” in Proceedings of the Fifteenth European Conference on Computer Systems, ser. EuroSys ’20. New York, NY, USA: Association for Computing Machinery, 2020. [Online]. Available: https://doi.org/10.1145/3342195.3387517
- [88] N. McKeown, T. Anderson, H. Balakrishnan, G. Parulkar, L. Peterson, J. Rexford, S. Shenker, and J. Turner, “Openflow: Enabling innovation in campus networks,” SIGCOMM Comput. Commun. Rev., vol. 38, no. 2, pp. 69–74, Mar. 2008. [Online]. Available: http://doi.acm.org/10.1145/1355734.1355746
- [89] A. Tootoonchian, M. Ghobadi, and Y. Ganjali, “Opentm: Traffic matrix estimator for openflow networks,” in Proceedings of the 11th International Conference on Passive and Active Measurement, ser. PAM’10. Berlin, Heidelberg: Springer-Verlag, 2010, pp. 201–210. [Online]. Available: http://dl.acm.org/citation.cfm?id=1889324.1889345
- [90] C. Yu, C. Lumezanu, Y. Zhang, V. Singh, G. Jiang, and H. V. Madhyastha, “Flowsense: Monitoring network utilization with zero measurement cost,” in Proceedings of the 14th International Conference on Passive and Active Measurement, ser. PAM’13. Berlin, Heidelberg: Springer-Verlag, 2013, pp. 31–41. [Online]. Available: http://dx.doi.org/10.1007/978-3-642-36516-4_4
- [91] S. Chowdhury, M. Bari, R. Ahmed, and R. Boutaba, “PayLess: A low cost network monitoring framework for software defined networks,” in 2014 IEEE Network Operations and Management Symposium (NOMS), May 2014, pp. 1–9.
- [92] M. Moshref, M. Yu, R. Govindan, and A. Vahdat, “Dream: Dynamic resource allocation for software-defined measurement,” in Proceedings of the 2014 ACM Conference on SIGCOMM, ser. SIGCOMM ’14. New York, NY, USA: ACM, 2014, pp. 419–430. [Online]. Available: http://doi.acm.org/10.1145/2619239.2626291
- [93] M. Yu, L. Jose, and R. Miao, “Software defined traffic measurement with opensketch,” in Proceedings of the 10th USENIX Conference on Networked Systems Design and Implementation, ser. nsdi’13. Berkeley, CA, USA: USENIX Association, 2013, pp. 29–42. [Online]. Available: http://dl.acm.org/citation.cfm?id=2482626.2482631
- [94] C. Yu, C. Lumezanu, A. Sharma, Q. Xu, G. Jiang, and H. V. Madhyastha, Software-Defined Latency Monitoring in Data Center Networks. Cham: Springer International Publishing, 2015, pp. 360–372. [Online]. Available: http://dx.doi.org/10.1007/978-3-319-15509-8\_27
- [95] J. Suh, T. T. Kwon, C. Dixon, W. Felter, and J. Carter, “OpenSample: A low-latency, sampling-based measurement platform for commodity SDN,” in 2014 IEEE 34th International Conference on Distributed Computing Systems (ICDCS), Jun. 2014, pp. 228–237.
- [96] J. Rasley, B. Stephens, C. Dixon, E. Rozner, W. Felter, K. Agarwal, J. Carter, and R. Fonseca, “Planck: Millisecond-scale monitoring and control for commodity networks,” in Proceedings of the 2014 ACM Conference on SIGCOMM, ser. SIGCOMM ’14. New York, NY, USA: ACM, 2014, pp. 407–418. [Online]. Available: http://doi.acm.org/10.1145/2619239.2626310
- [97] A. Adams, P. Lapukhov, and J. H. Zeng, “NetNORAD: Troubleshooting networks via end-to-end probing,” https://code.facebook.com/posts/1534350660228025/netnorad-troubleshooting-networks-via-end-to-end-probing/, 2016, [Online; accessed December 2018].
- [98] Y. Zhu, N. Kang, J. Cao, A. Greenberg, G. Lu, R. Mahajan, D. Maltz, L. Yuan, M. Zhang, B. Y. Zhao, and H. Zheng, “Packet-level telemetry in large datacenter networks,” in Proceedings of the 2015 ACM Conference on Special Interest Group on Data Communication, ser. SIGCOMM ’15. New York, NY, USA: ACM, 2015, pp. 479–491. [Online]. Available: http://doi.acm.org/10.1145/2785956.2787483
- [99] C. Guo, L. Yuan, D. Xiang, Y. Dang, R. Huang, D. Maltz, Z. Liu, V. Wang, B. Pang, H. Chen, Z.-W. Lin, and V. Kurien, “Pingmesh: A large-scale system for data center network latency measurement and analysis,” in Proceedings of the 2015 ACM Conference on Special Interest Group on Data Communication, ser. SIGCOMM ’15. New York, NY, USA: ACM, 2015, pp. 139–152. [Online]. Available: http://doi.acm.org/10.1145/2785956.2787496
- [100] D. A. Popescu and A. W. Moore, “Ptpmesh: Data center network latency measurements using ptp,” in 2017 IEEE 25th International Symposium on Modeling, Analysis, and Simulation of Computer and Telecommunication Systems (MASCOTS), Sept 2017, pp. 73–79.
- [101] D. A. Popescu and A. W. Moore, “A First Look at Data Center Network Condition Through The Eyes of PTPmesh,” in 2018 Network Traffic Measurement and Analysis Conference (TMA), June 2018, pp. 1–8.
- [102] D. A. Popescu and A. W. Moore, “Measuring Network Conditions in Data Centers Using the Precision Time Protocol,” IEEE Transactions on Network and Service Management, vol. 18, no. 3, pp. 3753–3770, 2021.
- [103] Z. Liu, A. Manousis, G. Vorsanger, V. Sekar, and V. Braverman, “One sketch to rule them all: Rethinking network flow monitoring with univmon,” in Proceedings of the 2016 ACM SIGCOMM Conference, ser. SIGCOMM ’16. New York, NY, USA: ACM, 2016, pp. 101–114. [Online]. Available: http://doi.acm.org/10.1145/2934872.2934906
- [104] T. Yang, J. Jiang, P. Liu, Q. Huang, J. Gong, Y. Zhou, R. Miao, X. Li, and S. Uhlig, “Elastic sketch: Adaptive and fast network-wide measurements,” in Proceedings of the 2018 Conference of the ACM Special Interest Group on Data Communication, ser. SIGCOMM ’18. New York, NY, USA: ACM, 2018, pp. 561–575. [Online]. Available: http://doi.acm.org/10.1145/3230543.3230544
- [105] Q. Huang, P. P. C. Lee, and Y. Bao, “Sketchlearn: Relieving user burdens in approximate measurement with automated statistical inference,” in Proceedings of the 2018 Conference of the ACM Special Interest Group on Data Communication, ser. SIGCOMM ’18. New York, NY, USA: ACM, 2018, pp. 576–590. [Online]. Available: http://doi.acm.org/10.1145/3230543.3230559
- [106] Z. Liu, R. Ben-Basat, G. Einziger, Y. Kassner, V. Braverman, R. Friedman, and V. Sekar, “Nitrosketch: Robust and general sketch-based monitoring in software switches,” in Proceedings of the ACM Special Interest Group on Data Communication, ser. SIGCOMM ’19. New York, NY, USA: Association for Computing Machinery, 2019, pp. 334–350. [Online]. Available: https://doi.org/10.1145/3341302.3342076
- [107] Y. Zhang, Z. Liu, R. Wang, T. Yang, J. Li, R. Miao, P. Liu, R. Zhang, and J. Jiang, “Cocosketch: High-performance sketch-based measurement over arbitrary partial key query,” in Proceedings of the 2021 ACM SIGCOMM 2021 Conference, ser. SIGCOMM ’21. New York, NY, USA: Association for Computing Machinery, 2021, pp. 207–222. [Online]. Available: https://doi.org/10.1145/3452296.3472892
- [108] V. Sivaraman, S. Narayana, O. Rottenstreich, S. Muthukrishnan, and J. Rexford, “Heavy-hitter detection entirely in the data plane,” in Proceedings of the Symposium on SDN Research, ser. SOSR ’17. New York, NY, USA: ACM, 2017, pp. 164–176. [Online]. Available: http://doi.acm.org/10.1145/3050220.3063772
- [109] D. A. Popescu, G. Antichi, and A. W. Moore, “Enabling fast hierarchical heavy hitter detection using programmable data planes,” in Proceedings of the Symposium on SDN Research, ser. SOSR ’17. New York, NY, USA: ACM, 2017, pp. 191–192. [Online]. Available: http://doi.acm.org/10.1145/3050220.3060606
- [110] J. Kučera, D. A. Popescu, H. Wang, A. Moore, J. Kořenek, and G. Antichi, “Enabling event-triggered data plane monitoring,” in Proceedings of the Symposium on SDN Research, ser. SOSR ’20. New York, NY, USA: Association for Computing Machinery, 2020, pp. 14–26. [Online]. Available: https://doi.org/10.1145/3373360.3380830
- [111] Y. Li, R. Miao, C. Kim, and M. Yu, “Flowradar: A better netflow for data centers,” in Proceedings of the 13th Usenix Conference on Networked Systems Design and Implementation, ser. NSDI’16. Berkeley, CA, USA: USENIX Association, 2016, pp. 311–324. [Online]. Available: http://dl.acm.org/citation.cfm?id=2930611.2930632
- [112] S. Narayana, A. Sivaraman, V. Nathan, P. Goyal, V. Arun, M. Alizadeh, V. Jeyakumar, and C. Kim, “Language-directed hardware design for network performance monitoring,” in Proceedings of the Conference of the ACM Special Interest Group on Data Communication, ser. SIGCOMM ’17. New York, NY, USA: ACM, 2017, pp. 85–98. [Online]. Available: http://doi.acm.org/10.1145/3098822.3098829
- [113] Y. Li, R. Miao, C. Kim, and M. Yu, “Lossradar: Fast detection of lost packets in data center networks,” in Proceedings of the 12th International on Conference on Emerging Networking EXperiments and Technologies, ser. CoNEXT ’16. New York, NY, USA: ACM, 2016, pp. 481–495. [Online]. Available: http://doi.acm.org/10.1145/2999572.2999609
- [114] M. Hira and L. Wobker, “Improving Network Monitoring and Management with Programmable Data Planes,” http://p4.org/p4/inband-network-telemetry/, 2016, [Online; accessed December 2018].
- [115] R. Ben Basat, S. Ramanathan, Y. Li, G. Antichi, M. Yu, and M. Mitzenmacher, “Pint: Probabilistic in-band network telemetry,” in Proceedings of the Annual Conference of the ACM Special Interest Group on Data Communication on the Applications, Technologies, Architectures, and Protocols for Computer Communication, ser. SIGCOMM ’20. New York, NY, USA: Association for Computing Machinery, 2020, pp. 662–680. [Online]. Available: https://doi.org/10.1145/3387514.3405894
- [116] B. Arzani, S. Ciraci, B. T. Loo, A. Schuster, and G. Outhred, “Taking the Blame Game out of Data Centers Operations with NetPoirot,” in Proceedings of the 2016 ACM SIGCOMM Conference, ser. SIGCOMM ’16. New York, NY, USA: ACM, 2016, pp. 440–453. [Online]. Available: http://doi.acm.org/10.1145/2934872.2934884
- [117] A. Roy, H. Zeng, J. Bagga, and A. C. Snoeren, “Passive Realtime Datacenter Fault Detection and Localization,” in 14th USENIX Symposium on Networked Systems Design and Implementation (NSDI 17). Boston, MA: USENIX Association, 2017, pp. 595–612. [Online]. Available: https://www.usenix.org/conference/nsdi17/technical-sessions/presentation/roy
- [118] B. Arzani, S. Ciraci, L. Chamon, Y. Zhu, H. H. Liu, J. Padhye, B. T. Loo, and G. Outhred, “007: Democratically finding the cause of packet drops,” in 15th USENIX Symposium on Networked Systems Design and Implementation (NSDI 18). Renton, WA: USENIX Association, 2018, pp. 419–435. [Online]. Available: https://www.usenix.org/conference/nsdi18/presentation/arzani
- [119] P. Tammana, R. Agarwal, and M. Lee, “Simplifying datacenter network debugging with pathdump,” in 12th USENIX Symposium on Operating Systems Design and Implementation (OSDI 16). Savannah, GA: USENIX Association, 2016, pp. 233–248. [Online]. Available: https://www.usenix.org/conference/osdi16/technical-sessions/presentation/tammana
- [120] Q. Zhang, V. Liu, H. Zeng, and A. Krishnamurthy, “High-resolution measurement of data center microbursts,” in Proceedings of the 2017 Internet Measurement Conference, ser. IMC ’17. New York, NY, USA: ACM, 2017, pp. 78–85. [Online]. Available: http://doi.acm.org/10.1145/3131365.3131375
- [121] P. Bosshart, G. Gibb, H.-S. Kim, G. Varghese, N. McKeown, M. Izzard, F. Mujica, and M. Horowitz, “Forwarding metamorphosis: Fast programmable match-action processing in hardware for sdn,” in Proceedings of the ACM SIGCOMM 2013 Conference on SIGCOMM, ser. SIGCOMM ’13. New York, NY, USA: ACM, 2013, pp. 99–110. [Online]. Available: http://doi.acm.org/10.1145/2486001.2486011
- [122] A. Gupta, R. Harrison, M. Canini, N. Feamster, J. Rexford, and W. Willinger, “Sonata: Query-driven streaming network telemetry,” in Proceedings of the 2018 Conference of the ACM Special Interest Group on Data Communication, ser. SIGCOMM ’18. New York, NY, USA: ACM, 2018, pp. 357–371. [Online]. Available: http://doi.acm.org/10.1145/3230543.3230555
- [123] I. C. Gog, “Flexible and efficient computation in large data centres,” Ph.D. dissertation, University of Cambridge, 2017.
- [124] M. Schwarzkopf, “Operating system support for warehouse-scale computing,” Ph.D. dissertation, University of Cambridge, 2016.
- [125] A. Goder, A. Spiridonov, and Y. Wang, “Bistro: Scheduling data-parallel jobs against live production systems,” in 2015 USENIX Annual Technical Conference (USENIX ATC 15). Santa Clara, CA: USENIX Association, 2015, pp. 459–471. [Online]. Available: https://www.usenix.org/conference/atc15/technical-session/presentation/goder
- [126] M. Isard, V. Prabhakaran, J. Currey, U. Wieder, K. Talwar, and A. Goldberg, “Quincy: Fair scheduling for distributed computing clusters,” in Proceedings of the ACM SIGOPS 22Nd Symposium on Operating Systems Principles, ser. SOSP ’09. New York, NY, USA: ACM, 2009, pp. 261–276. [Online]. Available: http://doi.acm.org/10.1145/1629575.1629601
- [127] I. Gog, M. Schwarzkopf, A. Gleave, R. N. M. Watson, and S. Hand, “Firmament: Fast, centralized cluster scheduling at scale,” in Proceedings of the 12th USENIX Conference on Operating Systems Design and Implementation, ser. OSDI’16. Berkeley, CA, USA: USENIX Association, 2016, pp. 99–115. [Online]. Available: http://dl.acm.org/citation.cfm?id=3026877.3026886
- [128] A. Tumanov, T. Zhu, J. W. Park, M. A. Kozuch, M. Harchol-Balter, and G. R. Ganger, “Tetrisched: Global rescheduling with adaptive plan-ahead in dynamic heterogeneous clusters,” in Proceedings of the Eleventh European Conference on Computer Systems, ser. EuroSys ’16. New York, NY, USA: ACM, 2016, pp. 35:1–35:16. [Online]. Available: http://doi.acm.org/10.1145/2901318.2901355
- [129] E. Boutin, J. Ekanayake, W. Lin, B. Shi, J. Zhou, Z. Qian, M. Wu, and L. Zhou, “Apollo: Scalable and coordinated scheduling for cloud-scale computing,” in 11th USENIX Symposium on Operating Systems Design and Implementation (OSDI 14). Broomfield, CO: USENIX Association, 2014, pp. 285–300. [Online]. Available: https://www.usenix.org/conference/osdi14/technical-sessions/presentation/boutin
- [130] K. Ousterhout, P. Wendell, M. Zaharia, and I. Stoica, “Sparrow: Distributed, low latency scheduling,” in Proceedings of the Twenty-Fourth ACM Symposium on Operating Systems Principles, ser. SOSP ’13. New York, NY, USA: ACM, 2013, pp. 69–84. [Online]. Available: http://doi.acm.org/10.1145/2517349.2522716
- [131] P. Delgado, F. Dinu, A.-M. Kermarrec, and W. Zwaenepoel, “Hawk: Hybrid datacenter scheduling,” in Proceedings of the 2015 USENIX Conference on Usenix Annual Technical Conference, ser. USENIX ATC ’15. Berkeley, CA, USA: USENIX Association, 2015, pp. 499–510. [Online]. Available: http://dl.acm.org/citation.cfm?id=2813767.2813804
- [132] P. Delgado, D. Didona, F. Dinu, and W. Zwaenepoel, “Job-aware scheduling in eagle: Divide and stick to your probes,” in Proceedings of the Seventh ACM Symposium on Cloud Computing, ser. SoCC ’16. New York, NY, USA: ACM, 2016, pp. 497–509. [Online]. Available: http://doi.acm.org/10.1145/2987550.2987563
- [133] K. Karanasos, S. Rao, C. Curino, C. Douglas, K. Chaliparambil, G. M. Fumarola, S. Heddaya, R. Ramakrishnan, and S. Sakalanaga, “Mercury: Hybrid centralized and distributed scheduling in large shared clusters,” in 2015 USENIX Annual Technical Conference (USENIX ATC 15). Santa Clara, CA: USENIX Association, 2015, pp. 485–497. [Online]. Available: https://www.usenix.org/conference/atc15/technical-session/presentation/karanasos
- [134] B. Hindman, A. Konwinski, M. Zaharia, A. Ghodsi, A. D. Joseph, R. Katz, S. Shenker, and I. Stoica, “Mesos: A platform for fine-grained resource sharing in the data center,” in Proceedings of the 8th USENIX Conference on Networked Systems Design and Implementation, ser. NSDI’11. Berkeley, CA, USA: USENIX Association, 2011, pp. 295–308. [Online]. Available: http://dl.acm.org/citation.cfm?id=1972457.1972488
- [135] V. K. Vavilapalli, A. C. Murthy, C. Douglas, S. Agarwal, M. Konar, R. Evans, T. Graves, J. Lowe, H. Shah, S. Seth, B. Saha, C. Curino, O. O’Malley, S. Radia, B. Reed, and E. Baldeschwieler, “Apache hadoop yarn: Yet another resource negotiator,” in Proceedings of the 4th Annual Symposium on Cloud Computing, ser. SOCC ’13. New York, NY, USA: ACM, 2013, pp. 5:1–5:16. [Online]. Available: http://doi.acm.org/10.1145/2523616.2523633
- [136] A. D. Ferguson, P. Bodik, S. Kandula, E. Boutin, and R. Fonseca, “Jockey: Guaranteed job latency in data parallel clusters,” in Proceedings of the 7th ACM European Conference on Computer Systems, ser. EuroSys ’12. New York, NY, USA: ACM, 2012, pp. 99–112. [Online]. Available: http://doi.acm.org/10.1145/2168836.2168847
- [137] M. Schwarzkopf, A. Konwinski, M. Abd-El-Malek, and J. Wilkes, “Omega: Flexible, scalable schedulers for large compute clusters,” in Proceedings of the 8th ACM European Conference on Computer Systems, ser. EuroSys ’13. New York, NY, USA: ACM, 2013, pp. 351–364. [Online]. Available: http://doi.acm.org/10.1145/2465351.2465386
- [138] C. Delimitrou and C. Kozyrakis, “Quasar: Resource-efficient and qos-aware cluster management,” in Proceedings of the 19th International Conference on Architectural Support for Programming Languages and Operating Systems, ser. ASPLOS ’14. New York, NY, USA: ACM, 2014, pp. 127–144. [Online]. Available: http://doi.acm.org/10.1145/2541940.2541941
- [139] R. Grandl, G. Ananthanarayanan, S. Kandula, S. Rao, and A. Akella, “Multi-resource packing for cluster schedulers,” in Proceedings of the 2014 ACM Conference on SIGCOMM, ser. SIGCOMM ’14. New York, NY, USA: ACM, 2014, pp. 455–466. [Online]. Available: http://doi.acm.org/10.1145/2619239.2626334
- [140] R. Grandl, M. Chowdhury, A. Akella, and G. Ananthanarayanan, “Altruistic scheduling in multi-resource clusters,” in Proceedings of the 12th USENIX Conference on Operating Systems Design and Implementation, ser. OSDI’16. Berkeley, CA, USA: USENIX Association, 2016, pp. 65–80. [Online]. Available: http://dl.acm.org/citation.cfm?id=3026877.3026884
- [141] S. A. Jyothi, C. Curino, I. Menache, S. M. Narayanamurthy, A. Tumanov, J. Yaniv, R. Mavlyutov, I. n. Goiri, S. Krishnan, J. Kulkarni, and S. Rao, “Morpheus: Towards automated slos for enterprise clusters,” in Proceedings of the 12th USENIX Conference on Operating Systems Design and Implementation, ser. OSDI’16. Berkeley, CA, USA: USENIX Association, 2016, pp. 117–134. [Online]. Available: http://dl.acm.org/citation.cfm?id=3026877.3026887
- [142] S. Venkataraman, Z. Yang, M. Franklin, B. Recht, and I. Stoica, “Ernest: Efficient performance prediction for large-scale advanced analytics,” in Proceedings of the 13th Usenix Conference on Networked Systems Design and Implementation, ser. NSDI’16. Berkeley, CA, USA: USENIX Association, 2016, pp. 363–378. [Online]. Available: http://dl.acm.org/citation.cfm?id=2930611.2930635
- [143] O. Alipourfard, H. H. Liu, J. Chen, S. Venkataraman, M. Yu, and M. Zhang, “Cherrypick: Adaptively unearthing the best cloud configurations for big data analytics,” in Proceedings of the 14th USENIX Conference on Networked Systems Design and Implementation, ser. NSDI’17. Berkeley, CA, USA: USENIX Association, 2017, pp. 469–482. [Online]. Available: http://dl.acm.org/citation.cfm?id=3154630.3154669
- [144] Y. Peng, Y. Bao, Y. Chen, C. Wu, and C. Guo, “Optimus: An efficient dynamic resource scheduler for deep learning clusters,” in Proceedings of the Thirteenth EuroSys Conference, ser. EuroSys ’18. New York, NY, USA: ACM, 2018, pp. 3:1–3:14. [Online]. Available: http://doi.acm.org/10.1145/3190508.3190517
- [145] C. Delimitrou and C. Kozyrakis, “Paragon: Qos-aware scheduling for heterogeneous datacenters,” in Proceedings of the Eighteenth International Conference on Architectural Support for Programming Languages and Operating Systems, ser. ASPLOS ’13. New York, NY, USA: ACM, 2013, pp. 77–88. [Online]. Available: http://doi.acm.org/10.1145/2451116.2451125
- [146] N. P. Jouppi, C. Young, N. Patil, D. Patterson, G. Agrawal, R. Bajwa, S. Bates, S. Bhatia, N. Boden, A. Borchers, R. Boyle, P.-l. Cantin, C. Chao, C. Clark, J. Coriell, M. Daley, M. Dau, J. Dean, B. Gelb, T. V. Ghaemmaghami, R. Gottipati, W. Gulland, R. Hagmann, C. R. Ho, D. Hogberg, J. Hu, R. Hundt, D. Hurt, J. Ibarz, A. Jaffey, A. Jaworski, A. Kaplan, H. Khaitan, D. Killebrew, A. Koch, N. Kumar, S. Lacy, J. Laudon, J. Law, D. Le, C. Leary, Z. Liu, K. Lucke, A. Lundin, G. MacKean, A. Maggiore, M. Mahony, K. Miller, R. Nagarajan, R. Narayanaswami, R. Ni, K. Nix, T. Norrie, M. Omernick, N. Penukonda, A. Phelps, J. Ross, M. Ross, A. Salek, E. Samadiani, C. Severn, G. Sizikov, M. Snelham, J. Souter, D. Steinberg, A. Swing, M. Tan, G. Thorson, B. Tian, H. Toma, E. Tuttle, V. Vasudevan, R. Walter, W. Wang, E. Wilcox, and D. H. Yoon, “In-datacenter performance analysis of a tensor processing unit,” in Proceedings of the 44th Annual International Symposium on Computer Architecture, ser. ISCA ’17. New York, NY, USA: ACM, 2017, pp. 1–12. [Online]. Available: http://doi.acm.org/10.1145/3079856.3080246
- [147] B. Sharma, V. Chudnovsky, J. L. Hellerstein, R. Rifaat, and C. R. Das, “Modeling and synthesizing task placement constraints in google compute clusters,” in Proceedings of the 2Nd ACM Symposium on Cloud Computing, ser. SOCC ’11. New York, NY, USA: ACM, 2011, pp. 3:1–3:14. [Online]. Available: http://doi.acm.org/10.1145/2038916.2038919
- [148] P. Garefalakis, K. Karanasos, P. Pietzuch, A. Suresh, and S. Rao, “Medea: Scheduling of long running applications in shared production clusters,” in Proceedings of the Thirteenth EuroSys Conference, ser. EuroSys ’18. New York, NY, USA: ACM, 2018, pp. 4:1–4:13. [Online]. Available: http://doi.acm.org/10.1145/3190508.3190549
- [149] K. Hightower, B. Burns, and J. Beda, Kubernetes: Up and Running Dive into the Future of Infrastructure, 1st ed. O’Reilly Media, Inc., 2017.
- [150] V. Jalaparti, P. Bodik, I. Menache, S. Rao, K. Makarychev, and M. Caesar, “Network-aware scheduling for data-parallel jobs: Plan when you can,” in Proceedings of the 2015 ACM Conference on Special Interest Group on Data Communication, ser. SIGCOMM ’15. New York, NY, USA: ACM, 2015, pp. 407–420. [Online]. Available: http://doi.acm.org/10.1145/2785956.2787488
- [151] H. Ballani, P. Costa, T. Karagiannis, and A. Rowstron, “Towards predictable datacenter networks,” in Proceedings of the ACM SIGCOMM 2011 Conference, ser. SIGCOMM ’11. New York, NY, USA: ACM, 2011, pp. 242–253. [Online]. Available: http://doi.acm.org/10.1145/2018436.2018465
- [152] V. Persico, P. Marchetta, A. Botta, and A. Pescapè, “Measuring network throughput in the cloud,” Comput. Netw., vol. 93, no. P3, pp. 408–422, Dec. 2015. [Online]. Available: http://dx.doi.org/10.1016/j.comnet.2015.09.037
- [153] V. Persico, P. Marchetta, A. Botta, and A. Pescape, “On network throughput variability in microsoft azure cloud,” in 2015 IEEE Global Communications Conference (GLOBECOM), Dec 2015, pp. 1–6.
- [154] N. G. Duffield, P. Goyal, A. Greenberg, P. Mishra, K. K. Ramakrishnan, and J. E. van der Merive, “A flexible model for resource management in virtual private networks,” in Proceedings of the Conference on Applications, Technologies, Architectures, and Protocols for Computer Communication, ser. SIGCOMM ’99. New York, NY, USA: ACM, 1999, pp. 95–108. [Online]. Available: http://doi.acm.org/10.1145/316188.316209
- [155] C. Guo, G. Lu, H. J. Wang, S. Yang, C. Kong, P. Sun, W. Wu, and Y. Zhang, “Secondnet: A data center network virtualization architecture with bandwidth guarantees,” in Proceedings of the 6th International COnference, ser. Co-NEXT ’10. New York, NY, USA: ACM, 2010, pp. 15:1–15:12. [Online]. Available: http://doi.acm.org/10.1145/1921168.1921188
- [156] H. Rodrigues, J. R. Santos, Y. Turner, P. Soares, and D. Guedes, “Gatekeeper: Supporting bandwidth guarantees for multi-tenant datacenter networks,” in Proceedings of the 3rd Conference on I/O Virtualization, ser. WIOV’11. Berkeley, CA, USA: USENIX Association, 2011, pp. 6–6. [Online]. Available: http://dl.acm.org/citation.cfm?id=2001555.2001561
- [157] V. Jeyakumar, M. Alizadeh, D. Mazières, B. Prabhakar, C. Kim, and A. Greenberg, “EyeQ: Practical Network Performance Isolation at the Edge,” in Proceedings of the 10th USENIX Conference on Networked Systems Design and Implementation, ser. nsdi’13. Berkeley, CA, USA: USENIX Association, 2013, pp. 297–312. [Online]. Available: http://dl.acm.org/citation.cfm?id=2482626.2482656
- [158] L. Popa, P. Yalagandula, S. Banerjee, J. C. Mogul, Y. Turner, and J. R. Santos, “Elasticswitch: Practical work-conserving bandwidth guarantees for cloud computing,” in Proceedings of the ACM SIGCOMM 2013 Conference on SIGCOMM, ser. SIGCOMM ’13. New York, NY, USA: ACM, 2013, pp. 351–362. [Online]. Available: http://doi.acm.org/10.1145/2486001.2486027
- [159] D. Xie, N. Ding, Y. C. Hu, and R. Kompella, “The only constant is change: Incorporating time-varying network reservations in data centers,” in Proceedings of the ACM SIGCOMM 2012 Conference on Applications, Technologies, Architectures, and Protocols for Computer Communication, ser. SIGCOMM ’12. New York, NY, USA: ACM, 2012, pp. 199–210. [Online]. Available: http://doi.acm.org/10.1145/2342356.2342397
- [160] J. Lee, Y. Turner, M. Lee, L. Popa, S. Banerjee, J.-M. Kang, and P. Sharma, “Application-driven bandwidth guarantees in datacenters,” in Proceedings of the 2014 ACM Conference on SIGCOMM, ser. SIGCOMM ’14. New York, NY, USA: ACM, 2014, pp. 467–478. [Online]. Available: http://doi.acm.org/10.1145/2619239.2626326
- [161] S. Angel, H. Ballani, T. Karagiannis, G. O’Shea, and E. Thereska, “End-to-end performance isolation through virtual datacenters,” in Proceedings of the 11th USENIX Conference on Operating Systems Design and Implementation, ser. OSDI’14. Berkeley, CA, USA: USENIX Association, 2014, pp. 233–248. [Online]. Available: http://dl.acm.org/citation.cfm?id=2685048.2685067
- [162] A. Shieh, S. Kandula, A. Greenberg, C. Kim, and B. Saha, “Sharing the data center network,” in Proceedings of the 8th USENIX Conference on Networked Systems Design and Implementation, ser. NSDI’11. Berkeley, CA, USA: USENIX Association, 2011, pp. 309–322. [Online]. Available: http://dl.acm.org/citation.cfm?id=1972457.1972489
- [163] V. T. Lam, S. Radhakrishnan, R. Pan, A. Vahdat, and G. Varghese, “Netshare and stochastic netshare: Predictable bandwidth allocation for data centers,” SIGCOMM Comput. Commun. Rev., vol. 42, no. 3, pp. 5–11, Jun. 2012. [Online]. Available: http://doi.acm.org/10.1145/2317307.2317309
- [164] L. Popa, G. Kumar, M. Chowdhury, A. Krishnamurthy, S. Ratnasamy, and I. Stoica, “Faircloud: Sharing the network in cloud computing,” in Proceedings of the ACM SIGCOMM 2012 Conference on Applications, Technologies, Architectures, and Protocols for Computer Communication, ser. SIGCOMM ’12. New York, NY, USA: ACM, 2012, pp. 187–198. [Online]. Available: http://doi.acm.org/10.1145/2342356.2342396
- [165] H. Ballani, K. Jang, T. Karagiannis, C. Kim, D. Gunawardena, and G. O’Shea, “Chatty tenants and the cloud network sharing problem,” in Proceedings of the 10th USENIX Conference on Networked Systems Design and Implementation, ser. nsdi’13. Berkeley, CA, USA: USENIX Association, 2013, pp. 171–184. [Online]. Available: http://dl.acm.org/citation.cfm?id=2482626.2482644
- [166] K. LaCurts, S. Deng, A. Goyal, and H. Balakrishnan, “Choreo: Network-aware task placement for cloud applications,” in Proceedings of the 2013 Conference on Internet Measurement Conference, ser. IMC ’13. New York, NY, USA: ACM, 2013, pp. 191–204. [Online]. Available: http://doi.acm.org/10.1145/2504730.2504744
- [167] K. LaCurts, J. C. Mogul, H. Balakrishnan, and Y. Turner, “Cicada: Introducing predictive guarantees for cloud networks,” in Proceedings of the 6th USENIX Conference on Hot Topics in Cloud Computing, ser. HotCloud’14. Berkeley, CA, USA: USENIX Association, 2014, pp. 14–14. [Online]. Available: http://dl.acm.org/citation.cfm?id=2696535.2696549
- [168] K. Jang, J. Sherry, H. Ballani, and T. Moncaster, “Silo: Predictable message latency in the cloud,” in Proceedings of the 2015 ACM Conference on Special Interest Group on Data Communication, ser. SIGCOMM ’15. New York, NY, USA: ACM, 2015, pp. 435–448. [Online]. Available: http://doi.acm.org/10.1145/2785956.2787479
- [169] T. Zhu, D. S. Berger, and M. Harchol-Balter, “Snc-meister: Admitting more tenants with tail latency slos,” in Proceedings of the Seventh ACM Symposium on Cloud Computing, ser. SoCC ’16. New York, NY, USA: ACM, 2016, pp. 374–387. [Online]. Available: http://doi.acm.org/10.1145/2987550.2987585
- [170] D. A. Popescu and A. W. Moore, “Network Latency and Application Performance Aware Cluster Scheduling in Data Centers,” IEEE Network, vol. 36, no. 2, pp. 58–65, 2022.
- [171] J. Dean and L. A. Barroso, “The tail at scale,” Commun. ACM, vol. 56, no. 2, pp. 74–80, Feb. 2013. [Online]. Available: http://doi.acm.org/10.1145/2408776.2408794
- [172] D. Zats, T. Das, P. Mohan, D. Borthakur, and R. Katz, “Detail: Reducing the flow completion time tail in datacenter networks,” SIGCOMM Comput. Commun. Rev., vol. 42, no. 4, pp. 139–150, Aug. 2012. [Online]. Available: http://doi.acm.org/10.1145/2377677.2377711
- [173] Y. Xu, Z. Musgrave, B. Noble, and M. Bailey, “Bobtail: Avoiding long tails in the cloud,” in Proceedings of the 10th USENIX Conference on Networked Systems Design and Implementation, ser. nsdi’13. Berkeley, CA, USA: USENIX Association, 2013, pp. 329–342. [Online]. Available: http://dl.acm.org/citation.cfm?id=2482626.2482658
- [174] A. W. Moore and D. Zuev, “Internet traffic classification using bayesian analysis techniques,” in Proceedings of the 2005 ACM SIGMETRICS International Conference on Measurement and Modeling of Computer Systems, ser. SIGMETRICS ’05. New York, NY, USA: ACM, 2005, pp. 50–60. [Online]. Available: http://doi.acm.org/10.1145/1064212.1064220
- [175] H. Mao, M. Schwarzkopf, S. B. Venkatakrishnan, Z. Meng, and M. Alizadeh, “Learning Scheduling Algorithms for Data Processing Clusters,” in Proceedings of the ACM Special Interest Group on Data Communication, ser. SIGCOMM ’19. New York, NY, USA: Association for Computing Machinery, 2019, pp. 270–288. [Online]. Available: https://doi.org/10.1145/3341302.3342080
- [176] R. Grandl, S. Kandula, S. Rao, A. Akella, and J. Kulkarni, “GRAPHENE: Packing and dependency-aware scheduling for data-parallel clusters,” in 12th USENIX Symposium on Operating Systems Design and Implementation (OSDI 16). Savannah, GA: USENIX Association, Nov. 2016, pp. 81–97. [Online]. Available: https://www.usenix.org/conference/osdi16/technical-sessions/presentation/grandl_graphene
- [177] H. Mao, M. Alizadeh, I. Menache, and S. Kandula, “Resource management with deep reinforcement learning,” in Proceedings of the 15th ACM Workshop on Hot Topics in Networks, ser. HotNets ’16. New York, NY, USA: Association for Computing Machinery, 2016, pp. 50–56. [Online]. Available: https://doi.org/10.1145/3005745.3005750
- [178] D. Zhang, D. Dai, Y. He, F. S. Bao, and B. Xie, RLScheduler: An Automated HPC Batch Job Scheduler Using Reinforcement Learning. IEEE Press, 2020.
- [179] K. Rzadca, P. Findeisen, J. Swiderski, P. Zych, P. Broniek, J. Kusmierek, P. Nowak, B. Strack, P. Witusowski, S. Hand, and J. Wilkes, “Autopilot: Workload autoscaling at google,” in Proceedings of the Fifteenth European Conference on Computer Systems, ser. EuroSys ’20. New York, NY, USA: Association for Computing Machinery, 2020. [Online]. Available: https://doi.org/10.1145/3342195.3387524
- [180] S. Bergsma, T. Zeyl, A. Senderovich, and J. C. Beck, “Generating complex, realistic cloud workloads using recurrent neural networks,” in Proceedings of the ACM SIGOPS 28th Symposium on Operating Systems Principles, ser. SOSP ’21. New York, NY, USA: Association for Computing Machinery, 2021, pp. 376–391. [Online]. Available: https://doi.org/10.1145/3477132.3483590
- [181] C. Avin, M. Ghobadi, C. Griner, and S. Schmid, “On the complexity of traffic traces and implications,” in Abstracts of the 2020 SIGMETRICS/Performance Joint International Conference on Measurement and Modeling of Computer Systems, ser. SIGMETRICS ’20. New York, NY, USA: Association for Computing Machinery, 2020, pp. 47–48. [Online]. Available: https://doi.org/10.1145/3393691.3394205