Fine-Grained Building Function Recognition from Street-View Images via Geometry-Aware Semi-Supervised Learning
Abstract
The functional diversity of urban buildings is crucial for planning and optimizing urban infrastructure and public services, and for understanding patterns of human activity. Street-view images capture rich exterior information of buildings, aiding in identifying their functions and analyzing human activities. However, fine-grained building function annotation in street-view images is currently scarce and the annotation process is difficult. In this work, we propose a geometry-aware semi-supervised method for fine-grained building function recognition. This method leverages the geometric relationships between multi-source data to improve the accuracy of pseudo labels in semi-supervised learning, extending the task’s scope and making it applicable to cross-categorization systems of building function recognition. Firstly, we design an online semi-supervised pre-training stage, which facilitates the precise acquisition of building facade location information in street-view images. In the second stage, we propose a geometry-aware coarse annotation generation module. This module effectively combines GIS data and street-view data based on the geometric relationships, improving the accuracy of pseudo annotations. In the third stage, we combine the newly generated coarse annotations with the existing labeled dataset to achieve fine-grained functional recognition of buildings across multiple cities at a large scale. Extensive experiments demonstrate that our proposed framework exhibits superior performance in fine-grained functional recognition of buildings. Within the same categorization system, it achieves improvements of 7.6% and 4.8% compared to fully-supervised methods and state-of-the-art semi-supervised methods, respectively. Additionally, our method also performs well in cross-city tasks, i.e., extending the model trained on OmniCity (New York) to new areas (i.e., Los Angeles and Boston). This study provides a novel solution for the fine-grained function recognition of large-scale buildings across multiple cities, offering essential data for understanding urban infrastructure planning, human activity patterns, and the interactions between humans and buildings.
keywords:
Building function, Semi-supervised learning, Object detection, Street-view images, GIS data[1]organization=School of Geospatial Engineering and Science, Sun Yat-Sen University, state=Zhuhai, country=China \affiliation[2]organization=State Key Laboratory of Information Engineering in Surveying, Mapping and Remote Sensing, Wuhan University, state=Wuhan, country=China \affiliation[3]organization=Department of Earth System Science, Tsinghua University,country=China \affiliation[4]organization=Shanghai Artificial Intelligence Lab,country=China
1 Introduction
Buildings are a fundamental component of urban infrastructure, playing a direct role in the economic and cultural development of cities [1], and have attracted considerable academic attention [2, 3, 4, 5, 6]. In addition, the function of buildings are closely related to the lives of people in cities. For instance, people tend to choose relaxed and free shopping malls for entertainment and other activities over formal office buildings. Moreover, knowing the locations of office buildings, factories, research institutions, and other professional functional buildings can help people plan their commuting routes and schedules. Therefore, studying the detailed functions of buildings is highly significant for understanding the interaction between humans and urban infrastructure. However, the fine-grained functional information of buildings in some areas currently suffers from issues such as poor timeliness and missing information. This is mainly due to the fact that the majority of gaining the function data still rely on costly manual collection, which is not conducive to efficient urban understanding and management [7]. Therefore, researching rapid and intelligent methods for large-scale fine-grained urban building function recognition is of significant importance [8, 9, 10].
Street-view images have become a very popular ground-level data source in recent years, accurately mapping the physical spaces of urban streets and demonstrating substantial potential for building function recognition[11, 12, 13, 14, 15]. There have been abundant annotations for non-building objects in street-view images proposed by current studies, such as cars, pedestrians, and road signs [16, 17, 18]. However, annotations for buildings, especially fine-grained functional annotations, are relatively lacking. This is because buildings are large in size, and deformations are more pronounced in street-view images, especially in panoramic views, which increases the difficulty of building annotation. In addition, most existing street-view annotation data are manually labeled, which is costly and inefficient [19, 20]. For data-dependent supervised models, this is not conducive to achieving high-precision and large-scale recognition of urban building functions. In contrast, satellite images and GIS data from the top-down perspective are relatively abundant in annotations, such as building footprints and attribute information [21, 22]. However, due to differences in data collection perspectives and potential positioning errors, how to effectively combine these two types of data to automatically generate annotations in the street-view perspective is a challenging problem that warrants further research.
Fully-supervised deep learning methods are the mainstream approach for fine-grained building function recognition [23, 24]. However, the existing labeled information does not meet the high demands for data quantity and quality required by fully supervised methods. Semi-supervised learning combines the ideas of both supervised and unsupervised learning, effectively reducing the model’s dependency on labeled data. The most common semi-supervised learning framework is based on pseudo-label generation, which, through the assumption between predicted samples and learning targets, requires only a small amount of labeled data. This approach extends the knowledge learned from the known domain to the target domain in the form of pseudo-labels [25, 26]. Scholars have already applied this method to urban tasks with promising results [27, 28, 29, 30]. However, for more complex task scenarios such as fine-grained building function recognition, semi-supervised methods relying on pseudo-label generation still face challenges such as low pseudo-label accuracy and limited applicability to a single classification system.
To achieve fine-grained building function recognition, so as to further provide large-scale and high-precision data support for the analysis of human social activities, we propose a geometry-aware semi-supervised method, as shown in Figure 1. This method effectively utilizes GIS data and street-view images, enhancing the accuracy of pseudo-label generation in semi-supervised methods, and reduces the model’s dependence on annotated samples. Specifically, it mainly includes three stages, building facade detection, building function annotation generation, and fine-grained building function recognition. In the first stage, we employ a semi-supervised framework for pre-training, which requires only a small amount of labeled data to obtain a pre-trained model capable of detecting building facades over a wide area. In the second stage, we introduce a coarse annotation generation module that leverages geometric angular relationships to align building function information from GIS data with building facade detected by the pre-trained model. In the third stage, we reorganize the existing labeled data and the coarse annotations obtained from the second stage, feeding them into a single-stage object detection network, which accomplished fine-grained building function recognition.
Our method outperforms fully-supervised methods by 7.9% and achieves the best performance among state-of-the-art semi-supervised methods in New York City, using only 10% of the labeled data. Furthermore, unlike previous semi-supervised frameworks, the multi-stage training strategy enables our method to accomplish pixel-level fine-grained building function recognition in cross-categorization systems building function recognition (New York - Los Angeles, New York - Boston). Our method enables rapid and efficient acquisition of extensive fine-grained building function data, which is highly significant for analyzing human activities, urban infrastructure layout, and the interactions between the two.
Our main contributions are summarized as follows:
-
1.
We propose a geometry-aware semi-supervised method for fine-grained building function recognition. This method enables large-scale function recognition with a small number of samples.
-
2.
We propose a coarse annotation generation module that effectively utilizes multi-source urban data. By leveraging the geometric relationship between different perspectives of GIS data and street-view data, this module enhances the accuracy of pseudo-labels.
-
3.
We construct datasets for new cities, i.e., Los Angeles and Boston, based on the CityAnnotator proposed in our previous work [23]. Experimental results show that our method exhibits strong robustness in cross-categorization tasks, enabling the acquisition of large-scale, multi-city fine-grained building function data. This provides data support for analyzing interactions between humans and infrastructure within cities.
2 Related work
2.1 Fine-grained building attributes recognition based on street-view images
Urban buildings are part of the urban infrastructure and possess a variety of attributes. These attributes can be primarily categorized into geometric-physical attributes related to the urban structural form and socio-economic functions associated with human social behaviors such as production and consumption. For the first aspect, the geometric-physical attributes of buildings include height, shape, and density, with the estimation of building height being a key element in the study of urban three-dimensional morphology [31]. Some studies [32, 33] used fully convolutional networks (FCNs) to identify building instances from street-view images and then mapped them to real-world buildings based on geometric relations to achieve accurate height estimation. Other studies [34, 35] analyzed the facade structures of buildings based on street-view images, thoroughly describing the shapes of buildings’ windows and doors. Zhou et al. [19] proposed a street-view dataset, generated various annotations for the overall three-dimensional structure of buildings based on CAD, and provided benchmark experiments for multiple tasks.
The second aspect pertains to the socio-economic functions of buildings, which can be further categorized. The first category of socio-economic function refers to an assessment of the individual functionality of a single building. For instance, some researchers used street-view data to sort urban buildings into categories like residential, commercial, and industrial [36, 37], that support essential societal activities, highlighting the need for detailed building function information. Then, Kang et al. [24] used several street-view images from different angles of the same building for a more precise function classification. Meanwhile, some studies [38, 39] applied deep learning methods to estimate building ages, there were also some studies used street-view images to automatically predict buildings’ energy use [40] and materials [41]. The other category of socio-economic function considers the building entities in conjunction with the city environment. For instance, Hu et al. [42] propose an urban canyon classification framework, considering building heights and road widths. Zhao et al. [43] estimated property prices by taking into account buildings, human factors, and environmental factors, while Yao et al. [44] explored the relationship between the job-housing attributes of buildings and human behavior by combining deep learning methods with street-view images.
In summary, the rich and detailed building facade features in street-view images can effectively improve the accuracy of fine-grained building function recognition, especially for socio-economic functions. However, fine-grained functional annotation data for buildings from the street-view perspective is extremely scarce. This is because the current street-view annotation process still relies on costly manual annotation. The scarcity of fine-grained building functional annotation data directly leads to the fact that fully supervised learning methods, which heavily rely on annotated data, have difficulties in achieving high-precision large-scale building function recognition.
2.2 Semi-supervised learning
Self-training with pseudo-labeling and its variations has achieved significant success in the semi-supervised learning field [45, 46, 25, 47, 48]. Semi-supervised frameworks based on pseudo-labeling are generally implemented through the use of a teacher-student architecture. The teacher-student architecture defines two models, namely the teacher model and the student model. The teacher model is generated from the student model and is used to generate pseudo labels. The student model receives both pseudo labels and labeled data for training. The teacher-student architecture implements stages of pre-training, pseudo annotation generation, and mixed training to achieve detection over large areas with minimal data. However, the quality errors in pseudo labels generated by the pseudo annotation generation stage accumulate with increasing training iterations, leading to irreversible adverse outcomes. This is known as the phenomenon of confirmation bias.
To enhance the quality of pseudo-labels and address the resultant confirmation bias, numerous methods have been developed, primarily categorized into framework optimization methods and soft labeling methods. Framework optimization methods refer to those that aim to optimize the structure of semi-supervised models or introduce new rules, such as Mean-teacher [46], Unbias-teacher [47, 49], and Soft-teacher [25]. Among them, Mean-teacher introduces the EMA (Exponential Moving Average) rule. Unlike traditional teacher-student architectures that share training weights, in the Mean-teacher framework, the weights of the student model are generated through exponential moving average to form the teacher model, making the overall framework more lightweight and enhancing the performance of models. Building on EMA, Unbiasd-teacher, through a two-stage framework, uses pseudo labels to train the RPN network, alleviating overfitting caused by cognitive biases to some extent; Soft-teacher proposes a more flexible strategy that resolves the issue of positive sample loss due to high thresholds, further improving model robustness. Soft labeling methods, as opposed to directly predicting pseudo-labels on images, lean towards using smoother prediction rules. For instance, Humble-teacher [50] proposes a semi-supervised framework based on soft pseudo labels, obtaining labels from the class probabilities and offset prediction distributions of detection boxes in the training process. Dense-teacher [51] introduces depth estimation methods as an alternative to traditional pseudo-label generation methods, using depth prediction results to form constraints and enhance the quality of pseudo labels.
In summary, a variety of methods have been proposed to tackle cognitive biases inherent in pseudo-labeling-based approaches. Nonetheless, these techniques continue to overly depend on the model’s pseudo-label predictions, which can be particularly unreliable for more challenging tasks like building function recognition. Therefore, semi-supervised methods in specific scenarios still have significant room for improvement. Moreover, existing semi-supervised methods are typically applied within the same categorization system [52, 29, 53, 54] and lack cross-categorization system studies, indicating substantial potential for enhancing the generalization capabilities of semi-supervised models.
3 Datasets
3.1 Street-view dataset
There are currently many public street-view datasets available, which are used in various aspects of urban tasks [19, 55, 56, 20]. In our previous work, we introduced the OmniCity dataset [23], designed for omnipotent city understanding with multi-level and multi-view images. This dataset comprises over 100K accurately annotated images (in COCO format), covering 25K geographical locations in New York City. It consists of three sub-datasets: a street-level panoramic dataset, a mono-view dataset (sourced from Google Street View images), and a satellite-level imagery dataset (sourced from Google’s high-resolution satellite data), all geographically correlated with each other. The OmniCity dataset is now publicly available and can be found at http://city-super.github.io/omnicity/.
This study primarily focuses on the panoramic street-view dataset from the OmniCity dataset. We have adjusted and supplemented the dataset according to the task requirements, ultimately comprising a labeled training set with 3,100 images for semi-supervised training, a validation set with 3,300 images, and an Unlabeled set with 65,974 images. We have also collected street-view images from two new cities in the United States, Los Angeles and Boston, for conducting research on cross-categorization system fine-grained building function recognition. Each panoramic street-view image used in this work is in size and contains information on geographic coordinates, image acquisition time, panorama ID, north rotation, and zoom level. The details are shown in Figure 2 (a) and (b).
3.2 Building function and footprint information
The function information of buildings in the New York dataset originates from the government’s public dataset PLUTO111https://data.cityofnewyork.us/City-Government/Primary-Land-Use-Tax-Lot-Output-PLUTO-/64uk-42ks. By analyzing the similarity between categories and the number of samples, we merge the sixth and seventh categories which originally classified by OmniCity dataset. The final details of the building function categories of New York are shown in Table 1. The building function information for Los Angeles is sourced from the publicly available GIS dataset The General Plan Land Use222https://data.lacity.org/Housing-and-Real-Estate/General-Plan-Land-Use/tks4-u9wn by the Los Angeles City government. Overall, 35 areas were designated for planning, with a detailed classification of function displaying a clustered spatial distribution. We analyze each category and, based on the number of categories and the similarity of features between categories, merge them into 5 classes. The building function information in Boston is derived from the government dataset Analyze Boston333https://data.boston.gov/dataset/boston-buildings-with-roof-breaks. Initially, this dataset categorized buildings into 16 different types. After conducting similar analyses on quantity, distribution, etc., as done with Los Angeles, these are ultimately consolidated into 5 types of building functions. The details of the categories for Los Angeles and Boston are shown in Table 1. Additionally, OpenStreetMap (OSM) is one of the most widely used map data sources, providing globally standardized building footprint data. In this work, we will use building footprint data from OSM for the cities of New York, Los Angeles, and Boston, and combine it with the aforementioned building function information to assist in the annotation of Section 3.3 and the generation of building function annotations in Section 4.3.
| Categories | New York | Los Angeles | Boston |
|---|---|---|---|
| 1 | 1/2 family Buildings (C1) | Industrial & Manufacturing (L1) | Single Residential (B1) |
| 2 | Walk-up Buildings (C2) | Mixed Residential/Commercial (L2) | Multiple Residential (B2) |
| 3 | Elevator Buildings (C3) | Low Medium Residential (L3) | High Residential (B3) |
| 4 | Mixed-up Buildings (C4) | Low Residential (L4) | Commercial (B4) |
| 5 | Office Buildings (C5) | Others (L5) | Others (B5) |
| 6 | Industry/Transportation/Government Facilities (C6) | - | - |
3.3 Street-view image annotation
In our previous work [23], we introduced a street-view image annotation tool called CityAnnotator. This tool can simulate the shooting scene of panoramic street-view images, enabling the conversion between panoramic and mono-view images. Annotations made in the mono-view can also be transformed back to the panoramic view, thus achieving high-precision annotation of panoramic images even in the presence of distortion. In addition, CityAnnotator also supports annotating three-dimensional layouts from two-dimensional scenes. In this work, to validate the capability of our method for adapting to fine-grained building function recognition in cross-categorization scenarios, we used this tool to create street-view datasets for two new cities, Los Angeles and Boston. During the construction process, we standardize the annotation criteria, focusing on the building facades at the center of the street view and ignoring buildings with significant deformation or severe occlusion at the edges. Additionally, we also performed a filtering process to ensure the dataset quality by removing street-view images containing only a small number of valid building facades. These datasets are highly valuable for analyzing urban infrastructure, human activities, and the interactions between them. By providing detailed information of building functions, they enable comprehensive studies on how different urban elements coexist and interact, contributing significantly to the planning and optimization of urban spaces. The source code of CityAnnotator will be publicly released.
4 Methods
4.1 The overview of fine-grained building function recognition method
In this section, we will first provide an overview of our geometry-aware semi-supervised method for fine-grained building function recognition. As illustrated in Figure 1, the geometry-aware semi-supervised method consists of three consecutive stages, the first stage of online pre-training, the second stage of offline label generation, and the third stage of online fine-grained building function recognition. Specifically, in the first stage, we employ a end-to-end semi-supervised framework and set up a completely online pre-training process. In the second stage, we design an offline coarse annotation generation module. Based on the angular relationship between existing GIS data and panoramic street-view images, we map the building functional information from GIS data to the street-view perspective. This, combined with the building facade information (bounding boxes) obtained after decoupling the prediction results, ultimately generate coarse annotations. In the third stage, these coarse annotations and labeled data are fed into a one-stage object detection network to achieve fine-grained building function recognition. The details of each stage are introduced as follows.
4.2 Online pre-training for building facade recognition
4.2.1 Semi-supervised network architecture
Semi-supervised models based on the teacher-student architecture often set a warm-up stage at the beginning of training, during which only the student model participates in the backward update. The purpose is to first allow the model to learn from a small amount of labeled data, thereby generating a more reliable teacher model. In this work, we separate the warm-up stage, forming it into an independent pre-training stage. Compared to the usual warm-up stage, which is fully-supervised training, we opt for semi-supervised training, training both labeled and unlabeled data. The advantage of this approach lies not only in expanding the scale of the task during the warm-up stage but also in learning building-related features from unknown areas in advance. Additionally, it’s worth noting that this stage remains a completely online process.
In this stage, both the teacher and student models are set to have the same structure, using RetinaNet [57] as the detection network, and leveraging a ResNet-101 backbone network pre-trained on ImageNet [58] to extract feature maps. Unlabeled data, before being input into the teacher model for pseudo annotation generation, first undergoes weak augmentation. After obtaining the prediction results, inspired by Consistent-teacher [48], we use a probability rule to filter out pseudo labels that are friendly to the student model. Subsequently, the unlabeled data goes through another round of strong augmentation and, along with the pseudo labels, is input into the student model until the model converges.
4.2.2 Semi-supervised network training
The training loss in the first stage can be viewed as consisting of a loss with labeled data and a loss with unlabeled data, as shown in the Eq. 1.
| (1) |
Where and denote the loss of labeled data and the loss of unlabeled data in the first stage, denotes the total loss of the first stage. While and represent the weights of each part of the loss. Now given labeled street-level images and unlabeled SVIs , each training batch comprises data from both datasets according to a pre-determied ratio. After data augmentation, each batch undergoes a feature extraction layer, obtaining a feature map. The two parts of the above loss can be denoted as:
| (2) |
| (3) |
where and are sampled from , is sampled from , is a pseudo-label obtained by inference from the teacher’s model, and the loss function of the two parts consists of two sub-loss functions, classification loss () and regression loss ().
4.3 Offline building function annotation generation
In standard semi-supervised frameworks, the teacher model generated by the student model using EMA [46] begins to participate in training after the warm-up stage, directly acting on unlabeled data to generate pseudo labels. However, the quality of pseudo labels predicted directly by the model can accumulate errors during the training process, ultimately having a significant impact on the final model. Therefore, to enhance the quality of pseudo annotations more effectively, this study introduces a coarse annotation generation module. It integrates more precise semantic information from GIS data, replacing the previously unstable category prediction results. Subsequently, by combining the semantic information with the decoupled facade information of buildings based the angular relationship between cross-view data, we generate coarse annotations of higher quality. This module specifically includes two parts: a. Cross-view data transformation, b. Cross-view data matching and filtering.
4.3.1 Cross-view data transformation
GIS data can provide a wealth of semantic information about buildings, detailed down to each individual structure. Through GIS data, we can obtain not only the fine-grained function of buildings but also the topological relationships between features from a top-down perspective. The first stage of the coarse annotation generation module proposed in this study will fully utilize the angular relationship between GIS data and street-view images, achieving the transformation of building semantic information in GIS data to the street-view perspective.
In practice, a panoramic camera cannot capture objects at an infinite distance, it has a set range of visibility. Our study primarily focuses on the buildings that fall within this range. We first set the position of the street-view camera, denoted as , based on the longitude and latitude of the street-view image capture point. Then, we quantify the aforementioned field of view into a circular area with as the origin and a radius . Lastly, we reflect this onto the data space of GIS data, as shown in Figure 3 (a). For the radius , we converted the longitude and latitude distances using the Eq. 4.
| (4) |
Where and represent the Euclidean distances in GIS map view, and represent the differences in longitude and latitude, respectively, between the target point and the street-view capture point. denotes the radius of the Earth, taking .
Subsequently, our study primarily employs a ray tracing algorithm [59] in GIS’s two-dimensional plane to match each angle within the camera’s field of view with a unique building. In GIS data, all geographical entities are converted into two-dimensional vector data. Assuming the wall of a building facing the street is denoted as , with infinite length, and represents a certain point on the wall, with and respectively indicating the two endpoints of a facade. At this time, a ray emitted from point simulates the camera’s line-of-sight, intersecting the wall at point . The distance set between the wall and the shooting point under this line-of-sight can be determined using the principle of similar triangles:
| (5) |
Where denotes the unit normal vector of the wall, denotes the unit vector of the line-of-sight direction (), and denotes the projection in the normal vector direction , and similarly denotes the projection of the line-of-sight unit vector in the normal vector direction. Taking into account the actual situation, we select the smallest value of from the set to determine the closest matched wall, and thereby uniquely identify the street-facing building that matches the line-of-sight.
Finally, we set the step size to and carried out a traversal of the line-of-sight, obtaining 360 ray tracing results. These elements are laid out in a one-dimensional coordinate system, as shown in Fig 3 (b), where different building walls intersecting with the line-of-sight are intuitively represented (in different colors). Then, using a known angular information, we can match the ray tracing results with the target buildings in the street-view image, namely the north pointing angle (). The north pointing angle is a pixel position on the image’s horizontal axis, which marks a specific direction of the panoramic image when it was taken, corresponding to the true north direction geographically. In summary, based on the ray tracing algorithm, we can analyze the visibility of buildings within the camera’s field of view and implement the perspective transformation of GIS data based on angular information, thus obtaining detailed function information of buildings from the street-view perspective.
4.3.2 Cross-view data matching and filtering
After multi-classes pre-training, the model has become adept at distinguishing the facade features of buildings under different classes, and achieving high precision in target localization. However, there remains significant uncertainty in the prediction results of the buildings’ functions due to the complicated features. Therefore, in the second stage of this module, we will decouple the results predicted by the pre-trained model, separating the bounding boxes and predicted categories, and focus solely on the higher-precision building facade information (Bounding box). Subsequently, by assigning the building function information converted from GIS data in the first stage and applying multiple filtering rules, we ultimately obtain high accuracy coarse annotations.
Firstly, for the decoupled bboxes, we noticed that selecting a fixed threshold leads to the loss of a significant amount of useful information. To mitigate this loss, this study designs a step for adaptive obtaining dynamic thresholds based on probabilistic rules. We randomly divide the input street-view images into several batches in a certain quantity. A probability model is fitted using the previous batch, and then the obtained model parameters are converted into thresholds for the next batch, which are applied as constraints in the subsequent batch.
After collecting the facade information of buildings, we need to achieve more refined matching with fine-grained building function information. To this end, we have designed two matching rules:
| (6) |
In which represent the angular interval of a building’s wall in the ray tracing results, and represents the midpoint position of the detection box. and respectively denote the intersection and union between the ray tracing results and the detection box. Since the final result of the ray tracing lacks upper and lower bounds, the intersection over union ratio here, denoted as , is actually the ratio of intersection to union for one-dimensional line segments. By these two rules, we assume that when the midpoint of a bbox is located within the angular interval of a building’s wall as per the ray tracing results, and at the same time, the one-dimensional intersection over union ratio exceeds a certain threshold, then the facade information and function information of the building can be correctly matched.
It is noteworthy that the decoupling step in the second stage of the coarse annotation generation module focuses the framework solely on the common positional information of all buildings. This has completely separated it from the attribute space of the buildings. By combining with the building function information from different regions’ GIS data converted in the first stage, it facilitates the accomplishment of cross-categorization systems tasks.
4.4 Online building function recognition
In the third stage, since the coarse annotations have already been obtained offline in the second stage, we fix the teacher model and use the loss function to only update an online one-stage object detection framework (the student model), simultaneously training both unlabeled and labeled data. For unlabeled data, we directly use coarse annotations to calculate the loss, similar to the calculation of loss with general pseudo labels. However, we assume that the teacher model has already converged, thus eliminating the need to generate the teacher model through EMA. Considering the imbalance of positive and negative samples in coarse annotations, we choose the Generalized Focal Loss (GFL) [60], an improvement on Focal Loss [57], for our loss function. GFL takes into account both the issue of sample imbalance and the quality of localization, which is very friendly for training in semi-supervised, unlabeled data regions. The loss for the third stage of training is as follows:
| (7) |
| (8) |
where and denote the loss of labeled data and the loss of unlabeled data along with coarse annotations, respectively. and represent the weights of each part of the loss. also includes both classification and regression losses. Additionally, this stage is essentially a completely online process. Through the training in this stage, we ultimately achieved large-scale, high-precision fine-grained building function recognition. It is worth noting that this stage is essentially a fully online process.
In summary, this study deconstructs the semi-supervised framework into three distinct stages, an online pre-training stage for building facade detection, a stage for generating coarse annotations combining GIS data and street-view images, and a stage for building function recognition based on these coarse annotations. Through these three stages, this study achieves fine-grained building function recognition across a wide range with small sample, efficiently acquiring urban building function data.
5 Experiment
5.1 Experiment setting
To ensure the fairness of our experiments, we conducted all experiments on 8 NVIDIA A100 (80G) GPUs. Our proposed fine-grained building function recognition method is developed based on MMDetection [61], employing a batch size of 5. The optimizer used is SGD with a learning rate of 0.01, momentum set to 0.9, and weight decay set to . The dynamic parameter for EMA used to update the teacher model was set to 0.9995. We first perform pre-training for approximately 24 epochs in the first stage of the method. Similarly, in the third stage of training, we also train for 24 epochs. We follow the data processing and data augmentation pipeline outlined in the soft-teacher framework [25]. Additionally, we initiate our model using a pre-trained ResNet-101 backbone from the ImageNet [58] dataset. For all other semi-supervised methods and fully-supervised methods employed in our experiments, default hyperparameters are utilized.
| Methods | Overall metrics (%) | AP of each categories (%) | ||||||||||
| C1 | C2 | C3 | C4 | C5 | C6 | |||||||
| RetinaNet [57] | 17.1 | 28.2 | 17.9 | 5.0 | 31.5 | 19.2 | 8.4 | 17.3 | 17.5 | 26.0 | 18.9 | 14.5 |
| FCOS [62] | 18.9 | 28.8 | 20.4 | 7.1 | 33.6 | 20.2 | 11.6 | 20.6 | 18.1 | 28.6 | 19.0 | 15.8 |
| GFL [60] | 19.8 | 28.5 | 21.1 | 7.5 | 40.1 | 20.8 | 10.8 | 22.7 | 21.2 | 30.2 | 17.7 | 16.1 |
| Faster R-CNN [63] | 17.8 | 28.2 | 19.2 | 1.0 | 29.3 | 18.8 | 9.4 | 21.7 | 17.4 | 26.9 | 15.7 | 15.4 |
| Cascade R-CNN [64] | 17.7 | 26.3 | 19.0 | 1.5 | 30.3 | 18.6 | 7.7 | 22.0 | 17.4 | 27.0 | 16.6 | 15.2 |
| Dynamic R-CNN [65] | 17.1 | 26.1 | 18.8 | 0.4 | 27.7 | 18.2 | 6.5 | 21.4 | 16.8 | 26.0 | 16.1 | 15.5 |
| Ours | 27.4 | 36.6 | 29.6 | 8.6 | 46.9 | 29.8 | 23.7 | 36.4 | 22.8 | 35.0 | 24.1 | 22.5 |

5.2 Evaluation metrics
In all of our experiments, we employed a set of metrics to assess the models’ performance in the task of fine-grained function extraction from buildings. Specifically, we utilized three metrics adapted from the COCO evaluation metrics [66]. These metrics include: Average precision (), average precision at 50% IoU (), average precision at 75% IoU (), average precision for small object (), average precision for medium object (), and average precision for large object ().
Furthermore, to validate the performance of our proposed coarse annotation generation module, we evaluated the accuracy of the coarse annotations. Specifically, we considered a coarse annotation to be correctly matched if the intersection over union (IoU) between the bbox and the ground truth is greater than 0.8, and the categories are correctly matched based on the geometric angle relationships. Subsequently, we calculated the proportion of these correctly matched annotations among the total coarse annotations. The calculation formula is as follows:
| (9) |
Through this index, we can intuitively see that the quality of coarse annotations is very close to manual annotations.
5.3 Experiment results
| Methods | Overall metrics (%) | AP of each categories (%) | ||||||||||
| C1 | C2 | C3 | C4 | C5 | C6 | |||||||
| Mean-teacher [46] | 22.5 | 31.2 | 24.0 | 8.4 | 33.4 | 23.6 | 8.7 | 28.3 | 19.7 | 33.1 | 22.8 | 21.1 |
| Soft-teacher [25] | 17.8 | 26.8 | 20.1 | 0.8 | 25.9 | 18.1 | 2.7 | 19.8 | 13.5 | 27.4 | 15.3 | 19.2 |
| PseCo [67] | 20.4 | 28.5 | 22.6 | 11.0 | 23.7 | 21.2 | 8.9 | 27.1 | 16.7 | 32.1 | 16.9 | 21.5 |
| ARSL [68] | 12.7 | 29.5 | 7.6 | 5.2 | 22.0 | 13.8 | 5.3 | 13.3 | 12.4 | 19.4 | 13.7 | 12.2 |
| Consistent-teacher [48] | 22.6 | 30.3 | 24.7 | 3.6 | 29.9 | 24.7 | 7.9 | 28.7 | 20.2 | 31.4 | 25.2 | 22.3 |
| Ours | 27.4 | 36.6 | 29.6 | 8.6 | 46.9 | 29.8 | 23.7 | 36.4 | 22.8 | 35.0 | 24.1 | 22.5 |

5.3.1 Compare to fully-supervised methods
We conduct a series of comparative experiments on the New York street-view dataset, which including several fully-supervised methods. The fully-supervised methods compromise one-stage RetinaNet [57], FCOS [62], and GFL [60], as well as two-stage Faster R-CNN [63], Cascade R-CNN [64], and Dynamic R-CNN [65].
In the comparative experiments of this section, both the fully-supervised methods and our geometry-aware semi-supervised method utilize the same labeled data. As shown in Table 2, our method has achieved significant improvements compared to all the fully-supervised methods, with at least 7.6%, 7.8%, and 8.5% improvements in , , and , respectively. This indicates that under the condition of having a smaller amount of labeled data, the performance and task scale of fully-supervised models are limited, while semi-supervised methods show better robustness and generalization ability. Additionally, we found that one-stage object detection models perform better than two-stage models in our task setting. One-stage models also have a more lightweight framework compared to two-stage models, which is why we opted for a one-stage object detection model in the third stage of our proposed method.
From the perspective of individual categories, our method has also achieved significant improvements, with the AP for C1 and C2 exceeding 10%. Figure 4 visualizes the results of fully-supervised methods compared with our method, where the first three columns intuitively show that, all other fully-supervised methods have misidentified the categories (C3 misclassified as C4, C5 misclassified as C2, C6 misclassified as C3), while the remaining two columns demonstrate that our method has more stable recognition capabilities. Overall, compared with fully-supervised methods, our geometry-aware semi-supervised method for fine-grained building function recognition effectively reduces the dependence on labeled data and enables more efficient assistance in understanding the interactions between human behavior and buildings.
5.3.2 Compare to semi-supervised methods
We also compared our geometry-aware semi-supervised method with several semi-supervised methods, including the newly proposed Consistent-teacher [48] and ARSL [68], both of which discuss the issue of pseudo annotation localization quality. In addition, we compare our method with Mean-teacher [46], PseCo [67], and Soft-teacher [25]. The Mean-teacher approach not only refines the teacher model but also incorporates consistency learning, whereas PseCo, which also addresses the consistency challenge, represents a two-stage semi-supervised object detection framework. The Soft-teacher proposes a softer solution to the threshold problem. All these semi-supervised methods [48, 46, 67, 66] have been commonly used as comparison methods in semi-supervised learning.
Our method has shown improvements over the state-of-the-art semi-supervised framework, Consistent-teacher, in , , , , and by 4.8%, 6.3%, 4.9%, 5.0%, 17.0%, and 5.1%, respectively, as shown in Table 3, demonstrating better generalization ability. In detecting targets of different sizes, PseCo, proposed in 2022, exhibited superior performance in detecting small targets. However, it still lagged behind our method by 23.2% in medium target detection and by 6.1% in large target detection, respectively. This indicates that our method has a more balanced performance in the task of fine-grained building function recognition.
As shown in Table 3, our method has also achieved certain improvements in categories, with C1 showing a 14.8% improvement over the best-performing method. We found that, regardless of whether it is a fully-supervised or semi-supervised method, there are certain differences in the indicators between different categories, with C2 and C4 having the best detection accuracy, and C1 and C3 being relatively poor. Although we have noticed the phenomenon of sample number imbalance and have conducted relevant data processing, there is still a gap of more than 10%. This may be related to the complexity of the features between different categories. However, our method still possesses the best performance.
Figure 5 shows the visualization results of our method compared with other semi-supervised methods. It can be seen that our geometry-aware semi-supervised framework has good robustness in predicting categories under different scenarios, as well as high-quality localization. Additionally, our model demonstrates high adaptability, exhibiting strong distinguishing capabilities for easily confused categories and detection targets of varying sizes. In summary, compared to semi-supervised methods, our approach effectively utilizes GIS data on building function and footprint information to enhance the accuracy of pseudo-labels, thereby improving the overall performance of the semi-supervised method and providing a new solution for fine-grained building function recognition.
| Methods | Labeled-unlabeled ratio | Metrics (%) | AP of each categories (%) | ||||||||||
|---|---|---|---|---|---|---|---|---|---|---|---|---|---|
| C1 | C2 | C3 | C4 | C5 | C6 | ||||||||
| GFL [60] | Labeled only | 19.8 | 28.5 | 21.1 | 7.5 | 40.1 | 20.8 | 10.8 | 22.7 | 21.2 | 30.2 | 17.7 | 16.1 |
| Consistent-teacher [48] | 20.0 | 27.2 | 21.4 | 7.9 | 26.5 | 21.6 | 6.0 | 28.5 | 17.8 | 30.9 | 20.6 | 16.3 | |
| 21.3 | 28.4 | 22.9 | 4.2 | 25.1 | 23.2 | 4.1 | 30.7 | 17.6 | 33.0 | 23.8 | 18.8 | ||
| 22.6 | 30.3 | 24.7 | 3.6 | 29.9 | 24.7 | 7.9 | 28.7 | 20.2 | 31.4 | 25.2 | 22.3 | ||
| Ours | 24.5 | 33.5 | 26.4 | 8.6 | 46.6 | 25.9 | 18.7 | 31.5 | 20.3 | 33.8 | 21.0 | 21.4 | |
| 26.0 | 35.0 | 27.9 | 10.1 | 45.9 | 28.0 | 22.4 | 33.5 | 20.9 | 35.0 | 23.9 | 20.1 | ||
| 27.4 | 36.6 | 29.6 | 8.6 | 46.9 | 29.8 | 23.7 | 36.4 | 22.8 | 35.0 | 24.1 | 22.5 | ||
6 Discussion
6.1 The scalability of our method using different sizes of unlabeled data
Expanding the scale of research is of great practical significance. To further discuss the scalability ability of our proposed fine-grained building function recognition method, we simulate different task scales using various label-unlabeled ratios. With the number of labeled data held constant, we use label-unlabeled ratios of , , and , respectively. In addition, we also compare the scenario with only labeled data (fully-supervised), with results shown in Table 4.
We also compare our approach with a state-of-the-art semi-supervised method, setting three different ratios alike. It is evident that, in contrast to fully-supervised training limited to a small scale, semi-supervised methods achieve varying degrees of accuracy improvement as the scale of research changes. With slight improvements over the Consistent-teacher by 0.2%, 1.5%, and 2.8% in , , and , our method exhibits significant enhancements of 4.7%, 6.2%, and 7.6%. This demonstrates that our method can sustain relatively stable performance and exhibits superior scalability, enabling it to handle an increasing number of unknown scenarios in urban environments and to expand the scope of research effectively.
Additionally, from the perspective of individual categories, as the scale of the study increases, our method results in a uniform increase in among categories without fluctuations, while the Consistent-teacher model exhibits greater variability. For example, when the ratio shifts from to , the accuracy for C1, C3, C6, and C7 increases, whereas it decreases for C2 and C4. Under the same conditions, apart from C4, whose remains unchanged, our method sees improvements in the other five categories. This further demonstrates the stronger robustness of our proposed method.
6.2 Ablation study of the coarse annotations generation module
In this section, we will analyze the important parameters of the coarse annotation generation module of our proposed fine-grained building function recognition method. These parameters include the field of view radius for ray tracing and the threshold for decoupling bboxes.
In the coarse annotation generation module, we quantified the visible range of a panoramic camera into a circular area with a radius within the GIS data space. The ray tracing algorithm will primarily analyze the visibility of buildings within that range. According to the lane width standards provided in official documents, the width of a single lane in urban areas, including arterial and collector roads, is approximately 3.0-3.6 meters444https://safety.fhwa.dot.gov/geometric/pubs/mitigationstrategies/chapter3/3_lanewidth.cfm. Assuming the roads in the city are uniformly 10m wide (double lanes and sidewalks), we conducted experiments with radius widths of 30m, 50m, 70m and 100m to study the impact of different distances on the performance of the coarse annotation generation module and the final model.
As illustrated in Figure 6, when the value is 30m, only a few buildings can be tracked in single road situation, and in the case of cross road, there are even no visible buildings. When the value is set to 100m, it can be seen that a larger number of buildings can be tracked on the GIS map through the algorithm. However, when reflected in the street-view perspective, many of the tracked results are quite small, evidently exceeding the capture range of the panoramic street-view camera. When is set to 50m and 70m, the tracking results of both are close to each other and are more in line with the real world.
| Methods | Metrics (%) | AP of each categories (%) | |||||||||||
|---|---|---|---|---|---|---|---|---|---|---|---|---|---|
| C1 | C2 | C3 | C4 | C5 | C6 | ||||||||
| Ours (R=30m) | 95.6 | 21.9 | 30.0 | 23.6 | 4.0 | 36.7 | 23.8 | 2.0 | 27.4 | 16.4 | 30.5 | 18.8 | 18.2 |
| Ours (R=50m) | 96.5 | 27.4 | 36.6 | 29.6 | 8.6 | 46.9 | 29.8 | 23.7 | 36.4 | 22.8 | 35.0 | 24.1 | 22.5 |
| Ours (R=70m) | 97.0 | 27.1 | 37.2 | 29.3 | 5.7 | 47.7 | 28.9 | 20.9 | 30.4 | 24.6 | 34.8 | 27.3 | 24.6 |
| Ours (R=100m) | 96.9 | 26.8 | 35.8 | 28.9 | 15.9 | 40.3 | 28.0 | 22.0 | 33.9 | 24.5 | 36.4 | 23.3 | 20.9 |
| Methods | Metrics (%) | AP of each categories (%) | ||||||||||
|---|---|---|---|---|---|---|---|---|---|---|---|---|
| C1 | C2 | C3 | C4 | C5 | C6 | |||||||
| Ours () | 23.2 | 31.5 | 24.9 | 13.5 | 49.7 | 23.8 | 20.8 | 33.8 | 17.3 | 32.4 | 17.5 | 17.5 |
| Ours () | 25.5 | 34.5 | 28.0 | 2.8 | 44.0 | 28.6 | 18.7 | 33.9 | 22.2 | 34.6 | 23.0 | 20.7 |
| Ours () | 22.0 | 30.2 | 23.9 | 0.6 | 34.8 | 25.1 | 18.3 | 28.8 | 15.7 | 31.0 | 19.1 | 19.3 |
| Ours (self-adaptive ) | 27.4 | 36.6 | 29.6 | 8.6 | 46.9 | 29.8 | 23.7 | 36.4 | 22.8 | 35.0 | 24.1 | 22.5 |
Table 5 displays the impact of different values on the metrics and the accuracy of the coarse annotations (the detail is shown in the section 5.2). It can be observed that under four different values, the accuracy of coarse annotations both reaches over 95%, which is very close to the ground truth. As for COCO metrics, set at 50m and at 70m perform better compared to the other distances, with similar levels of precision. However, considering that a larger distance allows the ray tracing algorithm to track a wider range, choosing a relatively smaller value of 50m will make the entire framework more efficient.
Additionally, when filtering the decoupled building facade information, we devised a strategy for an adaptive dynamic threshold adjustment based on probabilistic rules. This is because we observed that the pre-trained model’s recognition results for building facades vary across different scenes, and choosing a fixed threshold could miss a lot of valuable information.
Table 6 displays the comparison results of our selection between different fixed thresholds and the adaptive threshold strategy. It was found that when a fixed threshold strategy is selected, the performs best at a threshold of 0.5, reaching 25.5%, but decreases to 22.0% at a higher threshold of 0.7. Although a fixed threshold can ensure a certain level of localization accuracy for building facades, in more complex street-view scenarios, a lot of useful information is lost due to the high threshold, ultimately leading to a decrease in model performance. Our adaptive dynamic adjustment threshold strategy, based on the probabilistic model, can enhance the scalability ability of the coarse annotation module, thereby extracting facade information from buildings in more diverse scenarios and ultimately providing the model with better robustness and scalability capability.
6.3 Cross-regional fine-grained building functions recognition
| City | Manual annotations | Overall metrics (%) | AP of each categories (%) | |||||||||
| L1/B1 | L2/B2 | L3/B3 | L4/B4 | L5/B5 | ||||||||
| Los Angeles | 31.2 | 38.6 | 33.9 | - | 17.9 | 33.5 | 33.0 | 56.0 | 46.2 | 54.7 | 3.2 | |
| ✓ | 33.5 | 38.6 | 33.9 | - | 19.7 | 36.4 | 44.2 | 58.6 | 46.6 | 49.4 | 4.5 | |
| Boston | 32.3 | 38.6 | 34.5 | - | 11.8 | 33.8 | 25.5 | 43.0 | 32.9 | 28.6 | 31.4 | |
| ✓ | 32.5 | 39.0 | 34.6 | - | 13.6 | 33.9 | 26.5 | 43.4 | 33.3 | 27.1 | 32.3 | |
In this section, we will primarily explore the potential of the proposed fine-grained building function recognition method in cross-categorization system tasks. The main challenge of cross-categorization system tasks stems from the significantly different feature spaces across regions, including diverse facade features of buildings and different classification systems. Our multi-stage training strategy offers exceptional flexibility, effectively meeting challenges by customizing input data and model configurations, which in turn enables detailed building function identification across various classification systems.
The annotated data for the new region was constructed by combining local GIS data with a coarse annotation generation module. Additionally, we simulated two scenarios for cross-categorization system tasks. In one scenario, there is some prior knowledge in new area, where a small portion of street-view images were manually annotated. In the other scenario, these two regions are entirely unknown, with no human intervention. During the first pre-training stage, we use labeled data from New York as the labeled input and data from new regions as the unlabeled input. In the first scenario, a small amount of manual labeled data from the new regions is added to the labeled dataset, while in the second scenario, only data from New York is used. Moreover, as mentioned in the section 4.3.2, the multi-task pre-training model is better suited for recognizing building facades across different categories, which is insufficient for cross-categorization system tasks. Therefore, we opt for a simpler binary classification task, focusing directly on the facade information. In the second stage, we utilize GIS data from the target domain to extract building function information, combining them with the facade information obtained by the pre-trained model to generate coarse annotations for multi-class tasks. In the third stage, we input these coarse annotations to undertake multi-class tasks in the target domain. For the first scenario, we input both the labeled and coarse annotated data for training, while in the second scenario, only the coarse annotations are used for training.

From Table. 7 we can see that our method demonstrates good performance in cross-categorization system experiments. In completely unlabeled scenarios, the accuracy in the Los Angeles and Boston areas reached 31.2% and 32.3%, respectively, and the model also showed balanced performance across different IoU intervals. However, the geometry-awre semi-supervised framework seems less effective for detecting small and medium-sized targets. Examining individual categories, in Los Angeles, except for L5, all other s exceeded 30%, with L2 and L4 even surpassing 50%. This could be due to a lower number of L5 instances in the selected areas, leading to significant sample imbalance in the coarse annotations of L5 obtained in the second stage. In the Boston area, the performance across various categories was relatively balanced, with the lowest being 26.5% for B1 and the highest being 43.4% for B2. In Figure 7, we display the ground truth (the second row) and the visualization results of training without labeled data (the first row) for two regions. The recognition of fine-grained building functions and the localization of bboxes are both well performed.
In summary, our gemetry-aware semi-supervised method demonstrates good robustness in cross-categorization system fine-grained building function recognition. This applies both to scenarios like Boston, where the functions distribution is relatively uniform and the building sizes are moderate, and to areas like Los Angeles, where the roads are wider and some categories of buildings are smaller.
6.4 Comparison between human recognition and algorithm recognition
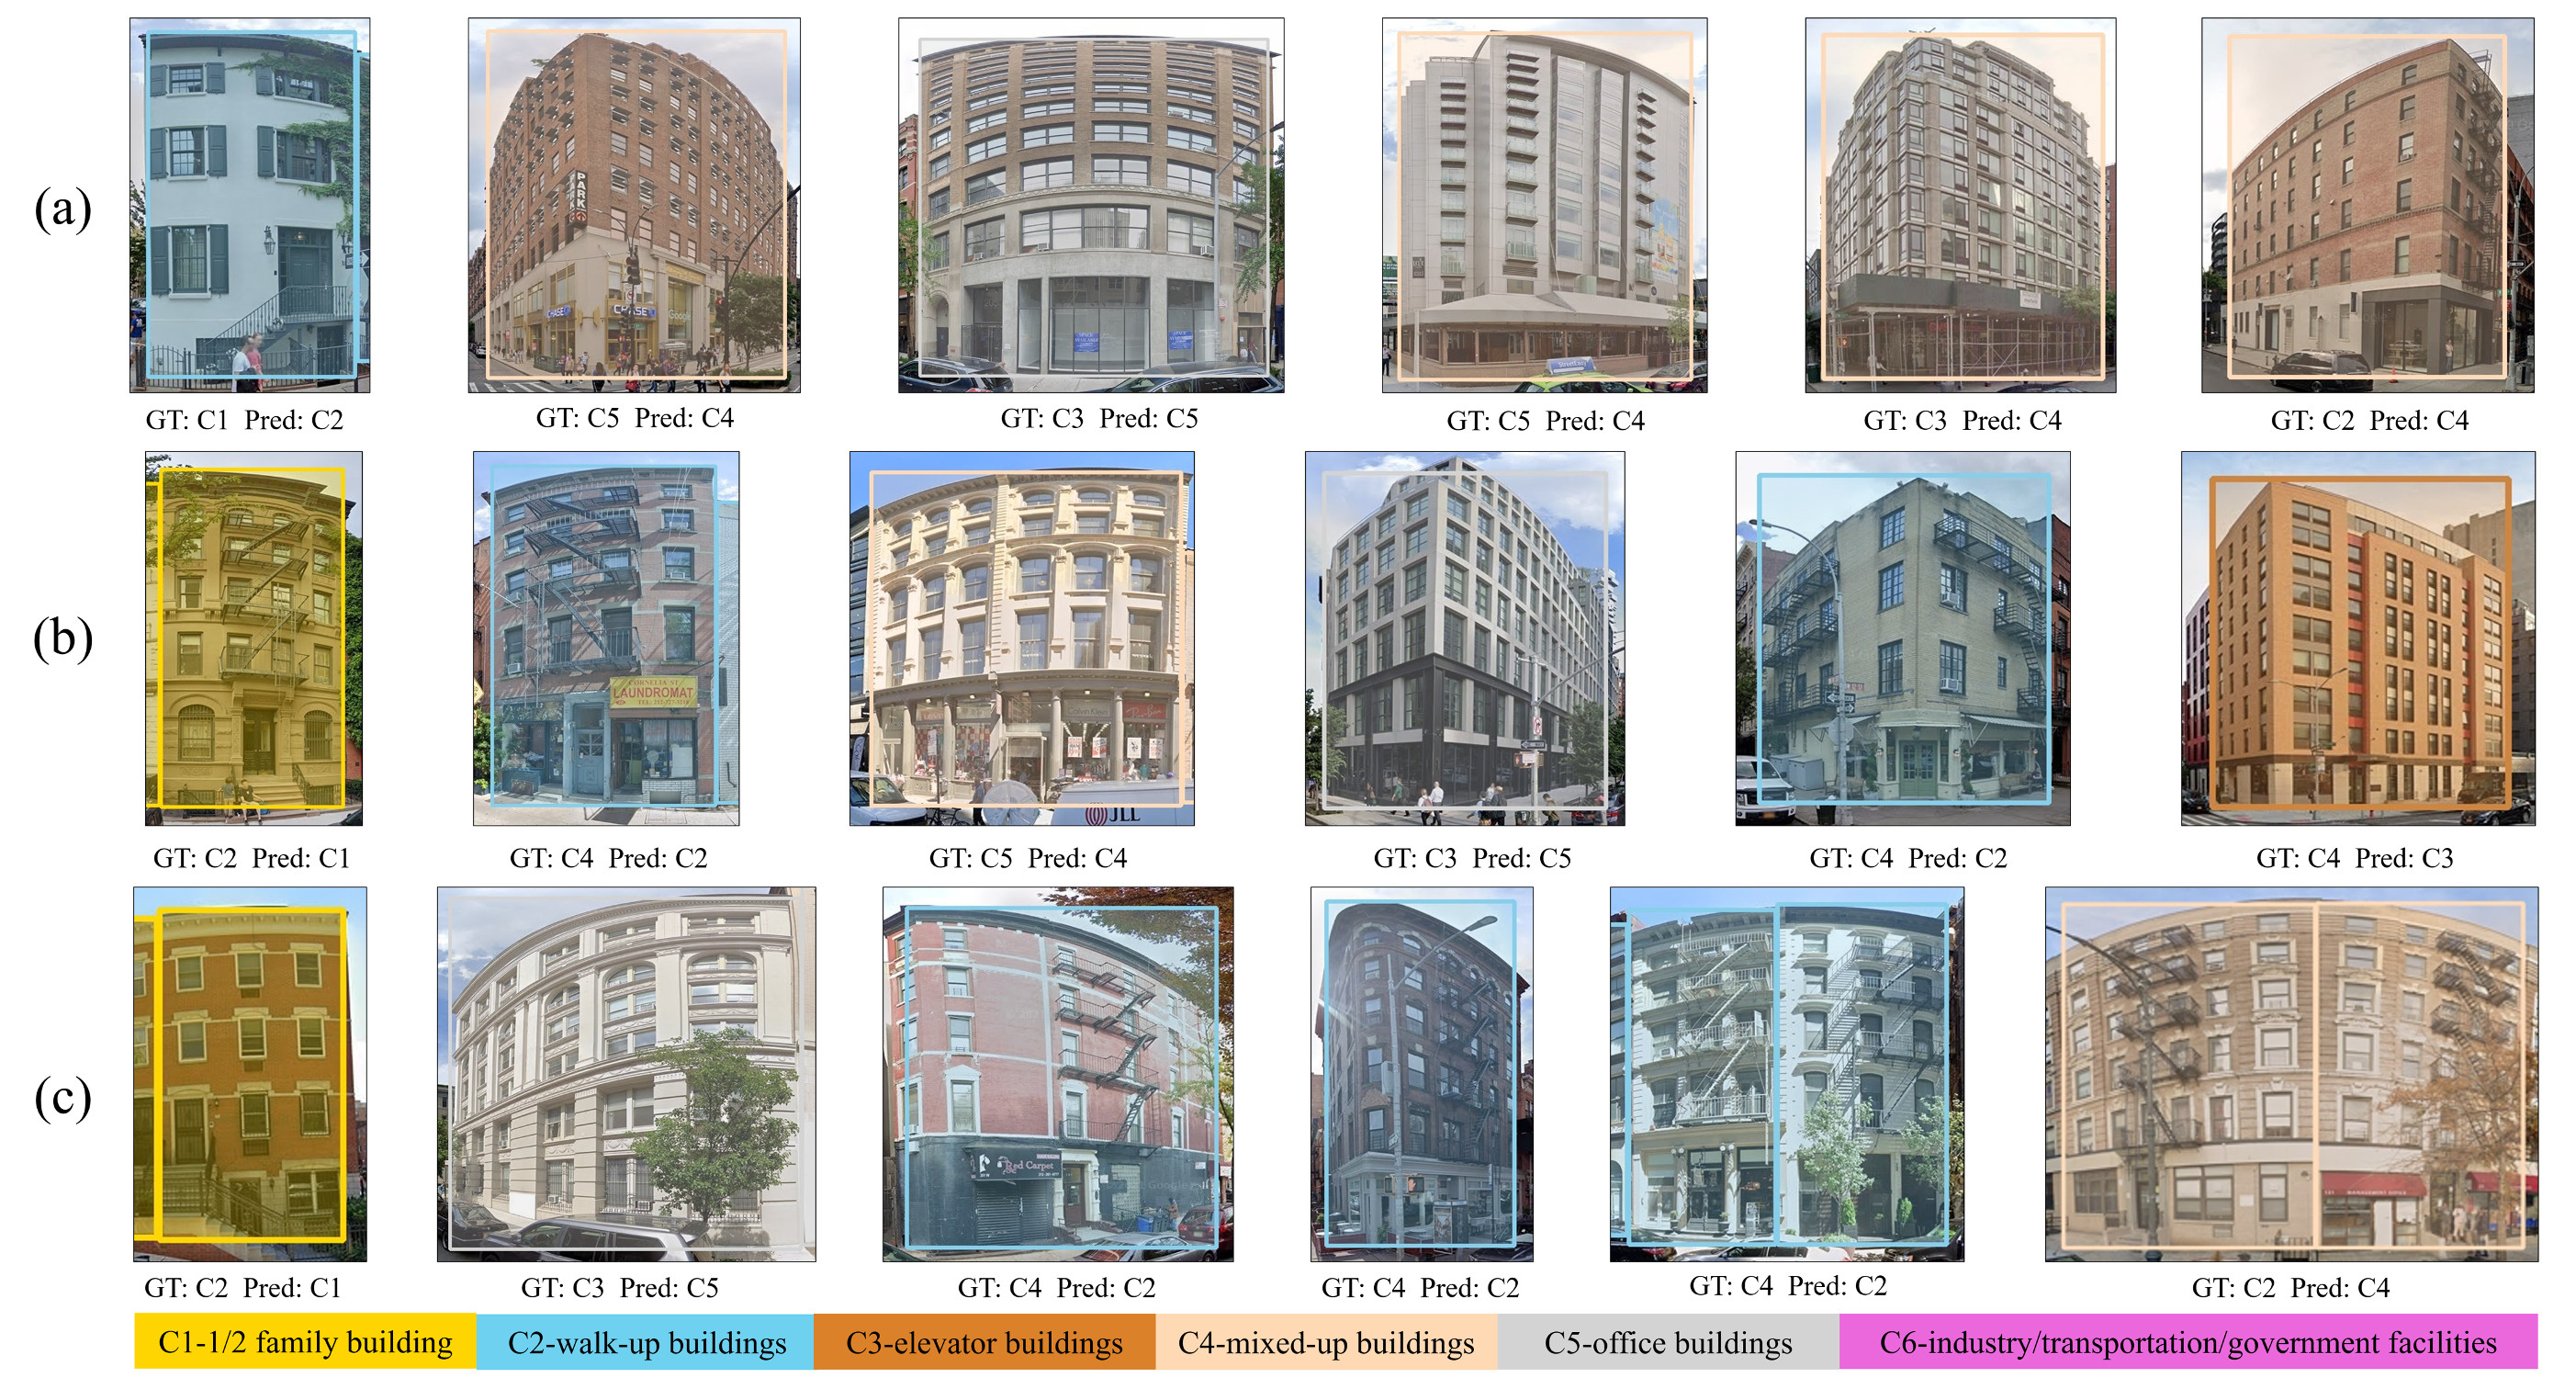
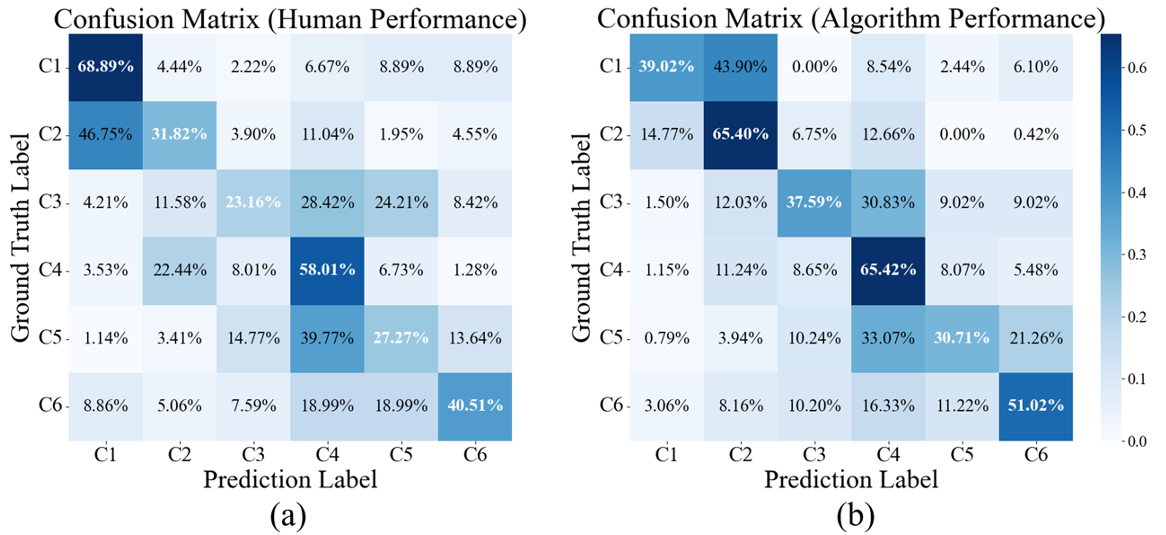
The experimental results indicate that our method still has certain limitations in fine-grained building function recognition task. To explore the difficulty of this task, we conduct an additional experiment involving manual recognition of building function. Several researchers are provided with training on the task of fine-grained building function recognition, learning about the categorization system of building function as well as the morphology and facade features of various types of buildings. Then the researchers are asked to perform fine-grained building function recognition on 200 images from the validation set, where the buildings were provided with bbox information only. For these 200 street-view images from the validation set, we consider not only the need to include all categories but also aim to ensure a relatively random spatial distribution. We also use the aforementioned best-performing model to make predictions on these 200 images. The resulting confusion matrices from human recognition and our method are shown in Figure 9.
Due to the mixed-use nature of urban functional areas during city development, most buildings have diverse functions and it is difficult to accurately distinguish certain categories. For buildings with both C1 and C2 features, which have fewer floors and staircases on the facade, the confusion between the two is common. For buildings where the first floor differs significantly from the upper floors, they are easily misrecognized as C4. Figure 8 (a) demonstrates some typical error cases. The manual recognition results have similar error cases to our method, as shown in Figure 8 (b). Conversely, our method can extract more implicit features, resulting in better accuracy than manual recognition across all categories except C1. Some cases where our method performs better than manual recognition are shown in Figure 8 (c). Additionally, our method offers significant advantages in terms of time efficiency and learning costs. Therefore, we believe that the method proposed in this study holds great potential for fine-grained building function recognition.
7 Conclusion
In this study, we proposes a geometry-aware semi-supervised method for fine-grained building function recognition. This method decomposes the general teacher-student structure of semi-supervised framework into three stages. In the first pre-trained stage, we employ semi-supervised methods to learn building facade location information from a large amount of unlabeled data for precise building facade detection. In the second stage, a coarse annotation generation module based on cross-perspective data angular relationships is proposed. This module effectively utilizes existing GIS data and street-view images to generate high-accuracy coarse annotations. In the third stage, by combining the coarse annotations with other labeled data, we achieved large-scale high-precision building fine-grained function recognition under few-shot conditions, based on a object detection network.
We reorganize the OmniCity dataset for semi-supervised building fine-grained function recognition and conducted extensive experiments on this dataset. The experimental results indicate that our method achieves better building fine-grained function recognition results compared to state-of-the-art semi-supervised and fully supervised methods, with an improvement of over 5% in . Additionally, we construct two new city datasets for Los Angeles and Boston using the CityAnnotator tool and discuss the performance of our method in the task of building fine-grained function recognition across different classification systems based on these datasets. We also analyze several important parameters and provided a detailed discussion on the robustness and generalization ability of the model.
In future work, we will expand the scope of our research to include more cities and delve into more detailed aspects of building functions. This will provide effective data support for further analysis of how buildings are selected and planned for essential social activities such as education, public welfare, and emergency shelters, as people engage in these activities. Concurrently, we will also refine the fine-grained building function recognition method to offer efficient technical support for understanding urban morphology and analyzing human behavior.
References
- Srivastava et al. [2019] S. Srivastava, J. E. Vargas-Munoz, D. Tuia, Understanding urban landuse from the above and ground perspectives: A deep learning, multimodal solution, Remote sensing of environment 228 (2019) 129–143.
- Wang et al. [2022] X. Wang, B. Chen, X. Li, Y. Zhang, X. Ling, J. Wang, W. Li, W. Wen, P. Gong, Grid-based essential urban land use classification: A data and model driven mapping framework in xiamen city, Remote Sensing 14 (2022) 6143.
- Gonzalez-Aguilera et al. [2012] D. Gonzalez-Aguilera, E. Crespo-Matellan, D. Hernández-López, P. Rodríguez-Gonzálvez, Automated urban analysis based on lidar-derived building models, IEEE Transactions on Geoscience and Remote Sensing 51 (2012) 1844–1851.
- Zhou et al. [2023] W. Zhou, C. Persello, M. Li, A. Stein, Building use and mixed-use classification with a transformer-based network fusing satellite images and geospatial textual information, Remote Sensing of Environment 297 (2023) 113767.
- Li et al. [2023] W. Li, W. Zhao, J. Yu, J. Zheng, C. He, H. Fu, D. Lin, Joint semantic–geometric learning for polygonal building segmentation from high-resolution remote sensing images, ISPRS Journal of Photogrammetry and Remote Sensing 201 (2023) 26–37.
- Tong et al. [2022] H. Tong, M. Li, J. Kang, Relationships between building attributes and covid-19 infection in london, Building and Environment 225 (2022) 109581.
- Jiao et al. [2021] J. Jiao, J. Rollo, B. Fu, The hidden characteristics of land-use mix indices: An overview and validity analysis based on the land use in melbourne, australia, Sustainability 13 (2021) 1898.
- Wurm et al. [2019] M. Wurm, T. Stark, X. X. Zhu, M. Weigand, H. Taubenböck, Semantic segmentation of slums in satellite images using transfer learning on fully convolutional neural networks, ISPRS journal of photogrammetry and remote sensing 150 (2019) 59–69.
- Zhang et al. [2020] Y. Zhang, K. Qin, Q. Bi, W. Cui, G. Li, Landscape patterns and building functions for urban land-use classification from remote sensing images at the block level: a case study of wuchang district, wuhan, china, Remote Sensing 12 (2020) 1831.
- Hoffmann et al. [2023] E. J. Hoffmann, K. Abdulahhad, X. X. Zhu, Using social media images for building function classification, Cities 133 (2023) 104107.
- Workman et al. [2022] S. Workman, M. U. Rafique, H. Blanton, N. Jacobs, Revisiting near/remote sensing with geospatial attention, in: Proceedings of the IEEE/CVF Conference on Computer Vision and Pattern Recognition, 2022, pp. 1778–1787.
- Fang et al. [2022] F. Fang, L. Zeng, S. Li, D. Zheng, J. Zhang, Y. Liu, B. Wan, Spatial context-aware method for urban land use classification using street view images, ISPRS Journal of Photogrammetry and Remote Sensing 192 (2022) 1–12.
- Fang et al. [2021] F. Fang, Y. Yu, S. Li, Z. Zuo, Y. Liu, B. Wan, Z. Luo, Synthesizing location semantics from street view images to improve urban land-use classification, International Journal of Geographical Information Science 35 (2021) 1802–1825.
- Ye et al. [2024a] J. Ye, Q. Luo, J. Yu, H. Zhong, Z. Zheng, C. He, W. Li, Sg-bev: Satellite-guided bev fusion for cross-view semantic segmentation, in: Proceedings of the IEEE/CVF Conference on Computer Vision and Pattern Recognition, 2024a, pp. 27748–27757.
- Ye et al. [2024b] J. Ye, Z. Lv, W. Li, J. Yu, H. Yang, H. Zhong, C. He, Cross-view image geo-localization with panorama-bev co-retrieval network, arXiv preprint arXiv:2408.05475 (2024b).
- Geiger et al. [2012] A. Geiger, P. Lenz, R. Urtasun, Are we ready for autonomous driving? the kitti vision benchmark suite, in: 2012 IEEE conference on computer vision and pattern recognition, IEEE, 2012, pp. 3354–3361.
- Caesar et al. [2020] H. Caesar, V. Bankiti, A. H. Lang, S. Vora, V. E. Liong, Q. Xu, A. Krishnan, Y. Pan, G. Baldan, O. Beijbom, nuscenes: A multimodal dataset for autonomous driving, in: Proceedings of the IEEE/CVF conference on computer vision and pattern recognition, 2020, pp. 11621–11631.
- Cordts et al. [2016] M. Cordts, M. Omran, S. Ramos, T. Rehfeld, M. Enzweiler, R. Benenson, U. Franke, S. Roth, B. Schiele, The cityscapes dataset for semantic urban scene understanding, in: Proceedings of the IEEE conference on computer vision and pattern recognition, 2016, pp. 3213–3223.
- Zhou et al. [2020] Y. Zhou, J. Huang, X. Dai, S. Liu, L. Luo, Z. Chen, Y. Ma, Holicity: A city-scale data platform for learning holistic 3d structures, arXiv preprint arXiv:2008.03286 (2020).
- Yang et al. [2019] K. Yang, X. Hu, L. M. Bergasa, E. Romera, K. Wang, Pass: Panoramic annular semantic segmentation, IEEE Transactions on Intelligent Transportation Systems 21 (2019) 4171–4185.
- Chen et al. [2018] W. Chen, H. Huang, J. Dong, Y. Zhang, Y. Tian, Z. Yang, Social functional mapping of urban green space using remote sensing and social sensing data, ISPRS Journal of Photogrammetry and Remote Sensing 146 (2018) 436–452.
- Chen et al. [2023] W. Chen, Y. Zhou, E. C. Stokes, X. Zhang, Large-scale urban building function mapping by integrating multi-source web-based geospatial data, Geo-spatial Information Science (2023) 1–15.
- Li et al. [2023] W. Li, Y. Lai, L. Xu, Y. Xiangli, J. Yu, C. He, G.-S. Xia, D. Lin, Omnicity: Omnipotent city understanding with multi-level and multi-view images, in: Proceedings of the IEEE/CVF Conference on Computer Vision and Pattern Recognition, 2023, pp. 17397–17407.
- Kang et al. [2018] J. Kang, M. Körner, Y. Wang, H. Taubenböck, X. X. Zhu, Building instance classification using street view images, ISPRS journal of photogrammetry and remote sensing 145 (2018) 44–59.
- Xu et al. [2021] M. Xu, Z. Zhang, H. Hu, J. Wang, L. Wang, F. Wei, X. Bai, Z. Liu, End-to-end semi-supervised object detection with soft teacher, in: Proceedings of the IEEE/CVF International Conference on Computer Vision, 2021, pp. 3060–3069.
- Wang et al. [2023] Y. Wang, Z. Liu, S. Lian, Semi-supervised object detection: A survey on recent research and progress, arXiv preprint arXiv:2306.14106 (2023).
- Guo et al. [2021] H. Guo, Q. Shi, A. Marinoni, B. Du, L. Zhang, Deep building footprint update network: A semi-supervised method for updating existing building footprint from bi-temporal remote sensing images, Remote Sensing of Environment 264 (2021) 112589.
- Li et al. [2022] Q. Li, Y. Shi, X. X. Zhu, Semi-supervised building footprint generation with feature and output consistency training, IEEE Transactions on Geoscience and Remote Sensing 60 (2022) 1–17.
- Yu et al. [2022] A. Yu, B. Liu, X. Cao, C. Qiu, W. Guo, Y. Quan, Pixel-level self-supervised learning for semi-supervised building extraction from remote sensing images, IEEE Geoscience and Remote Sensing Letters 19 (2022) 1–5.
- Hong et al. [2020] D. Hong, N. Yokoya, G.-S. Xia, J. Chanussot, X. X. Zhu, X-modalnet: A semi-supervised deep cross-modal network for classification of remote sensing data, ISPRS Journal of Photogrammetry and Remote Sensing 167 (2020) 12–23.
- Pang and Biljecki [2022] H. E. Pang, F. Biljecki, 3d building reconstruction from single street view images using deep learning, International Journal of Applied Earth Observation and Geoinformation 112 (2022) 102859.
- Yan and Huang [2022] Y. Yan, B. Huang, Estimation of building height using a single street view image via deep neural networks, ISPRS Journal of Photogrammetry and Remote Sensing 192 (2022) 83–98.
- Xu et al. [2023] Z. Xu, F. Zhang, Y. Wu, Y. Yang, Y. Wu, Building height calculation for an urban area based on street view images and deep learning, Computer-Aided Civil and Infrastructure Engineering 38 (2023) 892–906.
- Szcześniak et al. [2022] J. T. Szcześniak, Y. Q. Ang, S. Letellier-Duchesne, C. F. Reinhart, A method for using street view imagery to auto-extract window-to-wall ratios and its relevance for urban-level daylighting and energy simulations, Building and Environment 207 (2022) 108108.
- Hu et al. [2022] H. Hu, X. Liang, Y. Ding, X. Yuan, Q. Shang, B. Xu, X. Ge, M. Chen, R. Zhong, Q. Zhu, Semi-supervised adversarial recognition of refined window structures for inverse procedural façade modelling, ISPRS Journal of Photogrammetry and Remote Sensing 192 (2022) 215–231.
- Hoffmann et al. [2019] E. J. Hoffmann, Y. Wang, M. Werner, J. Kang, X. X. Zhu, Model fusion for building type classification from aerial and street view images, Remote Sensing 11 (2019) 1259.
- Ramalingam and Kumar [2023] S. P. Ramalingam, V. Kumar, Automatizing the generation of building usage maps from geotagged street view images using deep learning, Building and Environment 235 (2023) 110215.
- Sun et al. [2021] M. Sun, F. Zhang, F. Duarte, Automatic building age prediction from street view images, in: 2021 7th IEEE International Conference on Network Intelligence and Digital Content (IC-NIDC), IEEE, 2021, pp. 102–106.
- Ogawa et al. [2023] Y. Ogawa, C. Zhao, T. Oki, S. Chen, Y. Sekimoto, Deep learning approach for classifying the built year and structure of individual buildings by automatically linking street view images and gis building data, IEEE Journal of Selected Topics in Applied Earth Observations and Remote Sensing 16 (2023) 1740–1755.
- Rosenfelder et al. [2021] M. Rosenfelder, M. Wussow, G. Gust, R. Cremades, D. Neumann, Predicting residential electricity consumption using aerial and street view images, Applied Energy 301 (2021) 117407.
- Wang et al. [2021] C. Wang, S. E. Antos, L. M. Triveno, Automatic detection of unreinforced masonry buildings from street view images using deep learning-based image segmentation, Automation in Construction 132 (2021) 103968.
- Hu et al. [2020] C.-B. Hu, F. Zhang, F.-Y. Gong, C. Ratti, X. Li, Classification and mapping of urban canyon geometry using google street view images and deep multitask learning, Building and Environment 167 (2020) 106424.
- Zhao et al. [2023] C. Zhao, Y. Ogawa, S. Chen, T. Oki, Y. Sekimoto, Quantitative land price analysis via computer vision from street view images, Engineering Applications of Artificial Intelligence 123 (2023) 106294.
- Yao et al. [2021] Y. Yao, J. Zhang, C. Qian, Y. Wang, S. Ren, Z. Yuan, Q. Guan, Delineating urban job-housing patterns at a parcel scale with street view imagery, International Journal of Geographical Information Science 35 (2021) 1927–1950.
- Sohn et al. [2020] K. Sohn, Z. Zhang, C.-L. Li, H. Zhang, C.-Y. Lee, T. Pfister, A simple semi-supervised learning framework for object detection, arXiv preprint arXiv:2005.04757 (2020).
- Tarvainen and Valpola [2017] A. Tarvainen, H. Valpola, Mean teachers are better role models: Weight-averaged consistency targets improve semi-supervised deep learning results, Advances in neural information processing systems 30 (2017).
- Liu et al. [2021] Y.-C. Liu, C.-Y. Ma, Z. He, C.-W. Kuo, K. Chen, P. Zhang, B. Wu, Z. Kira, P. Vajda, Unbiased teacher for semi-supervised object detection, arXiv preprint arXiv:2102.09480 (2021).
- Wang et al. [2023] X. Wang, X. Yang, S. Zhang, Y. Li, L. Feng, S. Fang, C. Lyu, K. Chen, W. Zhang, Consistent-teacher: Towards reducing inconsistent pseudo-targets in semi-supervised object detection, in: Proceedings of the IEEE/CVF Conference on Computer Vision and Pattern Recognition, 2023, pp. 3240–3249.
- Liu et al. [2022] Y.-C. Liu, C.-Y. Ma, Z. Kira, Unbiased teacher v2: Semi-supervised object detection for anchor-free and anchor-based detectors, in: Proceedings of the IEEE/CVF Conference on Computer Vision and Pattern Recognition, 2022, pp. 9819–9828.
- Tang et al. [2021] Y. Tang, W. Chen, Y. Luo, Y. Zhang, Humble teachers teach better students for semi-supervised object detection, in: Proceedings of the IEEE/CVF Conference on Computer Vision and Pattern Recognition, 2021, pp. 3132–3141.
- Zhou et al. [2022] H. Zhou, Z. Ge, S. Liu, W. Mao, Z. Li, H. Yu, J. Sun, Dense teacher: Dense pseudo-labels for semi-supervised object detection, in: European Conference on Computer Vision, Springer, 2022, pp. 35–50.
- Jiang et al. [2022] F. Jiang, J. Ma, Z. Li, Y. Ding, Prediction of energy use intensity of urban buildings using the semi-supervised deep learning model, Energy 249 (2022) 123631.
- Shu et al. [2022] Q. Shu, J. Pan, Z. Zhang, M. Wang, Mtcnet: Multitask consistency network with single temporal supervision for semi-supervised building change detection, International Journal of Applied Earth Observation and Geoinformation 115 (2022) 103110.
- Li et al. [2023] H. Li, Z. Yuan, G. Dax, G. Kong, H. Fan, A. Zipf, M. Werner, Semi-Supervised Learning from Street-View Images and OpenStreetMap for Automatic Building Height Estimation, in: 12th International Conference on Geographic Information Science (GIScience 2023), 2023, pp. 7:1–7:15.
- Tang et al. [2019] Z. Tang, M. Naphade, M.-Y. Liu, X. Yang, S. Birchfield, S. Wang, R. Kumar, D. Anastasiu, J.-N. Hwang, Cityflow: A city-scale benchmark for multi-target multi-camera vehicle tracking and re-identification, in: Proceedings of the IEEE/CVF Conference on Computer Vision and Pattern Recognition, 2019, pp. 8797–8806.
- Wang et al. [2016] S. Wang, M. Bai, G. Mattyus, H. Chu, W. Luo, B. Yang, J. Liang, J. Cheverie, S. Fidler, R. Urtasun, Torontocity: Seeing the world with a million eyes, arXiv preprint arXiv:1612.00423 (2016).
- Lin et al. [2017] T.-Y. Lin, P. Goyal, R. Girshick, K. He, P. Dollár, Focal loss for dense object detection, in: Proceedings of the IEEE international conference on computer vision, 2017, pp. 2980–2988.
- Deng et al. [2009] J. Deng, W. Dong, R. Socher, L.-J. Li, K. Li, L. Fei-Fei, Imagenet: A large-scale hierarchical image database, in: 2009 IEEE conference on computer vision and pattern recognition, Ieee, 2009, pp. 248–255.
- Suffern [2016] K. Suffern, Ray Tracing from the Ground up, CRC Press, 2016.
- Li et al. [2020] X. Li, W. Wang, L. Wu, S. Chen, X. Hu, J. Li, J. Tang, J. Yang, Generalized focal loss: Learning qualified and distributed bounding boxes for dense object detection, Advances in Neural Information Processing Systems 33 (2020) 21002–21012.
- Chen et al. [2019] K. Chen, J. Wang, J. Pang, Y. Cao, Y. Xiong, X. Li, S. Sun, W. Feng, Z. Liu, J. Xu, et al., Mmdetection: Open mmlab detection toolbox and benchmark, arXiv preprint arXiv:1906.07155 (2019).
- Tian et al. [2019] Z. Tian, C. Shen, H. Chen, T. He, Fcos: Fully convolutional one-stage object detection, in: Proceedings of the IEEE/CVF International Conference on Computer Vision (ICCV), 2019.
- Ren et al. [2015] S. Ren, K. He, R. Girshick, J. Sun, Faster r-cnn: Towards real-time object detection with region proposal networks, Advances in neural information processing systems 28 (2015).
- Cai and Vasconcelos [2018] Z. Cai, N. Vasconcelos, Cascade r-cnn: Delving into high quality object detection, in: Proceedings of the IEEE conference on computer vision and pattern recognition, 2018, pp. 6154–6162.
- Zhang et al. [2020] H. Zhang, H. Chang, B. Ma, N. Wang, X. Chen, Dynamic r-cnn: Towards high quality object detection via dynamic training, in: Computer Vision–ECCV 2020: 16th European Conference, Glasgow, UK, August 23–28, 2020, Proceedings, Part XV 16, Springer, 2020, pp. 260–275.
- Lin et al. [2014] T.-Y. Lin, M. Maire, S. Belongie, J. Hays, P. Perona, D. Ramanan, P. Dollár, C. L. Zitnick, Microsoft coco: Common objects in context, in: Computer Vision–ECCV 2014: 13th European Conference, Zurich, Switzerland, September 6-12, 2014, Proceedings, Part V 13, Springer, 2014, pp. 740–755.
- Li et al. [2022] G. Li, X. Li, Y. Wang, Y. Wu, D. Liang, S. Zhang, Pseco: Pseudo labeling and consistency training for semi-supervised object detection, in: European Conference on Computer Vision, Springer, 2022, pp. 457–472.
- Liu et al. [2023] C. Liu, W. Zhang, X. Lin, W. Zhang, X. Tan, J. Han, X. Li, E. Ding, J. Wang, Ambiguity-resistant semi-supervised learning for dense object detection, in: Proceedings of the IEEE/CVF Conference on Computer Vision and Pattern Recognition, 2023, pp. 15579–15588.