Mean-field theory of the uniaxial ferroelectric smectic A liquid crystal phase
Abstract
Following the groundbreaking discovery of the ferroelectric nematic liquid crystal phase (N), a series of closely-related new polar phases have also been found. An especially interesting one is the ferroelectric smectic A phase (SmA) with spontaneous polarization along the layer normal observed in a few materials of the N realm. Here, we present a mean-field molecular model that successfully captures the rich phase diagrams experimentally observed in the literature in terms of two parameters. Additionally, we carry out second harmonic generation, X-ray diffraction and birefringence measurements in a compound exhibiting the SmA phase to determine the appropriate order parameters and compare with the model predictions.
Mean-field theories constitute an intermediate approach between phenomenological and fully microscopic molecular theories. Even though they suffer from various limitations, mostly due to neglecting fluctuations, they sometimes provide valuable physical insights and have been applied to a wide range of systems Papon et al. (2002); Yeomans (1992). In the case of liquid crystals, Maier and Saupe proposed one such theory to describe the isotropic (Iso) to nematic (N) phase transition in 1960 Maier and Saupe (1958, 1960). They assumed an anisotropic potential comprising steric and induced-dipole interactions in the hope that uniaxial nematic order would arise below a given temperature. This was indeed the case and, although the predicted behavior deviates somewhat from the experimental data, it provides an intuitive understanding of the Iso–N transition. Kobayashi later extended the Maier–Saupe theory to the smectic A (SmA) phase by introducing an additional order parameter related to the one-dimensional positional order along the nematic axis Kobayashi (1970); K. Kobayashi (1970). It was McMillan, however, who studied the full consequences of introducing the possibility for such type of order, with its predictions again in qualitative agreement with experiment McMillan (1971).
Currently, the liquid crystal community is witnessing a polar revolution Sebastián et al. (2022). Aside from the fact that the long sought-after ferroelectric nematic (N) phase was experimentally realized in 2017 Mandle et al. (2017); Nishikawa et al. (2017); Chen et al. (2020); Li et al. (2021), a great variety of related new polar phases have been found since. For instance, a splay-modulated antiferroelectric nematic phase, often called N or SmZ, has been observed in some compounds directly preceding the N phase on cooling Sebastián et al. (2020); Chen et al. (2023). An especially interesting system is the ferroelectric smectic A (SmA) phase, for which the spontaneous polarization lies along the layer normal Kikuchi et al. (2022); Chen et al. (2022). This phase is more viscous than the N phase, and exhibits larger spontaneous polarization values. A visual sketch of the molecular arrangement in these phases is shown in Fig. S1. These recent findings have opened new avenues of exciting scientific research and promising technical applications. One of the most intriguing questions is how long-range polar order develops in these systems. Recently, an extension of the Maier-Saupe theory has been proposed by introducing a polar order parameter Etxebarria et al. (2022). The model successfully predicts the appearance of the N phase, which can be reached from both the apolar Iso and N phases. In this Letter, we follow this procedure and generalize the model to include the SmA phase.
In the SmA phase, the molecules are preferentially oriented along the director as in the N phase, but they also exhibit quasilong-range positional order in this direction forming a layered structure. Therefore, apart from the nematic order parameter ( is the angle between the molecular long axis and , being the second Legendre polynomial with the brackets denoting thermal averaging), one needs to introduce an additional order parameter , where , being the interplanar distance. Note that and the layer normal have been taken along the direction. thus describes the amplitude of the density wave along the director. No polar order parameter can be introduced since the SmA phase is apolar, i.e. the and directions are equivalent. The anisotropic interaction between molecules is assumed to be short-ranged and proportional to , where is the distance between centers of mass and is a measure of the interaction range. Within the mean-field approximation, it was shown that the one-particle potential can be written as
| (1) |
where and are constants with and McMillan (1971). It is evident that , and is larger for larger values of relative to . Since is typically approximately a molecular length , increases with .
As in the N phase, in the SmA phase the head-to-tail symmetry is broken, i.e. the and directions are not equivalent. The simplest order parameter that can account for spontaneous polar order is . Therefore, as it was done in Ref. Etxebarria et al., 2022, a natural extension of expression (1) to look for the SmA phase is
| (2) |
where is a new constant measuring the strength of the polar interaction. Note that the polar and mesogenic interactions are decoupled. With this potential, the probability of a molecule being located at a distance from a smectic plane at the origin and oriented at an angle from the director is given by
| (3) |
where is the Boltzmann constant, the temperature, and the partition function:
| (4) |
Accordingly, the following self-consistent system of equations can be solved in order to obtain the order parameters at each temperature:
| (5) | |||
| (6) | |||
| (7) |
The order parameters can also be calculated by minimizing the free energy at a given temperature. Considering that the internal energy of a system of molecules is and the entropy is , the Helmholtz free energy can be easily calculated as . The end result is:
| (8) |
In our case, we have numerically minimized Eq. (8) to obtain the order parameters at each temperature, later checking that Eqs. (5), (6) and (7) are satisfied.
Aside from the order parameters, of course, the thermal average of any other physical quantity of interest can be computed in an analogous manner. For instance, the SmA phase shows nonlinear optical activity. Since it has the same point group symmetry as the N phase, its second order dielectric susceptibility tensor has the same form as in Ref. Folcia et al., 2022, where it was shown that the optical second-harmonic generation intensity must be proportional to in a first approximation. Another physical quantity of great interest when it comes to phase transitions is the heat capacity, which at constant volume can be obtained as . Lastly, the entropy change at a transition can be written as
| (9) |
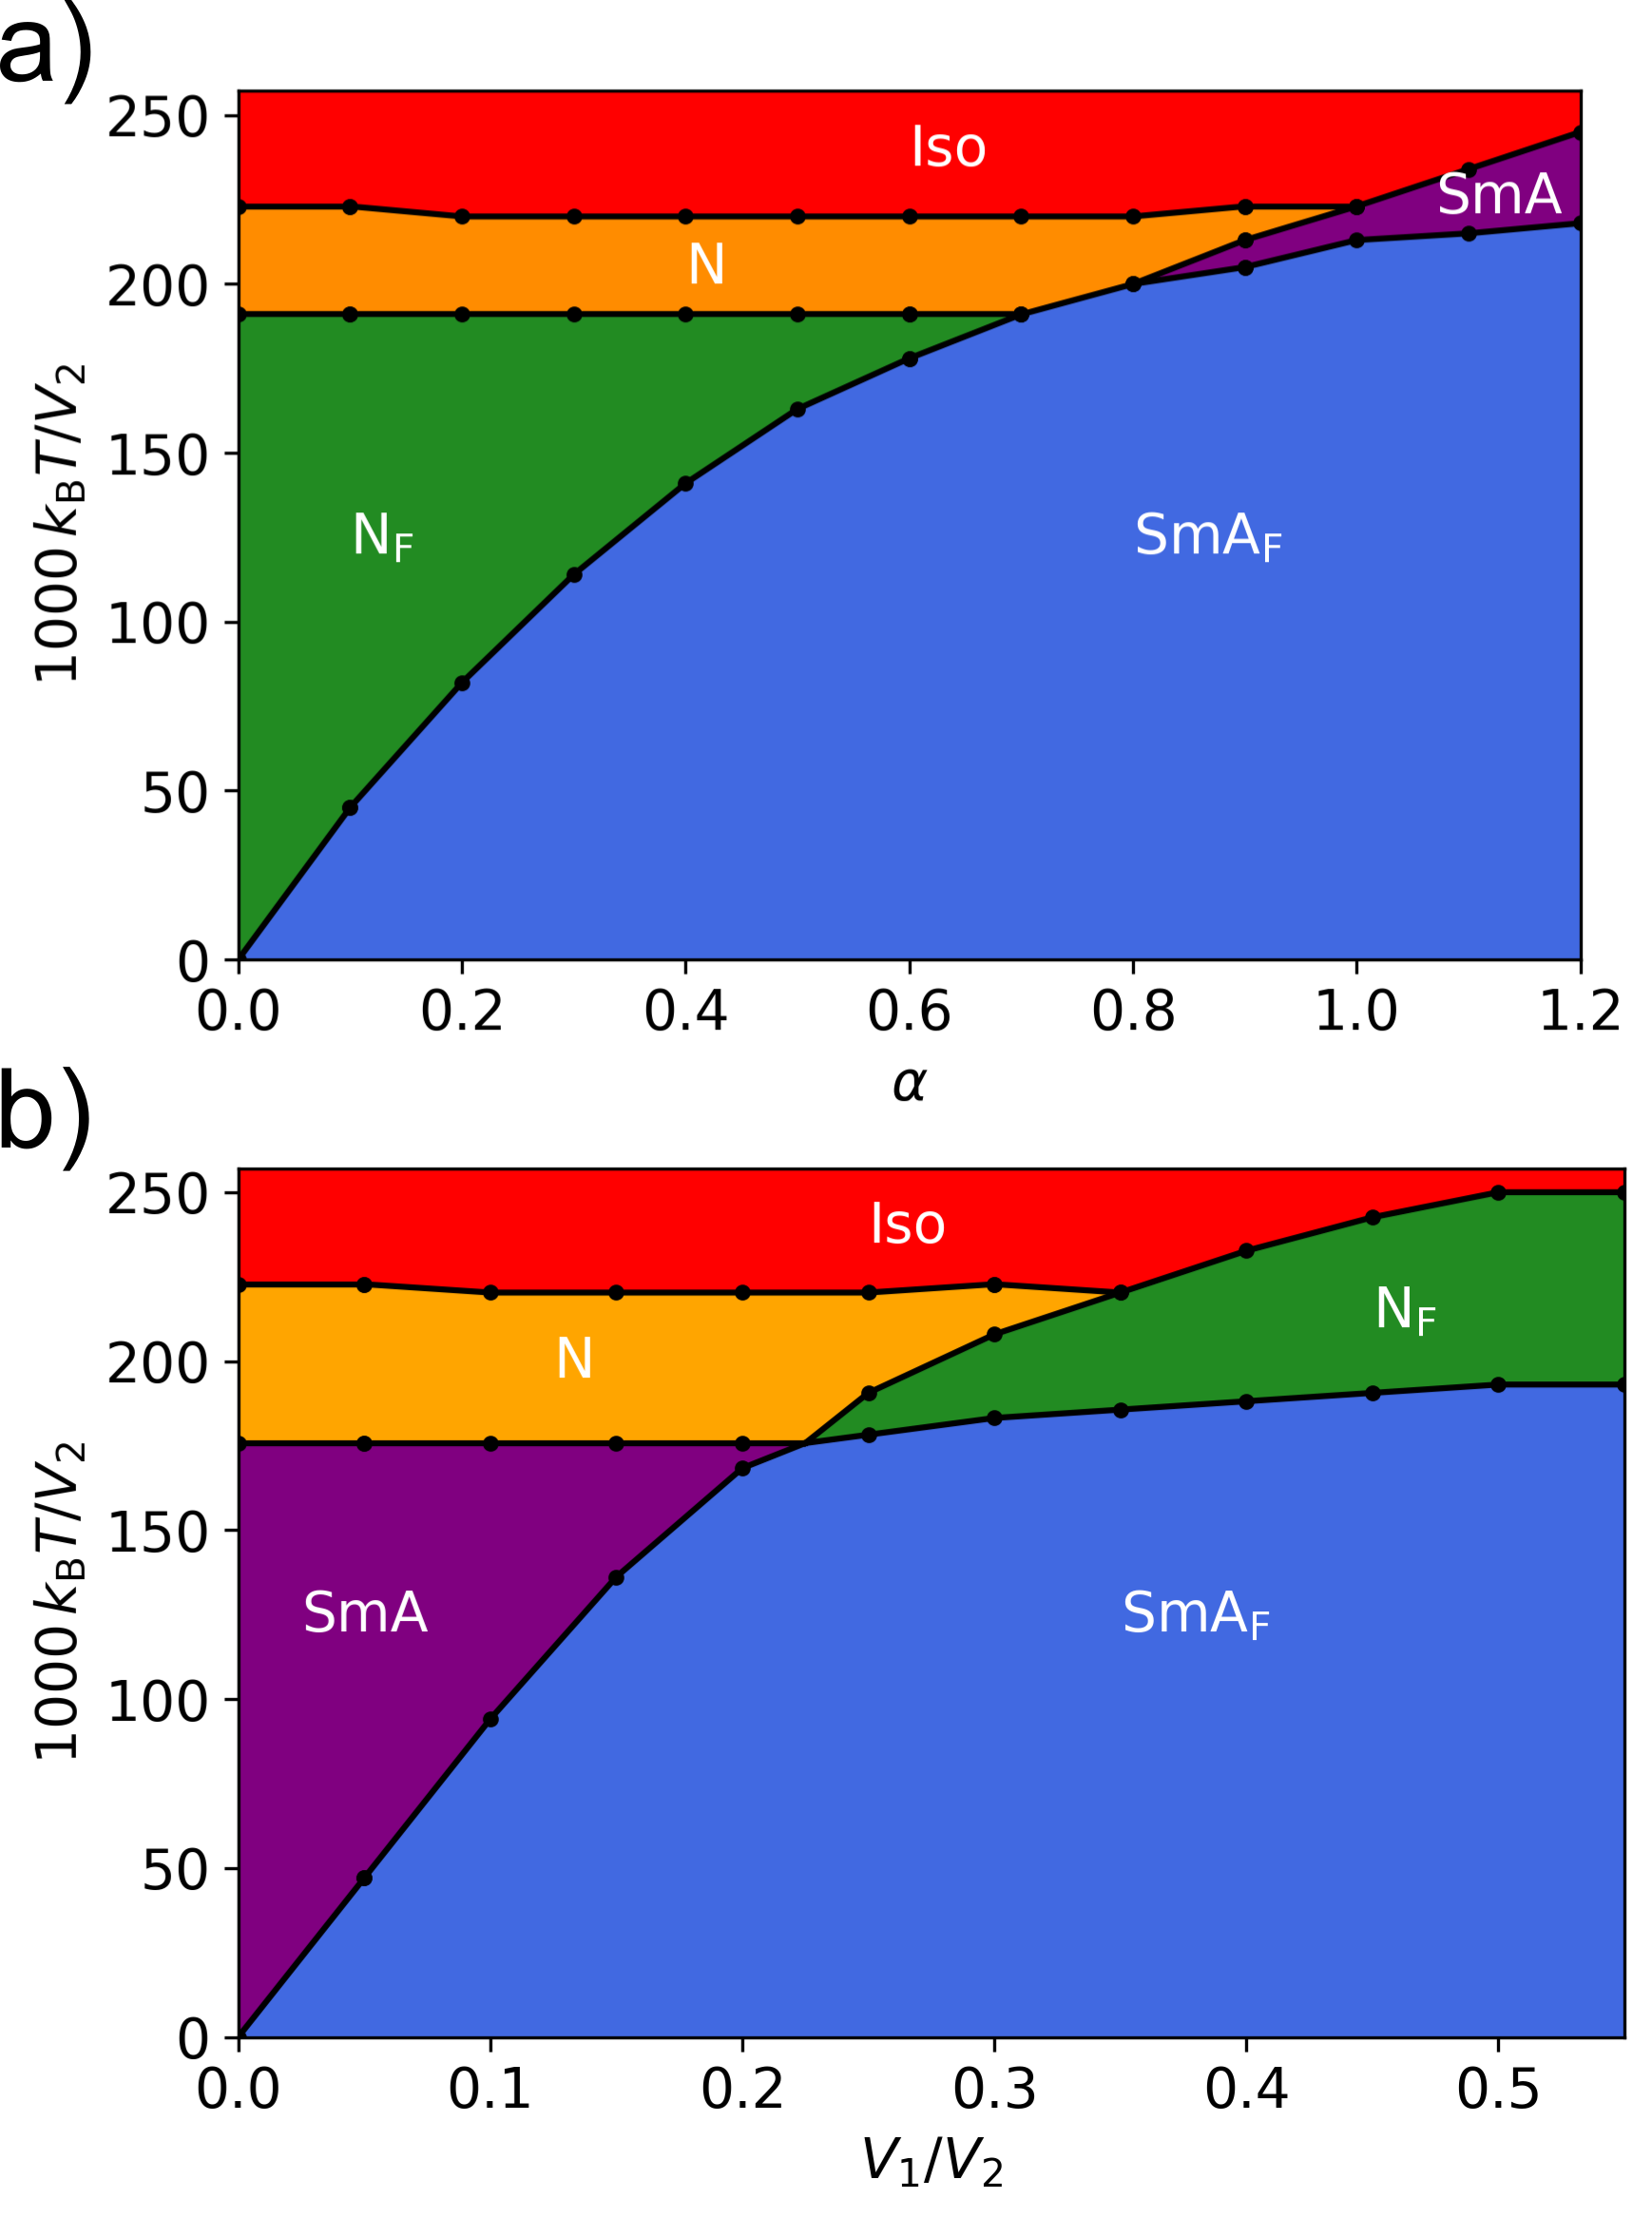
Firstly, we present in Fig. 1 a couple of phase diagrams that we consider to be representative of the model’s predictions. Fig. 1a shows the different phase sequences that are possible for a given value (0.25) of the ratio , which tunes the strength of the polar interactions, as a function of the parameter . For small values of we observe the Iso–N–N–SmA phase sequence. As expected, the transition temperature to the SmA phase increases with . At larger values of there is a narrow interval where Iso–N–SmA and Iso–N–SmA–SmA can occur. For , purely smectic order is favored, allowing the Iso–SmA–SmA phase sequence. It is also instructive to see how the phase diagram changes as a function of for constant , as shown in Fig. 1b for . If the strength of the polar interaction is small, i.e. for small , the Iso–N–SmA–SmA phase sequence is observed. Again, as expected, the larger the ratio , the higher the transition temperature to the SmA phase. In fact, it increases quite rapidly at first and then saturates. As the polar interaction becomes stronger, the N phase enters the picture, thus obtaining the Iso–N–N–SmA and even the Iso–N–SmA phase sequences. It should be mentioned that the apparent quadruple point in this phase diagram is not such, but rather the result of the limited resolution of the calculations. Lastly, it is important to point out that the order of the transitions changes with the model parameters.
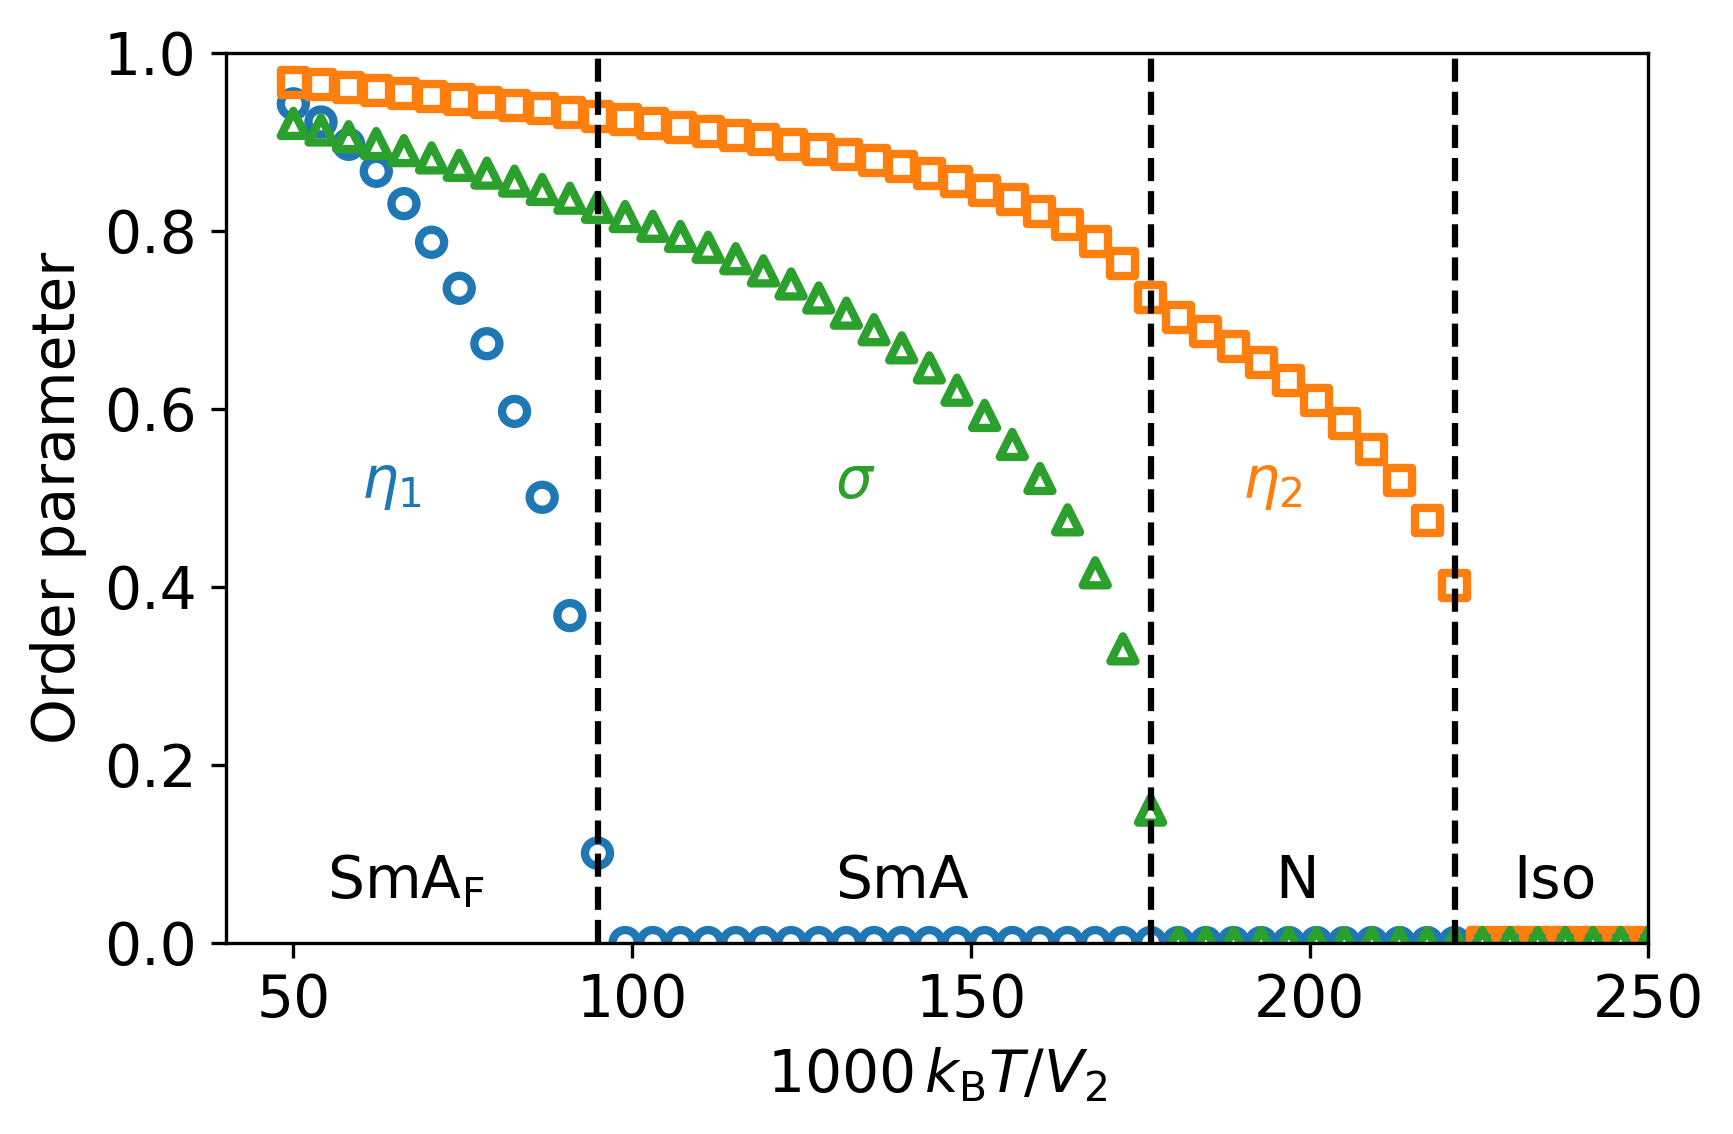
In order to check the validity of the model to describe the aforementioned phase transitions, we will analyze the temperature behavior of the order parameters and compare it to available experimental measurements. For instance, it is well-known that the spontaneous polarization is proportional to , and that the birefringence is proportional to . In Ref. Gibb et al., 2024, Gibb et al. report a material (compound ) that exhibits an Iso–N–SmA–SmA phase sequence (plus a low-temperature SmC which is out of the scope of this paper), for which good-quality measurements were obtained. Choosing and we can reproduce this phase sequence. The predicted evolution of the order parameters is shown in Fig. 2. At the Iso–N phase transition, exhibits a jump due to the sudden appearance of orientational order, which is always first-order. The N–SmA phase transition is also first-order and a jump in is observed, as expected. It is also manifested as a small jump in , which bears a strong resemblance to the measured birefringence curve (see Fig. 2d in Ref. Gibb et al., 2024). When passing to the SmA phase, becomes-non zero, and the order parameters (and entropy) exhibit no discontinuity due to it being a second-order phase transition. This is also close to reality, since the transition is weakly first-order. As the temperature is lowered in the SmA phase, measurements show a steeper increase in birefringence, but it could also be related to pretransitional effects close to a different lower-temperature phase. In any case, the authors directly measured in this temperature interval via polarized Raman spectroscopy, staying practically constant in the polar phase (Fig. 2e in their paper), as predicted by our model.
In a subsequent paper, having studied multiple pure compounds and mixtures, the same group of authors arrives at the conclusion that the mechanisms driving polar order are more or less independent of the mechanisms that drive mesogenic order Hobbs et al. (2024). Therefore, they argue that transitions that involve a change in both mesogenic and polar order are improbable, e.g. a N–SmA phase transition. This transition is, however, possible, as could already be observed in Fig. 1, and it has been recently realized in compound EST-4 in Ref. Matsukizono et al., 2024. As measurements, the authors only present a DSC curve which qualitatively agrees with our calculations (see Fig. S2).
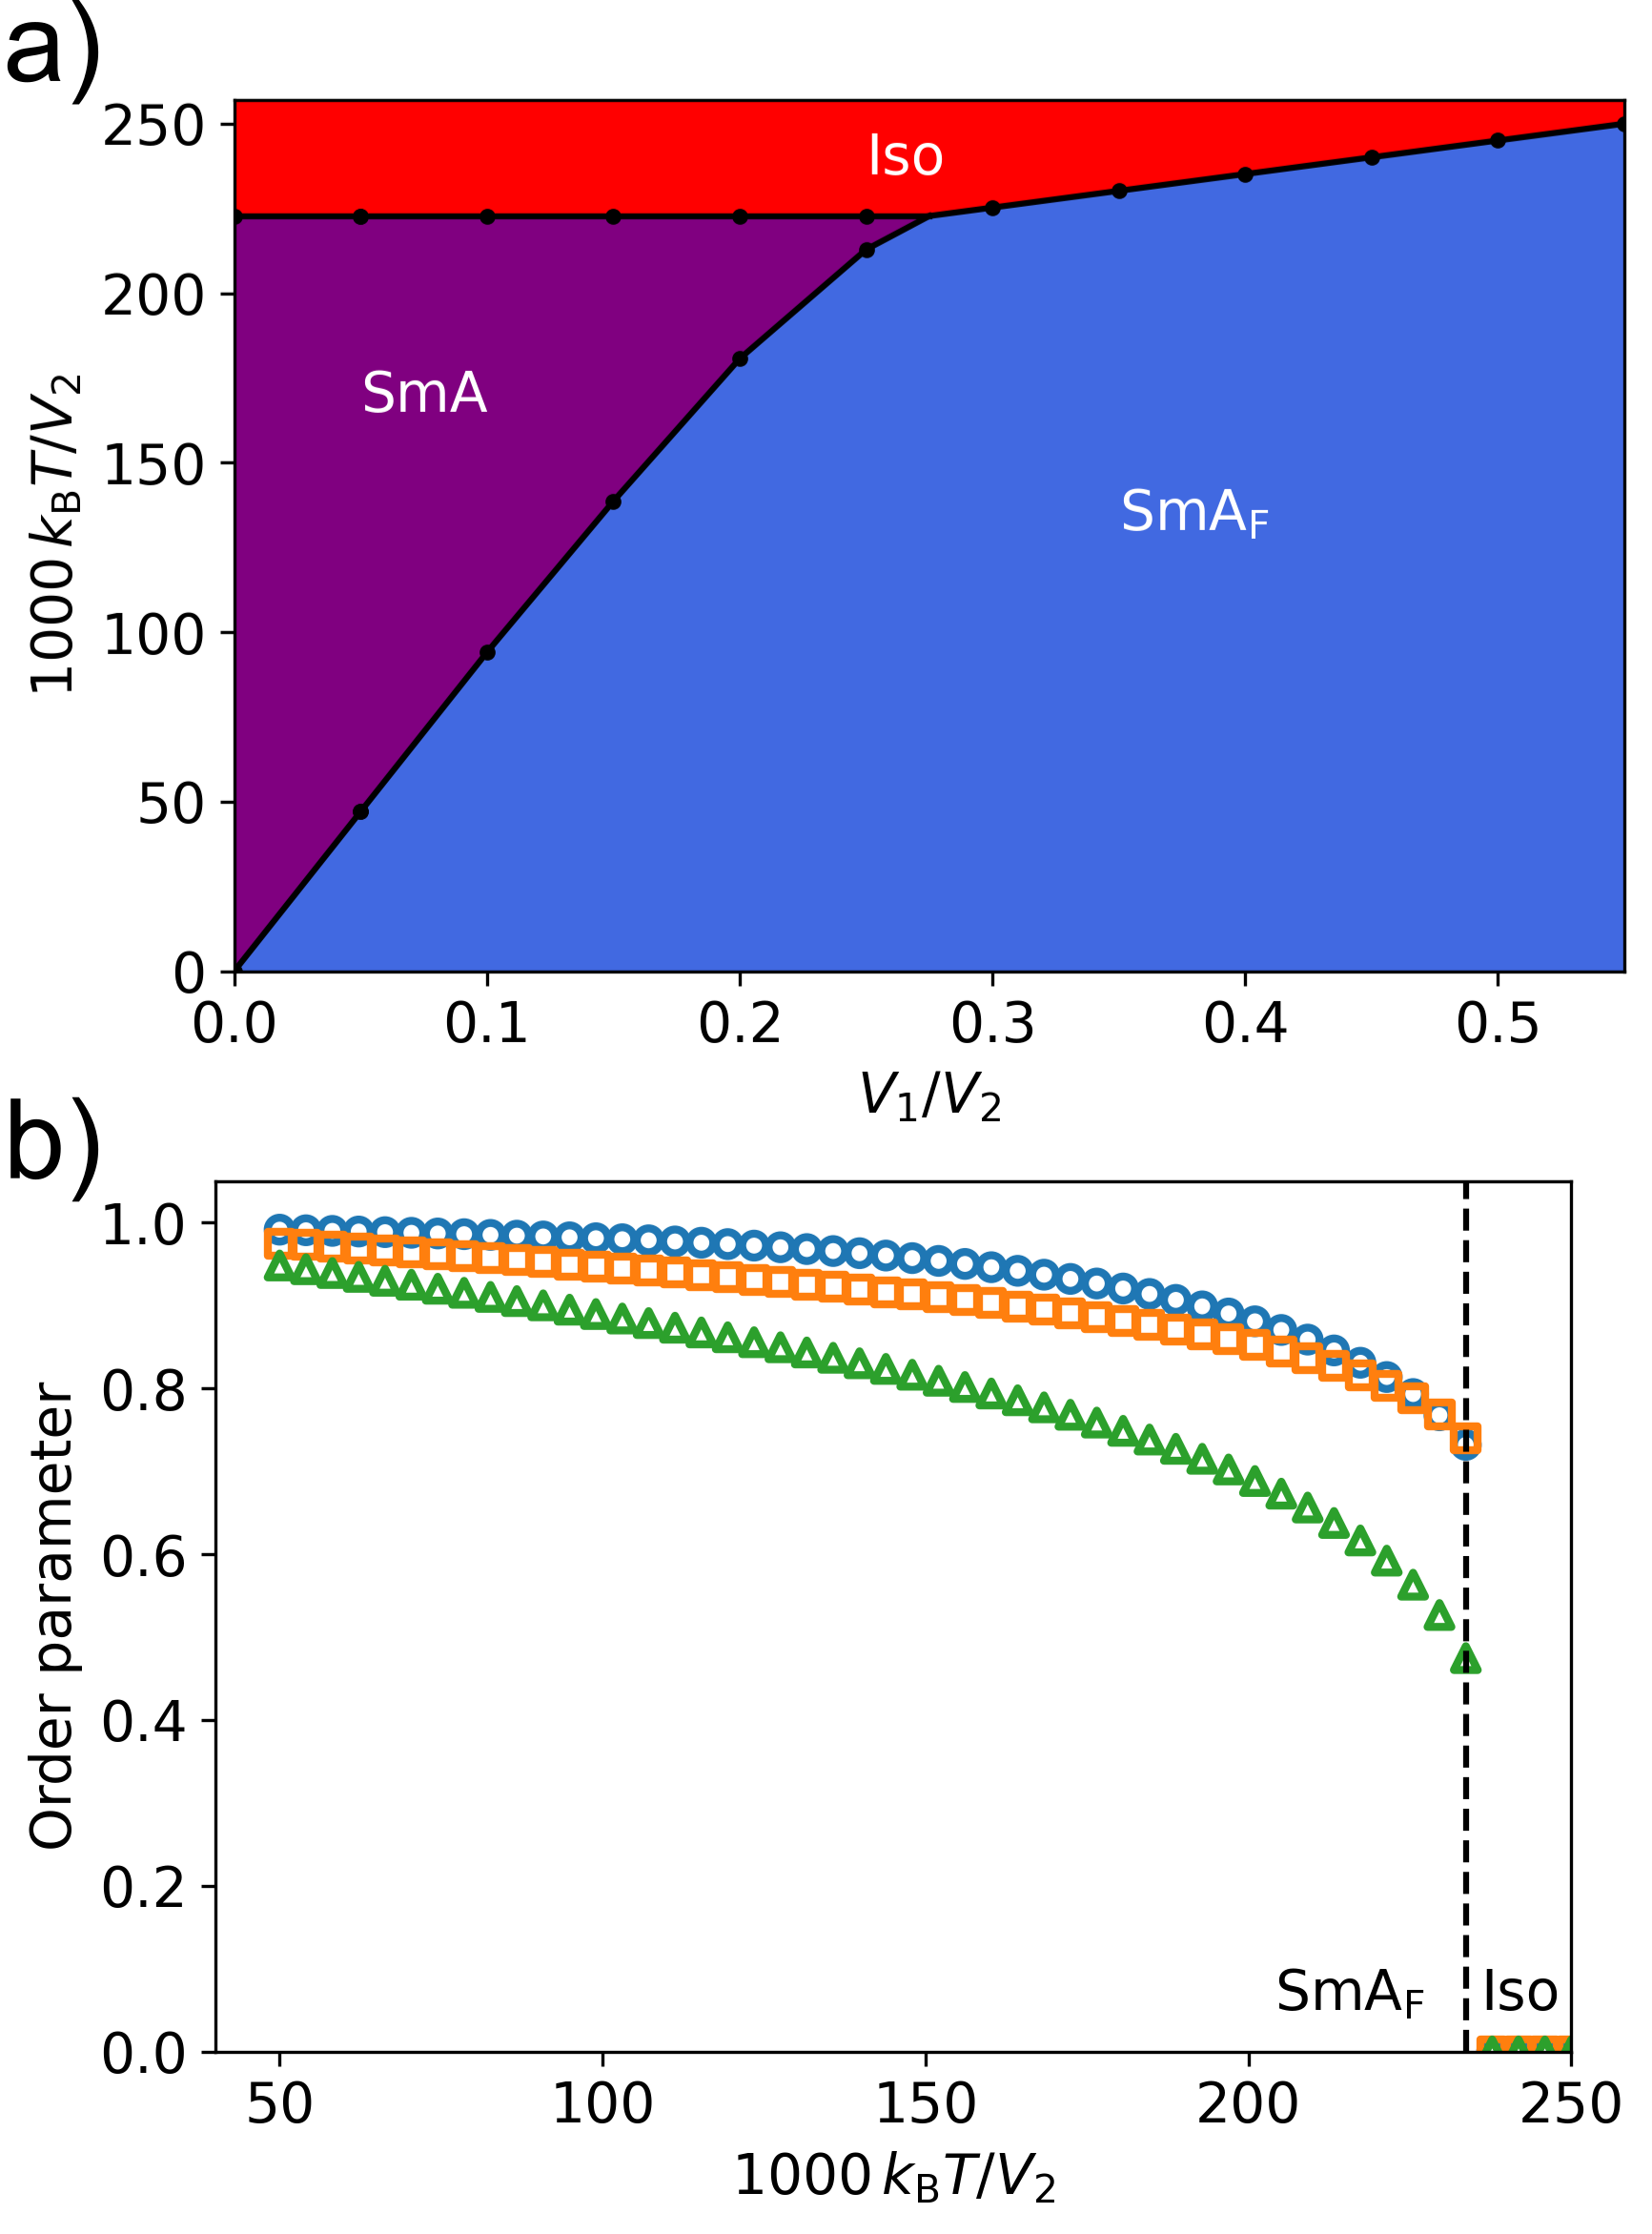
Another improbable transition would be a direct Iso–SmA transition. This implies that, at a certain temperature, orientational, positional and polar order must be favored at the same time, which seems unfeasible. In the case of polar nematics, however, a direct Iso–N transition was found a few years ago Manabe et al. (2021). In terms of our model, we can expect an Iso–SmA transition at large values of both and . Consequently, we have plotted in Fig. 3a a theoretical phase diagram for as a function of . As expected, for small values of we get an Iso–SmA–SmA phase sequence. As the strength of the polar interaction increases, the temperature interval of the SmA phase becomes narrower until it disappears. For a direct Iso–SmA phase transition is possible. These results imply that the molecule needs to be long and, at the same time, the interaction that gives rise to polar order needs to be strong. In Fig. 3b we can see what the evolution of the order parameters might look like for a particular case with and . Since this is a strongly first-order transition, a larger is to be expected in comparison with the previous transitions. Indeed, with the mentioned parameters J/mol K. Interestingly, a compound exhibiting this kind of phase transition has recently been synthesized (compound 10f in Ref. Nishikawa et al., 2023). The transition occurs at C, and the measured latent heat is kJ/mol, so that J/mol K, again in qualitative agreement with the theoretical value. The authors also provide spontaneous polarization measurements as a function of temperature in Fig. S25. Even though there are only a few points near the phase transition temperature, the curve points to a sudden increase of polar order upon cooling from the Iso phase, which rapidly saturates to its maximum value, as predicted in Fig. 3.
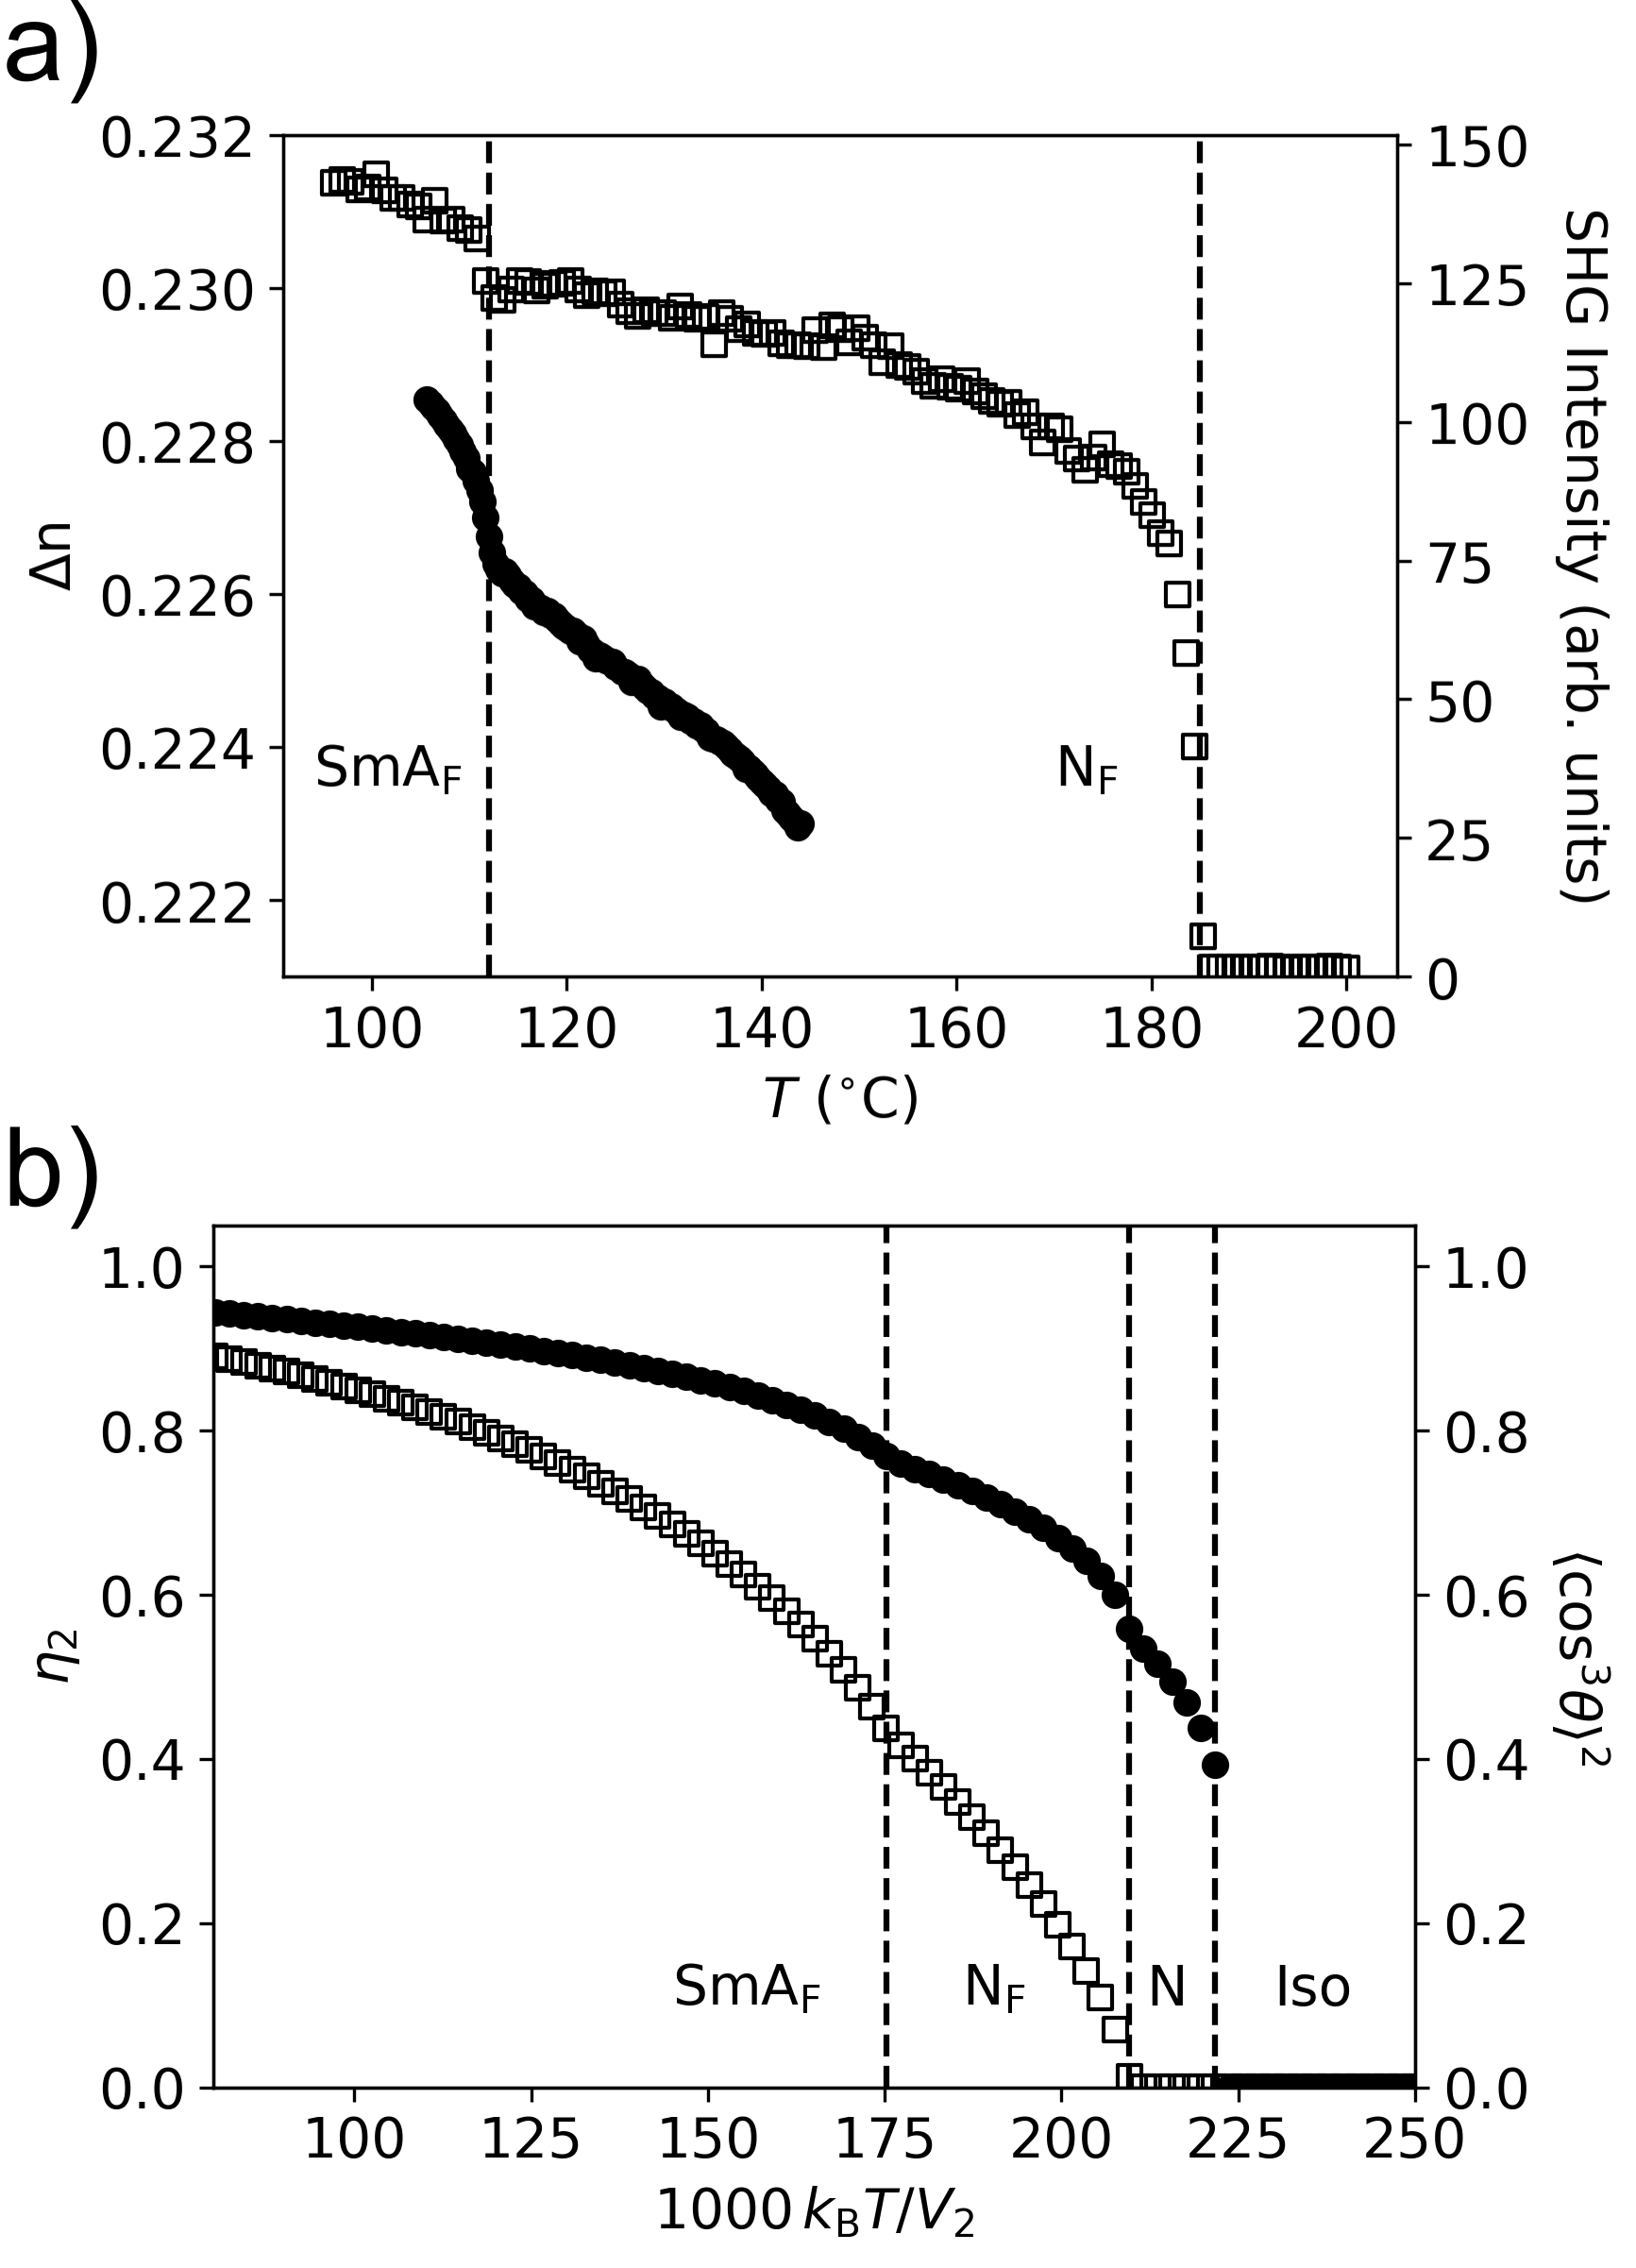
Lastly, we will present the results of our own experiments to make a more direct comparison with the model’s predictions. The studied compound is DIO-CN, an analog of the prototypical ferroelectric nematogen DIO. Details about the synthesis of this material can be found in Ref. Song et al., 2022. It is a highly polar molecule, with a dipole moment of D Song et al. (2022), and exhibits an Iso–C–N–C–N–C–N–C–SmA–C–Cry phase sequence. The appearence of the N phase is out of the scope of this paper but, since its temperature interval is narrow compared to the other phases, it will not hamper our analysis. In particular, we performed second-harmonic generation (SHG), birefringence and X-ray diffraction (XRD) measurements as a function of temperature (experimental details in the Supplemental Material). In Fig. 4 we have plotted the birefringence and SHG experimental results alongside with the theoretically predicted curves for model parameters and . As can be seen in Fig. 4a, the material shows no nonlinear optical activity in the N and N phases, as expected. At the transition to the N phase, however, the SHG intensity suddenly increases due to the emergence of long-range ferroelectric order. The reason why the experimental behavior is steeper than the theoretical one in Fig. 4b is because the SHG intensity, aside from depending on the second order dielectric susceptibility, carries a term, which depends on the dispersion of the extraordinary index ( being the sample thickness). This quantity can exhibit a jump at the transition that explains a larger jump in the SHG signal. The SHG intensity continues increasing down to the N–SmA transition, where it exhibits a small bump. In this region, the term is expected to be approximately constant, and the temperature dependence of the SHG signal is essentially due to . With regards to the birefringence , as shown in Fig. 4a, it exhibits an anomaly which is correctly captured by the model (Fig. 4b). Furthermore, the model also predicts a slightly larger jump at the N–N transition, which was already observed in Ref. Song et al., 2022 (although the N phase appears in the middle). We also performed XRD measurements and integrated the peak intensity of the (001) smectic plane to verify its proportionality to McMillan (1971) (see Figs. S3-S4).
In summary, the model successfully predicts a wide range of phase sequences and provides a simple intuitive picture of why certain phases are favored over others as a result of the interplay between two material parameters. It is important to emphasize that we are still in the process of understanding how polar order emerges in these systems. For this purpose, a fully microscopic theory that focuses on the specific mechanism that makes the parallel alignment of dipoles favorable should be sought after. One example in this category is the mechanism proposed by Madhusudana for the N phase Madhusudana (2021) who studied the electrostatic interaction between molecules modeled as charge density waves and found that the parallel alignment of dipoles is favored. Although this is definitely a promising result, the model has some shortcomings. For example, it has been shown that if the number of charge density waves is slightly reduced, to better represent some ferroelectric nematogens, the antiparallel alignment is preferred Erkoreka et al. (2024). Moreover, as recently noted by Osipov, Madhusudana’s results are insufficient, because it is also important to analyze if such an interaction contributes negatively to the free energy so as to overcome the orientational entropy Osipov (2024a, b). Osipov has also proposed a model combining dipole-dipole interactions and short-range orientational-translational correlations. Finally, a promising density functional theory approach focusing on dipole-dipole interactions has been proposed Chrzanowska and Longa (2024). Further research in this and other directions should be undertaken to arrive at a consistent theory of these novel polar phases of the N realm.
Acknowledgements.
We thank J. Etxebarria, J. Ortega and C.L. Folcia for the careful reading of the manuscript. A.E. and J.M.-P. acknowledge funding from the Basque Government Project IT1458-22. A.E. thanks the Department of Education of the Basque Government for a predoctoral fellowship (grant no. PRE_2023_2_0113). S.A. and M.H. acknowledge the funding supports from the National Key Research and Development Program of China (No. 2022YFA1405000), and Natural Science Foundation of Guangdong Province (2024B1515040023).References
- Papon et al. (2002) P. Papon, J. Leblond, and P. H. E. Meijer, The Physics of Phase Transitions (Springer Berlin Heidelberg, 2002).
- Yeomans (1992) J. M. Yeomans, Statistical mechanics of phase transitions (Clarendon Press, Oxford, England, 1992).
- Maier and Saupe (1958) W. Maier and A. Saupe, Zeitschrift für Naturforschung A 13, 564–566 (1958).
- Maier and Saupe (1960) W. Maier and A. Saupe, Zeitschrift für Naturforschung A 15, 287–292 (1960).
- Kobayashi (1970) K. Kobayashi, Physics Letters A 31, 125–126 (1970).
- K. Kobayashi (1970) K. K. Kobayashi, Journal of the Physical Society of Japan 29, 101–105 (1970).
- McMillan (1971) W. L. McMillan, Physical Review A 4, 1238–1246 (1971).
- Sebastián et al. (2022) N. Sebastián, M. Čopič, and A. Mertelj, Physical Review E 106, 021001 (2022).
- Mandle et al. (2017) R. J. Mandle, S. J. Cowling, and J. W. Goodby, Physical Chemistry Chemical Physics 19, 11429 (2017).
- Nishikawa et al. (2017) H. Nishikawa, K. Shiroshita, H. Higuchi, Y. Okumura, Y. Haseba, S.-i. Yamamoto, K. Sago, and H. Kikuchi, Advanced Materials 29, 1702354 (2017).
- Chen et al. (2020) X. Chen, E. Korblova, D. Dong, X. Wei, R. Shao, L. Radzihovsky, M. A. Glaser, J. E. Maclennan, D. Bedrov, D. M. Walba, and N. A. Clark, Proceedings of the National Academy of Sciences 117, 14021 (2020).
- Li et al. (2021) J. Li, H. Nishikawa, J. Kougo, J. Zhou, S. Dai, W. Tang, X. Zhao, Y. Hisai, M. Huang, and S. Aya, Science Advances 7, eabf5047 (2021).
- Sebastián et al. (2020) N. Sebastián, L. Cmok, R. J. Mandle, M. R. de la Fuente, I. Drevenšek Olenik, M. Čopič, and A. Mertelj, Physical Review Letters 124, 037801 (2020).
- Chen et al. (2023) X. Chen, V. Martinez, E. Korblova, G. Freychet, M. Zhernenkov, M. A. Glaser, C. Wang, C. Zhu, L. Radzihovsky, J. E. Maclennan, D. M. Walba, and N. A. Clark, Proceedings of the National Academy of Sciences 120, e2217150120 (2023).
- Kikuchi et al. (2022) H. Kikuchi, H. Matsukizono, K. Iwamatsu, S. Endo, S. Anan, and Y. Okumura, Advanced Science 9, 2202048 (2022).
- Chen et al. (2022) X. Chen, V. Martinez, P. Nacke, E. Korblova, A. Manabe, M. Klasen-Memmer, G. Freychet, M. Zhernenkov, M. A. Glaser, L. Radzihovsky, J. E. Maclennan, D. M. Walba, M. Bremer, F. Giesselmann, and N. A. Clark, Proceedings of the National Academy of Sciences 119, e2210062119 (2022).
- Etxebarria et al. (2022) J. Etxebarria, C. L. Folcia, and J. Ortega, Liquid Crystals 49, 1719 (2022).
- Folcia et al. (2022) C. L. Folcia, J. Ortega, R. Vidal, T. Sierra, and J. Etxebarria, Liquid Crystals 49, 899 (2022).
- Gibb et al. (2024) C. Gibb, J. Hobbs, D. Nikolova, T. Raistrick, H. Gleeson, and R. Mandle, “Spontaneous symmetry breaking in polar fluids,” (2024), arXiv:2402.07305 [cond-mat.soft] .
- Hobbs et al. (2024) J. Hobbs, C. J. Gibb, and R. J. Mandle, “Emergent anti-ferroelectric ordering and the coupling of liquid crystalline and polar order,” (2024), arXiv:2404.12271 [cond-mat.soft] .
- Matsukizono et al. (2024) H. Matsukizono, Y. Sakamoto, Y. Okumura, and H. Kikuchi, The Journal of Physical Chemistry Letters 15, 4212 (2024).
- Manabe et al. (2021) A. Manabe, M. Bremer, and M. Kraska, Liquid Crystals 48, 1079 (2021).
- Nishikawa et al. (2023) H. Nishikawa, M. Kuwayama, A. Nihonyanagi, B. Dhara, and F. Araoka, J. Mater. Chem. C 11, 12525 (2023).
- Song et al. (2022) Y. Song, M. Deng, Z. Wang, J. Li, H. Lei, Z. Wan, R. Xia, S. Aya, and M. Huang, The Journal of Physical Chemistry Letters 13, 9983–9990 (2022).
- Madhusudana (2021) N. V. Madhusudana, Physical Review E 104, 014704 (2021).
- Erkoreka et al. (2024) A. Erkoreka, N. Sebastián, A. Mertelj, and J. Martinez-Perdiguero, Journal of Molecular Liquids 407, 125188 (2024).
- Osipov (2024a) M. Osipov, Liquid Crystals , 1–7 (2024a).
- Osipov (2024b) M. Osipov, Liquid Crystals Reviews 12, 14–29 (2024b).
- Chrzanowska and Longa (2024) A. Chrzanowska and L. Longa, Liquid Crystals , 1–14 (2024).