Fragment-Masked Molecular Optimization
Abstract
Molecular optimization is a crucial aspect of drug discovery, aimed at refining molecular structures to enhance drug efficacy and minimize side effects, ultimately accelerating the overall drug development process. Many target-based molecular optimization methods have been proposed, significantly advancing drug discovery. These methods primarily on understanding the specific drug target structures or their hypothesized roles in combating diseases. However, challenges such as a limited number of available targets and a difficulty capturing clear structures hinder innovative drug development. In contrast, phenotypic drug discovery (PDD) does not depend on clear target structures and can identify hits with novel and unbiased polypharmacology signatures. As a result, PDD-based molecular optimization can reduce potential safety risks while optimizing phenotypic activity, thereby increasing the likelihood of clinical success. Therefore, we propose a fragment-masked molecular optimization method based on PDD (FMOP). FMOP employs a regression-free diffusion model to conditionally optimize the molecular masked regions without training, effectively generating new molecules with similar scaffolds. On the large-scale drug response dataset GDSCv2, we optimize the potential molecules across all 945 cell lines. The overall experiments demonstrate that the in-silico optimization success rate reaches 94.4%, with an average efficacy increase of 5.3%. Additionally, we conduct extensive ablation and visualization experiments, confirming that FMOP is an effective and robust molecular optimization method. The code is available at: https://anonymous.4open.science/r/FMOP-98C2.
Introduction
Molecular optimization plays a crucial role in drug discovery (Xia et al. 2024), which involves the modification and improvement of lead compounds identified through initial screening to enhance their drug-like properties (Wu et al. 2022). Historically, molecular optimization is planned manually according to knowledge and experience in the pharmacology, and optimized through fragment-based screening or synthesis (Chen et al. 2021). However, manual molecular optimization is not easily scalable to different needs and cannot be automated for large-scale optimization; thus, this strategy is insufficient for meeting the demands of current drug discovery (Schneider et al. 2020).
In recent years, deep learning (DL) methods, particularly diffusion models (Ho, Jain, and Abbeel 2020), have been observed to effectively optimize molecules that meet specific conditions (Zhou et al. 2024; Gu et al. 2024), with the potential to accelerate traditional paradigms. Molecular optimization can rapidly identify potential drug candidates using existing experimental data and molecular structures, reducing the need for blind experimentation and enhancing research efficiency (Choudhuri et al. 2023). Several molecular optimization methods have been proposed to enhance candidate molecule performance, such as target pocket- (Huang et al. 2024) and property-based molecular optimization (Lee et al. 2024).
Target pocket-based molecular optimization methods rely on understanding specific pocket structures and their hypothesized roles in combating diseases (Moffat et al. 2017). Challenges such as a limited number of available targets and difficulty capturing clear structures hinder innovative drug development. In contrast, phenotypic drug discovery (PDD) (Vincent et al. 2022a) does not depend on well-defined target structures and can identify hit compounds with novel and multi-target properties. PDD emphasizes the phenotypic effects of molecules within disease-related biological systems (Sadybekov and Katritch 2023) and has significantly contributed to the discovery of first-in-class drugs (Swinney 2013). By observing the phenotypic changes that molecules induce in cells, tissues, or organisms, PDD identifies potential drugs without requiring prior knowledge about specific targets (Vincent et al. 2022b). As a result, PDD’s potential as a drug discovery tool that addressing complex diseases that are not yet fully understood by the scientific community is evident. Extensive PDD research has been conducted, with significant efforts made in constructing relevant datasets such as the genomics of drug sensitivity in cancer (GDSC) (Yang et al. 2013; Garnett et al. 2012). Based on these datasets, numerous artificial intelligence-driven methods (Hostallero et al. 2023; Li et al. 2024b, c) have been proposed to predict drug responses against specific cell lines, typically quantified by the half-maximal inhibitory concentration (IC50) (Cho et al. 2022). These advancements have significantly accelerated PDD research (Reddy and Zhang 2013).
Based on prior knowledge, molecular optimization methods specifically designed for PDD have not been proposed, primarily due to several challenges in this field. First, encoding molecular interactions with cellular systems differs significantly from existing target-based molecular optimization approaches. Second, the evaluation metrics for these tasks vary, making direct adaptation challenging. While the physicochemical drug properties (e.g., lipophilicity and solubility) can be measured quickly and cost-effectively (Morehead and Cheng 2024; Xiong et al. 2023), and drug-target affinities can be accurately predicted using existing virtual screening techniques (Ru et al. 2022; Lu et al. 2022), these approaches are not directly applicable to PDD. In the context of PDD optimization, the ideal evaluation metric is the IC50 value, which reflects the interaction between molecules and cell lines. Although determining IC50 values experimentally is time-consuming and expensive, they can be predicted by drug response prediction (DRP) models within a certain margin of error. By evaluating the predicted IC50 distribution of an optimized molecular set, we can assess the optimization model’s effectiveness, thereby mitigating the impact of prediction errors.
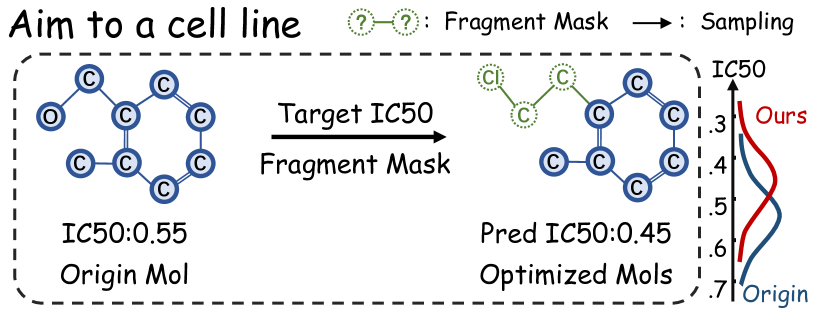
For this reason, we propose a fragment-masked molecular optimization method for the PDD (FMOP). As shown is Fig. 1, the FMOP method’s optimization conditions include the initial molecule to be optimized, its corresponding masked fragments, the target cell line, and the IC50 value. Notably, the IC50 is an efficacy measure of a single drug response against one specific cell line, obtained through the wet experiment. The output is a batch of optimized molecules under specified conditions. In addition, FMOP employs a regression-free diffusion model to conditionally optimize the molecules’ masked regions, effectively generating new molecules with similar scaffolds and improving IC50 without training. Specifically, molecules’ fragment masks are primarily based on scaffolds and side chains in the molecular structure. First, we apply rule-based constraints to the fragmentation results. Then, we use a pre-trained diffusion model as the generative prior and adjust the unmasked region sampling process during the reverse diffusion iteration using the given drug information, without modifying or conditioning the original diffusion model.
On the large-scale drug response dataset GDSCv2 (Yang et al. 2013), we conduct optimization experiments on all 945 cell lines, demonstrating an in-silico optimization success rate of 94.4% and an average efficacy increase of 5.3%. Additionally, through extensive ablation and visualization experiments, we further demonstrate that FMOP is an effective and robust molecular optimization method with broad application prospects in PDD. This paper’s contributions are as follows:
-
1.
We introduce FMOP, a novel fragment-masked molecular optimization method. The FMOP method integrates scaffold-based fragments with rule-based constraints and leverages a pre-trained diffusion model to optimize masked regions according to molecule information and the PDD task conditions, without requiring model training. To the best of our knowledge, the FMOP is the first optimization method for the PDD task.
-
2.
Optimization experiments were conducted across all 945 cell lines in the GDSCv2 dataset, demonstrating a 94.4% success rate and a 5.3% average increase in efficacy through optimization. Extensive visualization evaluations further indicate FMOP’s robustness and broad applicability.
Related Work
Molecular optimization aims to improve drug properties, including physicochemical (e.g., solubility, stability, and absorption) and biomedical attributes (e.g., toxicity, target affinity, and drug-cell response), thereby enhancing drug candidate effectiveness.
Existing molecular optimization methods can be broadly categorized into rule- and deep learning-based methods. Rule-based methods, such as pharmacophore modeling, rely on predefined structural rules to suggest modifications. In comparison, deep learning-based methods, such as those utilizing the denoising diffusion probabilistic model (DDPM) (Xie et al. 2024; Peng et al. 2022; Ho, Jain, and Abbeel 2020), have demonstrated great potential for molecular optimization. These methods integrate DDPM’s ability to generate high-quality and diverse molecules with specific optimization goals and conditions to efficiently refine molecular structures and properties.
Despite significant progress, current molecular optimization techniques encounter limitations in meeting PDD requirements. Numerous studies have been proposed optimizing physicochemical properties (Xiong et al. 2023; Born and Manica 2023), such as toxicity and target affinity (Huang et al. 2024; Jorgensen 2009), demonstrating significant potential in accelerating molecular optimization. However, PDD molecular optimization methods have not been thoroughly investigated. Some drugs exhibit favorable solubility and stability in vitro but fail to deliver the expected efficacy in practical applications (Rocha et al. 2023). This gap often occurs due to current methods disregarding the complexity of cellular environments. In addition, current optimization methods are often limited to specific masks or predicting functional group placements (de Souza Neto et al. 2020). These fragment-based approaches often regard molecular optimization as the addition or deletion of individual atoms or chemical bonds (Huang et al. 2024; Cheng et al. 2023). Consequently, when tackling novel mask types or tasks, these methods may struggle to handle complex masking scenarios due to limited training data, thereby restricting their applicability (Bröker et al. 2022).
Method
Problem Formulation. Molecular optimization aims to enhance a molecule’s properties to reveal improved alternatives. For the PDD-based optimization task, the molecule’s property is its efficacy in a specific cell line, denoted as IC50.
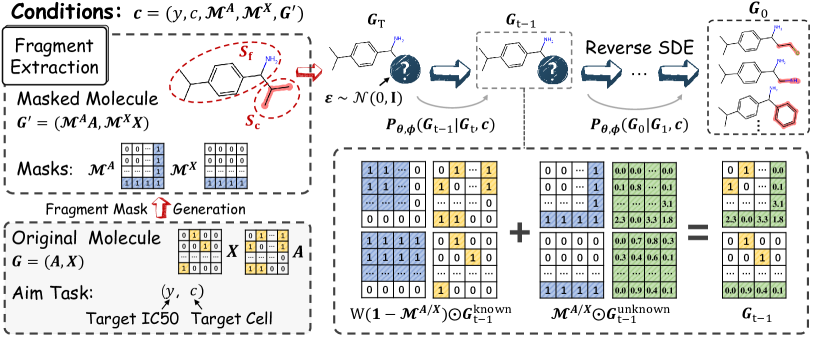
Let one molecule be represented as , the cell line as , and their IC50 as . The optimized molecule’s with respect to is denoted as . Therefore, for a given , the optimized result should satisfy . Based on our fragment-masked method, we decomposed into a scaffold and a side chain , where a mask marks the side chain’s fragment structure. For one molecule , denotes an ordered array of the atom mask , where the atoms on the scaffold are labeled as 0 and those on the side chain as 1. In addition, represents an ordered array of the edge mask , with edges on the side chain labeled as 1 and those on the scaffold or between scaffolds and side chains labeled as 0.
Overview. To generate molecules with a specific distribution under numerical drug response conditions, we employed a regressor-free conditional diffusion method. As illustrated in Fig. 2, we integrated specific conditions about the cell line and IC50 into the scoring estimation to guide the diffusion model. Specifically, to establish the molecules’ conditional constraints, we split the molecule into its scaffold and side chain to generate the fragment masks. Then, we performed molecule splitting according to the Murcko scaffold method.
Finally, during the sampling phase, the drug response and fragment mask jointly constrained the sampling process, generating specific fragments that met the conditions in the mask regions.
Molecular Conditional Generation
Typically, the input conditions for molecular optimization methods are categorical. To more precisely and efficiently optimize molecular graphs to specific conditional distributions, our model for conditional generation follows the regressor-free molecular generation method (Li et al. 2024a), which can effectively generate molecules under the given numerical conditions. Moreover, the conditions comprise text labels for the PDD task (i.e., the cell line name and IC50 values) and fragment mask arrays and . To effectively receive text conditions, we employed a contrastive learning strategy to align the two feature types. The drug, cell line, and fusion drug response encoders are denoted as , , and respectively.
Moreover, the text encoder that describes the reaction process between the drugs and cell lines is denoted as , and its input text is generated through a template with two parameters (), as the response value of the drug with the is . For the -th representations generated by the and the -th captions produced by the caption encoder in a batch , we normalized the feature vectors in a hyper-sphere using and . Finally, the similarity between and was calculated as . Hence, the supervised contrastive loss function can be expressed as:
| (1) | |||
where, is the size of the batch , and is the temperature for scaling the logits.
By pre-training using contrastive learning, we ensured that its encoding space is aligned with that of . Subsequently, we adopted an approach similar to the classifier-free guidance method, using the pre-trained contrastive model as a conditional encoder. To guide the generation process towards the desired sampling conditioning information , we sampled the conditional distribution , and carried the expectations over to the samples and . Thus, the transition probability can be represented as follows:
| (2) |
For time , we introduced objectives (Song et al. 2020) to generalize score matching and estimate the scores as follows:
| (3) | |||
| (4) | |||
Fragment Mask Generation
Scaffolds typically refer to a molecule’s core structure or main ring system that determines its basic shape and properties (Li et al. 2019). In contrast, side chains are the branches or functional groups attached to the scaffolds. By altering the side chain properties, we can modulate the molecule’s solubility, polarity, reactivity, and various properties. As a result, we designed a fragment-based molecular optimization method. Molecular fragmentation is primarily based on the scaffolds and side chains in the molecule’s structure, and we applied rule-based constraints to the fragmentation results.
For a specific molecule , we first analyzed the molecule’s scaffold using the Murcko scaffold function in the RDKit tool (denoted as ), extracting its core scaffold structure and side chains .
| (5) |
In this instance, these side chains are referred to as fragments. After excluding the fragments containing only single atoms (e.g., C, N, Cl, and F), we verified the connectivity between and using .
| (6) |
If a fragment has multiple connection points to the scaffold , it makes the optimization task very difficult but also destroys the original scaffold’s properties. Consequently, these fragments were not considered for optimization.
Additionally, by determining whether a fragment has only one atom connected to the retained scaffold with the function , we ensured its independent optimizability. This is because is generated based on . To ensure that the information of separate chemical bonds is not disclosed, we marked the row and column elements corresponding to the atoms in the fragment as 1 in .
Finally, the fragment that meets the criteria is considered for optimization. Furthermore, the fragment masking involves two matrices, used for atom and bond masking in the graph , respectively.
| (7) |
| (8) |
Specifically, the atom indices in correspond to those where the elements of are 1. In addition, the matrix is derived from , where the elements of are set to 0 if the atoms are part of the scaffold .
Fragment-Masked Molecular Optimization
Molecular optimization aims to enhance specific molecular properties by leveraging their intrinsic information. This paper focuses on optimizing the molecules’ fragment regions to improve their cell line experiment responses. Hence, we employed a trained conditional diffusion denoising model. The condition’s inputs include the original molecule , two masks and , and the PDD task targets . The output comprises multiple structurally similar molecules that exhibit improved IC50 values, denoted as , for the given cell line .
Specifically, as each reverse step from to relies solely on , it is essential to guide the masked region generation according to the known regions of and the input optimization targets, described as follows:
| (11) | |||
| (14) |
| Methods | Cell: 909729 | Cell: 687800 | Cell: 687787 | Total Cell (945) | ||||
|---|---|---|---|---|---|---|---|---|
| N@100 | Improv. | N@100 | Improv. | N@100 | Improv. | Success Rate | Improv. | |
| GDSS (Jo, Lee, and Hwang 2022) | - | 0% | - | 0% | - | 0% | 0.8% | 1.1% |
| DiGress (Vignac et al. 2023) | 3 | 3.4% | 4 | 6.4% | 1 | 4.2% | 69.3% | 3.0% |
| DruM2D (Xu et al. 2023) | 1 | 4.3% | 2 | 6.5% | 2 | 4.2% | 69.4% | 2.6% |
| MOOD (Lee, Jo, and Hwang 2023) | 1 | 0.7% | 7 | 3.8% | 1 | 0.6% | 34.8% | 1.7% |
| CDGS (Huang et al. 2023) | 3 | 0.8% | 3 | 3.9% | 3 | 1.6% | 32.5% | 1.6% |
| FMOP (Ours) | 11 | 7.8% | 10 | 5.6% | 15 | 8.8% | 94.4% | 5.3% |
where, and are the adjacency and node matrices of the initial molecule at time , is the schedule function, and . In addition, the reverse process is modeled by two neural networks (the details can be found in Eqs. 3 and 4) that predict the parameters and of the Gaussian distributions with the given conditions.
Finally, at time step , unknown and known regions are identified, constrained using two masks, and combined to form :
| (17) |
where, denotes the element-wise product, ”kn” and ”ukn” are the abbreviations for ”known” and ”unknown,” respectively. is a coefficient that gradually decreases from 1 to 0 over time t, and is used to control the scaffold’s influence on the sampled region. After combining the known and optimized generated regions using the masks, the resulting is incorporated into the next denoise step as follows:
| (18) |
where, the noise , is a conditional control strength parameter (), and indicates unconditional generation.
Rule-Based Chemical Bond Post-Processing. During the sampling phase, the GNN-based score prediction model’s inherent limitations in the molecular generation process prevent each atom from obtaining information beyond the GNN layer’s -hop neighborhood. This limitation may cause the model to miss global features or long-range interactions between atoms when generating molecular structures, which can, in turn, affect the overall structural rationality and stability of the molecule (Kim et al. 2023; Cai et al. 2022). Therefore, global optimization is necessary.
Thus, we changed the global features of the sampled molecule to correct specific local edge types. Specifically, we changed the molecular structure by converting continuous double bonds to single and modifying six-carbon double-bonded to aromatic rings. These corrections ensure that the generated molecules meet the chemical stability and structural rationality requirements, thereby improving the accuracy and effectiveness of molecular optimization.
Experiment
Experimental Setup
This study utilized two primary datasets: QM9 (Ramakrishnan et al. 2014) and GDSCv2 (Yang et al. 2013). The QM9 dataset was used for pre-training the model to enhance molecular diversity, and contains approximately 133,885 molecules. These data provide the model with rich molecular information, improving its generalization ability. Likewise, the GDSCv2 dataset was used for tasks related to drug response prediction (Shubham et al. 2024; Campana, Prasse, and Scheffer 2024), and comprises approximately 190,853 samples, covering 945 cell lines and 220 drugs. GDSCv2 enables learning and predicting drug response distributions. This is significant for precision medicine and new drug development (Ren et al. 2023).
Evaluation Criteria. Molecules labeled with drug response for the cell line are selected from the GDSCv2 dataset, focusing on those with IC50 values in the top 20% to 30%. These molecules, referred to as , were used as the target molecules for optimization. N@100 is a counting function, if the IC50 of the optimized molecules is lower than the average , the count is incremented by one. The Improv. represented the improvement in IC50 before and after molecular optimization. Our method calculated the average increase based on the true IC50 values for each molecule being optimized, while other methods also used the average IC50 of these molecules to compute the average increase.
It is important to note that the generated or optimized molecules’ the efficacy (i.e., the IC50) in various cell lines was predicted using the deep learning models and not wet lab validation. This is because the wet lab validation involves molecular synthesis and cell-based assays, processes that are time-consuming and extremely costly. Therefore, we relied on the out-of-domain drug response prediction (OOD-DRP) methods (Li et al. 2024c; Chen et al. 2022; Sharifi-Noghabi et al. 2021) to predict the IC50 of the newly generated molecules. The contrastive learning drug response model based on natural language supervision (CLDR) focused on out-of-domain generalization and demonstrated state-of-the-art correlation in response predictions (Li et al. 2024b). Consequently, we used the CLDR as the OOD-DRP method.
Overall Experiments
To validate the effectiveness of FMOP, this study has meticulously ensured fairness by comparing it with five baseline models. GDSS (Jo, Lee, and Hwang 2022), DiGress (Vignac et al. 2023), and DruM2D (Xu et al. 2023) are unconditional molecular generation methods, while MOOD (Lee, Jo, and Hwang 2023) and CDGS (Huang et al. 2023) are conditional molecular generation methods that utilize specific category and the dataset distributions to guide molecular generation. Existing molecular optimization methods can be broadly categorized into target pocket- and property-based molecular optimization. Target pocket-based methods require detailed structural information and binding site data, whereas property-based optimization methods fail to integrate cellular genomics and drug-cell fusion information. Consequently, these methods cannot be directly compared with our approach.
To verify whether our method can effectively optimize molecules to achieve better drug response values, we conducted overall experiments involving various diffusion models. Due to the novelty of the molecule generation method, generated molecules are out-of-domain and require the OOD-DRP model to have a high generalization capability. Therefore, we used the CLDR method (Li et al. 2024b), which has excellent generalization performance, to predict the optimized molecules.
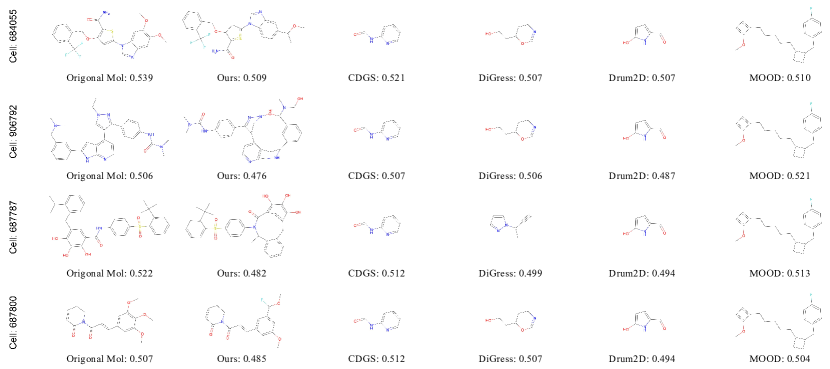
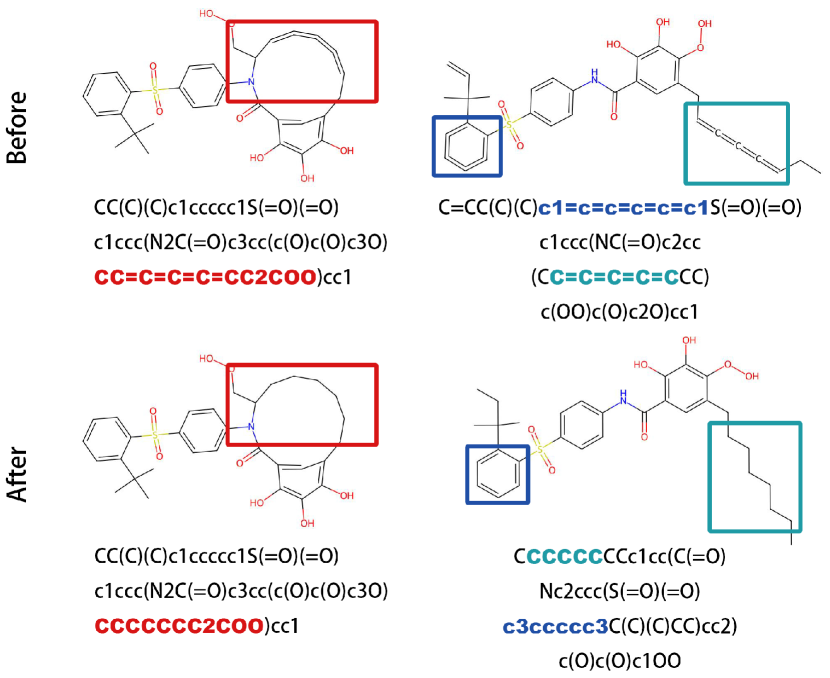
Table 1 displays the optimization results of six methods in three different cell line scenarios and the average optimization results across 945 cell lines. Our method achieves the best optimization and increase rate results, surpassing the second-best method by 36.0% and 76.7%, respectively. To verify that our method can effectively optimize fragment regions while maintaining scaffold consistency, we conducted a visual comparison of the results. As shown in Fig. 3, our method maintains scaffold consistency while optimizing the masked region. In contrast, other methods’ optimization success was primarily due to the random generation of a few molecules with good efficacy across various cell lines. However, these methods cannot adjust the sampling space distribution for specific tasks, resulting in poor performance.
Ablation Study
| Methods | Success Rate | Improv. | TN@100 |
| w/o. Fragment Mask | 0.3% | 2.1% | 26 |
| w/o. Task Guidance | 5.0% | 2.1% | 1278 |
| w/o. Modification | 70.8% | 9.4% | 12352 |
| Origin Method | 94.4% | 5.3% | 23789 |
In the FMOP method, the PDD task information and fragment masks are encoded as indispensable conditions, and their impact on the final optimization results is significant. Therefore, three key points need to be explored:
Q1: Do the conditional information (i.e., the expected IC50 values and cell line types) play a crucial role in the molecular optimization process, thereby improving optimization success rates and efficacy enhancements?
Q2: Can fragment masking effectively focus optimization on specific regions to improve efficacy and optimization success rates?
Q3: Given the current issues with aromatic ring quality and single/double bond generation, is rule-based chemical bond post-processing an effective method for molecular generation?
As shown in Table 2, each component significantly contributes to the model’s overall performance. For Q1, without the fragment mask prompt, our method generates molecules randomly, resulting in a drastic decline in the success rate to 0.3% and an improvement of 2.1%, with only 26 instances reaching N@100. This indicates that the fragment mask is crucial for identifying key molecular features.
For Q2, when task guidance is removed, the success rate is 5.0%, and the improvement rate remains at 2.1%. The absence of task guidance leads to a random fragment generation strategy, where we use the top most frequent fragments to assemble the scaffold, yielding a success rate of 5%. This demonstrates that task guidance is essential for potential molecule optimization.
For Q3, the success rate further increased to 94.4% through post-processing based on the aromatic ring recognition rules. This suggests that molecular modifications are essential for achieving a high success rate, although they introduce some complexity.
Visualization Analysis
To explore whether the molecules generated or optimized using different methods achieved a certain confidence level instead of merely evaluating the methods based on numerical values, we visually analyzed the molecular structures generated using our optimization method and baselines across different cell lines. As shown in Fig. 3, our method generates unique molecules for each cell line, ensuring that the optimization process does not converge to the same local optimum across different cell lines. In comparison, the molecules generated using other methods were generally similar, highlighting that our method is able to optimize molecular structures based on the specific response values of each cell line, thereby achieving more effective and suitable molecular structures. Furthermore, our method’s predicted IC50 values remain consistently low across different cell lines, indicating that our optimized molecules have a competitive advantage compared to de novo designed molecules. For example, for cell line 906792, our method generated a molecule with an IC50 value of 0.48, while the other approaches generated different molecules with IC50 values ranging from 0.49 to 0.51.
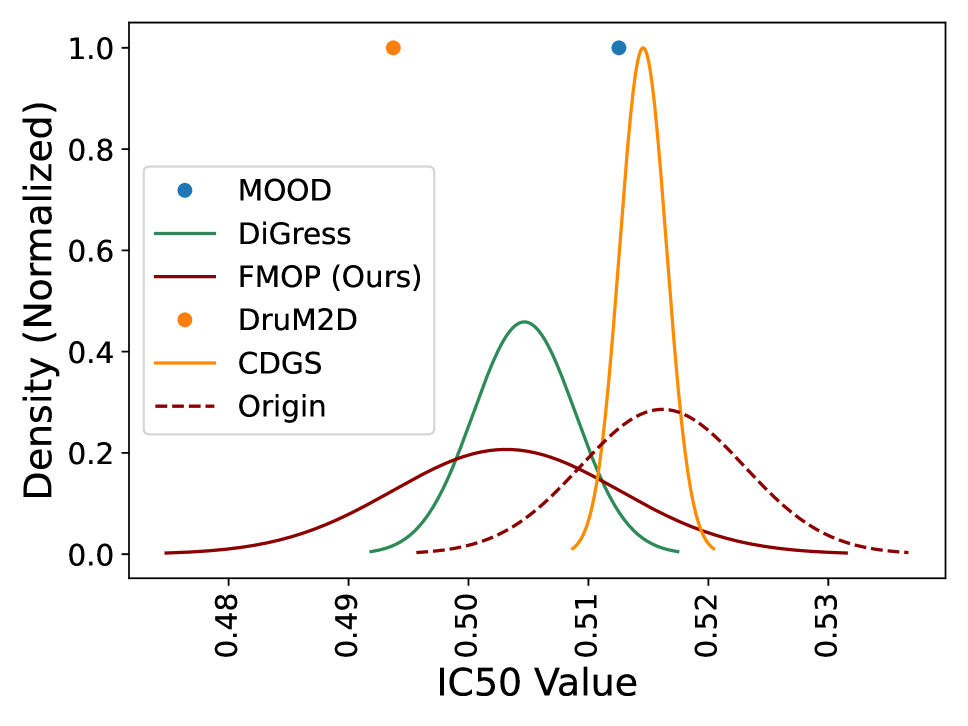
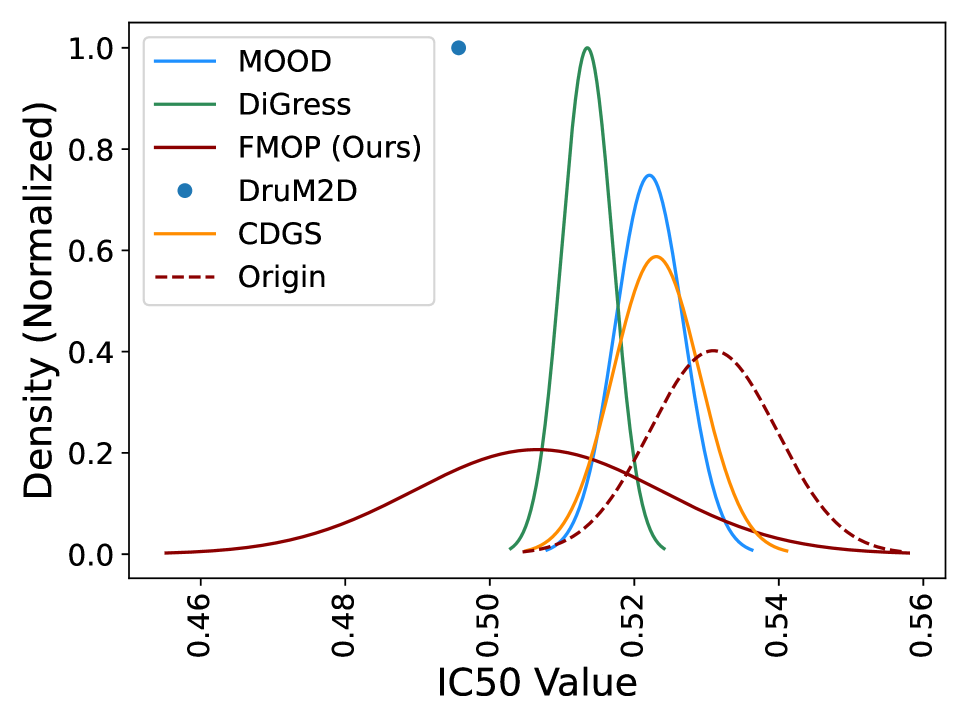
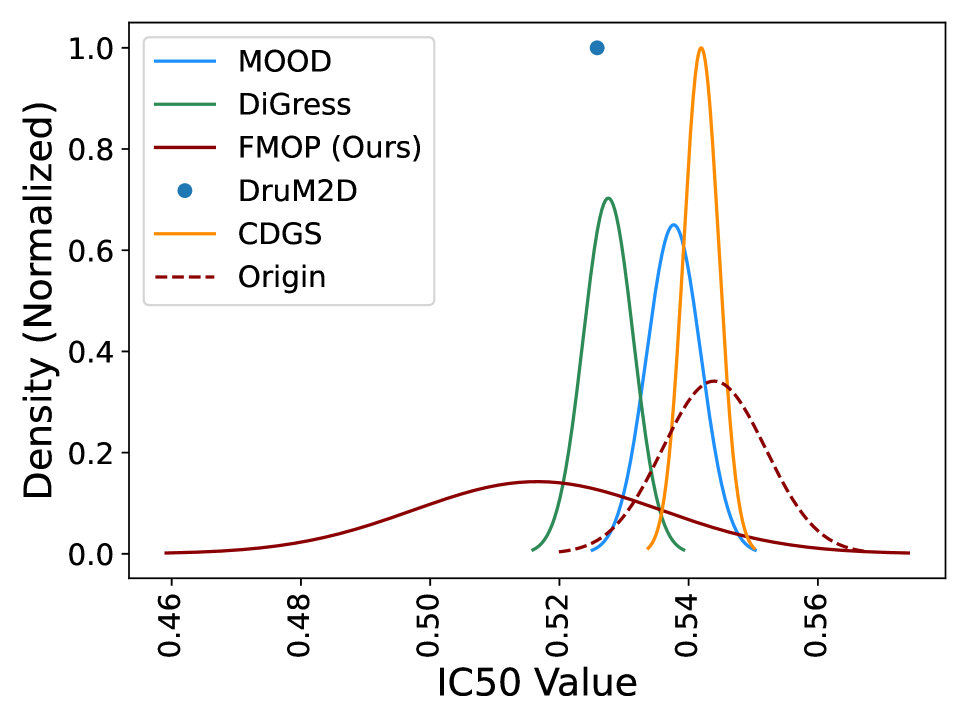
Since measuring the IC50 for all virtually generated molecules on 945 specific cell lines in a short time is impractical, we utilized the CLDR method to predict these values. To validate our method’s effectiveness, as shown in Fig. 4, we predicted the IC50 values for the cell lines 906792, 688006, and 949090, and visualized the mean and variance by assuming a Gaussian distribution. As a result, our proposed FMOP method demonstrated a strong competitiveness in the lower IC50 range. For example, in Fig. 4(a), the IC50 values for the molecules generated by FMOP fall between 0.47 and 0.53, while those generated using other methods mostly fall between 0.49 and 0.52. Additionally, the IC50 distribution of the original molecules (denoted as ’Origin’) ranged between 0.51 and 0.52. After optimization using our method, the mean IC50 of the molecules showed a significant improvement, approximately by 3%. The results generated by MOOD and DruM2D are represented by , indicating that only one single effective molecule was optimized for cell line 906792, resulting in a variance of 0.
Conclusion
To address the PDD challenge of generating molecules, which requires screening a vast number of possible molecular structures, we proposed the FMOP method. To the best of our knowledge, the FMOP is the first optimization method for the PDD task. FMOP employs a regression-free diffusion model to conditionally sample the masked regions of molecules for optimization, effectively generating new molecules with similar scaffolds and improved efficacy. We optimized the molecules for all 945 cell lines on the GDSCv2. The overall experiments demonstrated that the in-silico optimization success rate reaches 94.4%, with an average efficacy increase of 5.3%. Additionally, we conducted extensive ablation studies and visualization experiments, proving that FMOP is an effective and robust molecular optimization method.
References
- Born and Manica (2023) Born, J.; and Manica, M. 2023. Regression transformer enables concurrent sequence regression and generation for molecular language modelling. Nature Machine Intelligence, 5(4): 432–444.
- Bröker et al. (2022) Bröker, J.; Waterson, A. G.; Smethurst, C.; Kessler, D.; Böttcher, J.; Mayer, M.; Gmaschitz, G.; Phan, J.; Little, A.; Abbott, J. R.; et al. 2022. Fragment Optimization of Reversible Binding to the Switch II Pocket on KRAS Leads to a Potent, In Vivo Active KRASG12C Inhibitor. Journal of Medicinal Chemistry, 65(21): 14614.
- Cai et al. (2022) Cai, H.; Zhang, H.; Zhao, D.; Wu, J.; and Wang, L. 2022. FP-GNN: a versatile deep learning architecture for enhanced molecular property prediction. Briefings in bioinformatics, 23: bbac408.
- Campana, Prasse, and Scheffer (2024) Campana, P. A.; Prasse, P.; and Scheffer, T. 2024. Predicting Dose-Response Curves with Deep Neural Networks. In Forty-first International Conference on Machine Learning.
- Chen et al. (2022) Chen, Y.; Zhang, Y.; Bian, Y.; Yang, H.; Kaili, M.; Xie, B.; Liu, T.; Han, B.; and Cheng, J. 2022. Learning causally invariant representations for out-of-distribution generalization on graphs. Advances in Neural Information Processing Systems, 35: 22131–22148.
- Chen et al. (2021) Chen, Z.; Min, M. R.; Parthasarathy, S.; and Ning, X. 2021. A deep generative model for molecule optimization via one fragment modification. Nature machine intelligence, 3(12): 1040–1049.
- Cheng et al. (2023) Cheng, A. H.; Cai, A.; Miret, S.; Malkomes, G.; Phielipp, M.; and Aspuru-Guzik, A. 2023. Group SELFIES: a robust fragment-based molecular string representation. Digital Discovery, 2(3): 748–758.
- Cho et al. (2022) Cho, K.; Choi, E.-S.; Kim, J.-H.; Son, J.-W.; and Kim, E. 2022. Numerical learning of deep features from drug-exposed cell images to calculate IC50 without staining. Scientific Reports, 12(1): 6610.
- Choudhuri et al. (2023) Choudhuri, S.; Yendluri, M.; Poddar, S.; Li, A.; Mallick, K.; Mallik, S.; and Ghosh, B. 2023. Recent advancements in computational drug design algorithms through machine learning and optimization. Kinases and Phosphatases, 1(2): 117–140.
- de Souza Neto et al. (2020) de Souza Neto, L. R.; Moreira-Filho, J. T.; Neves, B. J.; Maidana, R. L. B. R.; Guimarães, A. C. R.; Furnham, N.; Andrade, C. H.; and Silva Jr, F. P. 2020. In silico strategies to support fragment-to-lead optimization in drug discovery. Frontiers in chemistry, 8: 93.
- Garnett et al. (2012) Garnett, M. J.; Edelman, E. J.; Heidorn, S. J.; et al. 2012. Systematic identification of genomic markers of drug sensitivity in cancer cells. Nature, 483(7391): 570–575.
- Gu et al. (2024) Gu, S.; Xu, M.; Powers, A.; Nie, W.; Geffner, T.; Kreis, K.; Leskovec, J.; Vahdat, A.; and Ermon, S. 2024. Aligning Target-Aware Molecule Diffusion Models with Exact Energy Optimization. arXiv preprint arXiv:2407.01648.
- Ho, Jain, and Abbeel (2020) Ho, J.; Jain, A.; and Abbeel, P. 2020. Denoising diffusion probabilistic models. Advances in neural information processing systems, 33: 6840–6851.
- Hostallero et al. (2023) Hostallero, D. E.; Wei, L.; Wang, L.; Cairns, J.; and Emad, A. 2023. Preclinical-to-clinical Anti-cancer Drug Response Prediction and Biomarker Identification Using TINDL. Genomics, Proteomics & Bioinformatics, 21(3).
- Huang et al. (2023) Huang, H.; Sun, L.; Du, B.; and Lv, W. 2023. Conditional diffusion based on discrete graph structures for molecular graph generation. In Proceedings of the AAAI Conference on Artificial Intelligence, volume 37, 4302–4311.
- Huang et al. (2024) Huang, L.; Xu, T.; Yu, Y.; Zhao, P.; Chen, X.; Han, J.; Xie, Z.; Li, H.; Zhong, W.; Wong, K.-C.; et al. 2024. A dual diffusion model enables 3D molecule generation and lead optimization based on target pockets. Nature Communications, 15(1): 2657.
- Jo, Lee, and Hwang (2022) Jo, J.; Lee, S.; and Hwang, S. J. 2022. Score-based Generative Modeling of Graphs via the System of Stochastic Differential Equations. In Proceedings of the 39th International Conference on Machine Learning, volume 162 of Proceedings of Machine Learning Research, 10362–10383. PMLR.
- Jorgensen (2009) Jorgensen, W. L. 2009. Efficient drug lead discovery and optimization. Accounts of chemical research, 42(6): 724–733.
- Kim et al. (2023) Kim, S.; Lee, D.; Kang, S.; Lee, S.; and Yu, H. 2023. Learning Topology-Specific Experts for Molecular Property Prediction. Proceedings of the AAAI Conference on Artificial Intelligence, 37(7): 8291–8299.
- Lee et al. (2024) Lee, S.; Chu, J.; Kim, S.; Ko, J.; and Kim, H. J. 2024. Advancing Bayesian optimization via learning correlated latent space. Advances in Neural Information Processing Systems, 36.
- Lee, Jo, and Hwang (2023) Lee, S.; Jo, J.; and Hwang, S. J. 2023. Exploring chemical space with score-based out-of-distribution generation. In International Conference on Machine Learning, 18872–18892. PMLR.
- Li et al. (2024a) Li, K.; Gong, X.; Pan, S.; Wu, J.; Du, B.; and Hu, W. 2024a. Regressor-free Molecule Generation to Support Drug Response Prediction. arXiv:2405.14536.
- Li et al. (2024b) Li, K.; Gong, X.; Wu, J.; and Hu, W. 2024b. Contrastive Learning Drug Response Models from Natural Language Supervision. In Larson, K., ed., Proceedings of the Thirty-Third International Joint Conference on Artificial Intelligence, IJCAI-24, 2126–2134. International Joint Conferences on Artificial Intelligence Organization. Main Track.
- Li et al. (2024c) Li, K.; Liu, W.; Luo, Y.; Cai, X.; Wu, J.; and Hu, W. 2024c. Zero-shot Learning for Preclinical Drug Screening. In Larson, K., ed., Proceedings of the Thirty-Third International Joint Conference on Artificial Intelligence, IJCAI-24, 2117–2125. International Joint Conferences on Artificial Intelligence Organization. Main Track.
- Li et al. (2019) Li, Y.; Hu, J.; Wang, Y.; Zhou, J.; Zhang, L.; and Liu, Z. 2019. DeepScaffold: a comprehensive tool for scaffold-based de novo drug discovery using deep learning. Journal of chemical information and modeling, 60(1): 77–91.
- Lu et al. (2022) Lu, W.; Wu, Q.; Zhang, J.; Rao, J.; Li, C.; and Zheng, S. 2022. Tankbind: Trigonometry-aware neural networks for drug-protein binding structure prediction. Advances in neural information processing systems, 35: 7236–7249.
- Moffat et al. (2017) Moffat, J. G.; Vincent, F.; Lee, J. A.; Eder, J.; and Prunotto, M. 2017. Opportunities and challenges in phenotypic drug discovery: an industry perspective. Nature reviews Drug discovery, 16(8): 531–543.
- Morehead and Cheng (2024) Morehead, A.; and Cheng, J. 2024. Geometry-complete diffusion for 3D molecule generation and optimization. Communications Chemistry, 7(1): 150.
- Peng et al. (2022) Peng, X.; Luo, S.; Guan, J.; Xie, Q.; Peng, J.; and Ma, J. 2022. Pocket2mol: Efficient molecular sampling based on 3d protein pockets. In International Conference on Machine Learning, 17644–17655. PMLR.
- Ramakrishnan et al. (2014) Ramakrishnan, R.; Dral, P. O.; Rupp, M.; and Von Lilienfeld, O. A. 2014. Quantum chemistry structures and properties of 134 kilo molecules. Scientific data, 1(1): 1–7.
- Reddy and Zhang (2013) Reddy, A. S.; and Zhang, S. 2013. Polypharmacology: drug discovery for the future. Expert review of clinical pharmacology, 6(1): 41–47.
- Ren et al. (2023) Ren, T.; Chen, C.; Danilov, A. V.; Liu, S.; Guan, X.; Du, S.; Wu, X.; Sherman, M. H.; Spellman, P. T.; Coussens, L. M.; et al. 2023. Supervised learning of high-confidence phenotypic subpopulations from single-cell data. Nature Machine Intelligence, 5(5): 528–541.
- Rocha et al. (2023) Rocha, B.; de Morais, L. A.; Viana, M. C.; and Carneiro, G. 2023. Promising strategies for improving oral bioavailability of poor water-soluble drugs. Expert Opinion on Drug Discovery, 18(6): 615–627.
- Ru et al. (2022) Ru, X.; Ye, X.; Sakurai, T.; and Zou, Q. 2022. NerLTR-DTA: drug–target binding affinity prediction based on neighbor relationship and learning to rank. Bioinformatics, 38(7): 1964–1971.
- Sadybekov and Katritch (2023) Sadybekov, A. V.; and Katritch, V. 2023. Computational approaches streamlining drug discovery. Nature, 616(7958): 673–685.
- Schneider et al. (2020) Schneider, P.; Walters, W. P.; Plowright, A. T.; Sieroka, N.; Listgarten, J.; Goodnow Jr, R. A.; Fisher, J.; Jansen, J. M.; Duca, J. S.; Rush, T. S.; et al. 2020. Rethinking drug design in the artificial intelligence era. Nature reviews drug discovery, 19(5): 353–364.
- Sharifi-Noghabi et al. (2021) Sharifi-Noghabi, H.; Harjandi, P. A.; Zolotareva, O.; Collins, C. C.; and Ester, M. 2021. Out-of-distribution generalization from labelled and unlabelled gene expression data for drug response prediction. Nature Machine Intelligence, 3(11): 962–972.
- Shubham et al. (2024) Shubham, K.; Jayagopal, A.; Danish, S. M.; AP, P.; and Rajan, V. 2024. WISER: Weak Supervision and Supervised Representation Learning to Improve Drug Response Prediction in Cancer. In Forty-first International Conference on Machine Learning.
- Song et al. (2020) Song, Y.; Sohl-Dickstein, J.; Kingma, D. P.; Kumar, A.; Ermon, S.; and Poole, B. 2020. Score-Based Generative Modeling through Stochastic Differential Equations. In International Conference on Learning Representations.
- Swinney (2013) Swinney, D. C. 2013. The contribution of mechanistic understanding to phenotypic screening for first-in-class medicines. Journal of biomolecular screening, 18(10): 1186–1192.
- Vignac et al. (2023) Vignac, C.; Krawczuk, I.; Siraudin, A.; Wang, B.; Cevher, V.; and Frossard, P. 2023. DiGress: Discrete Denoising diffusion for graph generation. In Proceedings of the 11th International Conference on Learning Representations.
- Vincent et al. (2022a) Vincent, F.; Nueda, A.; Lee, J.; Schenone, M.; Prunotto, M.; and Mercola, M. 2022a. Phenotypic drug discovery: recent successes, lessons learned and new directions. Nature Reviews Drug Discovery, 21(12): 899–914.
- Vincent et al. (2022b) Vincent, F.; Nueda, A.; Lee, J.; Schenone, M.; Prunotto, M.; and Mercola, M. 2022b. Phenotypic drug discovery: recent successes, lessons learned and new directions. Nature Reviews Drug Discovery, 21(12): 899–914.
- Wu et al. (2022) Wu, L.; Gong, C.; Liu, X.; Ye, M.; and Liu, Q. 2022. Diffusion-based molecule generation with informative prior bridges. Advances in Neural Information Processing Systems, 35: 36533–36545.
- Xia et al. (2024) Xia, Y.; Wang, Y.; Wang, Z.; and Zhang, W. 2024. A comprehensive review of molecular optimization in artificial intelligence-based drug discovery. Quantitative Biology, 12(1): 15–29.
- Xie et al. (2024) Xie, J.; Chen, S.; Lei, J.; and Yang, Y. 2024. DiffDec: structure-aware scaffold decoration with an end-to-end diffusion model. Journal of Chemical Information and Modeling, 64(7): 2554–2564.
- Xiong et al. (2023) Xiong, Z.; Cui, X.; Lin, X.; Ren, F.; Liu, B.; Li, Y.; Yung, M.; and Qiao, N. 2023. Q-Drug: a Framework to bring Drug Design into Quantum Space using Deep Learning. arXiv e-prints, arXiv–2308.
- Xu et al. (2023) Xu, M.; Powers, A. S.; Dror, R. O.; Ermon, S.; and Leskovec, J. 2023. Geometric latent diffusion models for 3D molecule generation. In Proceedings of the 40th International Conference on Machine Learning, 38592–38610.
- Yang et al. (2013) Yang, W.; Soares, J.; Greninger, P.; Edelman, E. J.; Lightfoot, H.; Forbes, S.; Bindal, N.; Beare, D.; Smith, J. A.; Thompson, I. R.; Ramaswamy, S.; Futreal, P. A.; Haber, D. A.; Stratton, M. R.; Benes, C.; McDermott, U.; and Garnett, M. J. 2013. Genomics of Drug Sensitivity in Cancer (GDSC): a resource for therapeutic biomarker discovery in cancer cells. Nucleic acids research, 41(Database issue): D955—61.
- Zhang, Rao, and Agrawala (2023) Zhang, L.; Rao, A.; and Agrawala, M. 2023. Adding conditional control to text-to-image diffusion models. In Proceedings of the IEEE/CVF International Conference on Computer Vision, 3836–3847.
- Zhou et al. (2024) Zhou, X.; Cheng, X.; Yang, Y.; Bao, Y.; Wang, L.; and Gu, Q. 2024. DecompOpt: Controllable and Decomposed Diffusion Models for Structure-based Molecular Optimization. In The Twelfth International Conference on Learning Representations.
Reproducibility Checklist
This paper:
-
•
Includes a conceptual outline and/or pseudocode description of AI methods introduced yes
-
•
Clearly delineates statements that are opinions, hypothesis, and speculation from objective facts and results yes
-
•
Provides well marked pedagogical references for less-familiare readers to gain background necessary to replicate the paper yes
Does this paper make theoretical contributions?
yes
-
•
All assumptions and restrictions are stated clearly and formally yes
-
•
All novel claims are stated formally (e.g., in theorem statements). yes
-
•
Proofs of all novel claims are included. yes
-
•
Proof sketches or intuitions are given for complex and/or novel results. yes
-
•
Appropriate citations to theoretical tools used are given. yes
-
•
All theoretical claims are demonstrated empirically to hold. yes
-
•
All experimental code used to eliminate or disprove claims is included. yes
Does this paper rely on one or more datasets?
yes
-
•
A motivation is given for why the experiments are conducted on the selected datasets yes
-
•
All novel datasets introduced in this paper are included in a data appendix. yes
-
•
All novel datasets introduced in this paper will be made publicly available upon publication of the paper with a license that allows free usage for research purposes. yes
-
•
All datasets drawn from the existing literature (potentially including authors’ own previously published work) are accompanied by appropriate citations. yes
-
•
All datasets drawn from the existing literature (potentially including authors’ own previously published work) are publicly available. yes
-
•
All datasets that are not publicly available are described in detail, with explanation why publicly available alternatives are not scientifically satisficing. NA
Does this paper include computational experiments?
yes
-
•
Any code required for pre-processing data is included in the appendix. yes
-
•
All source code required for conducting and analyzing the experiments is included in a code appendix. yes
-
•
All source code required for conducting and analyzing the experiments will be made publicly available upon publication of the paper with a license that allows free usage for research purposes. yes
-
•
All source code implementing new methods have comments detailing the implementation, with references to the paper where each step comes from yes
-
•
If an algorithm depends on randomness, then the method used for setting seeds is described in a way sufficient to allow replication of results. yes
-
•
This paper specifies the computing infrastructure used for running experiments (hardware and software), including GPU/CPU models; amount of memory; operating system; names and versions of relevant software libraries and frameworks. yes
-
•
This paper formally describes evaluation metrics used and explains the motivation for choosing these metrics. yes
-
•
This paper states the number of algorithm runs used to compute each reported result. yes
-
•
Analysis of experiments goes beyond single-dimensional summaries of performance (e.g., average; median) to include measures of variation, confidence, or other distributional information. yes
-
•
The significance of any improvement or decrease in performance is judged using appropriate statistical tests (e.g., Wilcoxon signed-rank) yes
-
•
This paper lists all final (hyper-)parameters used for each model/algorithm in the paper’s experiments. yes
-
•
This paper states the number and range of values tried per (hyper-) parameter during development of the paper, along with the criterion used for selecting the final parameter setting. partial