Arecibo Wow! I: An Astrophysical Explanation for the Wow! Signal
Abstract
The Ohio State University Big Ear radio telescope detected in 1977 the Wow! Signal, one of the most famous and intriguing signals of extraterrestrial origin. The signal was characterized by its strong relative intensity and narrow bandwidth near the 1420 MHz hydrogen line, but its source has never been detected again despite numerous follow-up attempts. Arecibo Wow! is a new project that aims to find similar signals in archived data from the Arecibo Observatory. From 2017 to 2020, we observed many targets of interest at 1 to 10 GHz with the 305-meter telescope. We continued these observations at 8 GHz with the 12-meter telescope in 2023. Most of these targets were red dwarf stars with planets, some potentially habitable. Here we present our first results of drift scans made between February and May 2020 at 1420 MHz. The methods, frequency, and bandwidth of these observations are similar to those used to detect the Wow! Signal. However, our observations are more sensitive, have better temporal resolution, and include polarization measurements. We report the detection of narrowband signals ( 10 kHz) near the hydrogen line similar to the Wow! Signal, although two-orders of magnitude less intense and in multiple locations. Despite the similarities, these signals are easily identifiable as due to interstellar clouds of cold hydrogen (HI) in the galaxy. We hypothesize that the Wow! Signal was caused by sudden brightening from stimulated emission of the hydrogen line due to a strong transient radiation source, such as a magnetar flare or a soft gamma repeater (SGR). These are very rare events that depend on special conditions and alignments, where these clouds might become much brighter for seconds to minutes. The original source or the cloud might not be detectable, depending on the sensitivity of the telescope or because the maximum brightness might arrive seconds later to the observer. The precise location of the Wow! Signal might be determined by searching for transient radio sources behind the cold hydrogen clouds in the corresponding region. Our hypothesis explains all observed properties of the Wow! Signal, proposes a new source of false positives in technosignature searches, and suggests that the Wow! Signal could be the first recorded event of an astronomical maser flare in the hydrogen line.
DRAFT \SetWatermarkScale7 \SetWatermarkColor[gray]0.95
1 Introduction
The Wow! Signal, detected on August 15, 1977, by the Ohio State University’s Big Ear radio telescope, remains one of the most compelling potential instances of extraterrestrial communication (see e.g. Wright 2021 and references therein). The signal, identified by astronomer Jerry R. Ehman, exhibited a narrowband radio frequency of approximately 1420.456 MHz, which is notably close to the hydrogen line frequency, a region of the radio spectrum often considered a natural candidate for interstellar communication (Kraus et al., 1979). The signal lasted for 72 seconds, corresponding to the time it took the telescope beam to sweep past the source, but no follow-up observations have successfully replicated this anomaly (Gray & Ellingsen, 2002). The transient nature of the Wow! Signal, combined with its strength and frequency, has led to extensive debate and investigation within the SETI community (Search for Extraterrestrial Intelligence), yet its exact origin remains undetermined (see, e.g., Tarter 2001).
Further analysis of the Wow! Signal suggests that its strength and narrow bandwidth are inconsistent with natural astronomical sources, such as pulsars or known interstellar phenomena, thereby raising the possibility of an artificial origin (Shostak, 2003). The Wow! Signal remains an enigmatic outlier, representing a tantalizing hint of potential extraterrestrial communication while underscoring the challenges inherent in distinguishing genuine signals from cosmic noise and terrestrial interference (Tarter, 2010; Kipping & Gray, 2022).
Despite numerous efforts using various radio telescopes, including the Very Large Array (VLA), no repeat detections have been made at the original frequency or any other candidate frequencies (Backus et al., 2004; Perez et al., 2022). The search for similar signals continues to be a significant focus within the SETI community, employing advanced digital signal processing techniques and expanded observational capabilities to improve the chances of detecting faint and transient signals (Werthimer et al., 2001). The Allen Telescope Array (ATA) was also used to search for possible repetitions (Harp et al., 2020). The researchers monitored the specific frequency and sky coordinates associated with the original signal, using the ATA’s capabilities to capture a broad frequency range in search of potential extraterrestrial signals. Despite comprehensive observation efforts spanning multiple sessions, the study did not result in the detection of any repeat signals. This outcome suggests that the Wow! Signal may have been a unique occurrence or an artifact of terrestrial interference, rather than a signal of extraterrestrial origin.
The implications of these findings are significant for SETI research. They highlight the need for continuous long-term monitoring strategies and developing more sensitive detection technologies. The study also stresses the importance of revisiting and re-analyzing historical datasets with newer, more advanced technology, which could potentially uncover subtleties missed in earlier analyses. This approach could lead to a better understanding of the transient phenomena observed in radio astronomy and their origins. The absence of repetitions underscores the challenges in SETI, emphasizing the sporadic nature of potential non-terrestrial signals.
The main objective of this paper is to present the first results of our Arecibo Wow! Project (Sections 3 to 7). These results suggest an astrophysical explanation to the Wow! Signal that can be tested with follow-up observations. This paper also presents a comparison between the Big Ear and the Arecibo Telescope, which should provide a context for the detection of the Wow! Signal and our observations. In Section 2 we discuss the detection and interpretation of the Wow! Signal. In Section 3 we provide a brief history of SETI projects at the Arecibo Observatory. We present concluding remarks in Section 8.
2 The Wow! Signal
The Big Ear radio telescope, located at Ohio State University, played a pivotal role in the Ohio Sky Survey prior to 1973 (Ehman et al., 1970). This project was dedicated to measuring the positions and strengths of wide-band radio sources operating primarily within the 21-cm hydrogen line at a bandwidth of 8 MHz, spanning from 1411 to 1419 MHz. During the course of the survey, approximately 20,000 radio sources were cataloged, nearly half of which were previously unobserved by any other radio telescope. Subsequent observations were made at other observatories to refine the positions of these sources, and several were optically identified, including two that were recognized as the most distant quasars known at the time (Kraus et al., 1979).
In 1973, following a shift in funding priorities by the United States Congress, the National Science Foundation (NSF) withdrew its financial support for the Ohio Sky Survey, which had a significant impact on the project. The loss of funding led to the cessation of the Ohio Sky Survey and the eventual disbandment of the survey team. Despite these setbacks, the Big Ear radio telescope was repurposed for a new mission: the systematic search for narrow-band radio signals. Unlike wide-band radio sources, which are typically natural and generate emissions across a broad spectrum (including radio, optical, X-ray, and gamma-ray bands), narrow-band sources are often artificial, such as those used in AM, FM, TV broadcasts, satellite communications, and radar, implying potential intelligent origin. With the narrow-band search underway, a systematic survey of the declination range from +64° to -36° began (Dixon & Cole, 1977).
The data collected by the Big Ear radio telescope were processed and recorded in a series of computer printouts, each row encapsulating approximately 12 seconds of sidereal time (see Figure 1). During each 10-second period, the telescope collected one intensity value per second across 50 channels, averaging these ten values to represent the intensity of each channel throughout the 10-second integration period (Dixon & Cole, 1977). The remaining 2 seconds of the 12-second interval were dedicated to computer analysis, where it processed the data and identified any notable phenomena. The printouts displayed the average intensities for each of the 50 channels (each having kHz), arranged sequentially from left to right, with channel 1 on the left side and channel 50 on the right side.
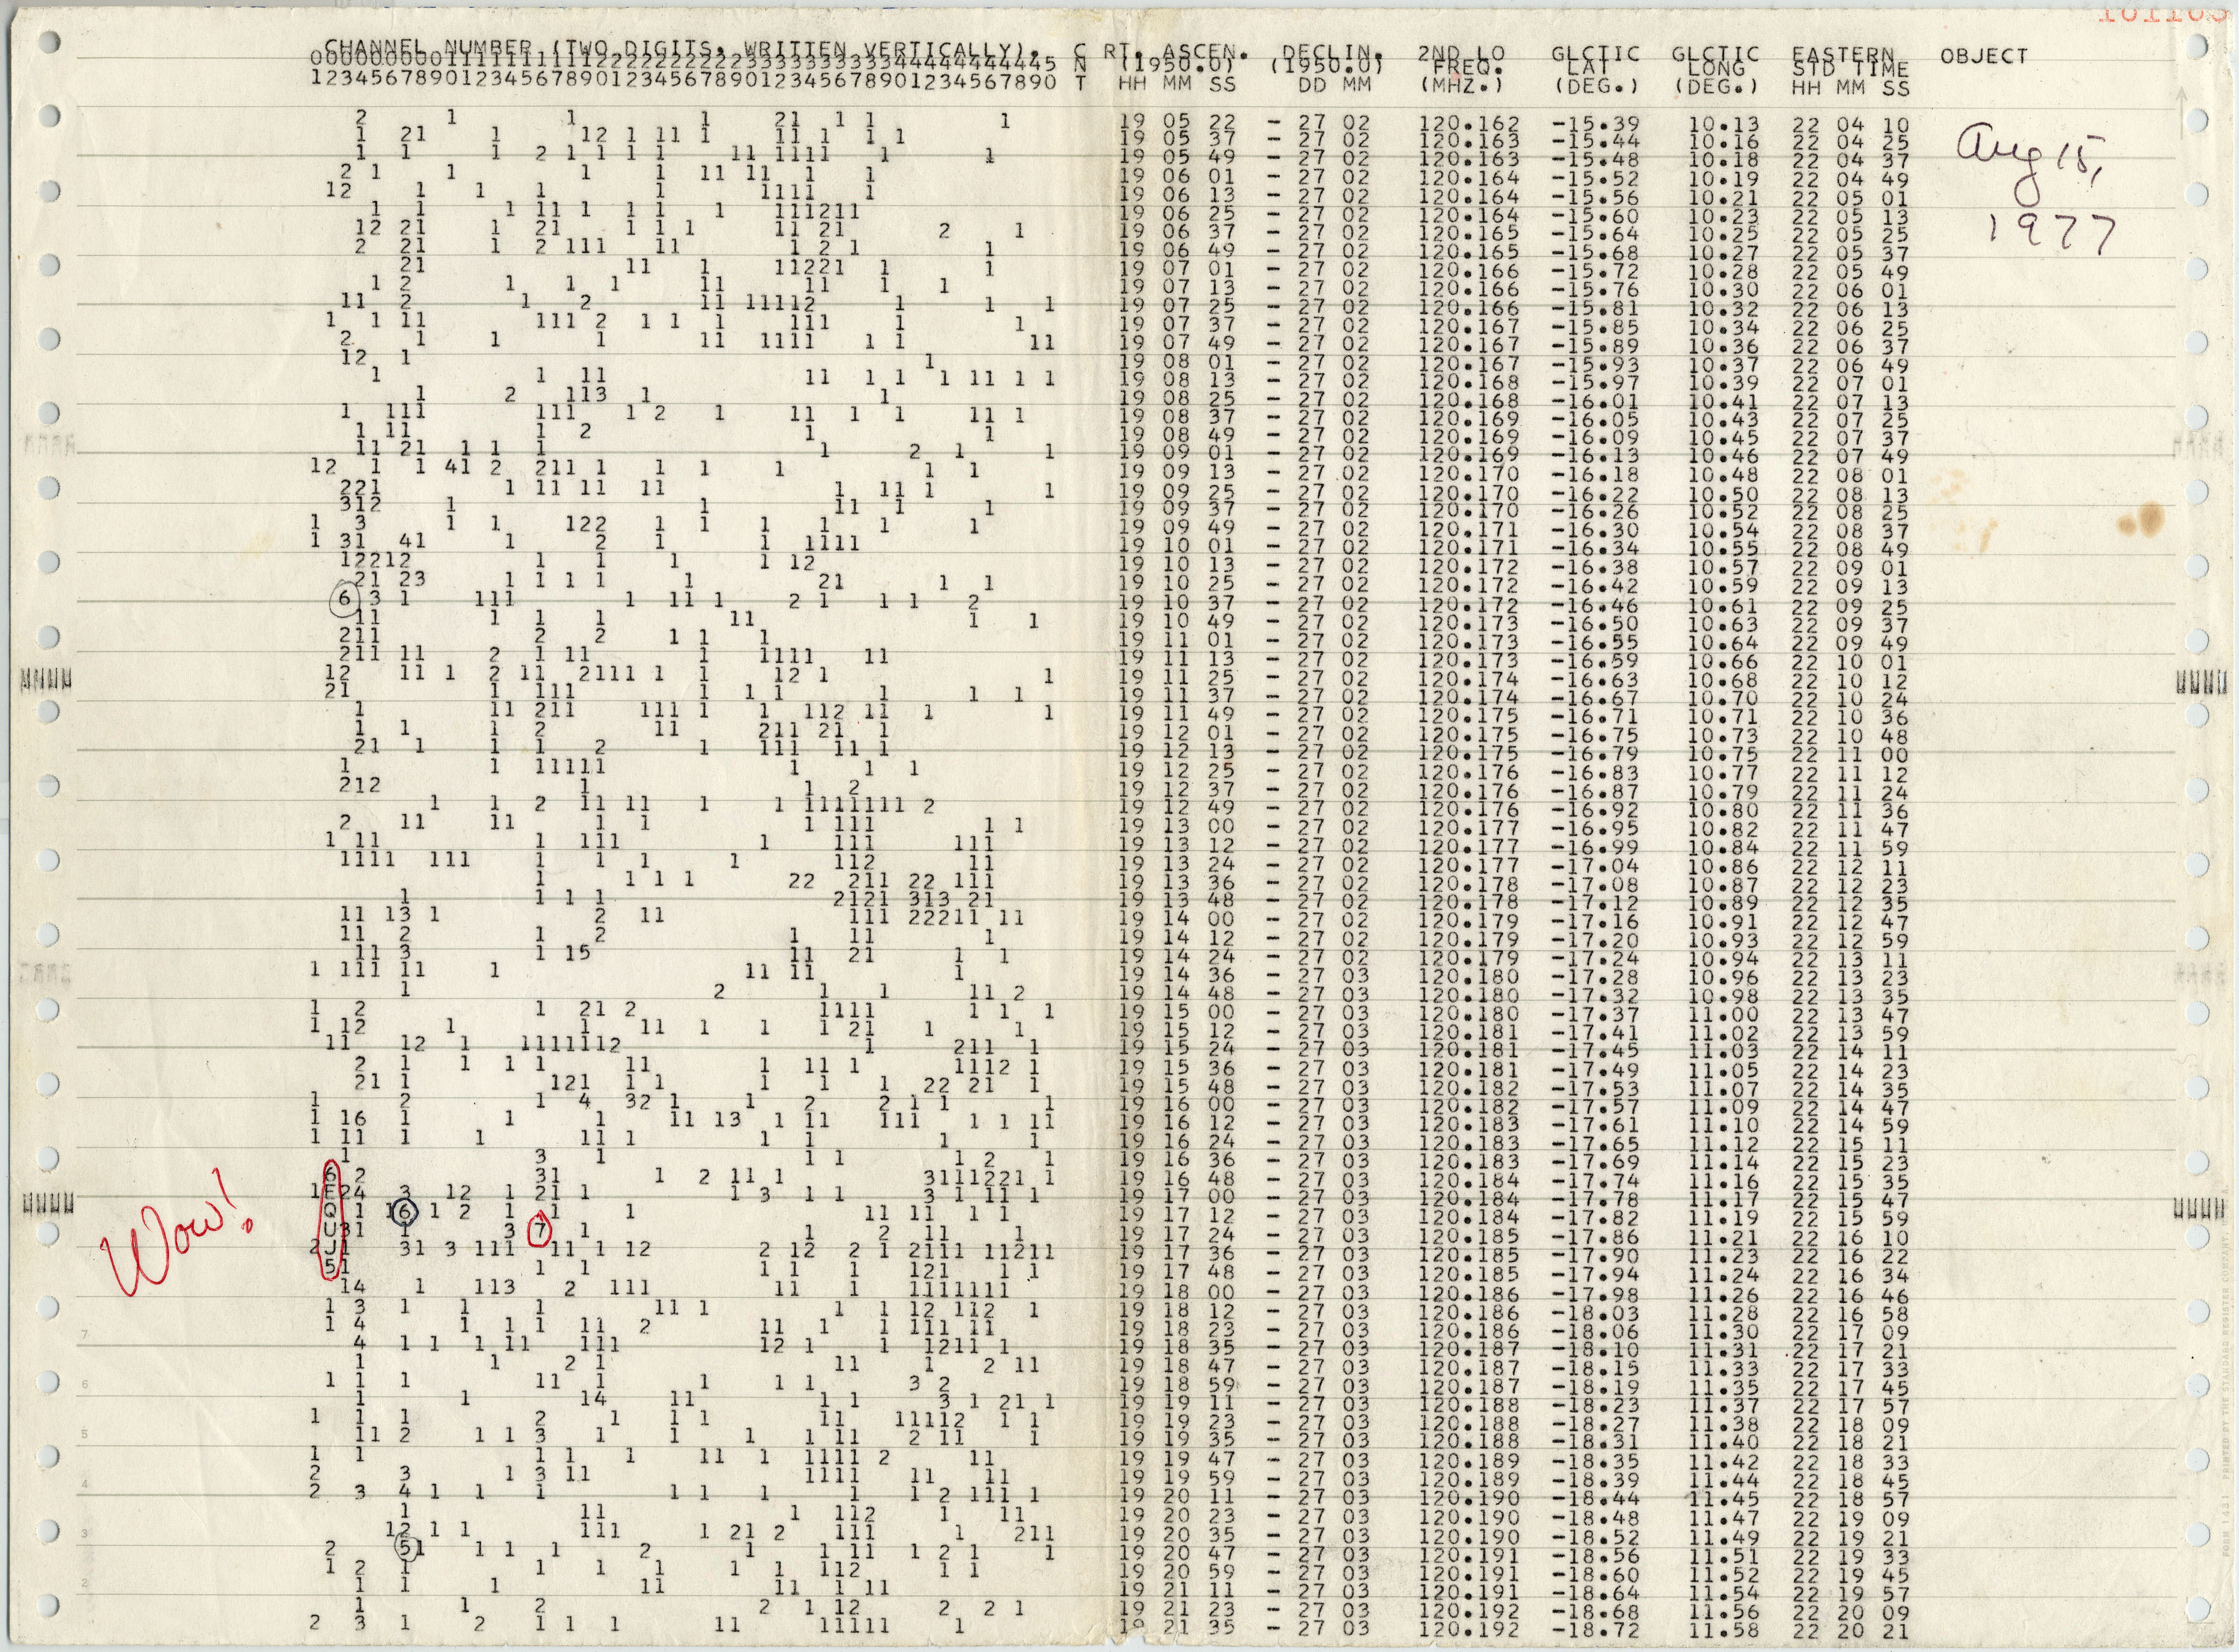
Intensity values were converted to a single character for display: zero values were rendered as blanks, integers 1 to 9 were printed directly as digits, and integers 10 to 35 were represented by uppercase letters A through Z, respectively. Each character corresponds to a specific range of signal-to-noise ratios: “6” represents a ratio between 6 and 7, “E” corresponds to a ratio between 14 and 15, “Q” to 26 and 27, “U” to 30 and 31, “J” to 19 and 20, and “5” to 5 and 6. During a standard analysis of the data gathered on August 15, an unusual character string, “6EQUJ5,” was detected in channel 2 of the printout on August 19, 1977. This sequence was immediately recognized as indicative of a narrow-band radio source with a small angular diameter, a potential signal of intelligent origin. The strongest signal, represented by the character ”U,” indicates that the signal was 30.5 0.5 times stronger than the background noise. This signal was later referred to as the Wow! Signal. In Table 1 we describe the characteristics of the Wow! Signal, including location, time, and absolute intensity.
| Parameter | Value |
|---|---|
| Date | August 15, 1977 |
| Time | 22:16:01s EST (02:16 UTC, August 16) |
| Location | Sagittarius Constellation |
| Frequency | 1420.4556 MHz |
| Bandwidth | narrow-band ( 10 kHz) |
| Signal Strength | 30 times background noise (SNR 30) |
| Duration | 72 seconds |
| Positive Horn Coordinates (Equatorial) | RA: 19h 25m 31s ± 10s, Dec: -26d 57m ± 20m (J2000) |
| Negative Horn Coordinates (Equatorial) | RA: 19h 28m 22s ± 10s, Dec: -26d 57m ± 20m (J2000) |
| Positive Horn Coordinates (Galactic) | lon: 11.664d, lat: -18.916d |
| Negative Horn Coordinates (Galactic) | lon: 11.909d, lat: -19.508d |
| Estimated Intensity | 54 or 212 Jy |
The hypothesis that has gained the most attention, especially among the public, is that the Wow! Signal was a transmission from an extraterrestrial civilization (Wright, 2021). The frequency of the signal, close to the hydrogen line, is considered a logical choice for interstellar communication because it is naturally quiet and would be universally recognized by technologically advanced civilizations (Drake & Sagan, 1973). However, this hypothesis faces critical issues. The signal was never repeated, despite numerous follow-up observations. In the context of SETI, repetition is essential for verification, as a one-time detection makes it difficult to rule out other sources. Moreover, the absence of modulation or encoding in the signal, which would be expected from an intentional transmission, further complicates this interpretation.
Another possibility is that the Wow! Signal originated from a natural astrophysical source. Candidates include stellar flares, pulsars, or other cosmic phenomena that emit radio waves (for a recent explanation overview, see Kipping & Gray 2022). However, these sources typically exhibit characteristics such as periodicity or broader bandwidths, which the Wow! Signal lacks. The narrow-band nature of the signal is particularly unusual because natural emissions are generally broadband. Additionally, the hydrogen line frequency is not generally associated with natural radio emissions from known astrophysical objects, making this hypothesis less likely.
Terrestrial interference is another plausible explanation. The signal could have been caused by a reflected terrestrial transmission or an Earth-based signal that temporarily overwhelmed the receiver. The 1420 MHz band is protected for astronomical purposes, but illegal or accidental transmission in this band could have occurred. However, the Big Ear radio telescope, which detected the Wow! Signal, had a design that helped filter out terrestrial sources, and the signal appeared only in one of the two feed horns, complicating the explanation of interference111For a description and some of the hypotheses that have been raised about the terrestrial and extraterrestrial origin of the signal see the detailed account written by Jerry R. Ehman himself in 2010 that is still available at this url (last visited: ). No known terrestrial source has been identified that matches the characteristics of the Wow! Signal. Moreover, a reflecting piece of space debris must have been moving very slowly and not tumbling to mimic a point source in the celestial sphere, which is unlikely (Ehman, 2011a).
One hypothesis suggests that the signal could have been caused by a reflection of Earth-based signals off space debris or satellites (Ehman, 2011b). This idea posits that a radio signal from Earth might have bounced off a satellite or space debris and was then picked up by the telescope. However, this explanation struggles with the same issue of non-repetition. The duration of the signal and its specific characteristics do not align neatly with the known satellite reflections or the behavior of the debris. Additionally, the Doppler shift expected from such a reflection was not observed.
There is also the consideration of interstellar propagation effects, where the signal could have been distorted or focused through gravitational lensing or other space phenomena. These effects could potentially create a signal that mimics the characteristics of the Wow! Signal. However, the gravitational lensing hypothesis suffers from the drawback of the short signal duration – the Wow! Signal was not detected in the second horn of the Big Ear whose beam swept the same area of the sky only 5 minutes later (Ehman, 2011a). Additionally, such a scenario would likely involve complex interactions with multiple cosmic objects, which are improbable and would likely have been observed again under similar conditions.
Finally, human error has been considered in the recording or processing of the data. Data handling methods in 1977 were not as sophisticated as today, and it is conceivable that a mistake or anomaly in the data processing chain produced the Wow! Signal. However, this explanation lacks specific evidence and does not account for the signal’s characteristics, which seem consistent with a real astronomical event.
| Property | Arecibo Telescope | Ohio State University Telescope (Big Ear) |
|---|---|---|
| Location | Arecibo, Puerto Rico | Delaware, Ohio, USA |
| Longitude | 66.7528° W | 83.0336° W |
| Latitude | 18.3442° N | 40.2567° N |
| Elevation | 497 meters | 276 meters |
| Type | Spherical Reflector | Cylindrical Paraboloid |
| Diameter | 305 meters | 110 meters |
| Illuminated Area | 213 x 237 m (73,000 m²) | 8,000 m² |
| Radius of Curvature of Primary Reflector | 265 m | N/A |
| Operational Years | 1963 - 2020 | 1963 - 1998 |
| Current Status | Decommissioned (collapsed in 2020) | Dismantled in 1998 |
| Maximum Declination Coverage | -1 to +38 degrees | +39 to +41 degrees |
| Data Collection Methods | Fixed dish with moving receiver | Fixed dish with Earth’s rotation |
| Azimuth Pointing Range | 360 degrees | Fixed |
| Zenith Angle Range | 0 to 19.7 degrees | Fixed |
| Pointing Accuracy | 1 arcsecond | N/A |
| Property | Arecibo Telescope | Big Ear |
|---|---|---|
| Receiver Temperature | 25 K | 100 K |
| Frequency Range | 1.12 to 1.73 GHz | 1.42 GHz (primary) |
| Frequency Channels | 7 x 8192 | 50 |
| Gain | 10.5 K/J | 0.1 K/J |
| System Equivalent Flux Density (SEFD) | 2.4 Jy | 50 Jy |
| Half-Power Beam Width (HPBW) (Az x ZA in) | 3.1 x 3.5 arcminutes | 8 x 40 arcminutes |
| Transit Time | 48 seconds | 180 seconds |
3 SETI efforts from Arecibo
Arecibo’s first notable involvement in SETI began in 1974 with Project Ozma II, which was a continuation of Frank Drake’s original Project Ozma conducted at the Green Bank Observatory in 1960 (Drake, 1961). Project Ozma II, led by Drake himself, utilized Arecibo’s then-newly upgraded 305-meter dish to search for signals from stars within 160 light-years of Earth. This project was one of the first systematic searches for extraterrestrial signals using a large radio telescope and helped establish Arecibo as a key instrument in the emerging field of SETI (Sheaffer, 1975; Gray, 2021).
Perhaps the most famous event in Arecibo’s SETI history occurred on November 16, 1974, when it was used to transmit the Arecibo Message, a 1679-bit binary message sent towards the globular star cluster M13, located approximately 25,000 light years away (Staff at the National Astronomy & Ionosphere Center, 1975). Designed by Frank Drake, with input from Carl Sagan and others, the Arecibo Message was a demonstration of humanity’s ability to communicate with distant civilizations. Although the probability of the message being received and understood by extraterrestrial beings is slim, the event was symbolically important and underscored Arecibo’s central role in the SETI community (Drake & Sagan, 1973; Sagan & Drake, 1975).
In the late 1980s and early 1990s, Arecibo was the primary instrument for NASA’s High Resolution Microwave Survey (HRMS), a major SETI initiative (Shostak, 1993; Dick, 1993). The HRMS aimed to search for narrowband signals from thousands of nearby stars, utilizing Arecibo’s sensitivity and large collecting area to scan the sky more thoroughly than ever before. Although the HRMS was canceled in 1993 due to budget cuts, Arecibo’s contributions during the program laid the groundwork for future SETI efforts.
Following the end of HRMS, Arecibo continued to participate in SETI through various initiatives, including the Search for Extraterrestrial Radio Emissions from Nearby Developed Intelligent Populations (SERENDIP) project (Werthimer et al., 1988). SERENDIP was a piggyback search, which means that it used data collected by Arecibo during other observations to perform a parallel search for extraterrestrial signals. SERENDIP IV, which began in the late 1990s, used a multichannel receiver installed at Arecibo to scan the sky for signals over a wide range of frequencies (Chennamangalam et al., 2017). The data collected by SERENDIP IV were also used by the SETI@home project, a distributed computing effort that allowed millions of volunteers around the world to analyze SETI data on their home computers (Korpela et al., 2001). This collaboration between Arecibo and SETI@home significantly expanded the scope and reach of SETI research.
Another significant SETI-related effort at Arecibo was the Phoenix Project, which ran from 1995 to 2004 (Turnbull & Tarter, 2003). Sponsored by the SETI Institute, the Phoenix Project was a targeted search that focused on specific stars thought to be good candidates for hosting intelligent life. Arecibo’s large aperture and advanced receivers made it an ideal instrument for this focused search, and the Phoenix Project represented one of the most sensitive searches for extraterrestrial signals ever conducted.
Throughout its operational life, Arecibo was involved in numerous other SETI-related projects and observations, often serving as a testbed for new technologies and techniques in the search for extraterrestrial intelligence. The observatory’s unparalleled sensitivity and versatility made it a cornerstone of SETI research, and its contributions continue to influence the field even after its collapse in 2020. The Arecibo Observatory’s legacy in SETI is marked by its role in pioneering early searches, conducting high-profile experiments like the Arecibo Message, and supporting a wide range of projects that advanced our understanding of the cosmos and the potential for life beyond Earth. The observatory data and findings remain valuable resources for ongoing and future SETI efforts (Tarter, 2001). The Big Ear and the Arecibo Observatory were two contemporary telescopes that dedicated some of their time to SETI (see Table 2).
| Name | Type | Distance | ICRS (J2000) | Galactic (J2000) |
|---|---|---|---|---|
| Teegarden’s Star | dM6 Star | 3.83 pc | 02 53 00.9 +16 52 52.6 | 160.263 -37.026 |
| Barnard’s Star | M4V Star | 1.83 pc | 17 57 48.5 +04 41 36.1 | 31.009 +14.062 |
| HD 157881 | K7V Star | 7.71 pc | 17 25 45.2 +02 06 41.1 | 24.758 +19.976 |
| SGR 1935+2154 | Magnetar | 9.0 kpc | 19 34 55.7 +21 53 48.2 | 57.247 +0.819 |
| 3C 76.1 (B0300+162) | Radio Galaxy | 194 Mpc | 03 03 15.0 +16 26 18.9 | 163.065 -35.961 |
| 3C 365 (B1756+134) | Radio Galaxy | 1500 Mpc | 17 58 24.0 +10 45 00.0 | 36.716 +16.595 |
| Void | Blank Sky | N/A | 03 00 00.0 +17 00 00 | 161.879 -35.970 |
4 Arecibo REDS and Wow! Projects
In 2017 we started the Arecibo REDS project (Radio Emissions from Red Dwarf Stars). This project aims to study radio emissions from red dwarf stars using data from the Arecibo Observatory. Red dwarf stars, the most abundant type in the Milky Way, emit a wide range of radio frequencies because of their high activity levels (Yiu et al., 2024). We are studying these emissions, focusing on their frequency, polarization, and variability. Our observations are intended to help characterize their stellar flares and coronal mass ejections, which impact the space weather and habitability of their planets (Airapetian et al., 2020). Our research also explores the potential utility of these observations as tools for detecting exoplanets orbiting red dwarf stars (Vedantham et al., 2020). The results of Arecibo REDS will be presented elsewhere. After the collapse of the Arecibo Telescope in 2020, we plan to continue these observations with other radio telescopes.
This study constitutes an extension of our Arecibo REDS project. It describes the initial findings of our Arecibo Wow! technosignature project. We observed from the Arecibo Observatory’s 305-meter telescope from 2017 to 2020 (Project A3123) and the 12-meter telescope in 2023 (Project A4006). Most of our targets were red dwarf stars with planets. Our observation protocol was similar to the one used by Route & Wolszczan (2012) to search for radio flares from ultracool dwarfs. Spectral observations were made in the L-band in full Stokes mode with up to 10-minute integration using the Arecibo Observatory’s Mock Spectrometer. Each of the seven receivers used had a bandwidth of 83 MHz at central frequencies of 1282, 1353, 1424, 1495, 1566, 1637, and 1708 MHz, for a total continuous bandwidth of 509 MHz. Similar observations were made in the S, C, and X bands. The integration was 100 ms and the channel width 10 kHz (unintentionally the same as Big Ear during the Wow! Signal signal detection), distributed in 8192 channels per receiver. We used both diode and target calibrators to calibrate our flux density measurements.
Our observational strategy was neither tailored nor optimized for the detection of technosignatures. However, our sample included stars with known potentially habitable exoplanets, which were observed for long sessions spanning frequencies from 1 to 10 GHz. In this study, we focus only on our drift-scan mode observations made from February to May 2020 at topocentric frequencies between 1419.5 and 1421.0 MHz (see Table 5). This mode and frequency range are analogous to the protocol used in the detection of the Wow! Signal (see Table 3). Coincidentally, our 10 kHz channel width was the same. The seven target samples included Teegarden’s Star, Barnard’s Star, and HD 157881, which were part of our main study (see Table 4). We also conducted observations in this mode of the radio galaxies 3C 76.1 (B0300+162) and 3C 365 (B1756+134), which served as our calibration standards. The magnetar SGR 1935+2154 constituted an opportunistic target, due to its active state during the observation period and its proximal spatial alignment with our primary subjects (Bochenek et al., 2020). Our final target was a nearby random section of the sky that we denoted Void, for reference purposes.
| Date (AST) | Date (MJD) | RA (deg) | DEC (deg) | Target | Scan ID | Time (min) |
|---|---|---|---|---|---|---|
| 20200210 | 58889.960405 | 43.1284 | 16.8811 | Teegarden | 52 | 1 |
| 20200225 | 58904.852072 | 42.7526 | 16.8806 | Teegarden | 18 | 4 |
| 58904.886898 | 42.0009 | 16.8797 | Teegarden | 33 | 10 | |
| 58904.895660 | 45.1845 | 16.4455 | B0300+162 | 36 | 5 | |
| 58904.901667 | 42.6273 | 16.8805 | Teegarden | 39 | 5 | |
| 58904.914306 | 44.3753 | 16.9992 | Void | 52 | 5 | |
| 58904.920046 | 42.6290 | 16.8805 | Teegarden | 55 | 5 | |
| 20200430 | 58969.297257 | 269.3267 | 4.6936 | Barnard | 18 | 1 |
| 58969.298576 | 269.3267 | 4.6936 | Barnard | 21 | 1 | |
| 58969.299896 | 269.3267 | 4.6936 | Barnard | 24 | 1 | |
| 58969.361435 | 293.6067 | 21.8969 | SGR1935+2154 | 62 | 1 | |
| 58969.362789 | 293.6067 | 21.8969 | SGR1935+2154 | 65 | 1 | |
| 20200506 | 58975.263692 | 269.5042 | 13.4759 | B1756+134 | 6 | 1 |
| 58975.270880 | 261.3131 | 2.1117 | HD157881 | 13 | 1 | |
| 58975.279387 | 269.3267 | 4.6936 | Barnard | 24 | 1 | |
| 58975.344491 | 293.6067 | 21.8969 | SGR1935+2154 | 60 | 1 | |
| 58975.349734 | 293.6067 | 21.9219 | SGR1935+2154 | 67 | 1 | |
| 58975.351389 | 293.6067 | 21.8969 | SGR1935+2154 | 70 | 1 | |
| 58975.352697 | 293.6067 | 21.9219 | SGR1935+2154 | 73 | 1 | |
| 58975.354005 | 293.6068 | 21.9469 | SGR1935+2154 | 76 | 1 | |
| 20200513 | 58982.307755 | 269.3268 | 4.5769 | Barnard | 37 | 1 |
| 58982.309086 | 269.3269 | 4.6061 | Barnard | 40 | 1 | |
| 58982.310417 | 269.3270 | 4.6353 | Barnard | 43 | 1 | |
| 58982.311748 | 269.3270 | 4.6644 | Barnard | 46 | 1 | |
| 58982.313067 | 269.3271 | 4.6936 | Barnard | 49 | 1 | |
| 58982.314398 | 269.3271 | 4.7228 | Barnard | 52 | 1 | |
| 58982.315718 | 269.3272 | 4.7519 | Barnard | 55 | 1 | |
| 58982.317037 | 269.3272 | 4.7811 | Barnard | 58 | 1 | |
| 58982.322338 | 293.6068 | 21.7803 | SGR1935+2154 | 61 | 1 | |
| 58982.323646 | 293.6068 | 21.8094 | SGR1935+2154 | 64 | 1 | |
| 58982.324954 | 293.6069 | 21.8386 | SGR1935+2154 | 67 | 1 | |
| 58982.326262 | 293.6070 | 21.8678 | SGR1935+2154 | 70 | 1 | |
| 58982.327569 | 293.6070 | 21.8969 | SGR1935+2154 | 73 | 1 | |
| 58982.328877 | 293.6071 | 21.9261 | SGR1935+2154 | 76 | 1 | |
| 58982.330185 | 293.6071 | 21.9553 | SGR1935+2154 | 79 | 1 | |
| 58982.331493 | 293.6072 | 21.9844 | SGR1935+2154 | 82 | 1 |
5 Data Analysis and Results
We devised a series of methodologies in Interactive Data Language (IDL) aimed at the detection of narrowband signals. The data were read and calibrated using the Arecibo Software Library using standard procedures. Among these methodologies, one closely emulated the analytical approach employed by the Big Ear Observatory to detect the Wow! Signal, specifically averaging data over 10-second intervals and utilizing the most recent 60 data points for background noise estimation. All of the methods yielded consistent results.
The dynamic spectra were detrended and normalized in frequency and time to cancel out broadband signals and identify narrowband variations. The signals were converted to signal-to-noise ratio (SNR) to mimic the analysis used by the Big Ear to detect the Wow! Signal. Most of the observations were made in the LSRK frame but were converted to the topocentric frame to make it easier to identify terrestrial RFI. Our longest drift scan was 10 minutes long (2 degrees in right ascension), of Teegarden’s star (see Figure 2).

We identified four main signals in the vicinity of Teegarden’s Star corresponding to small angular-size cold hydrogen clouds (see Figure 2). Similar clouds appeared in the observations of SGR 1935+2154 and in the Void regions (see Table 4). The intensity and location of the cloud signals were consistent between multiple independent scans during the same observation session of Teegarden’s Star. There was some variability for SGR 1935+2154, which included three observation sessions separated by a week.
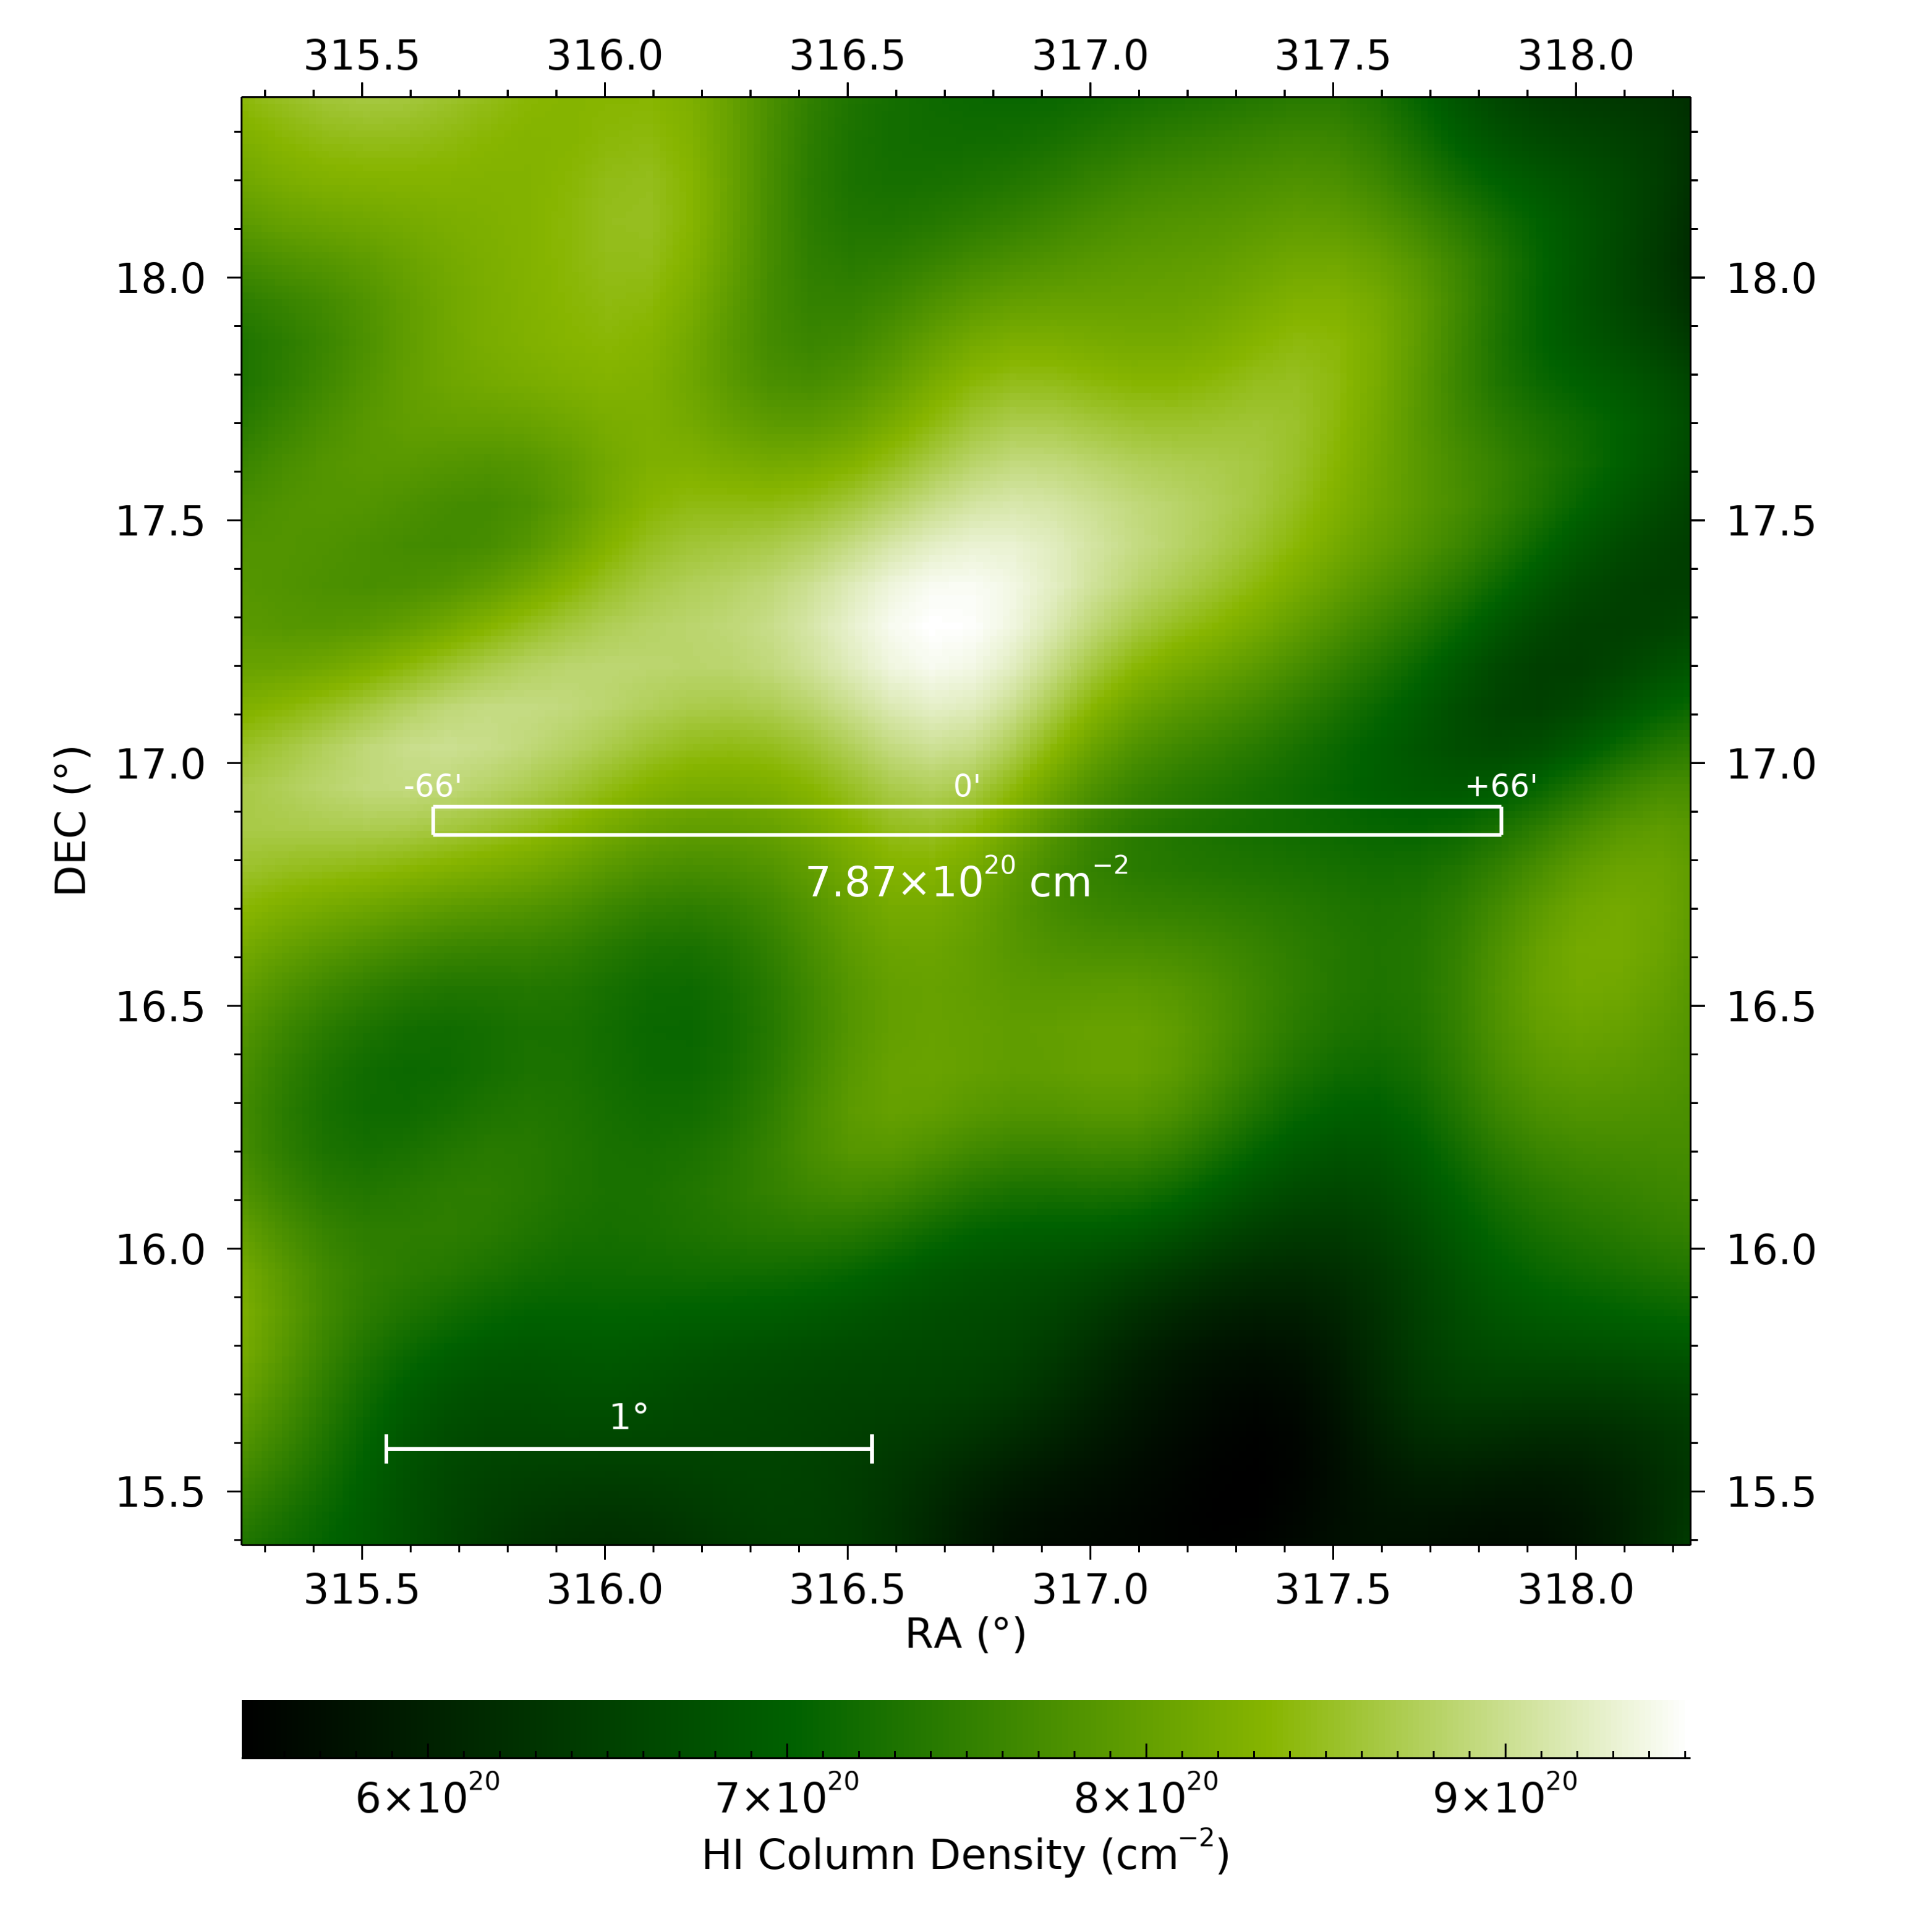
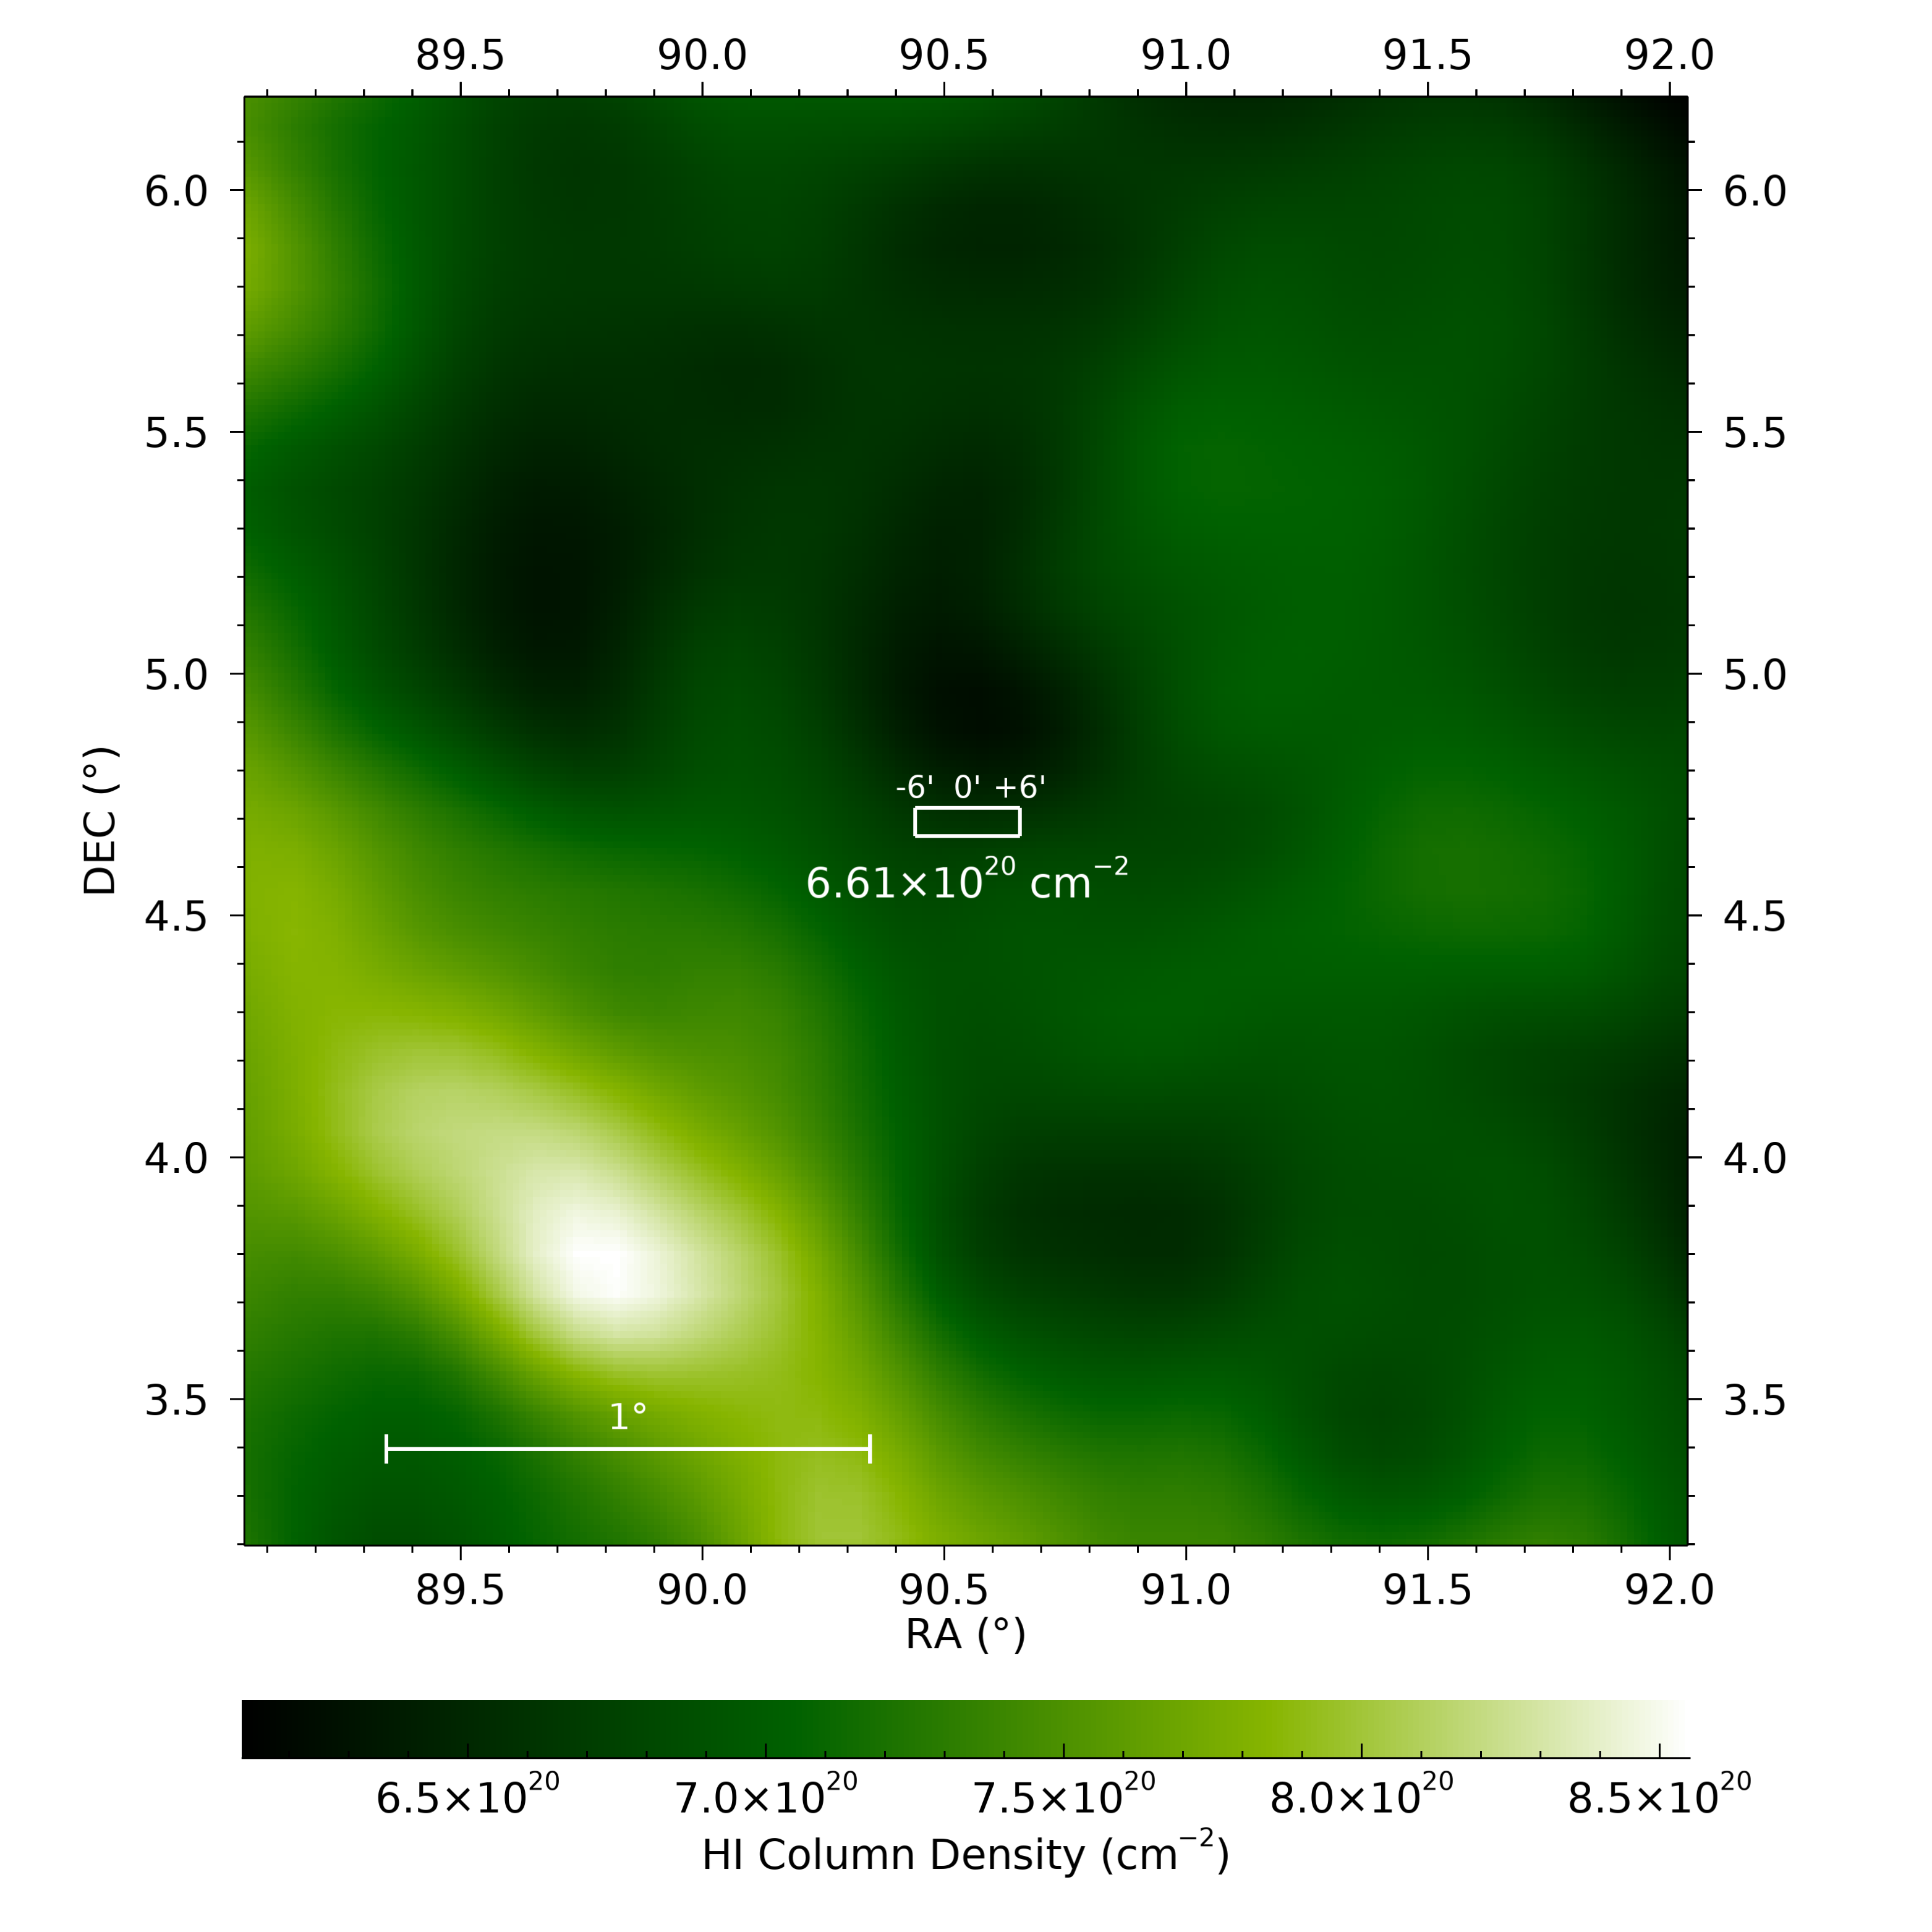
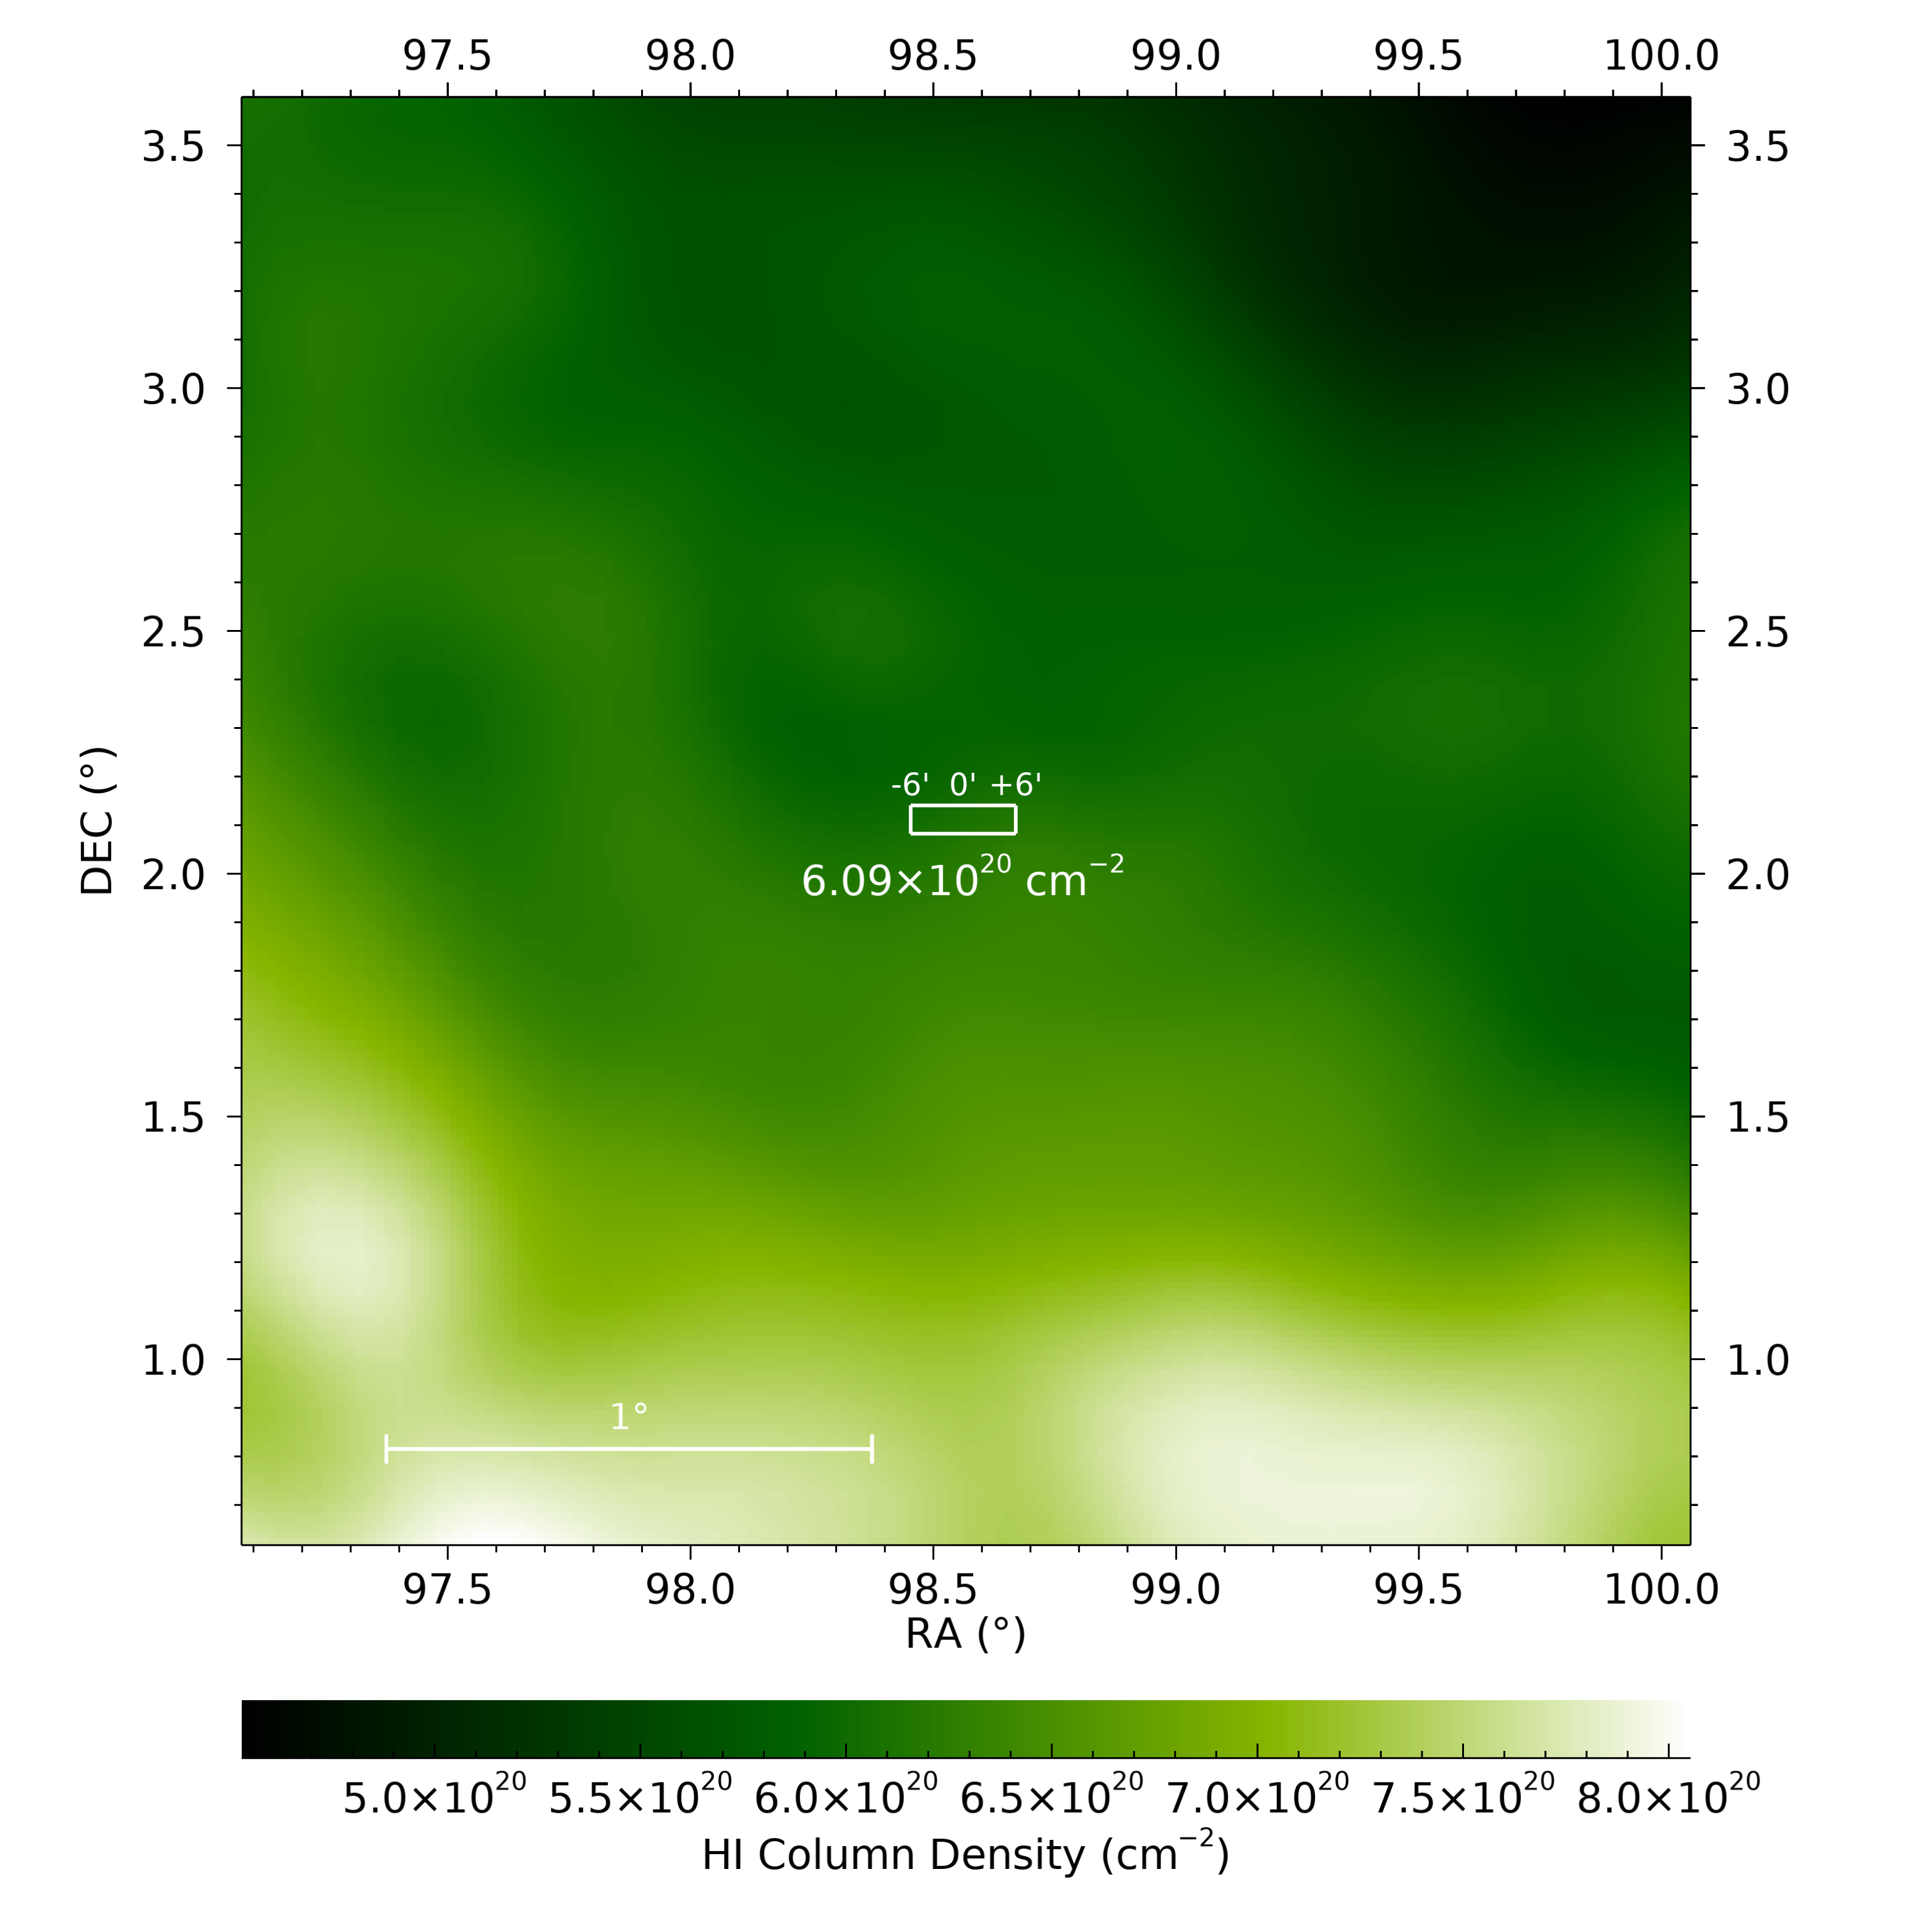
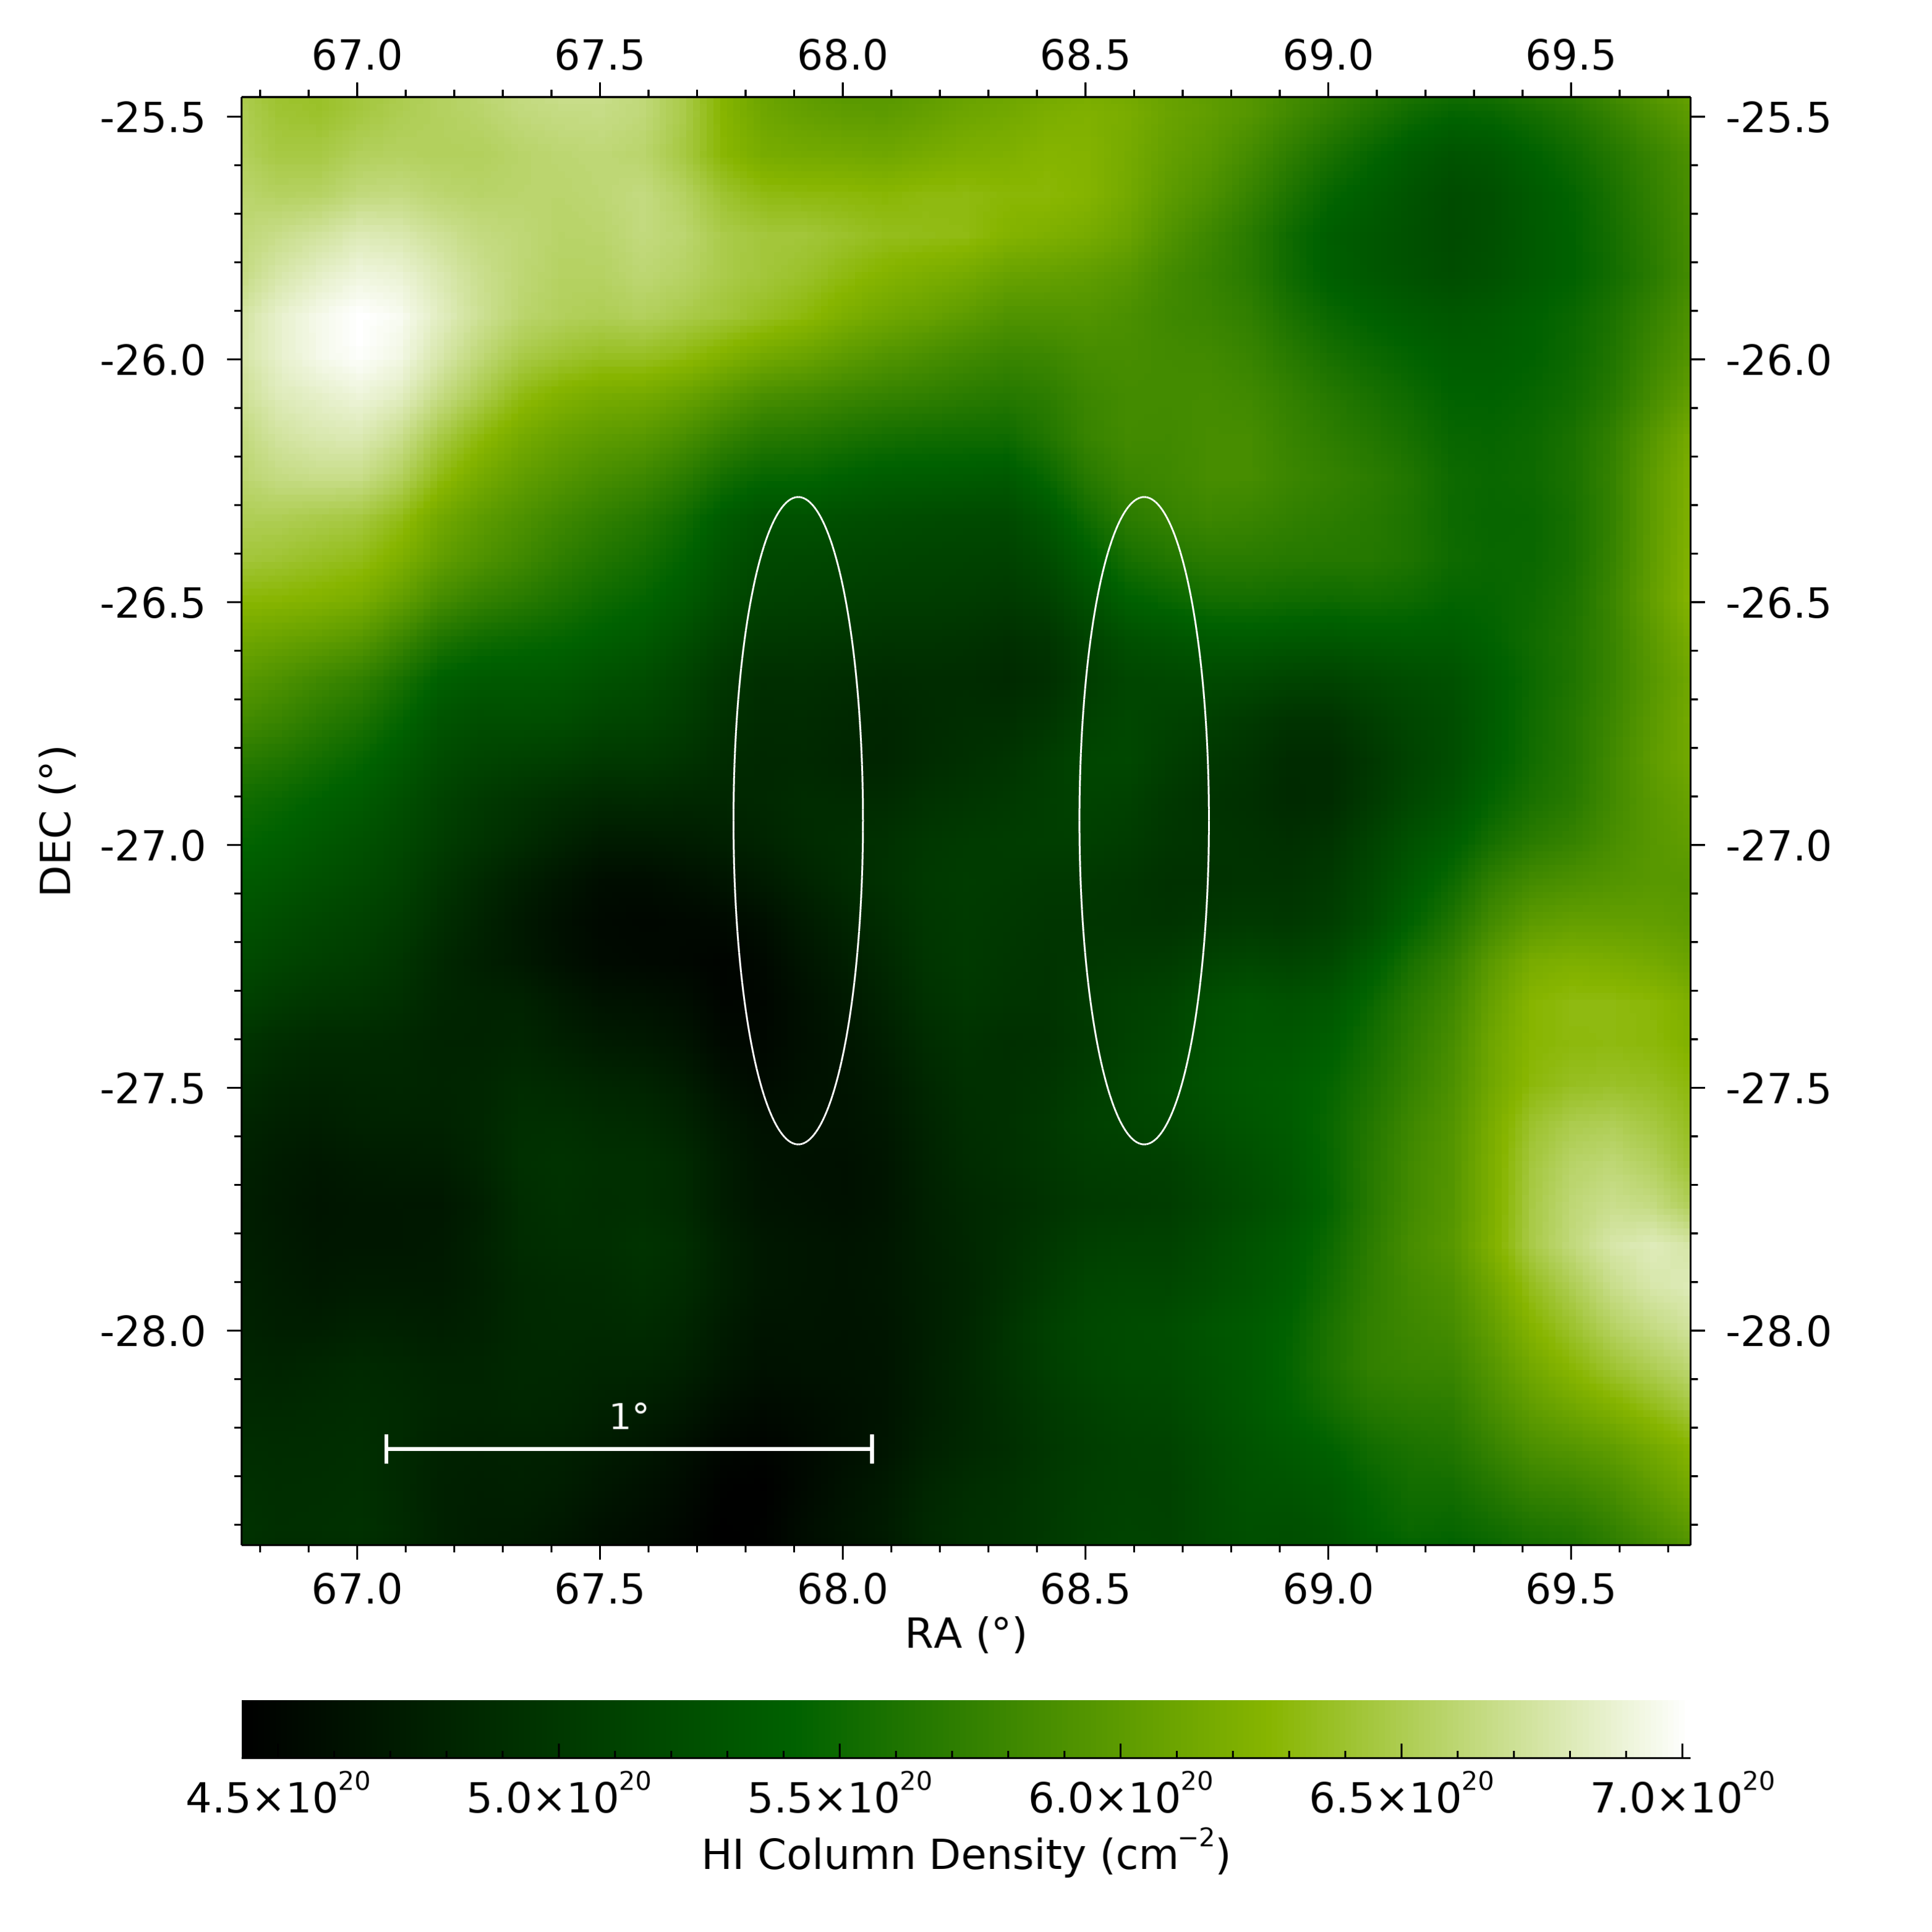
We focus our analysis in the clouds near Teegarden’s Star since it was the longest drift scan. Their observed properties are consistent with cold hydrogen clouds, assuming that they are optically thin (see Table 6). Their hydrogen column density is their partial contribution to the HI background (see Figure 3). All the results are available in this url.
The most noticeable characteristic of the signal depicted in Figure 2, is the close resemblance of the dynamic spectra of the observed region with the Wow! Signal (see Figure 1). At low spatial resolution the HI clouds in the line-of-sight produce the characteristic profile of neutral hydrogen emission (see the integrated spectrum in the upper panel). At the higher resolution of Arecibo (and Big Ear), what appears to be a single cloud reveals itself as several spatially resolved sources having different emission frequencies (due to different velocities).
Although the angular sizes of the observed clouds in the Arecibo signals are comparable to the azimuth beam width of the Big Ear telescope, namely 8 arcminutes (see Table 3), their intensities are below the detection limit of the Big Ear radio telescope. They also share the same narrowband frequency bandwidth of about 10 kHz or less. The only difference between the signals observed in Arecibo and the Wow! Signal is their brightness. It is precisely the similarity between these spectra that suggests a mechanism for the origin of the mysterious signal.
6 A mechanism for the Wow! Signal
We postulate that when observed by the Big Ear telescope in 1977 one of the clouds in the beam of the telescope was experiencing a transient increase in brightness due to a natural astrophysical process. Numerous well-known mechanisms could account for this phenomenon; however, the majority of such processes are also likely to increase the thermal energy or kinematic activity of hydrogen within the cloud, thereby broadening the hydrogen spectral line beyond the 10 kHz range. The only mechanism able to produce such a narrow-band signal is a maser.
Astronomical hydrogen masers are rare. The first one was discovered in 1989 around the star MWC349 (Martin-Pintado et al., 1989). Its emission exhibited characteristics similar to those of a molecular maser source. It was highly luminous and fluctuated over time, because of its sensitivity to alterations in the intricate excitation processes.
Hydrogen masers operating at the HI line frequency have yet to be detected in astronomical observations, though they have been produced in laboratory settings (Major & Major, 2007). In fact, human-made hydrogen masers are used for timekeeping in astronomical observatories (Gray, 2012). This experimental evidence hints that there are no fundamental limitations for which hydrogen in the neutral medium could be pumped and stimulated to produce maser-like emission.
The cold neutral medium of the Interstellar Medium (ISM) is predominantly composed of atomic hydrogen (HI), which exists primarily as clouds dispersed throughout the galaxy. These clouds are characterized by temperatures ranging from 50 to 100 K and densities between 10 and 100 atoms per cubic centimeter. The equilibrium brightness of an HI cloud, governed primarily by thermal emission processes, is relatively low, depending on the temperature and density of the cloud. However, if a maser were active and a population inversion was sustained, the brightness of the cloud can theoretically surge dramatically with the proper external stimulus.
In cases of powerful masers, brightness enhancements by factors of billions or more are feasible (see e.g. Elitzur 1992 and references therein). The observed increase in brightness is subject to various physical constraints, including the availability of excited atoms, the geometry of the cloud, and the duration of the pumping mechanism (see Figure 4).
The brightness of a cloud during a maser flare, relative to its equilibrium state, can increase dramatically because of the process of stimulated emission. In a maser, the presence of a population inversion allows radiation passing through the medium to be amplified exponentially. This occurs because photons stimulate the emission of additional photons, leading to a rapid multiplication of photon numbers and, consequently, a significant increase in intensity. The extent of this amplification is often described by an exponential factor, which is dependent on both the density of the inverted population and the path length through the cloud (Gray, 2012).
During the brief moment of population inversion, stimulated emission could dominate, leading to an amplified signal at the HI frequency. This could cause the cloud to exhibit a maser flare. The exact mechanism and theory behind this phenomenon will be investigated in a subsequent paper.
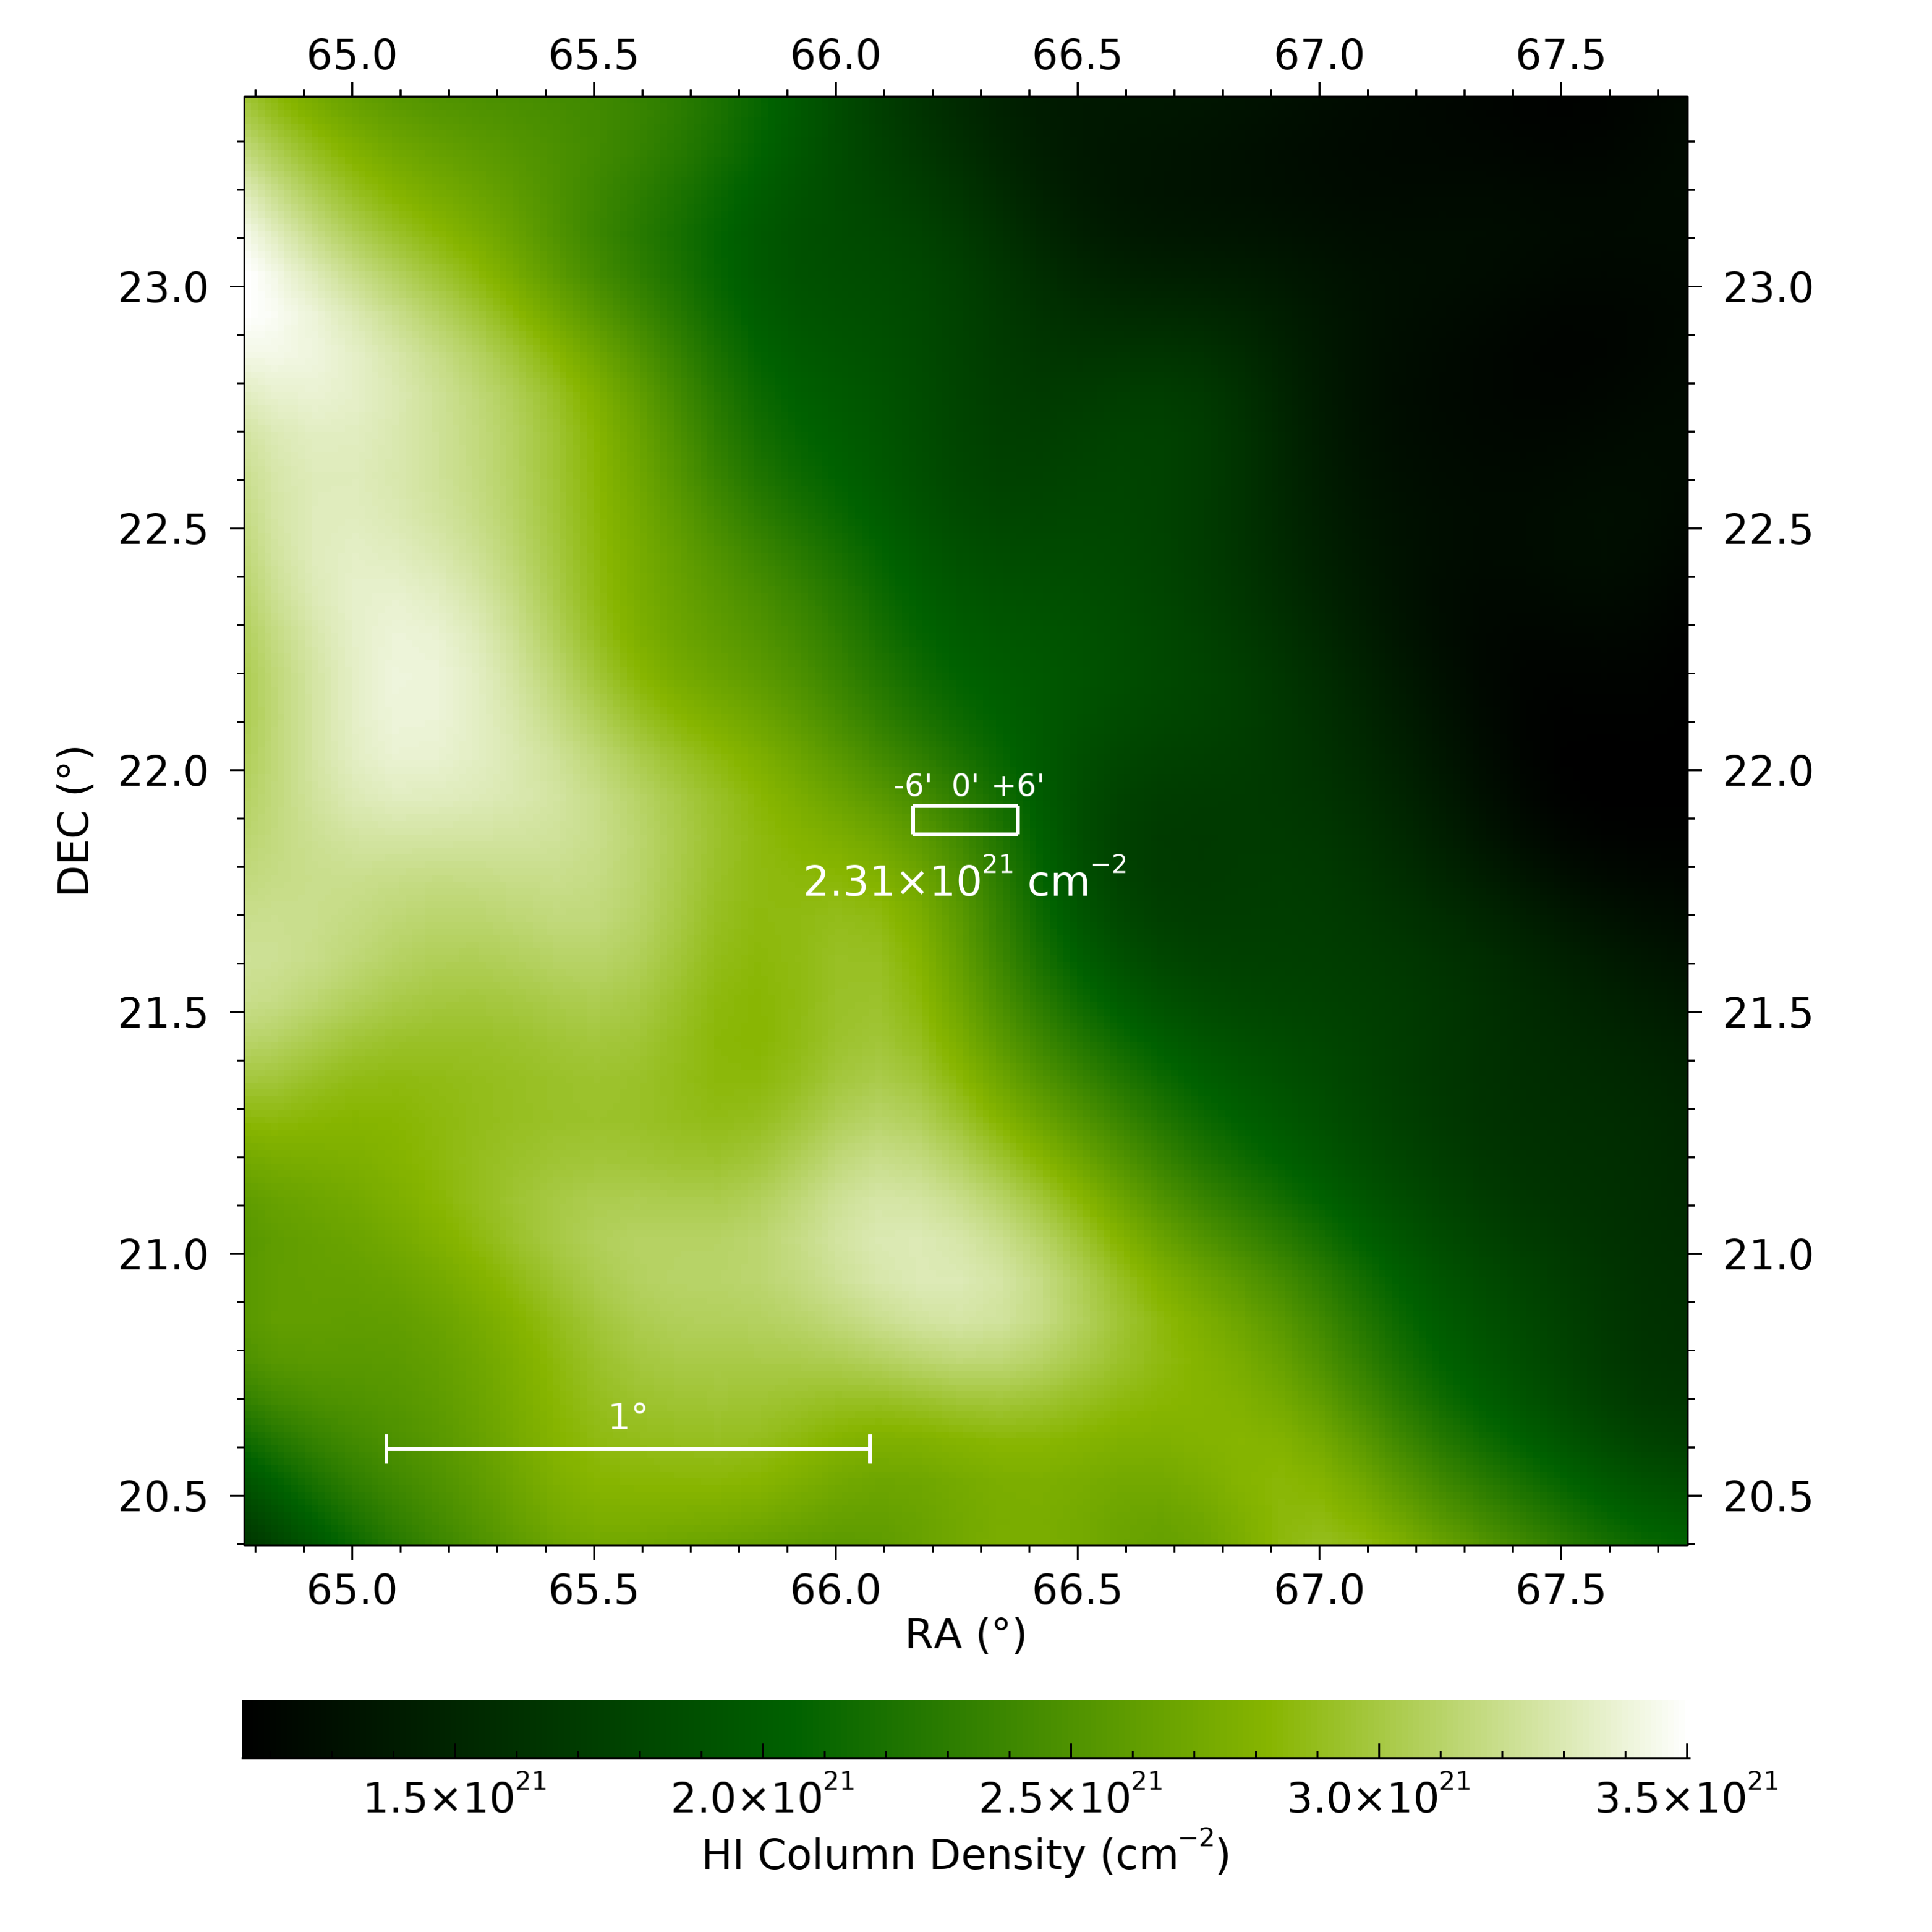
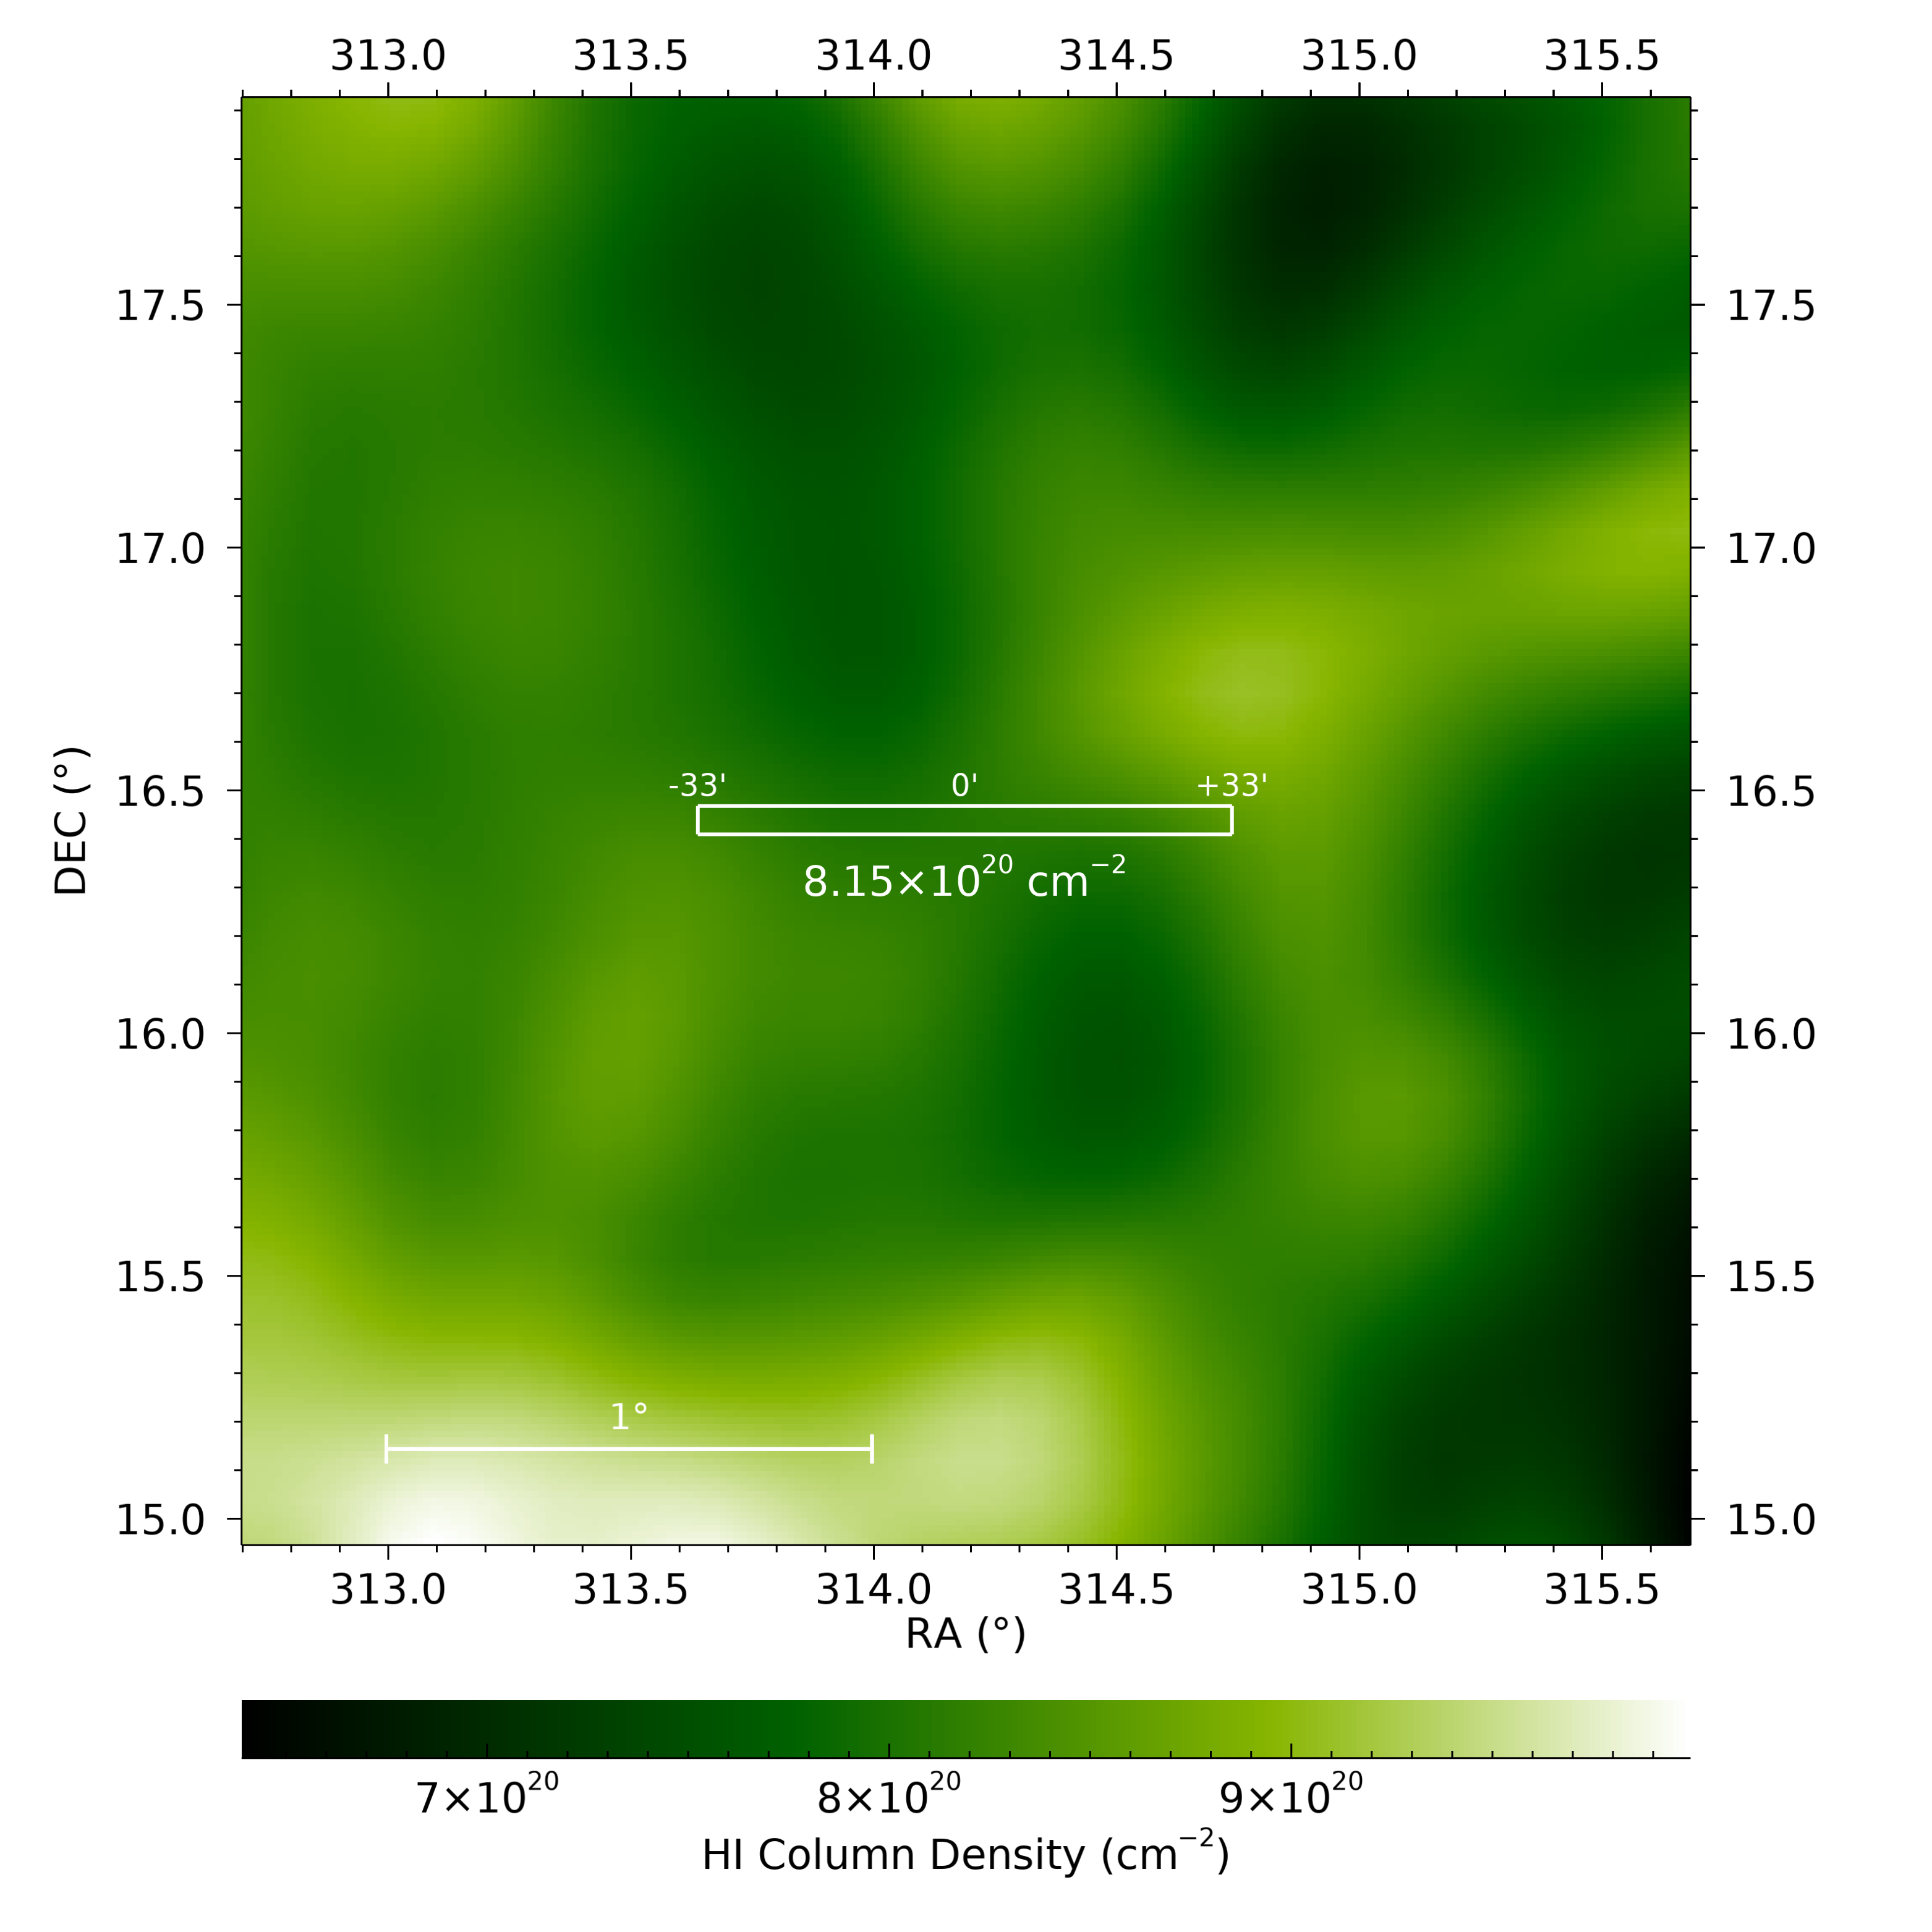
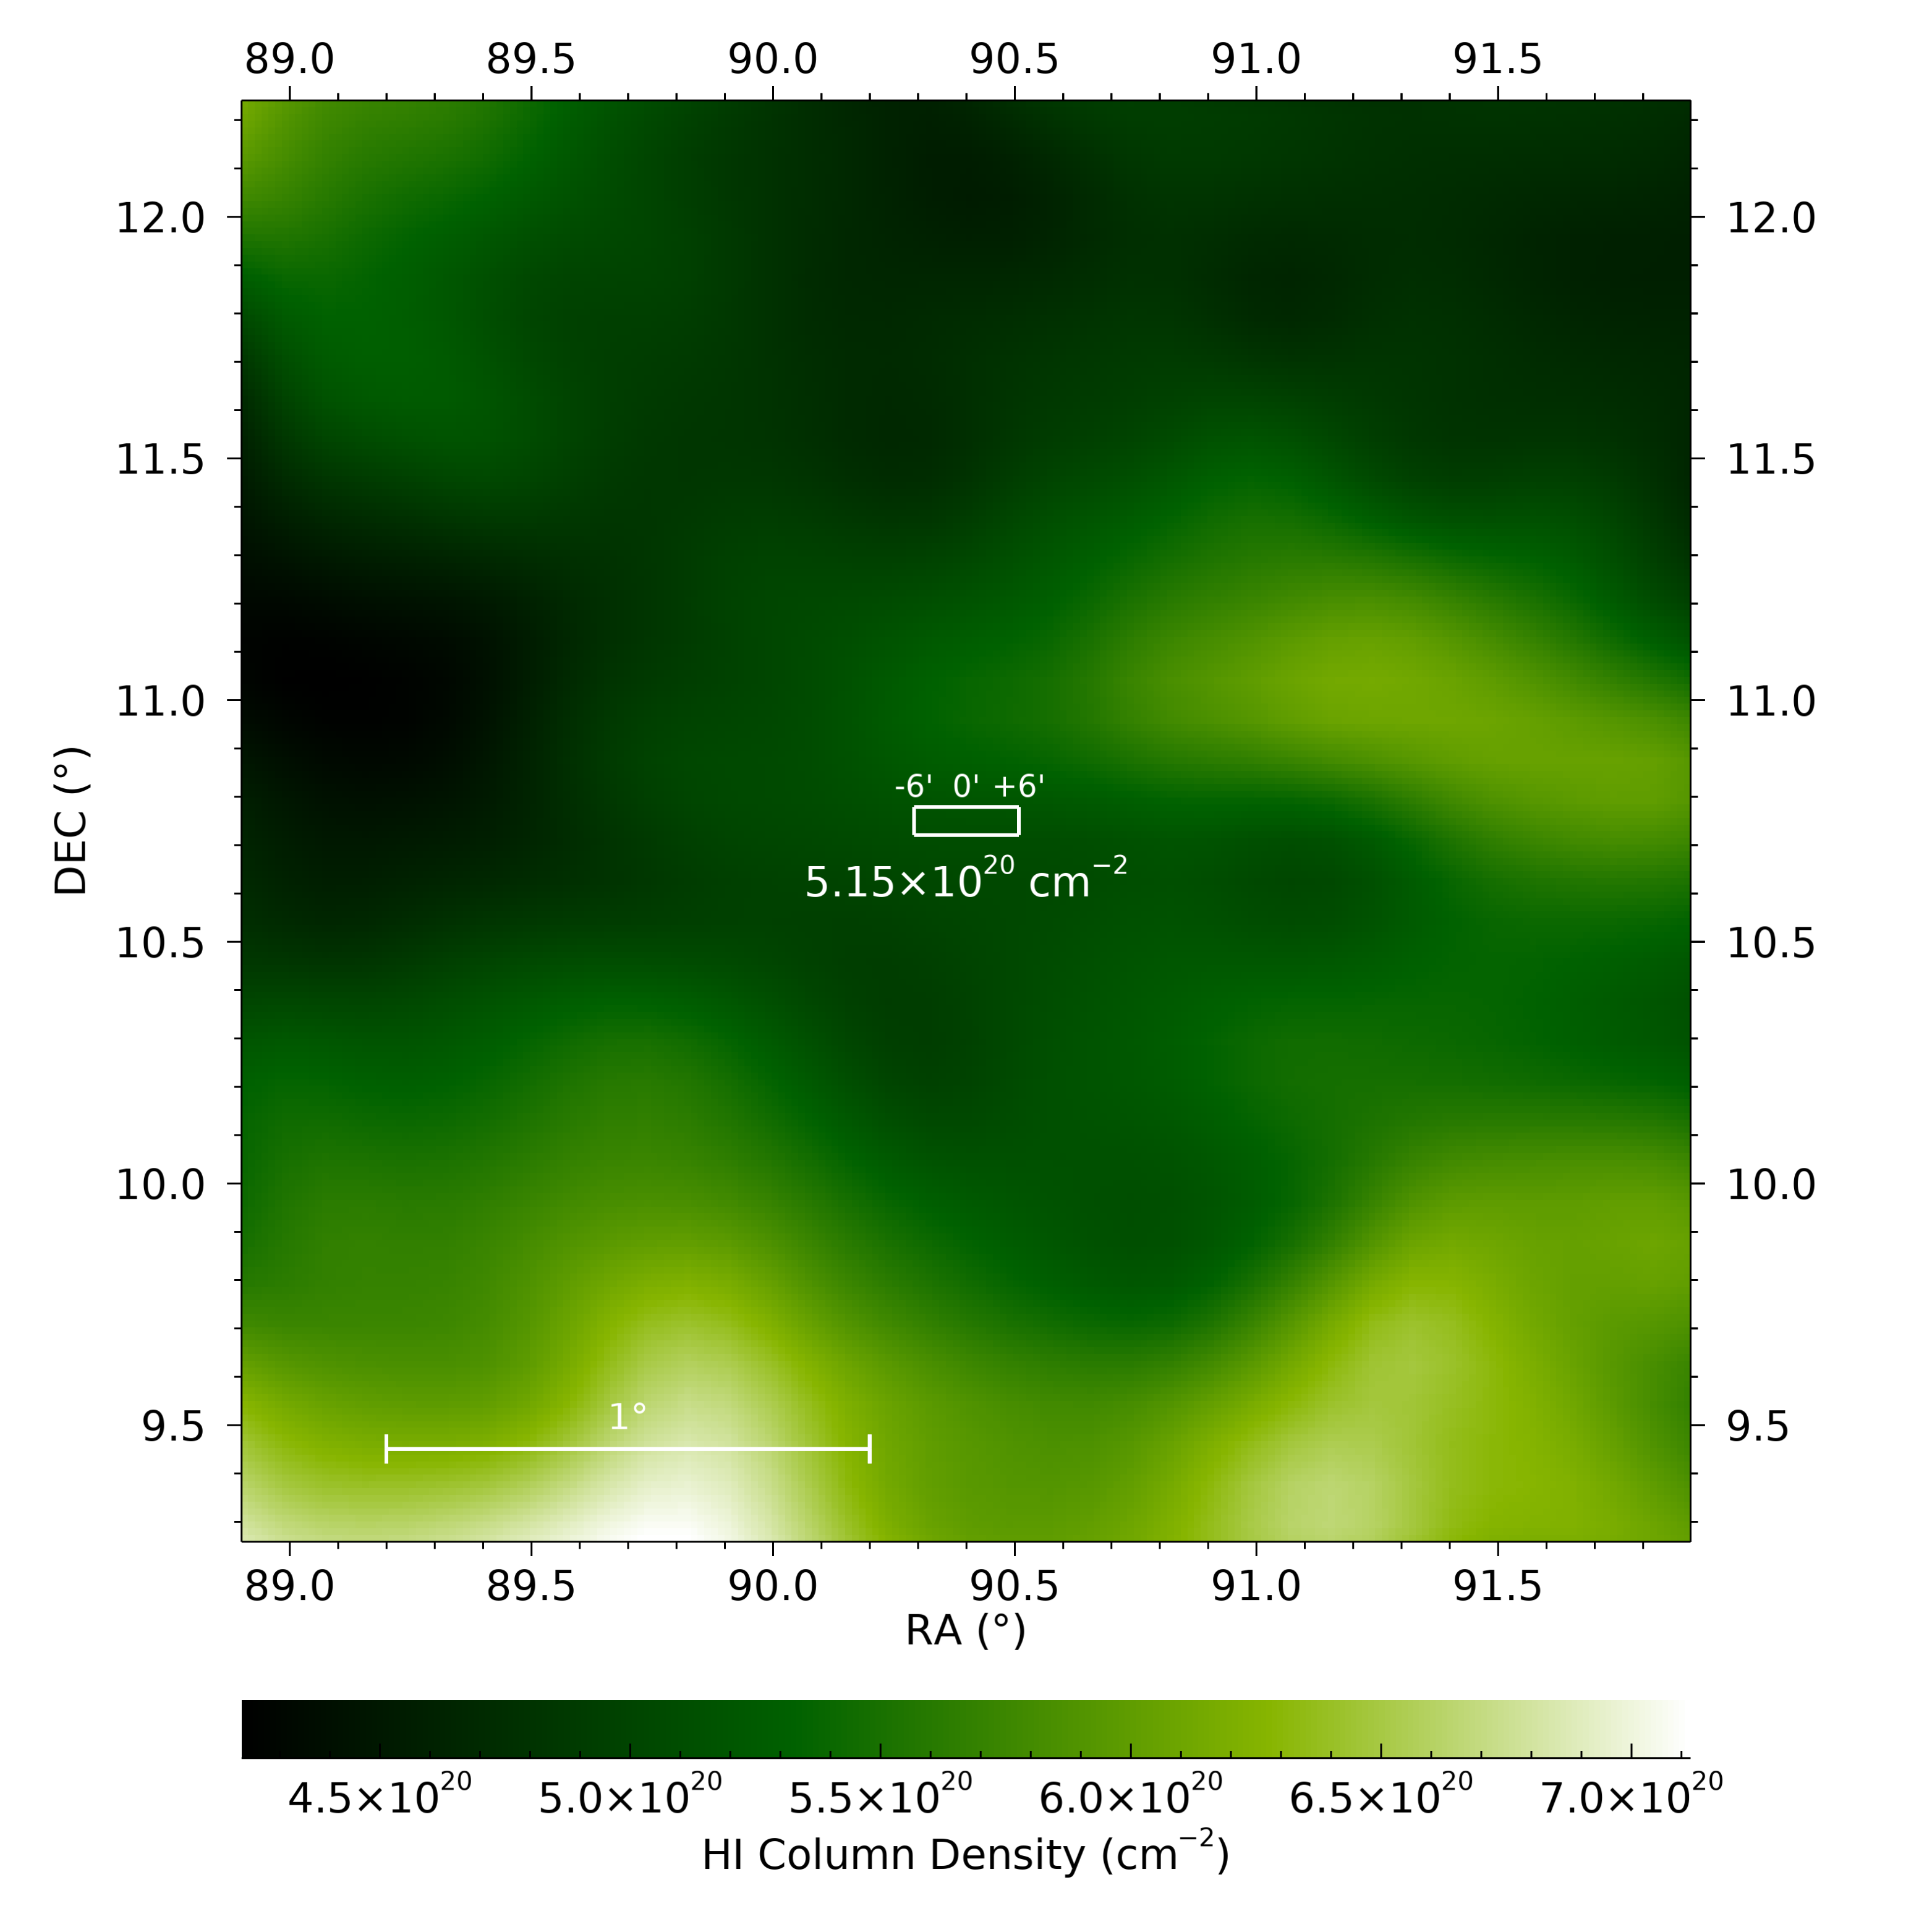
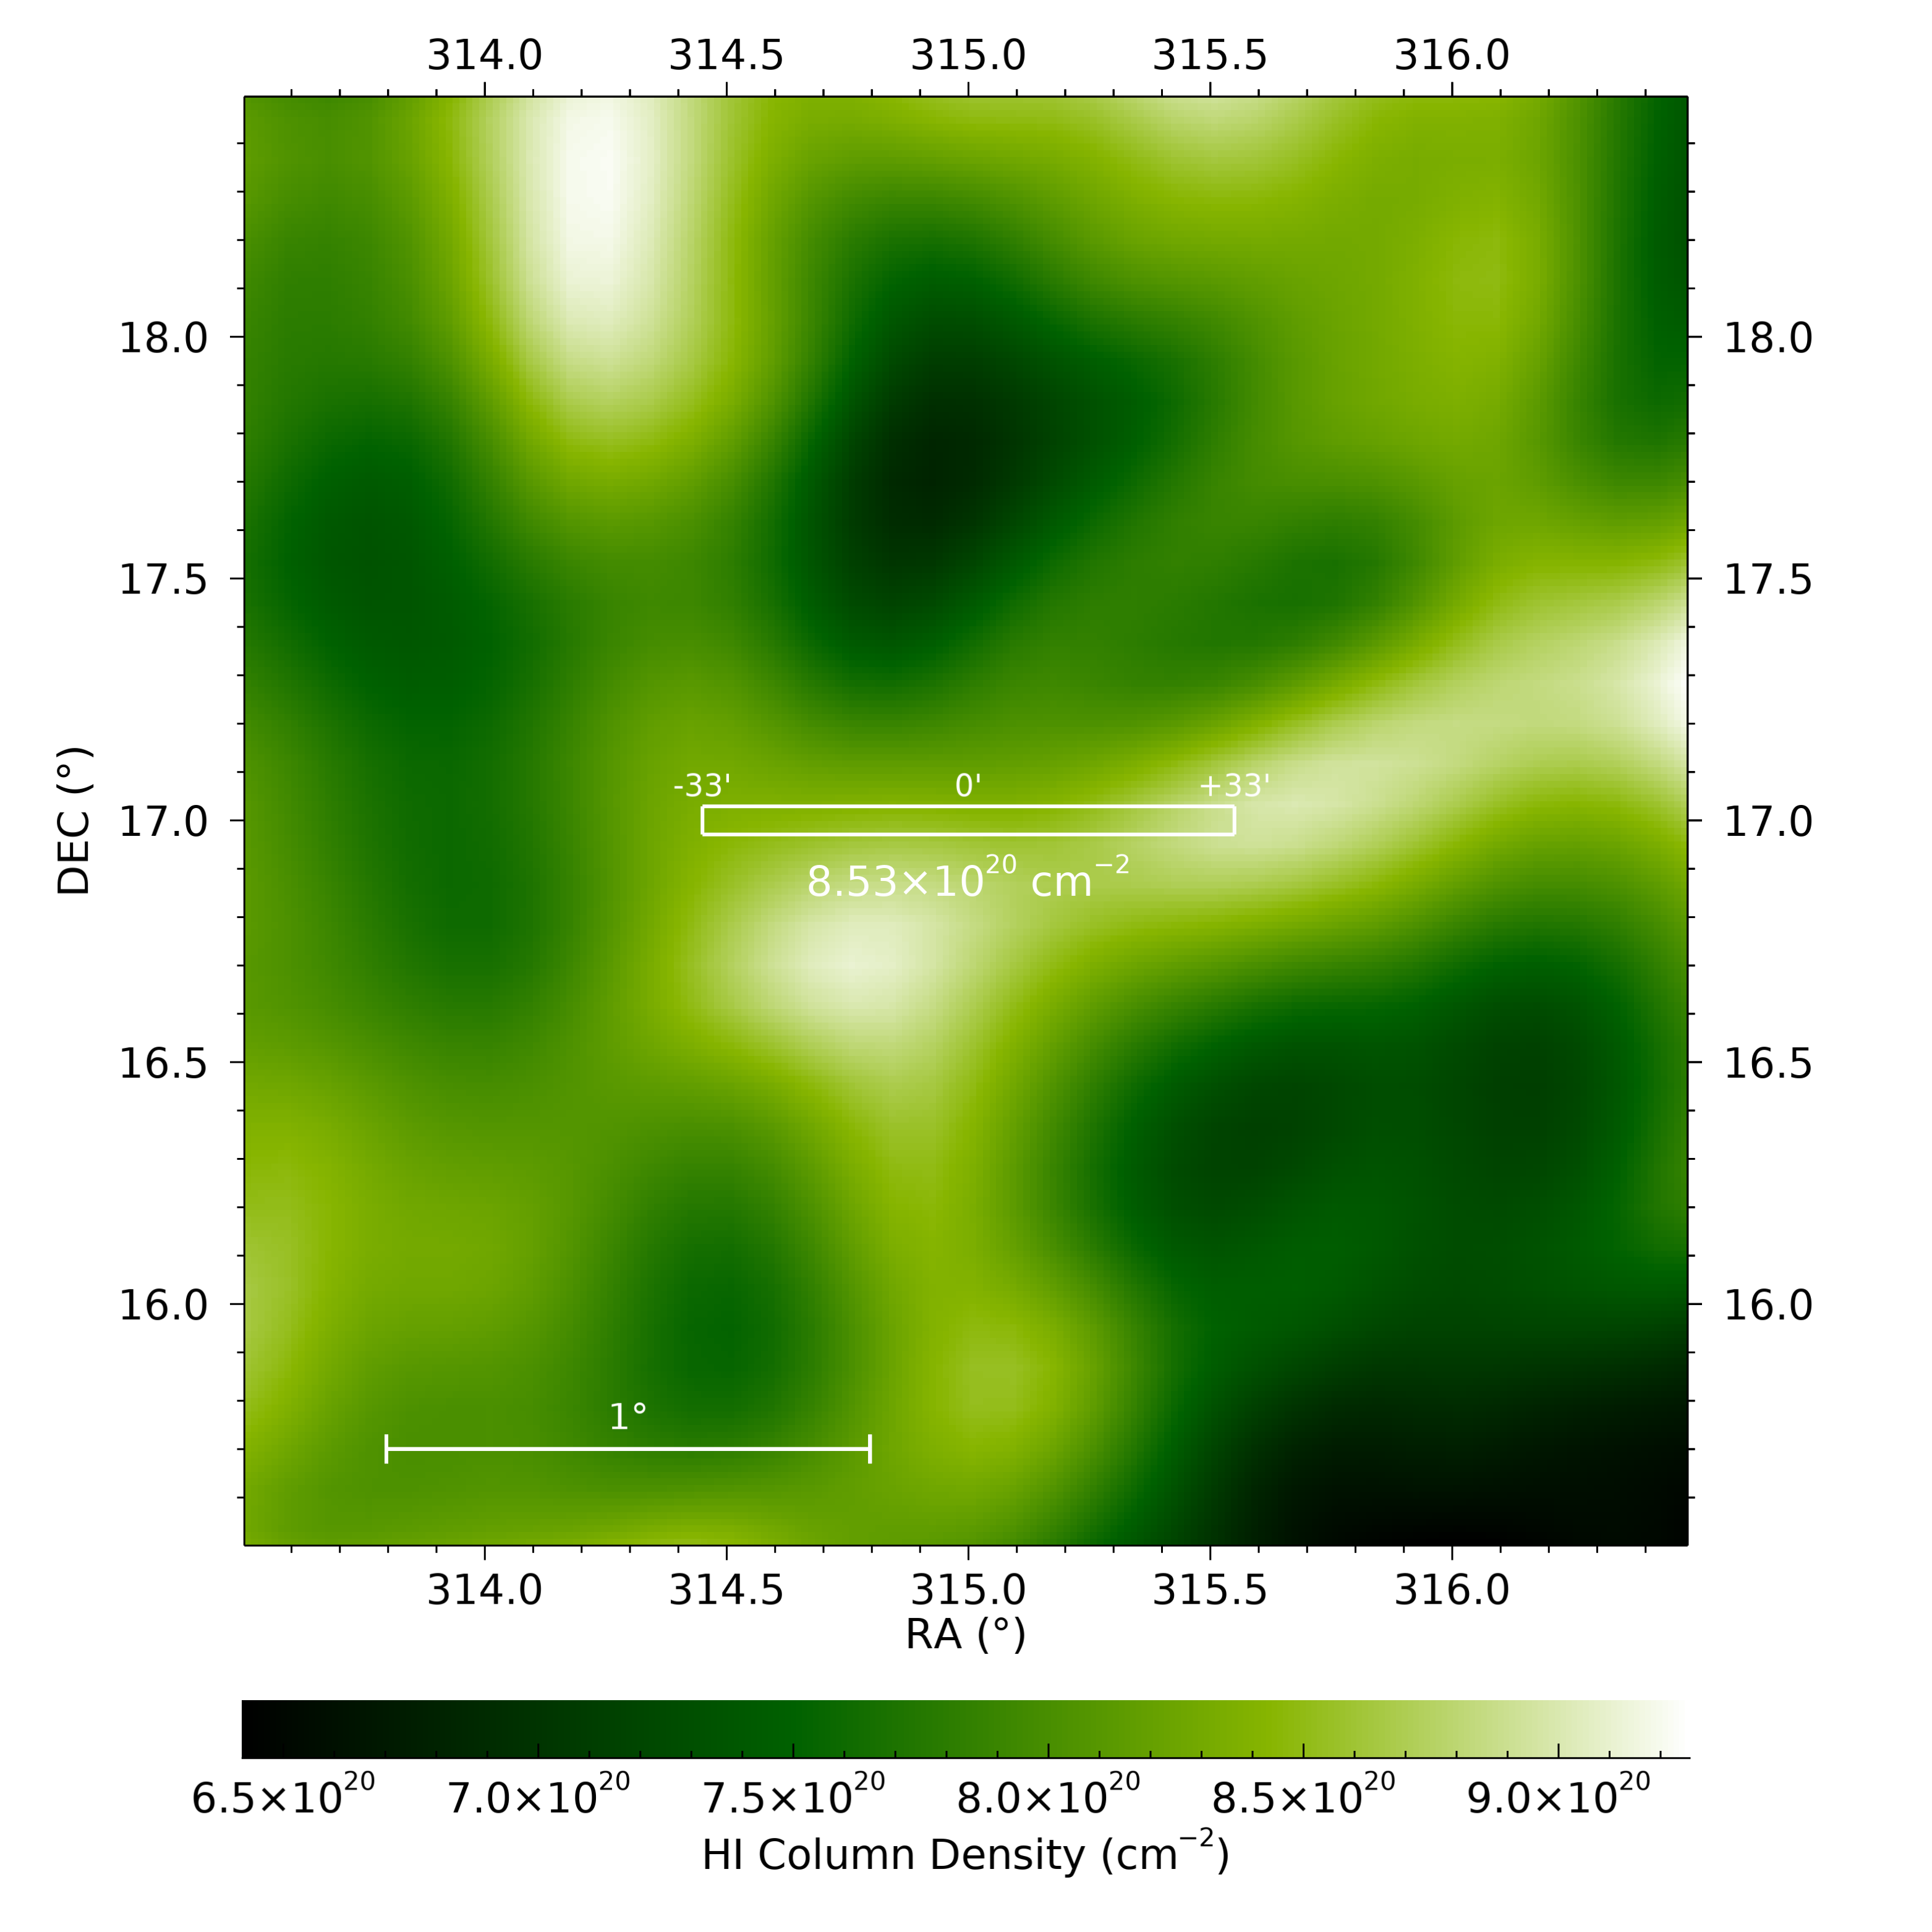
| Cloud | Coordinates | (MHz) | v (km/s) | (mJy) | LPol () | Tb (K) | (arcmin) | NHI (cm-2) |
|---|---|---|---|---|---|---|---|---|
| A | 02h59m18s | 1420.382 | +5.1 | 820 | 10 | 55 | 20 | 2.16 |
| B | 02h55m19s | 1420.402 | +0.9 | 413 | 11 | 10 | 11.6 | 4.02 |
| C | 02h52m04s | 1420.412 | -1.3 | 534 | 8 | 13 | 12.4 | 5.21 |
| D | 02h49m16s | 1420.432 | -5.5 | 560 | 8 | 14 | 15.6 | 5.46 |

7 Discussion
This hypothesis postulates that the Wow! Signal could be a genuine astronomical phenomenon rather than a product of terrestrial radio frequency interference (RFI). There are two plausible explanations for the nondetection of the initial emission from the source, with only the signal from the cloud being observed. First, the emission from the source may be insufficiently intense to be detected by the telescope because of its sensitivity threshold, yet still adequate for amplification by the intervening cloud. For example, the intensity received from the cloud could be substantially elevated if the source is in proximity to or enshrouded within the cloud. Second, notwithstanding the almost instantaneous nature of stimulated emission, where the source’s broadband signal and the amplified emission in the HI line should technically arrive concurrently, there may be a temporal delay attributed to processes of absorption and re-emission. In scenarios involving a large population of atoms, achieving maximum amplification requires a finite timeframe, potentially resulting in a signal delay ranging from seconds to minutes.
The precise location of the Wow! Signal remains undetermined. The Big Ear radio telescope, with its dual wide beam widths, encompassed numerous stellar objects. Consequently, the hydrogen cloud associated with the Wow! Signal signal may be more easily detectable. This endeavor necessitates the use of a radio telescope characterized by high spatial resolution, such as the Very Large Array (VLA), to pinpoint potential sources. Upon identifying regions of interest, the subsequent task involves locating the specific stellar object responsible for the initial burst within the identified cloud field. In addition, continuous monitoring of these and other regions for analogous Wow! events can be performed. These observations are intrinsically challenging due to the transient nature of the event, infrequent occurrence, and requisite precise alignment, all of which may elucidate why the Wow! Signal has not been observed again.
If maser flares actually occur in rare circumstances when a cold hydrogen cloud is in the line of sight of an energetic event, L-band observations might show a surge in the hydrogen line. This observation could help falsify the mechanism. Furthermore, these phenomena may already have been observed within existing archival datasets.
8 Summary and conclusions
We observed narrow-band signals ( 10 kHz) similar to the Wow! Signal near the hydrogen line, though significantly weaker. These signals align with those originating from cold hydrogen (HI) cloud regions positioned in front of a galactic hydrogen background. We propose that the Wow! Signal was caused by the abrupt brightening of the hydrogen line in these clouds due to stimulated emission from a transient and intense radiation source, such as a magnetar flare or a soft gamma repeater (SGR).
The emission source must be positioned behind the cloud to facilitate observation of stimulated emission. This spatial alignment constitutes a rare occurrence and elucidates the previous lack of detection. In contrast, this inference suggests that the progenitor of the Wow! Signal resides at a greater distance than the clouds that produce the signal. Given the detectability of the clouds, as demonstrated in our data, this insight could enable precise localization of the signal’s origin and permit continuous monitoring for subsequent events.
Our hypothesis accounts for all observed characteristics of the Wow! Signal, introduces another source of false positives in technosignature searches, and suggests that this signal represented the first recorded astronomical maser flare in the hydrogen line.
We will continue with Arecibo Wow! exploring our extensive sets of observations from Arecibo REDS. Future studies will incorporate archival data from the Arecibo Observatory, which is now hosted at the Texas Advanced Computing Center (TACC).
References
- Airapetian et al. (2020) Airapetian, V. S., Barnes, R., Cohen, O., et al. 2020, International Journal of Astrobiology, 19, 136, doi: 10.1017/S1473550419000132
- Backus et al. (2004) Backus, P. R., Bowyer, S., & Werthimer, D. 2004, in Progress in the Search for Extraterrestrial Life, ed. G. H. Lemarchand & K. Meech (San Francisco, CA: ASP), 111–115
- Bochenek et al. (2020) Bochenek, C. D., Ravi, V., Belov, K. V., et al. 2020, Nature, 587, 59, doi: 10.1038/s41586-020-2872-x
- Chennamangalam et al. (2017) Chennamangalam, J., MacMahon, D., Cobb, J., et al. 2017, ApJS, 228, 21, doi: 10.3847/1538-4365/228/2/21
- Dick (1993) Dick, S. J. 1993, Space Sci. Rev., 64, 93, doi: 10.1007/BF00819659
- Dixon & Cole (1977) Dixon, R. S., & Cole, D. M. 1977, Icarus, 30, 267, doi: 10.1016/0019-1035(77)90158-0
- Drake (1961) Drake, F. D. 1961, Physics Today, 14, 40, doi: 10.1063/1.3057500
- Drake & Sagan (1973) Drake, F. D., & Sagan, C. 1973, Nature, 245, 257
- Drake & Sagan (1973) Drake, F. D., & Sagan, C. 1973, Nature, 245, 257, doi: 10.1038/245257a0
- Ehman (2011a) Ehman, J. R. 2011a, in Searching for Extraterrestrial Intelligence (Berlin, Heidelberg: Springer Berlin Heidelberg), 47–63, doi: 10.1007/978-3-642-13196-7_4
- Ehman (2011b) —. 2011b, Searching for Extraterrestrial Intelligence, 47
- Ehman et al. (1970) Ehman, J. R., Dixon, R. S., & Kraus, J. D. 1970, AJ, 75, 351, doi: 10.1086/110985
- Elitzur (1992) Elitzur, M. 1992, Astronomical masers, Vol. 170 (Springer Science & Business Media)
- Gray (2012) Gray, M. 2012, Maser Sources in Astrophysics, 1st edn. (Cambridge University Press), doi: 10.1017/CBO9780511977534
- Gray (2021) Gray, R. H. 2021, Journal of Astronomical History and Heritage, 24, 981
- Gray & Ellingsen (2002) Gray, R. H., & Ellingsen, S. 2002, The Astrophysical Journal, 578, 967
- Harp et al. (2020) Harp, G. R., Gray, R. H., Richards, J., Shostak, G. S., & Tarter, J. C. 2020, AJ, 160, 162, doi: 10.3847/1538-3881/aba58f
- HI4PI Collaboration et al. (2016) HI4PI Collaboration, Ben Bekhti, N., Flöer, L., et al. 2016, A&A, 594, A116, doi: 10.1051/0004-6361/201629178
- Kipping & Gray (2022) Kipping, D., & Gray, R. 2022, Monthly Notices of the Royal Astronomical Society, 515, 1122
- Korpela et al. (2001) Korpela, E., Werthimer, D., Anderson, D., Cobb, J., & Leboisky, M. 2001, Computing in Science and Engineering, 3, 78, doi: 10.1109/5992.895191
- Kraus et al. (1979) Kraus, J. D., Dixon, R. S., & Ehman, J. R. 1979, The Astrophysical Journal, 234, L69
- Major & Major (2007) Major, F., & Major, F. 2007, The Quantum Beat: Principles and Applications of Atomic Clocks, 209
- Martin-Pintado et al. (1989) Martin-Pintado, J., Bachiller, R., Thum, C., & Walmsley, M. 1989, A&A, 215, L13
- Perez et al. (2022) Perez, K. I., Farah, W., Sheikh, S. Z., et al. 2022, Research Notes of the AAS, 6, 197
- Route & Wolszczan (2012) Route, M., & Wolszczan, A. 2012, ApJ, 747, L22, doi: 10.1088/2041-8205/747/2/L22
- Sagan & Drake (1975) Sagan, C., & Drake, F. 1975, Scientific American, 232, 80, doi: 10.1038/scientificamerican0575-80
- Sheaffer (1975) Sheaffer, R. 1975, Spaceflight, 17, 421
- Shostak (1993) Shostak, S. 1993, Spaceflight, 35, 116
- Shostak (2003) Shostak, S. 2003, Confessions of an Alien Hunter: A Scientist’s Search for Extraterrestrial Intelligence (Washington, D.C.: National Geographic)
- Staff at the National Astronomy & Ionosphere Center (1975) Staff at the National Astronomy, & Ionosphere Center. 1975, Icarus, 26, 462, doi: 10.1016/0019-1035(75)90116-5
- Tarter (2001) Tarter, J. 2001, Annual Review of Astronomy and Astrophysics, 39, 511
- Tarter (2010) —. 2010, Philosophical Transactions of the Royal Society A: Mathematical, Physical and Engineering Sciences, 368, 3661
- Turnbull & Tarter (2003) Turnbull, M. C., & Tarter, J. C. 2003, ApJS, 145, 181, doi: 10.1086/345779
- Vedantham et al. (2020) Vedantham, H. K., Callingham, J. R., Shimwell, T. W., et al. 2020, Nature Astronomy, 4, 577, doi: 10.1038/s41550-020-1011-9
- Werthimer et al. (2001) Werthimer, D., Anderson, D., & Bowyer, S. 2001, in Proceedings of the SPIE, Vol. 4273, 104–108
- Werthimer et al. (1988) Werthimer, D., Brady, R., Berezin, A., & Bowyer, S. 1988, Acta Astronautica, 17, 123, doi: 10.1016/0094-5765(88)90135-X
- Wright (2021) Wright, J. T. 2021, Acta Astronautica, 188, 203
- Yiu et al. (2024) Yiu, T. W. H., Vedantham, H. K., Callingham, J. R., & Günther, M. N. 2024, A&A, 684, A3, doi: 10.1051/0004-6361/202347657