Regimes of rotating convection in an experimental model of the Earth’s tangent cylinder–LABEL:lastpage
Regimes of rotating convection in an experimental model
of the Earth’s tangent cylinder
keywords:
Tangent cylinder, rotating convection, baroclinicity, outer core dynamics.The flow in the liquid core of the Earth is controlled by the interplay between buoyancy and the Coriolis force due to planetary rotation. Fast rotation imposes the Taylor-Proudman Constraint (TPC) that opposes fluid motion across an imaginary cylindrical surface called the Tangent Cylinder (TC) obtained by extruding the equatorial perimeter of the solid inner core along the rotation direction, and up to the core-mantle boundary (CMB). Because this boundary is imaginary, however, mass and heat transfer through the TC, as well as the regimes of convection within the TC may differ from those inside a solid cylinder with well-defined boundary conditions. To date however, the influence of this peculiar boundary is unknown and this impedes our understanding of the flow in the polar regions of the core. To clarify this question, we reproduce the TC geometry experimentally in the Little Earth Experiment 2 (LEE2), where the CMB is modelled as a cold, cylindrical vessel filled with water, with a hot cylinder inside it acting as the inner solid core. The vessel is filled with water so as to optically map the velocity field in regimes of criticality and rotational constraint consistent with those of the Earth (Rayleigh number up to times critical and ratio of inertial to Coriolis forces in the range to ). We find that although the regimes of convection within the TC broadly resemble those within a cylinder with solid impermeable insulating walls (CSIIW), the TC boundary introduces differences of particular significance in the context of the Earth’s core.
The main new mechanism arises out of the baroclinicity near the cold lateral boundary of the vessel, which drives inertia at the outer boundary of the TC, as convection in the equatorial regions of the Earth’s core does. The baroclinicity just outside the TC suppresses the classical wall modes found in CSIIW and the inertia there causes an early breakup of the TPC at the TC boundary. The breakup appears locally at low criticality and then over the entire TC surface at . The flow remains dominated by the Coriolis force even up to , but because of inertia near the TC boundary, geostrophic turbulence appears at much lower criticality than in other settings ( instead of typically ). It also promotes the emergence of a few large structures, of similar topology to the flux patches observed in geomagnetic data. The heat flux escapes increasingly through the TC boundary as the TPC there becomes weaker. It eventually bypasses the axial heat flux and homogenises temperature laterally. This translates into a diffusivity-free scaling independent of rotation. Hence inertia driven by baroclinicity outside the TC provides a convenient shortcut to geostrophic turbulence, which is otherwise difficult to reach in experiments. These results also highlight a process whereby the convection outside the TC may control turbulence inside it and bypass the axial heat transfer. We finally discuss how Earth’s conditions, especially its magnetic field may change how this process acts within the Earth’s core.
1 Introduction
The flow in the outer core of the Earth is often modelled as being driven by convection due to a radial temperature gradient, representing either the super-adiabatic temperature or compositional gradient there (Cardin & Olson, 1992, 2015). The dominating force is, however, the Coriolis force due to planetary rotation, rather than buoyancy. The main effect of rotation is to suppress both variations of physical quantities along the rotation axis, and fluid motion that are not solenoidal in planes normal to it. The Taylor-Proudman Constraint (TPC) expresses that to remain 2D and 2D solenoidal in the limit of fast rotation, the flow must follow geostrophic contours aligned with surfaces intercepting the core that are of constant depth along the rotation axis (Proudman, 1916; Taylor, 1917; Greenspan, 1969). Since planetary interiors are practically axisymmetric, these surfaces are cylinders aligned with the rotation axis. In the case of the Earth and other planets with a solid core, the Tangent Cylinder (TC) extruded from the solid core along the rotation axis plays a prominent role: because the depth of fluid just inside the TC is double of that just outside it, the TPC imposes that in the regimes of extremely fast rotation of the Earth, the TC should act as an impermeable mechanical barrier preventing any exchange of mass between these two regions. Indeed the polar regions inside the TC and the equatorial regions outside it feature very different convective flows: in the equatorial region, the nonlinear dynamics of geostrophic “Busse” columns Busse (1970) is driven by radial buoyancy in the equatorial plane and these columns are stretched to the Core-Mantle Boundary (CMB) as a result of the TPC, where their evolution is constrained by the curvature of the CMB (see reviews by Olson (2011, 2013); Cardin & Olson (2015); Pothérat & Horn (2024). In the polar regions within the TC, by contrast, gravity and rotation are mostly aligned and the topographic effects are less pronounced. It follows that the convection there may resemble Rotating Rayleigh-Bénard Convection (RRBC) between two parallel boundaries normal to both temperature gradient and gravity and is expected to set in at higher values of the Rayleigh numbers , where is a typical gravity in the outer core, , and are the thermal expansion coefficient, viscosity and thermal diffusivity of the liquid metal there, and the super-adiabatic temperature difference between the Inner Core Boundary (ICB) and the CMB, and the outer core thickness (see the recent reviews by Kunnen (2021) and Ecke & Shishkina (2023)).
Numerous numerical simulations in spherical shells well beyond the onset have shown that the convection patterns inside and outside the TC still exhibit the same significant differences as those identified in the simpler onset regimes (Kono & Roberts, 2002; Gubbins & Emilio, 2007; Schaeffer et al., 2017). Yet, there is mounting evidence from geomagnetic data that the TPC is violated at the Earth’s TC boundary and that the flow there may locally exhibit a significant radial component (Pais & Jault, 2008; Pais et al., 2014; Gillet et al., 2015, 2019; Finlay et al., 2023): A strong planetary gyre connects the upper region of the TC to the equatorial region near the CMB. This gyre is currently accelerating as part of what is believed to be an oscillating process (Livermore et al., 2017).
Since the TPC relies mainly on the assumption that only pressure forces can balance the Coriolis forces, another force must be able to compete to induce these flows to invalidate it. Viscous forces are vanishingly small at the scale of the gyre: The Ekman number, based on the Earth rotation , the outer core thickness and the viscosity of the liquid metal therein , that measures their ratio to the Coriolis force is of the order of , where is the background rotation (Schubert & Soderlund, 2011), so viscous forces are not believed to play any significant role in breaking the TPC. The two main possibilities are the Lorentz forces due to the electric currents within the core interacting with the Earth’s magnetic field, and Buoyancy, or perhaps more accurately inertia-driven buoyancy. Livermore et al. (2017) argues that the oscillatory nature of the gyre and the short timescale of these oscillations points to magnetohydrodynamic waves or temporal variations of the magnetic field. Indeed magnetohydrodynamic waves provide a mechanism for fast oscillations in the core (Gillet et al., 2010, 2022) and the Lorentz force due to the Earth magnetic field can induce velocities across the TC that break the TPC (Sakuraba, 2002; Cao et al., 2018; Hotta, 2018). A recent theory extended the derivation of the TPC to include axial magnetic fields into a Magnetic Taylor-Proudman constraint. This constraint imposes that any flow along a geostrophic contours induces a corresponding flow across it and so suggests that the nearly dipolar character of the magnetic field near most of the TC may preclude a purely azimuthal flow around it (Pothérat et al., 2024). Whether or not any of these ideas explains the flow across the Earth’s TC, the question of whether buoyancy drives sufficient inertia to overcome the TPC is yet to be clarified. First, the Convective Rossby number based on the free-fall velocity provides a measure of buoyancy-driven inertia, and is thought to be rather small at the scale of the core in the region between and (Aurnou et al., 2020; Schubert & Soderlund, 2011). Its value strongly depends on how far beyond the onset of convection operates, and the answer to this question differs between the regions inside and outside the TC. Inside the TC, criticalities are expected to lie in the range 10 to . If convection there resembles RRBC, geostrophic turbulence may exist at criticalities and produce intense structures such as the Large Scale Vortices (LSV) that appear in numerical simulations of RRBC (Aguirre Guzmán et al., 2021). These could locally increase inertial effects and would make it possible for buoyancy-driven inertia to locally compete with the Coriolis force and break the TPC. Unfortunately, they LSV never observed in experiments.
Second, in constraining the flow along geostrophic contours, the Coriolis force may also affect the temperature profile along the TC. Indeed in the simple case of RRBC, the rotation promotes temperature gradients in the bulk as (Julien et al., 2012). The resulting misalignment between gravity and temperature gradients provides a source of baroclinic buoyancy that drives azimuthal thermal wind near the TC boundary (Aurnou et al., 2003; Aujogue et al., 2018), and so provides a possible source of inertia. The conditions under which such inertia would be able to break the TPC are, however, unclear. Nevertheless, the effect is especially pronounced near the CMB that tends to enforce an isothermal condition there (notwithstanding inhomogeneities of the heat flux there, that are also capable of driving spiral jets deep into the Core (Sumita & Olson, 1999, 2002; Sahoo & Sreenivasan, 2020a, b)). Incidentally, the upper region of the TC near the CMB is precisely where the gyre breaks the TPC.
Considering the TC boundary is unlikely to be purely adiabatic and may not remain impermeable, the question arises of how fluxes of heat and mass through it may affect the convection inside the TC. Indeed most of the current knowledge on RRBC in a cylinder with solid impermeable insulating walls (CSIIW) was obtained assuming adiabatic and impermeable boundaries. This question has motivated at least two experimental studies where convection in TCs was characterized using custom-built experimental setups, whose principle is shown in figure 1(b) (Aurnou et al., 2003; Aujogue et al., 2016, 2018). These experiments utilised a cylindrical heater placed at the center of a hemispherical dome (shown in figure 1b) to avoid spurious baroclinic instabilities due to the misalignment between isobars and isotherms. Aurnou et al. (2003), using dye visualisation experiments, observed four transient convection states with increasing Rayleigh number, (a) subcritical regime with no convection, (b) rim instability leading to helical plumes around the edge of the tangent cylinder, (c) quasi-geostrophic convection with helical plumes throughout the tangent cylinder, and finally (d) 3D turbulent convection. Aujogue et al. (2018) studied convection in a TC using PIV measurements, calling their experiment ‘Little Earth Experiment (LEE)’, a precursor of the device we use in this paper. The critical scalings for the onset Rayleigh numbers and wavelength of convection in a TC were similar to those known for plane convection, but with a greater prefactor for the critical wavelength. They observed similarities in the flow structures of supercritical plumes akin to those found in rotating convection in CSIIW, suggesting that the confinement within the TC affects convection in a similar way as solid lateral walls. Interestingly, they found that wall-modes, which appear below the onset of bulk convection in CSIIW (Ning & Ecke, 1993; Zhong et al., 1991, 1993; Ecke & Shishkina, 2023), only appeared after the onset of bulk convection, suggesting that the TC boundary does not behave as a solid wall in the subcritical regime.
Much in the spirit of the early annulus and spherical shell experiments on convection in equatorial region (Cardin & Olson, 2015; Pothérat & Horn, 2024), these two experiments produced crucial insight on the onset of convection in the TC and moderately supercritical regimes (below 20 times the critical Rayleigh number). In light of the discussion above, the questions raised by the study of the Earth’s core now concern the breakup of the TPC and the nature of the flow at higher criticality. While the successive regimes of RRBC in plane layers and CSIIW have been precisely mapped in the past three decades, a corresponding level of insight is still lacking for the quite unique configuration of planetary TCs. Here we set out to answer some of three TC-specific questions in view of understanding how these processes may express in planetary cores:
-
1.
what are the regimes of convection inside a TC where baroclinicity may exist along the TC boundary?
-
2.
what level of criticality is required to break the TPC at the TC and what are the consequences for the convection inside the TC when this happens?
-
3.
what part of the heat flux is diverted to the lateral TC boundary, as opposed to axially?
We pursue an experimental approach, building on the ideas and technical advances of Aurnou et al. (2003) and Aujogue et al. (2018), to undertake a more systematic analysis of the regimes inside the TC, using a significantly upgraded version of LEE: LEE2. LEE2 is built to operate both in non-magnetic and magnetic regimes but we first address these questions in the absence of magnetic field, leaving aside the influence of the Lorentz force. We target a range of criticalities spanning the subcritical regime to criticalities over , closer to the condition expected in the Earth core. We first recall the main regimes of convection in CSIIW for reference, and to place the range of parameter accessible to LEE2 in the existing landscape of RRBC (section 2). We then provide the detail of the experimental setup and the experimental techniques deployed to achieve a step change in precision, control and parameter range compared to LEE (section 3). We then proceed to identify the different regimes using PIV measurements informed by an estimate of the global force balance in five different slices of our experimental TC (section 4). From these, we identify the impact of the different regimes on the axial and lateral heat transfer (section 5). We then assess how these are related to the breakdown of the TPC (section 6) and discuss possible consequences for the Earth Core (section 7).
2 Regimes of rotating convection in cylinder with solid impermeable insulating walls
In order to explore the regimes of rotating convection in a TC geometry, we first review and summarize the well-known regimes and their features in a cylindrical geometry. This will enable us to compare the regimes which we observe in our TC geometry to the ones commonly observed in a CSIIW and highlight the specificity of TC regimes. There are four control parameters that are commonly required to describe rotating convection in a CSIIW (figure 1c), the Rayleigh number (), the Ekman number (), the Prandtl number (), and the aspect ratio of the cylinder () defined as
| (1) |
where is the gravitational acceleration in the lab, and and are the height and diameter of the cylinder, respectively. is the temperature difference between the hot and cold boundaries, . The product represents the ratio of buoyancy to viscous forces and quantifies the strength of thermal forcing in the system. The Prandtl number is a ratio of momentum diffusion to heat diffusion and is a fluid property. The main output parameters for the rotating convection in a CSIIW are the Nusselt number and the Reynolds number defined as,
| (2) |
where is the total heat flux, is the thermal conductivity of the fluid and is the velocity scale. The Nusselt number is the ratio of total to conductive heat flux . These two parameters respectively provide nondimensional measures of the axial heat and momentum fluxes due to the convective flow.
The addition of rotation has an overall stabilizing effect on the Rayleigh–Bénard convection (Chandrasekhar, 1961). Based on the theoretical prediction, the critical Rayleigh number for the onset of rotating convection in an infinitely extended plane layer is for (Chandrasekhar, 1961; Kunnen, 2021). In CSIIW, convection can exist below this critical Rayleigh number in the form of a so-called wall modes that appear near these walls, where they are found precessesing around the circumference of the confined domain. Zhang & Liao (2009) provided an estimate for the critical Rayleigh number for the onset of wall mode convection given by (Aujogue et al., 2018; Kunnen, 2021). This equation was derived for a confined domain with no-slip boundaries, representative of physical experiments.
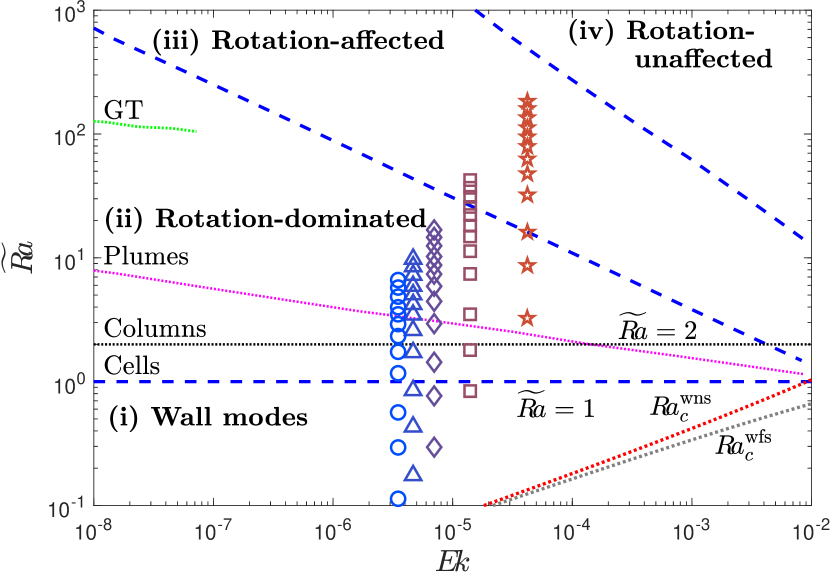
For rotating convection in CSIIW, three distinct heat-transfer regimes are reached when varying how strongly rotation affects the convection: ‘rotation-dominated’, ‘rotation-affected’ and ‘rotation-unaffected’, or ‘buoyancy-dominated’ (Ecke & Shishkina, 2023; Kunnen, 2021; Cheng et al., 2020; King et al., 2013). These regimes are commonly spanned by varying at constant or varying at constant . The ‘fourth’ regime occurs below the onset of bulk convection and is associated with the wall-mode convection. These regimes can be represented in a (, ) plane shown in figure 2, where (Kunnen, 2021). They can also be identified by their signature in the the variations of heat flux and inertia. These are best seen by plotting the Nusselt number normalized by their values for the non-rotating case with the convective Rossby number , as shown in figure 9. Here, we provide a brief summary of each of these regimes.
(i) Wall modes: The existence of wall modes below the onset of bulk convection, at , has been well observed for rotating convection in laterally confined cylinders (Rossby, 1969; Goldstein et al., 1993; Zhong et al., 1993; Zhang & Liao, 2009). Wall modes increase the heat transfer above the conductive value, however, their effect has been found to be limited to (Rossby, 1969; Zhong et al., 1993). Wall modes are believed to drive a Boundary Zonal Flow (BZF) near the side walls in confined cylinders. The physical processes connecting wall modes to BZF is currently the focus of extensive research (Favier & Knobloch, 2020; Ecke et al., 2022; Wedi et al., 2022).
(ii) Rotation-dominated regime: When the flow is rapidly rotating, the main force balance is quasi-geostrophic, i.e. between the Coriolis and pressure forces. The onset of rapidly rotating convection then produces quasi-geostrophic cellular vortical structures (Chandrasekhar, 1961; Veronis, 1959; King & Aurnou, 2012). In the cellular regime, the vortical structures are quasi-two dimensional, aligned with the axis of rotation and arranged in a quasi-steady grid (Chandrasekhar, 1961). With increasing , the flow structures gradually change to convective Taylor columns. These columns are long-lived and drift laterally (Noto et al., 2019). With further increase of , the vertical coherence of the structures is lost, and plumes are formed (Julien et al., 2012). The state of highest within the Rotation-dominated regime is (quasi-)geostrophic turbulence (Sprague et al., 2006; Julien et al., 2012). However, this regime has been mainly reached for . Using DNS, experiments and asymptotic modelling, Stellmach et al. (2014) showed the existence of all four flow states in rotating convection. The rotation-dominated regime can be characterized using the ratio of the Nusselt number to non-rotating heat transfer . There is a steep increase in with increasing in this regime. For , an enhancement of heat transfer by up to 30 (Zhong et al., 2009) in the form of an overshoot of reaching up to around 1.3 is observed. This enhancement is generally associated with the Ekman pumping (Hart et al., 2002; Kunnen et al., 2006; Zhong et al., 2009). In a recent review, Kunnen (2021) discusses the challenges in identifying the boundary between the rotation-dominated and rotation-affected regimes. For , Kunnen (2021) proposes the peak location as the boundary for this transition while Liu & Ecke (2009) suggested as the boundary between these two regimes.
(iii) Rotation-affected regime: The rotation-affected regime separates the rotation-dominated and buoyancy-dominated regimes. It is also marked by a decrease in from its peak value (for ) up to the point where is reaches an asymptotic value of 1 (Kunnen, 2021).
(iv) Rotation-unaffected/Buoyancy-dominated regime: In this regime, the Coriolis forces becomes negligible compared to buoyancy. The heat transfer scalings are similar to those in nonrotating turbulent convection, i.e. , and the approaches the nonrotating scaling of (Ahlers et al., 2009; Ecke & Shishkina, 2023). This regime also often features a large-scale circulation (LSC) in the bulk (Kunnen et al., 2011).
3 Experimental setup and system parameters
3.1 Experimental setup
We investigate rotating convection in a TC using temperature and instantaneous velocity measurements with water as the working fluid. Experiments are based on the Little Earth Experiment-2 (LEE2), built on the same principle as its predecessor LEE1 (Aujogue et al., 2016, 2018), but to much higher accuracy in terms of measurements and control of the experimental conditions. The picture of LEE2 is shown in figure 3a, and the schematics are shown in figures 3b and 3c. Although we study rotating-convection in water in the present paper, one of the main purposes of this device is to study magneto-rotating-convection: in magnetohydrodynamic (MHD) experiments, with 30 sulphuric as a working fluid, chosen for its transparency and electric conductivity. For that purpose, the setup must be able to be placed inside the 376 mm diameter bore of a large solenoidal magnet at the High Magnetic Field Laboratory in CNRS, Grenoble. Therefore, many of our design choices result from the constraint that LEE2 should be operable in this high magnetic field environment (up to 12 T). We use a transparent cylindrical vessel of inner diameter of 220 mm made of 5 mm thick transparent acrylic as the convection cell. At the centre of its bottom wall, a cylindrical heater (of diameter = 150 mm) protrudes into the vessel (shown in figure 3c). The heater fulfills two functions: First, its upper surface is kept at fixed hot temperature , while the top and side outer walls of the cylinder are kept at a cold temperature to create an unstable temperature gradient prone to drive convection within the vessel. Second, its edge incurs a radial jump in domain height akin to the equatorial edge of the Earth’s inner core, where a TC develops under fast rotation. The height above the heater is = 143 mm, providing an aspect ratio () of 1.05 for the Tangent Cylinder above it.
The electrical heater generates heat using current running through a metal wire. In order to use this heater inside the magnetic field, it is critical that we don’t generate additional Lorentz force. Therefore, the heater consists of a PEEK plate supporting two adjoining spirals of the metal wire with respective electric currents moving radially inward and outward. The current runs in the opposite directions in the neighbouring spirals, thereby nearly canceling the forces and torque acting on the heating element. The heater provides a nearly isothermal boundary condition on top of its surface. The maximum inhomogeneity of this condition over the heater surface was found within \SI0.2K through simultaneous temperature measurements at different azimuthal locations on top of the heater. For the heat transfer measurements, we use three temperature probes at different locations (denoted by indices , with corresponding temperature ) of the convection cell (shown in figure 3c). The temperature probes on the heater (shown as in figure 3c) are negative temperature coefficient (NTC) thermistors (TE Connectivity, Product no.: GA10K3MBD1) with \SI10kΩ resistance, and probe diameter of 1.1 mm. The temperature range of these thermistors are 233K to 398K and tolerance is 0.2K. The temperature probes on the cylinder walls (shown as and in figure 3c) are NTC thermistors (Amphenol Advanced Sensors, manufacturer part no.: MM100GG103A) with 10 kOhms resistance and the probe diameter of 2.03 mm. The temperature range of these thermistors are \SI273K to \SI323K with tolerance \SI0.05K. From these, we monitor two temperature differences to analyse axial and radial heat transfer: Axial temperature difference inside the cell
| (3) |
and radial temperature difference inside the cell
| (4) |
is controlled to a precision of around \SI±0.05K using a PID controller. For all results presented in this paper, the working fluid is water, of density , viscosity , thermal diffusivity and thermal expansion coefficient even though LEE2 is designed to operate both with water and electrically conducting Sulphuric acid. The heater was operated so as to produce a controlled temperature difference in the range [\SI0.5K, \SI23K], for which the radial temperature difference laid in the range [\SI0.5K, \SI35K].
The vessel is rotated using a DC motor placed at the bottom of the set-up (figure 3). The torque is transmitted from the motor to the experiment via a drive shaft. The weight of the experiment is supported by metal ball bearing (replaced with plastic and ceramic parts for the MHD experiments). The angular velocity of the experiment is controlled using the voltage applied to the DC motor. It is continuously monitored with a built-in optical system, made of an alternating black and white (B/W) teeth wheel placed on the edge plate (shown in figure 3b) and an optical detector fitted on one of the vertical supporting profiles. was varied in the range 0 rpm to 60 0.2 rpm.
Instantaneous velocity fields are recorded using a bespoke Particle Image Velocimetry (PIV) system. Since this PIV system has been developed with the specific constraint of its operation in high magnetic fields, cameras and lasers are kept far away from the region of high magnetic field where the convection cell sits (see figure 3a,b). The laser and optics generate a single horizontal laser sheet intercepting the vessel at adjustable height. Their position is controlled by a stepper motor operated through slip ring while rotation is in progress. We visualize 5 successive horizontal planes inside the convection cell at heights , , , and from the top of the heater (at ). Thanks to this system, once the flow has reached equilibrium for set rotation speed and temperature difference, the velocity fields in all 5 planes is recorded in sequence. This saves start up time and eliminates uncertainties incurred by restarting the experiment from a state of rest between measurement in different planes. This is a significant improvement over LEE1 (Aujogue et al., 2018) where the rotation had to be stopped to be able to change the height of the light sheet. To generate the light sheets, a continuous laser (Direct Diode Green Laser Module, Product no.: OFL420-G1000-TTL-ANA) emits green light of \SI520nm wavelength with a maximum power of \SI1W. The laser sheet of thickness around 1 mm is generated using a line generator disc placed outside but close to the convection cell. The fluid is seeded with highly reflective silver-coated hollow glass spheres of mean size \SI10μm (from Dantec Dynamics). The images are acquired at 20 frames per second (fps) with a USB3-operated Flea3 camera of resolution 20801552 pixels. The spatial resolution is about 6.7 pixels for 1 mm of the visualised area. Velocity fields are computed using the LaVision software, where the adaptive cross-correlation method is employed for the velocity calculations.
For the PIV as well as the temperature measurements, all the signals are transferred from the rotating frame to the static frame using MOFLON slip rings (one located near the top and the other near the bottom of the set-up, shown in figure 3b). The experimental protocol consists of first checking that all the temperature probes read the same value with the fluid at rest and the heater switched off (with uncertainty of around \SI0.1K). Then, the rotation is started with the desired value and we wait until the flow reaches a solid body rotation (typically around 30 min, confirmed with PIV measurements). Then the heater is turned on with the prescribed value. Real-time readings of the temperature difference are fed to the PID controller, which adjusts the current passing through the heater so as to maintain this prescribed value. The maximum power and temperature of the heater are around \SI350W and \SI343K, respectively. Only when the system has reached a statistically steady mechanical and thermal state ( 60 min in total) are the PIV measurements carried out. In terms of the thermal diffusion time scale , this corresponds to time units. The flow fields are recorded for 10 minutes (corresponding to in thermal diffusion time units) at 20 fps providing 12,000 images for every horizontal plane at a fixed and . This frequency was found sufficient to resolve all flow timescales of interest in this study. Temperature readings were acquired at a frequency of \SI0.1Hz using PicoLog Data logging software.
| Control Parameters | LEE2 | LEE1 | Aurnou et al. | Earth’s core |
| = | 1.05 | 0.83 | 0.86 | 1.06 |
| 6.4 | 7 | 7 | 10-1 | |
| 10-5 | 10-15 | |||
| 109 | 109 | 109 | 1022 |
3.2 System parameters
The non-dimensional control parameters for this study are the Rayleigh number and Ekman number , the Prandtl number and aspect ratio of the TC . and are fixed for all the experiments we conducted at and = 1.05. In LEE2, and are defined as
| 4.2 | 0.59 | 0.80 | 0.74 | 0.002 | ||||
| 1.4 | 2.58 | 2.35 | 2.23 | 0.019 | ||||
| 0.71 | 6.38 | 4.61 | 4.42 | 0.075 | ||||
| 0.47 | 11.1 | 6.93 | 6.69 | 0.17 | ||||
| 0.35 | 16.4 | 9.29 | 8.99 | 0.30 | ||||
| Earth: , | ||||||||
| 8.07 | 0.003 |
Therefore, the regimes of rotating convection are probed by varying the thermal forcing through and rotation speed , which is equivalent to varying and , respectively. is varied between \SI0.5K and \SI23K, for each chosen value of , yielding between 2.4107 and 1.14109. A limiting factor on the rotation rate is the appearance of centrifugal acceleration at higher rotation speeds. If the rotation is sufficiently fast, centrifugal acceleration can compete with the gravitational acceleration, and the combined acceleration doesn’t remain vertical anymore. This may result in significant alteration of the convective patterns. The Froude number quantifies the ratio of centrifugal acceleration to gravitational acceleration (Homsy & Hudson, 1971). It is common to assume in large scale geophysical flows even though centrifugal acceleration may play a role at smaller scales. For example, Earth’s atmosphere experiences at most near the equator but centrifugal forces can play an important role in generating tornadoes. Here, for the purpose of mimicking the large-scale dynamics of the Earth’s TC, we shall keep the effect of centrifugal acceleration as small as possible in LEE2. DNS studies of rotating convection in CSIIW (Horn & Aurnou, 2018, 2019) showed that the transition to centrifugally dominated flow occurs at . We vary the rotation rate between 0 and 60 rpm, yielding between 3.5 10-6 and 4.2 10-5. In this range, remains between 0.002 and 0.3, which is lower than . Table 1 provides the values of the non-dimensional control parameters of our system, along with those of previous experiments involving TCs (Aurnou, 2007; Aujogue et al., 2018) and the Earth’s core (Schubert & Soderlund, 2011). Since the friction at the TC boundary can be expected to be lower than at a no slip wall but higher than at a free-slip boundary, is rescaled with the critical Rayleigh numbers for the onset of wall-mode convection with both no-slip and free-slip walls, respectively and (Zhang & Liao, 2009; Liao et al., 2006; Chang et al., 2006) as well as for plane layer convection (Chandrasekhar, 1961): this yields the levels of criticality, which are better measures of the intensity of the thermal forcing in rotating convection than alone (Julien et al., 2012). A large range of values of is explored in this study, covering around four orders of magnitude in , summarised in table 2, along with all achieved values of the control parameters.
4 Regimes of rotating convection based on velocity fields
We first seek to identify the different regimes of convection encountered in our setup. Following Julien et al. (2012), we use the Reduced Rayleigh number as the main control parameter on the basis that flows with comparable values of obtained for different values of and display qualitatively similar topologies even though detailed properties such as the dominating lengthscale may differ. We identify changes in the flow topology as increases. In particular, we shall seek how these regimes map to the regimes of convection in a CSIIW reviewed in introduction and how they differ. To help establish the correspondence between the topological changes and the known regimes of rotating convection in a CSIIW, we also analyse the force balance based on the velocity measurements corresponding to the snapshots of z-vorticity across 5 planes spanning the TC’s height. Figures 5a to 5d illustrate the development of convective patterns through snapshots obtained for , and figures 7a to 7d for criticality between . Videos are available as supplementary material for each of these cases.
4.1 Force Balance
We start by analysing the global force balance based on our velocity measurements, so as to obtain a first appraisal of the boundaries between rotation-dominated, rotation-influence and buoyancy-dominated regimes, before we identify the specific states of convection within them. The non-dimensional Navier–Stokes and mass conservation equations in the Boussinesq approximation are
| (5) | |||||
| (6) |
Here, velocity , temperature , pressure and time are the non-dimensional quantities normalized using the height above the heater (), the free-fall velocity () and . The pressure gradient is normalised by to reflect the quasi-geostrophic balance of rapidly rotating flows. Since our PIV system only provides access to the horizontal velocity components , We calculate the horizontal component of the inertial, viscous and Coriolis forces. Following Aguirre Guzmán et al. (2021), all forces are renormalised by the Coriolis force, so in non-dimensional form, these are expressed as:
| (7) | |||||
| (8) | |||||
| (9) |
The global magnitude of these forces shall be estimated from their average in time and over each horizontal plane inside the TC of their local Euclidian norm:
| (10) |
where stands for (inertial force), (viscous force), or (Coriolis force), and stands for time average over the acquisition time. Since the PIV does not provide access to the vertical velocity component, nor the temperature field, there are few caveats in how these terms are evaluated. First, the inertial force is missing the term. By virtue of mass conservation, however, it is expected to be of the same order of magnitude as . Second, we do not have access to the temperature field either. Hence, we cannot evaluate the buoyancy directly. Since however, the buoyancy force is perpendicular to the Coriolis force, as long as the Oberbeck-Boussinesq approximation remains valid (Spiegel & Veronis, 1960; Gray & Giorgini, 1976), it is the ratio of inertia to the Coriolis force alone that measures whether the flow is buoyancy- or rotation-dominated, or anything in-between.
The norms of the inertial, viscous and Coriolis forces at heights and are shown in figure 4a. A very similar nature of the force balance is observed in LEE2 compared to the rapidly rotating convection in a plane layer with no-slip upper and lower walls and periodic lateral boundary conditions at studied numerically by Aguirre Guzmán et al. (2021). The inertial and viscous forces remains several orders of magnitude below the Coriolis force in the subcritical regime (figure 4a), i.e. for . At around , there is a crossover between these two forces, with inertial force dominating the viscous force at higher . This crossover, however, occurs at lower criticality compared to the plane layer where the cross over occurs at (Aguirre Guzmán et al., 2021). Bearing in mind that our estimate for the inertial forces misses one term, this difference is still significant and may suggest a difference in the nature of the convection around the crossover point between the TC and the plane layer geometries: we shall further probe into this feature using the instantaneous vorticity fields in section 4.3. Since, however, inertia always remains well below the Coriolis force, even up to , the convection is always at least rotation-influenced, and never buoyancy-dominated.
To validate these estimates and quantify how the convective Rossby number reflects them, we now measure the role of rotation from these forces using the local Rossby number as the ratio of the inertial to Coriolis forces , following Aguirre Guzmán et al. (2021). The variations of with are shown on figure 4b. First, reaches at most across all , suggesting that the convection is strongly rotationally constrained across all regimes (figure 4b) and that a buoyancy-dominated regime is probably not reached, even at the highest levels of supercriticality we have investigated (). The rotational constraint is especially strong as the values of are lower than those in the plane layer for a similar range of criticality (see figure 3b in Aguirre Guzmán et al. (2021)), perhaps as a result of the slightly higher Prandtl number we are considering (6.4 v.s. 5). Despite this difference, the variations of with follow a very similar pattern to that observed in plane layer rapidly rotating convection by Aguirre Guzmán et al. (2021): follows a scaling of for (figure 4b). This scaling is indicative of a Viscous-Archimedean-Coriolis force balance (VAC) (King et al., 2013), which, unlike Aguirre Guzmán et al. (2021), we could not capture from the analysis of individual forces, for lack of a precise measure of the buoyancy force, especially at low . From , the variations of are closer to , similar to the findings of Aguirre Guzmán et al. (2021), who found a crossover between the two scalings around . Hence, inertia becomes larger than viscous forces at half the criticality in LEE2 than in the plane layer.
To summarize, the force balance analysis informs us that the convection we investigate up to is always rotation-dominated or at least rotation-influenced, never buoyancy-dominated. At low criticality we reach the regime where viscous force dominates inertial force and and at higher criticality inertial force dominates over viscous force and . In the plane layer rotating convection these scalings reflected the presence of cellular and columnar structures () and plumes (). We shall now identify and characterize the regimes the underpin these scalings in LEE2, using time-resolved velocity fields.
4.2 Subcritical regime,
In the subcritical regime, illustrated by a snapshot at on figure 5a, the vorticity signal inside the TC is close to noise level, i.e. typically an order of magnitude lower than the vorticity outside the TC, and nearly two orders of magnitude lower than inside the TC for . This means that within the precision of our measurements, we cannot detect convection inside the TC. This is consistent with the subcritical regime inside a CSIIW with one very important difference: we see no evidence of wall modes along the inside boundary of the TC, even in regimes far beyond their theoretical onset for a cylinder with either solid or free-slip side walls (Zhang & Liao, 2009): on figure 5a). While wall modes are normally fainter and set in at higher thermal forcing with free-slip than with no-slip boundary conditions (Zhang & Liao, 2009), they are very resilient to changes at the cylinder boundaries (Ecke & Shishkina, 2023; Favier & Knobloch, 2020). They may be partially suppressed local thermally conducting inserts at a cylindrical wall (Ecke & Shishkina, 2023) or totally suppressed by thin fins of thickness protruding from flat walls (Terrien et al., 2023). By contrast with these studies, the presence of the TC very efficiently suppresses wall modes.
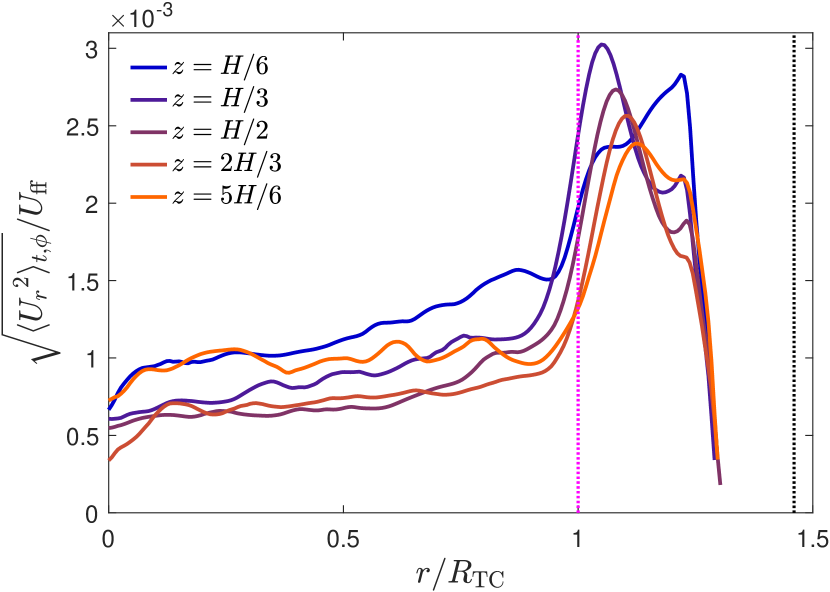
Furthermore, the absence of wall modes inside LEE2’s TC, which is embedded inside a cylindrical vessel of slightly larger diameter concurs to the results obtained in LEE1’s TC, which had a similar aspect ratio, but was embedded inside a hemispherical vessel (Aujogue et al., 2018). The main difference between the hemispherical and the cylindrical vessels in LEE1 and LEE2 is the much higher level of baroclinicity incurred by the proximity of the vertical cold outer wall next to the TC in LEE2. Because of it, a base toroidal flow always exists outside the TC region in LEE2, regardless how low the thermal forcing. This is visible on the time- and azimuthally averaged radial profiles of radial velocities on figure 6. Vortices exist in this region outside the TC in the subcritical regime (figure 5a).
These vortices are similar to the rim instability observed earlier in a TC embedded in a hemispherical vessel (Aurnou, 2007). As the baroclinicity in our set-up is highest near the top corner of the cylinder, these vortices are the strongest near the top plane at and almost no trace of them subsists in the lowest PIV plane (figure 5a, ). Furthermore, these vortices are also mainly anticyclonic and do not exhibit the classical alternating pattern of cyclonic-anticyclonic vortices of wall modes. These differences suggest that these vortices are not the wall-modes associated to the solid outer wall of the vessel, but may instead result from the instability of the baroclinically-driven flow in that region. The sharp contrast in dynamics between the region inside and the region outside the TC illustrates that for the regimes of low Ekman numbers we consider, the TPC acts as a solid mechanical boundary separating these two regions in the subcritical regime.
4.3 Rotation-dominated regime
Just above the theoretical onset of planar convection, at and (figures 5b and 5c), we observe patterns characteristic of quasi-geostrophic convection (King & Aurnou, 2012) inside the TC:
4.3.1 Cellular regime
At , vorticity contours in the five PIV planes reveal columnar vortices, that are mostly steady. This can be inferred from the position of patterns in the different planes, which are recorded successively at over 10 min interval, but still remains mostly identical. The typical size of these vortices is consistent with the onset lengthscale of plane rotating Rayleigh-Bénard convection (Chandrasekhar, 1961), shown as inset for for (figure 5b). This also sits within the range found in the previous section. Therefore, this regime corresponds to the classical cellular regime of rotating convection (Kunnen, 2021).
The vorticity in each structure changes sign between the top and bottom of the cylinder indicating a progressive reversal of rotation along the cylinder axis, approximately symmetric about the middle plane (figures 5b).
This reversal is related to the change of sign of the horizontal velocity divergence corresponding to flow entering or leaving the columns through horizontal planes. Each of these helical structures is surrounded by a sheath of opposite vorticity where the recirculations associated to the horizontal divergence close up (Veronis, 1959). These structures are identical to those observed in rotating Rayleigh-Bénard convection (RRBC) in CSIIW in rectangular periodic boundary conditions (Julien et al., 2012; Kunnen, 2021; Ecke & Shishkina, 2023). In the region near the inner TC boundary, however, the pattern tends to be suppressed. This phenomenon is common in CSIIW (Zhong et al., 1993) and is usually attributed to two intertwined phenomenona: first, curved solid walls suppress the columns where they cross the lattice. Second, strong wall modes may develop that supersede columns within lattice (Horn & Schmid, 2017). In LEE2, however, wall modes are not present, and the suppression is not equally effective along the height of the cylinder: the cells are strongly suppressed in the upper two planes where baroclinicity in the region outside the TC is strongest. By contrast, the suppression near the inner TC boundary is less effective in the bottom two planes where baroclinicity is weaker. The middle plane exhibits the faintest pattern everywhere in the TC since it captures the point where the vorticity changes sign. These differences suggest that here again, the baroclinically-driven flow in the region outside the cylinder may result in the flow near the inner side of the TC boundary being suppressed.
Inspection of the region outside the TC brings further support to this hypothesis. At the top plane (), the anticyclonic vortices observed in the subcritical regimes have become larger and more intense. They are separated by layers of cyclonic vorticity and both of them extend radially into a region closer to the outer vessel solid wall (although our PIV system cannot catch the close vicinity of that wall). These structures are less pronounced as decreases and give way to faint, smaller structures in the bottom two planes ( and ).
In summary, the intensity of the vortices outside the TC increases with baroclinicity and the suppression of the convective columns near the inner TC wall is more pronounced where these vortices are more intense. Hence, whether directly or indirectly, baroclinicity is responsible for the suppression of the flow inside the TC boundary, even though the TPC still imposes a sharp boundary between these regions.
4.3.2 Convective Taylor columns
At , columns inside the TC are still identifiable, with the same individual features as at but they are no longer static (Sakai, 1997). They evolve in a chaotic way, evidenced by their different positions in all five planes. This corresponds to the regime of convective Taylor columns identified by several authors (Julien et al., 1996, 2012; Kunnen, 2021; Ecke & Shishkina, 2023). Unlike in the cellular regime, the flow near the inner boundary of the TC is no longer suppressed in the upper two planes ( and ). The reason may be traced to the presence of thin vorticity filaments crossing the TC boundary there, and linking up to larger structures inside the TC that touch its boundary. This indicates a local breakdown of the TPC allowing a radial flow through the TC boundary. Indeed, the vortices in the region outside the TC now evolve more chaotically than at . The higher value of the global Rossby number , and the fact that these vortices carry the highest level of vorticity in the top plane suggest that their higher inertia allows them to break the TPC there to induce these local jets. The phenomenon is less pronounced at , and does not seem to generate enough inertia to break the TPC in these lower planes ().
4.3.3 Plumes and disrupted columns
At , and even more so at (figure 7a), vorticity snapshots exhibit the signature of thermal plumes found in several numerical studies at slightly higher levels of criticality ( for in the numerical work of Aguirre Guzmán et al. (2021)): Almost circular spots of intense anticyclonic (resp. cyclonic) vorticity are visible in the bottom plane at , (resp. top plane at ), but these are practically absent in the mid-plane, suggesting that they do not extend over the entire cylinder height anymore. Hence the columns are now disrupted and give way to plumes.
Unlike earlier studies with either adiabatic or periodic boundary conditions at their side boundary, inertia induced by baroclinicity at LEE2’s TC boundary is mostly responsible for the disruption of the columns: at , the jets induced by the baroclinically driven vortices outside the TC penetrate well deep into the TC in the top plane, leaving only a few plumes undisturbed near its centre. This phenomenon is even more pronounced at . At , there is no trace of the plumes in any of the four top planes where baroclinicity is strongest, but a few remain in the bottom plane where it is weakest. In the top two planes, jets crossing the TC boundary have grown to the point where they connect the inside of the TC to the outer vessel cold wall outside the TC, and so effectively spread the upward heat flux to the upper part of the side wall boundary. Whilst most obvious in the top two planes at , this effect takes place in all but the bottom one at , thereby considerably increasing the effectiveness of heat transfer between the two cases.
Accordingly, the TPC is clearly violated in 4 of the 5 PIV planes at , with structures straddling the TC boundary in all four planes and similar levels of vorticty on either side of it. Only at the lowest plane does the TC boundary separate the intense convective plumes within the TC from levels of vorticity an order of magnitude smaller outside it. At , vorticity levels are balanced either side of the TC boundary in all planes but only a few weak jets straddle it in the lower plane, where the TPC remains locally influential.
As for plane layer rotating convection at (Aguirre Guzmán et al., 2021), the transition from convective Taylor columns to plumes occurs when inertia becomes dominant over viscous forces, at the transition between regimes where and where , albeit at a lower criticality. Hence, the convective states underlying these two scaling regimes are qualitatively the same in both cases but differ in two ways: First, the breakup of the TC boundary in the upper region is due to baroclinicity outside the TC locally enhances inertia inside the TC. Second, the simulations by Aguirre Guzmán et al. (2021) are conducted at a slightly lower Prandtl number than our experiments. It is unclear, however whether this difference is significant, and if it is, lower Prandtl numbers rather favour higher flow velocities, which translates into higher inertia in horizontal planes (Abbate & Aurnou, 2023). Hence baroclinically-induced inertia at the TC boundary is the more likely explanation as to why the transition to plumes occurs at lower criticality in the TC than in the plane layer.
4.4 Turbulence and large scales in the rotation-influenced regime
For , no clear trace of plumes are left and all four planes show small-scale vorticity fluctuations down to the level of resolution of our PIV (figures 7c, d). The finer scales are more visible in the upper and lower planes at and , indicating that they are clearly three-dimensional. At the other end of the spectrum of lengthscales, larger patches of vorticity appear. While the successive recordings in the different planes do not permit to conclude whether these patches extend across the entire height, their number between 2 and 4 is consistent between the planes. Their horizontal structure resembles the large scale vortices observed at the transition between the rotation-dominated and rotation-influenced regime in classical RRBC (Aguirre Guzmán et al., 2021). This is also consistent with the regime of still strong rotational constraint in which they exist. Indeed, the force balance in section 4.1 shows that even at the Coriolis force largerly dominates the inertial force (), which is expected for the large-scale vortices (LSV) or geostrophic turbulence (Aguirre Guzmán et al., 2021). However, in the absence of an estimate of the the pressure force , we cannot check whether and are in still in balance as would be expected within a geostrophic regime. Additionally, the snapshot at suggests that the formation of these large structures may be driven by the reduced number of strong vorticity sheets extending from the vessel cold walls through the TC boundary up to the centre of the TC.
Further work would be necessary to verify whether these states indeed correspond to geostrophic turbulence and whether these structures are indeed the LSV predicted by Aguirre Guzmán et al. (2021). Nevertheless, it is undeniable that such large-scale structures and the fine-structure turbulence observed at are usually observed at higher criticality ( in Aguirre Guzmán et al. (2021)). Hence the breakup of the TPC at the TC boundary induced by baroclinicity seems to favour transition to turbulent regimes and the appearance of large structures at much lower criticality than in classical rotating Rayleigh-Bénard Convection. We shall seek further indications of this effect in the heat transfer signature of these regimes.
5 Heat Transfer Scalings
Having now identified the states of convection in the TC, it appears that although they map to the traditional states found in a cylinder with solid, adiabatic boundaries, barocliniticy near the TC boundary introduces features of these regimes and the transition between them that are specific to the TC geometry. These are particularly noticeable on the flow topology near the TC boundary, where the baroclinic flow either suppresses convective patterns there, or induces inertia that can break the TPC. The question is now how these specific features translate into the heat flux carried by the convection. Hence, in this section, we examine their signature on the traditional axial heat flux measured by by means of three quantities classically used in RRBC: first we analyse how the heat flux is related to the criticality, second we seek how the heat flux normalised by the non-rotating heat flux changes when the rotational effects measured by the Rossby number are varied, and lastly we examine the signature of the TC features on the diffusivity-free scalings.
5.1 vs. laws
Temperatures recorded simultaneously with the velocity enable us to quantify heat transfer by means of the classical Nusselt number which represents the ratio of the heat flux to the conductive heat flux,
| (11) |
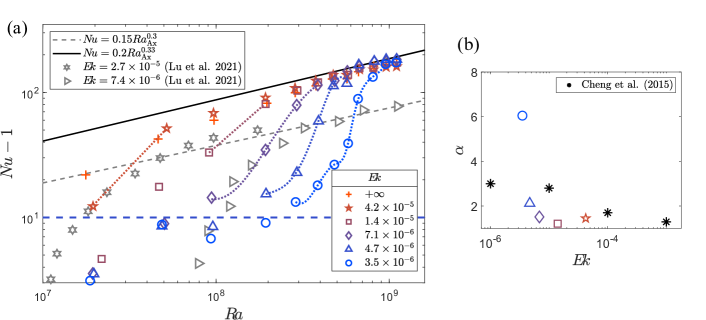
The dimensional heat flux is calculated as the electrical power supplied to the resistance inside the heating element. Therefore it represents the ‘total heat’ transferred across the entire convection cell. The variations of with are reported in figure 8. Here, the purely convective heat flux is reported along the y-axis. In the high limit, the heat transfer becomes independent of the rotation (i.e. of ) and follows the buoyancy-dominated scaling of the form . This regime is only reached for the highest thermal forcings, even though the still low values of the Rossby number for these cases () indicates a strong rotational constraint: this suggest that a significant part the heat flux is carried by flow structures that are less rotationally constrained, such as those unduced by baroclinicity near the TC boundaries that break the TPC there.
For lower values, the Nusselt number follows different scalings for different . The exponents in these scalings are obtained by calculating the slope at the inflection points in the vs. curves (figure 8). The slope is the highest for the lowest . In a CSIIW, the rapid rise in from the conduction value is attributed to the nonlinear growth from onset within the quasi-geostrophic regime where rotation dominates (Ecke & Shishkina, 2023). This tendency is recovered in LEE2, with values of the exponent consistent with those for cylinder with solid outer wall, albeit slightly higher.
The most noticeable difference with plane layers and CSIIW, takes place in the subcritical regime: In CSIIW, wall modes are present (Zhong et al., 1991; Ecke et al., 2022). Their contribution to heat transport incurs a moderate increase of the Nusselt number in this regime, typically (Rossby, 1969; Zhong et al., 1993). Therefore, experiments in CSIIW commonly shows a sharp increase in values from the conduction case () once the onset for bulk-mode convection is reached, with relatively limited effect of wall-mode driven heat transfer in this regime (Cheng et al., 2015, 2018). In LEE2 by contrast, we observe a much enhanced heat transfer in the subcritical regime, with up to around 10. This is visible left of the inflection point in figure 8. While no wall modes are present in the TC’s subcritical regimes, the torroidal baroclinically-driven flow just outside the cylinder destabilises into a ring of vortices (figure 5a). Such vortices were also observed by Aurnou (2007), who noted their helical nature, and associated them to a ‘rim instability’. They were found to distribute the heat in the interior and exterior of the TC. The presence of baroclinic instability has also been observed in other tangent cylinder-like geometries (Jacobs & Ivey, 1998; Cui & Street, 2001). Both the base baroclinic flow and the vortices occurring as the result of the rim instability feature a strong convective motion capable of efficiently transporting heat. Hence, we argue that the increased value of in the subcritical regime in LEE2, compared to the values in CSIIW, results from the baroclinically-driven flow near the TC boundary.
5.2 Relative Heat flux vs.
The convective Rossby number is classically used to identify and characterize different regimes of rotating convection (Zhong et al., 2009; Aurnou et al., 2020; Ecke & Shishkina, 2023). For cylinders with solid adiabatic boundaries, the rotation-dominated regime appears for , the buoyancy-dominated regime for , and the rotation-affected regime for (Ecke & Shishkina, 2023). To probe the regime change, is normalized by the non-rotating value . For , this ratio exhibits an enhancement of heat transfer by up to 30 in the rotation-affected region in the form of an overshoot of reaching up to around 1.3 (Zhong et al., 2009). This enhancement is generally associated with the Ekman pumping (Hart et al., 2002; Kunnen et al., 2006; Zhong et al., 2009). In LEE2, the regime we obtain by plotting vs. reveal the same three regimes, but with important differences with the case of CSIIW (figure 9). First, there is a distinct plateau in the bottom-left side of the graph that corresponds to the subcritical regime (), where remains around 0.18. In CSIIW, the moderate heat transfer due to wall-modes in the subcritical regime yields very low values of , that are usually not even shown on such plots (Zhong et al., 2009; Ecke & Shishkina, 2023). For LEE2, by contrast, this constant value of the in the subcritical regime is due to the barocilinicity present in the system, which drives a significant flow even when the bulk convection is negligible (see section 4.2).
The transition from the subcritical to rotation-dominated regime occurs at around , where we see a sharp increase in the Nusselt number for all rotation rates (figure 9). There is a good agreement in this regime between data for the CSIIW (Zhong et al., 2009) and LEE2, with an overshoot in the value of up to around 1.2. For CSIIW, the transition from rotation-dominated to rotation affected occurs once starts to decrease from its maximum value, and the rotation affected region continues until it reaches the asymptotic value of 1 (Kunnen, 2021). We see a significant difference in this regime compared to that of CSIIW. For CSIIW, the rotation-affected regime expands up to . In LEE2, is reached at a much lower compared to CSIIW, especially for low , i.e. faster rotation. For , is reached at around (, figure 7d), whereas for , it occurs at around (, figure 7a). These values are significantly lower than Weiss et al. (2010)’s prediction for the bifurcation point at the end of the heat transfer enhancement regime, for either the TC’s aspect ratio or that of the outer vessel. Both of these transition values are marked in figure 9. On the one hand, the decreasing values of the overshoot at lower are consistent with expectations in RRBC (Zhong et al., 2009); These stem from the suppression of Ekman pumping in the limit. On the other hand, the seemingly early transition to the value is also consistent with the velocity fields observation, where we saw that due to baroclinicity, there is a presence of disrupted columns at around (section 4.3.3) which eventually leads to geostrophic turbulence with large structures at lower than for CSIIW or plane layers (section 4.4). Futures upgrades to LEE2 aiming at higher thermal forcing at high rotation may enable to differentiate these two effects in the future.
5.3 Diffusivity-free scalings
At high thermal forcing, the heat transfer is controlled by the bulk flow where turbulence dominates (Brito et al., 2004) and becomes independent of viscous and thermal diffusivities. The question raises whether turbulence reaches this “ultimate state”.
Scaling laws based on diffusivity-free parameters (Christensen, 2002; Christensen & Aubert, 2006) are obtained by normalising the temperature difference and heat flux by diffusivity-free quantities. In rotating convection, normalising these quantities without using diffusivities implies that the Rayleigh number is replaced by the modified flux Rayleigh number, , and the Nusselt number is replaced by the modified Nusselt number, defined as
| (12) | |||||
| (13) |
Aurnou (2007) and Cheng & Aurnou (2016) showed that scalings in these variables of the form are related to scalings of the form through . In this sense the diffusivity-free parameters contain the same physics as the classical one, but their value lies in how they tend to collapse data into single curves, for different rotation parameters. The graph of vs. (figure 10) indeed collapses into a single curve, and does so all the more precisely as is high, which indicates independence of diffusivities. There are three distinct regions along that curve. For , (figure 10). In this scaling, , hence , effectively cancels out which reflects a regime of diffusivity-free, buoyancy-dominated convection often interpreted as one of the necessary signatures to identify the ultimate regime of convective turbulence in classical Rayleigh-Bénard configurations. This scaling is similar to the one obtained by Bouillaut et al. (2021) for in a rotating cylinder where the fluid was heated radiatively directly in the bulk so as to “bypass” the diffusion in the boundary layers. Aurnou & Olson (2001) obtained this scaling too, albeit at a much higher for rotating-convection in CSIIW using liquid metal as the working fluid. These differences with LEE2 hint that this scaling may not necessarily reflect the classical state of ultimate turbulent convection in LEEs, especially so as in LEE2, baroclinicity creates an additional source of buoyancy in LEE2 not present in any of these experiments. We shall come back to this point in section 6.1 with the insight of how much of the heat flux escapes radially vs. axially.
In the range , the data is closest to the scaling of . There are two known scalings close to this value: Aurnou (2007) argues that the common scaling is indicative of a rapidly rotating regime and Christensen (2002) arrived at the same scaling for with the same interpretation, using numerical simulations in a spherical shell geometry at . This suggests that this scaling is a property ot the rotating convection that is robust to changes in geometry. Bouillaut et al. (2021) obtained the scaling too and argue, as others, that it is the signature of geostrophic turbulence (Hanasoge et al., 2012; Aurnou et al., 2020). In LEE2, this interpretation is consistent with the other measures of heat transfer ( and ) presented in this section as well as with the intense turbulence observed in the velocity fields in a high rotational constraint in section 4.
For , we observe , similar to as obtained for the buoyancy-dominated regime however with a different pre-factor (figure 10). These low values of correspond to the data points in the subcritical flow regime, where heat transfer is enhance by the baroclinically-driven flow. In this sense, they are buoyancy-dominated and so explain the rotation-independent scaling .
6 A measure of the Taylor-Proudman constraint at the TC boundary
Until now, we have characterised the convection inside the TC. We found how the succession of regimes therein was progressively altered by the baroclinicity outside the TC as the rotational constraint at the TC boundary becomes looser under the effect of the inertia it induces. What now remains to understand is the nature of the thermal and kinematic boundary conditions at the TC boundary in these different regimes.
6.1 Axial and Radial heat transfer
We start with the thermal aspects. Since it is not currently possible to directly measure the heat flux at the TC boundary in LEE2, we use the temperature difference between the heater and the inner surface of the side wall as proxy: Since the temperature at the side wall is not part of the heater’s control loop (unlike the temperature difference between the inner surface of the top wall and the heater, which is kept constant), it measures directly the amount of heat transported radially for an imposed axial temperature difference. Since the side of the heater is thermally insulating, any increase in temperature at the side wall can only result from a heat flux through the TC boundary. Given the presence of baroclinic flow outside the TC, however, the heat may potentially cross the TC boundary anywhere along the TC, and be subsequently transported to the location of the sensor by this flow. Hence, gives a measure of the global heat flux across the TC boundary.
The axial and radial temperature differences inside the cylinder are shown in figure 11. Plotting the dimensional, measured temperature differences without normalizing (figures 11a, b) shows that for , the radial temperature difference is higher than the axial temperature difference (), indicating that the heat flux is preferentially axial. This effect is all the more pronounced as the rotation is fast: Hence, despite the radial transport due to the baroclinic flow outside the TC, the confinement imposed at the TC boundary tends to channel the heat flux axially. The fact that grows all the fastest with as rotation is fast confirms this phenomenology: at higher rotation, axial heat transfer is impeded and the regulation must raise the heater temperature higher at higher to keep to the set value. The rapid rise in with indicates that the inner temperature of the outer side wall remains low as the heater temperature increases. Hence heat does not accumulate outside the TC, because the TC boundary suppresses the radial heat flux much more efficiently than rotation suppresses the axial heat flux inside the TC.
The variations of the ratios of the radial to axial temperature differences, with and (figures 11c, d) highlight how this phenomenology is affected by the flow regimes. There is a sharp transition of at (figure 11c). For , remains below suggesting a greater radial than axial heat transfer.
In the subcritical regime (), this is attributed to the significant effect of the baroclinicity at low criticality leading to enhanced transfer across the TC, while axial heat transfer is purely conductive, hence very low. This confirms our previous conclusion that the higher values of (measured by the heater power) in the TC configuration, compared to CSIIW with adiabatic side walls, is due to radial heat transfer by the baroclinic flow outside the TC. For , the radial temperature difference remains smaller than the axial temperature difference, so the axial heat flux remains comparatively low in the cellular regime. For , however, there is a distinct dependence in the variations of : For low , there is an overshoot in the values of this ratio before it reaches a plateau at a value around 1.2. This overshoot corresponds to the regime of convective Taylor columns. It reaches a maximum of around 1.6 for the fastest rotation, at . This high value of the ratio suggests that the Taylor-Proudman constraint, which is still well enforced along most of the TC boundary, efficiently suppresses the radial heat transfer while at the same time, the columns favour axial heat transfer. Again, the increasing value of the overshoot with rotation speaks in favour of this phenomenology. For the slowest rotation, , no such overshoot is observed. This suggest that even though the TC constraint is not strong enough to block the radial heat flux in the columnar regime, despite the relatively low value of .
Past the overshoot the ratio decreases towards a value of around 1.2 at (figure 11c) and (figure 11d). All curves for different follow “shingles” rejoining a curve where the plots at different collapse reasonably well: This collapsed curve starts with a steep decrease, followed by a transition to a plateau at around and . The steeper part of the curve correspond to the geostrophic regime where with diffusivity-free scaling , whereas the plateau part of the curve (up to ) spans the transition to the non-rotating diffusivity-free scaling . The case at the lower rotation at reaches further into this latter regime, where the ratio further decreases. In this regime the TPC is broken so the radial heat flux is less and less suppressed. The radial transport by the baroclinic flow becomes sufficiently efficient to homogenize the temperature along the upper and the side wall, leading to decrease towards 1. Hence, it is likely that the non-rotating diffusivity-free scaling at high reflects the heat transfer due to the baroclinic flow, rather than a transition to the ultimate regime of buoyancy-dominated convection within the TC. This is consistent with the still high rotational constraint in this regime, evidenced by the low values of in the region of 0.2.
6.2 Velocities across the TC boundary
After investigating the radial and axial heat transfer, the radial and azimuthal velocities at the TC boundary are studied. This is carried out by using the time and azimuthal averaged radial and azimuthal velocity intensities at the TC, i.e . In practice, these quantities are averaged over all PIV points within the range , and plotted against on figure 12. There is a trade-off between the higher statistical convergence of data obtained over a thicker radial range and capturing points located further away from the TC boundary, that are less constrained by the TPC. Because of it, the ratio of rms radial to azimuthal velocity does not converge to zero but to a low, finite value in the limit where the TPC is fully enforced (i.e. when ).
In the subcritical regime (), the rms radial velocities remain very low, compared to their azimuthal counterparts as / in all five PIV planes along the cylinder height, as shown on figure 12. Hence the TPC imposes that the baroclinic flow outside the TC is confined outside it, and mainly does not cross it. The TPC is progressively broken by inertia in the cellular and Taylor Column regime () as there is an increase in the ratio /, reaching around 0.5. However, this first happens at higher because of stronger baroclinicity near the upper wall. This was also seen in the vorticity snapshots in figures 5c and 5d. For , at the convection remains largely inside the TC and little interaction between the inside and outside of TC takes place. However, at , there is a significant flow outside the TC as well as vorticity sheets clearly straddling the TC boundary and linking the regions inside and outside the TC. At higher , in the plumes and disrupted columns regime (), the ratio / reaches a saturation around 0.8. There still exists a similar -dependence in the breakdown of the TP constraint values with . This is consistent with the vorticity snapshots in figures 7a and 7b. For , in the geostrophic turbulence regime, / remains around 0.8 and with no significant dependency on the is observed. There is no significant -dependence on /, either suggesting that the TP constraint is broken along the entire cylinder height.
The variations of / confirm and quantify the progressive breakup of the TPC at the TC boundary observed in the vorticity snapshot. The main result here, is that even though the flow remains strongly rotationally constrained throughout the regimes investigated up to (), the TPC starts breaking up locally as early as until the TC boundary becomes pervasive to momentum over its entire height at .
7 Discussion
The regimes of rotating convection in a Tangent Cylinder (TC) were identified using time-resolved velocity measurements for a criticality varying in the range . Cross-analysing the averaged force balance in 5 horizontal planes with the topology of the axial vorticity field showed that convection in the TC follows broadly the same sequence of regimes as those of observed in plane layers or cylindrical vessels with impermeable, thermally insulating walls, when increasing criticality: first a subcritical regime without bulk convection below the predicted onset of plane Rotating RBC, then a cellular regime, then convective Taylor columns, plumes, followed by geostrophic turbulence, potentially with Large-Scale Vortices. The values of the effective Rossby number based on the measured ratio of inertial to Coriolis forces show that even near , the turbulent convection was still rotation-dominated. Hence the buoyancy-dominated regime observed in other studies at higher criticality was never reached. The similarity with plane layers and CSIIW was reflected in the heat transfer associated to these regimes showing a sharp increase in the ratio of the Nusselt number to the non-rotating Nusselt number around to overshoot values above 1 followed by a progressive decrease to 1.
There were, however, significant differences, some potentially crucial for our understanding of the convection in the Earth’s outer core. All of these differences stem from the high level of baroclinicity near the vertical cold outer wall next to the TC and the additional inertia it provides to the TC.
First, below the onset of bulk convection, in the subcritical regime, wall-modes, generally observed in CSIIW were absent. The suppression of walls modes continued into the supercritical regime where, unlike in TC within a hemispherical geometry with less baroclinicity, they were not observed either (Aujogue et al., 2018). The baroclinic convection outside the TC leads to an increased intensity in heat transfer in the subcritical regime compared to a wall-mode-driven flow taking place in CSIIW.
Second, inertia due to the baroclinic flow incurs a local breakdown of the TP constraint in the columnar regime near the top of the TC. At higher criticality, in plumes and disrupted columns regime, the TP constraint is further violated over almost the entire height of the cylinder (except near the heater). At, , no trace of plumes is observed and the flow enters the geostrophic turbulence regime, from which large structures emerge. Consistent with velocity fields, the heat transfer follows a diffusivity-free scaling of , which is another signature of the geostrophic turbulence regime. Hence, baroclinically-driven inertia triggers transition to the geostrophic turbulence regime at much lower criticality than in CSIIW or plane layers (). This suggests that a TC geometry may offer an easier pathway to the geostrophic turbulence regime in rotating-convection, that tends to be elusive in experiments. The question of the nature of the large scale flow structures observed in this regime remains however open: in particular, more work is needed to find out whether these correspond to the Large Scale Vortices identified in numerical simulations by Aguirre Guzmán et al. (2021).
Finally, at the highest criticalities, diffusivity-free heat transfer follows the same scaling as in the ultimate regime of non-rotating convective turbulence. Here, however, the flow is still rotationally constrained within the TC and the scaling is indicative of heat transfer by the baroclinically-driven convection, that becomes at least comparable to the axial heat transfer by Rotating Rayleigh-Bénard convection within the TC.
These results highlight several mechanisms to help us understand the role of the TC boundary in the Earth’s outer core. The main process is the progressive breakup of the TPC due to the inertia of the flow outside the TC. In LEE2, inertia is driven by the baroclinicity due to the isothermal boundary condition at the side wall of the vessel located close to the TC boundary itself. Although no such boundary exists in the Earth core, the presence of geostrophic columns driven by radial convection in the outer core plays a similar role: by virtue of the quasi-geostrophy there, the convection driven by the radial temperature gradient in the equatorial region drives inertia all along the entire TC boundary. Since, in this region, these structures are aligned with the Earth’s rotation and not with the thermal gradient between the CMB and the ICB, they produce baroclinicity too, which also drives fluid motion and adds up to the inertia in this region. The main point is that important inertia is present just outside the TC boundary both in LEE2 and in Earth’s the outer, even though it is generated by different mechanisms. Regardless how inertia is generated, provides a measure of its effect on the flow dynamics inside the TC. In this respect, the low values of , in the range in the regime of geostrophic turbulence are higher but consistent with the values expected for the Earth’s core, for criticalities in the range also consistent with estimates for the Earth’s core. In this sense the level of inertia and thermal forcing in LEE2 are representative of the Earth, albeit for much slower rotation (). This phenomenology therefore shows that even under strong rotational constraint, inertia driven outside the TC may still break the TPC at the scale of the TC to the point where the practically no part of the TC boundary acts as a solid boundary anymore. The thermally insulating and the impermeable character of the TC boundary both break down at much lower criticality. Hence, these results show that despite the very strong rotational constraint near the TC boundary, inertia outside the Earth’s TC alone is sufficient to prevent it from behaving like a solid, thermally insulating boundary. This is indeed consistent with the behavior of the main gyre wrapped around the TC. As an illustration of this process, Finlay et al. (2023) infer two possible flow patterns near the TC boundary depending on whether the TPC is broken or not: one where impinging flows are deflected along the TC boundary to form jets, and one where these flows cross the TC boundary. Figure 13 indeed shows the striking resemblance between these authors’ simplified representation of these patterns and the flow patterns observed in LEE2 in cases where the TPC breaks up near the top boundary but still holds near the heater, at .
Another interesting aspect of our results, from the perspective of the Earth’s core concerns the emergence of large flow structures within the TC. At this stage, much remains to be understood regarding their nature and their origin, and this shall be the subject of future work with LEE2. However, it is rather clear from previous studies that such structures would only appear in well-developed geostrophic turbulence (Aguirre Guzmán et al., 2021). Such regimes have proved elusive in classical convection experiments using cylindrical vessels. The additional inertia provided outside the TC and acting inside it as the TPC breaks up, however, favours the occurrence of this regime at lower forcing. Since the same ingredients are present in the Earth’s outer core, it is possible that large scales are produced in the vicinity of the TC at moderate criticality, through a similar process. We saw that such vortices start straddling the TC boundary at criticalities as low as , i.e. within the range expected for the Earth’s TC. While in LEE2, they are confined there by the solid vessel wall close to the TC, the looser confinement imposed by the hemispherical shape of the CMB would allow them a wider range of action, consistent with the location of the large patches of magnetic field observed in geomagnetic data Finlay et al. (2023).
One of the main difficulties in assessing what rotating convection experiment tell us about it the Earth arises out assessing the effect of the Earth’s magnetic field, especially on lengthscales (Cardin & Olson, 1994; Shew & Lathrop, 2005; Horn & Aurnou, 2022, 2023; Pothérat & Horn, 2024). We wish to finish this study by offering a few thoughts on how the processes outlined in this discussion may be affected by it. Studies of MHD turbulence and MHD convection in plane layers, cylindrical or rectangular vessels bounded by solid walls give us some ideas of how the dipolar magnetic field in the TC affects the convection and the turbulence therein (Sommeria & Moreau, 1982; Pothérat & Klein, 2014; Horn & Aurnou, 2023; Baker et al., 2018): In these configurations, MHD turbulence tends to favour the emergence of large scales through nonlinear energy transfer and through scale-selective dissipation (Kolesnikov & Tsinober, 1974; Eckert et al., 2001; Pothérat & Kornet, 2015; Baker et al., 2018; Pothérat & Klein, 2017). This may offer an alternative mechanism for the generation of large structures in the TC, but it is not clear how the two mechanisms would coexist or compete. For example, even though background rotation and magnetic fields individually promote two-dimensional velocity fields, the combination of both may promote a three-dimensional one! (Cao et al., 2018; Pothérat et al., 2024).
In rotating magneto-convection, the onset instability that feeds the turbulence may favour large scales too, when the Coriolis and Lorentz force are of comparable order of magnitude, relatively close to onset and at (Chandrasekhar, 1961; Eltayeb, 1975; Aujogue et al., 2015; Horn & Aurnou, 2022). At the lower of the Earth’s outer core, oscillatory modes alter the picture significantly, so it is not currently clear how the dipolar magnetic field influences the size of the larger scales at Earth-like criticalities (Horn & Aurnou, 2023).
The magnetic field also alters the constraint at the TC boundary in several ways: First, Magneto-Coriolis Waves provide a macroscopic mechanism for breaking the classical TPC that is consistent with the large-scale shape of the gyre wrapped around the TC (Gillet et al., 2010; Finlay et al., 2023), but does not necessarily explain its smaller scale meandering in and out of it (Gillet et al., 2022). Second, the time-averaged component of the magnetic field imposes a Magnetic Taylor-Proudman Constraint (MTPC), instead of the classical TC. This constraint may drive a large scale meridional flow through the TC boundary controlled by the morphology of the azimuthal flow there (Pothérat et al., 2024). This too provides an alternative mechanism for breaking the classical TPC at the TC boundary. The MTPC however relies on the same line of reasoning as the TPC, except that it applies to the combined Lorentz and Coliolis forces instead of the Coriolis force only. Hence, it is reasonable to expect that sufficiently strong local buoyancy-driven inertia would break the MTPC near the TC boundary in the same way as it breaks the TPC in non-magnetic LEE2.
ACKNOWLEDGMENTS
The authors are grateful to Professor Susanne Horn for sharing her expertise of Rotating Convection during numerous discussions on the interpretation of the results. This work was sponsored by Research Project Grant RPG-017-421 from the Leverhulme Trust.
Data availability
The data that support the findings of this study are available from the corresponding author upon reasonable request.
References
- Abbate & Aurnou (2023) Abbate, J. A. & Aurnou, J. M., 2023. Rotating convective turbulence in moderate to high Prandtl number fluids, Geophys. Astrophys. Fluid Dyn., 117(6), 397–436.
- Aguirre Guzmán et al. (2021) Aguirre Guzmán, A. J., Madonia, M., Cheng, J. S., Ostilla-Mónico, R., Clercx, H. J., & Kunnen, R. P., 2021. Force balance in rapidly rotating Rayleigh–Bénard convection, J. Fluid Mech., 928, A16.
- Ahlers et al. (2009) Ahlers, G., Grossmann, S., & Lohse, D., 2009. Heat transfer and large scale dynamics in turbulent Rayleigh-Bénard convection, Rev. Mod. Phys., 81(2), 503–537.
- Aujogue et al. (2015) Aujogue, K., Pothérat, A., & Sreenivasan, B., 2015. Onset of plane layer magnetoconvection at low Ekman number, Phys. Fluids, 27(10), 106602.
- Aujogue et al. (2016) Aujogue, K., Pothérat, A., Bates, I., Debray, F., & Sreenivasan, B., 2016. Little Earth Experiment: An instrument to model planetary cores, Rev. Sci. Instrum., 87(8).
- Aujogue et al. (2018) Aujogue, K., Pothérat, A., Sreenivasan, B., & Debray, F., 2018. Experimental study of the convection in a rotating tangent cylinder, J. Fluid Mech., 843, 355–381.
- Aurnou (2007) Aurnou, J., 2007. Planetary core dynamics and convective heat transfer scaling, Geophys. Astrophys. Fluid Dyn., 101.5-6, 327–345.
- Aurnou & Olson (2001) Aurnou, J. & Olson, P., 2001. Experiments on Rayleigh–Bénard convection, magnetoconvection and rotating magnetoconvection in liquid gallium, J. Fluid Mech., 430, 283–307.
- Aurnou et al. (2003) Aurnou, J., Andreadis, S., Zhu, L., & Olson, P., 2003. Experiments on convection in Earth’s core tangent cylinder, Earth Planet. Sci. Lett., 212(1-2), 119–134.
- Aurnou et al. (2020) Aurnou, J. M., Horn, S., & Julien, K., 2020. Connections between nonrotating, slowly rotating, and rapidly rotating turbulent convection transport scalings, Phys. Rev. Res., 2, 043115.
- Baker et al. (2018) Baker, N., Pothérat, A., Davoust, L., & Debray, F., 2018. Inverse and direct energy cascades in three-dimensional magnetohydrodynamic turbulence at low magnetic Reynolds number, Phys. Rev. Lett., 120, 224502.
- Bouillaut et al. (2021) Bouillaut, V., Miquel, B., Julien, K., Aumaître, S., & Gallet, B., 2021. Experimental observation of the geostrophic turbulence regime of rapidly rotating convection, Proc. Natl. Acad. Sci., 118(44), e2105015118.
- Brito et al. (2004) Brito, D., Aurnou, J., & Cardin, P., 2004. Turbulent viscosity measurements relevant to planetary core-mantle dynamics, Phys. Earth Planet. Int., 141, 3–8.
- Busse (1970) Busse, F. H., 1970. Thermal instabilities in rapidly rotating systems, J. Fluid Mech., 44(3), 441–460.
- Cao et al. (2018) Cao, H., Yadav, R. K., & Aurnou, J. M., 2018. Geomagnetic polar minima do not arise from steady meridional circulation, Proc. Natl. Acad. Sci., 115(44), 11186–11191.
- Cardin & Olson (1992) Cardin, P. & Olson, P., 1992. An experimental approach to thermochemical convection in the Earth’s core, Geophys. Res. Lett., 19(20), 1995–1998.
- Cardin & Olson (1994) Cardin, P. & Olson, P., 1994. Chaotic thermal convection in a rapidly rotating spherical shell: consequences for flow in the outer core, Phys. Earth Planet. Inter., 82(3-4), 235–259.
- Cardin & Olson (2015) Cardin, P. & Olson, P., 2015. 8.13 - experiments on core dynamics, in Treatise on Geophysics (Second Edition), pp. 317–339, ed. Schubert, G., Elsevier, Oxford, second edition edn.
- Chandrasekhar (1961) Chandrasekhar, 1961. Hydrodynamic and Hydromagnetic Stability, Clarendon.
- Chang et al. (2006) Chang, Y., Liao, X., & Zhang, K., 2006. Convection in rotating annular channels heated from below. Part 2. Transitions from steady flow to turbulence, Geophys. Astrophys. Fluid Dyn., 100(3), 215–241.
- Cheng & Aurnou (2016) Cheng, J. & Aurnou, J., 2016. Tests of diffusion-free scaling behaviors in numerical dynamo datasets, Phys. Earth Planet. Int, 436, 121–129.
- Cheng et al. (2015) Cheng, J. S., Stellmach, S., Ribeiro, A., Grannan, A., King, E. M., & Aurnou, J. M., 2015. Laboratory-numerical models of rapidly rotating convection in planetary cores, Geophys. J. Int., 201(1), 1–17.
- Cheng et al. (2018) Cheng, J. S., Aurnou, J. M., Julien, K., & Kunnen, R. P., 2018. A heuristic framework for next-generation models of geostrophic convective turbulence, Geophys. Astrophys. Fluid Dyn., 112.4, 277–300.
- Cheng et al. (2020) Cheng, J. S., Madonia, M., Aguirre Guzmán, A. J., & Kunnen, R. P., 2020. Laboratory exploration of heat transfer regimes in rapidly rotating turbulent convection, Phys. Rev. Fluids, 5(11), 113501.
- Christensen (2002) Christensen, U., 2002. Zonal flow driven by strongly supercritical convection in rotating spherical shells, J. Fluid Mech., 470, 115–133.
- Christensen & Aubert (2006) Christensen, U. & Aubert, J., 2006. Scaling properties of convection-driven dynamos in rotating spherical shells and application to planetary magnetic fields, Geophys. J. Int., 166.1, 97–114.
- Cui & Street (2001) Cui, A. & Street, R., 2001. Large-eddy simulation of turbulent rotating convective flow development, J. Fluid Mech., 447, 53–84.
- Ecke & Shishkina (2023) Ecke, R. & Shishkina, O., 2023. Turbulent rotating Rayleigh–Bénard convection, Annu. Rev. Fluid Mech., 55, 603–638.
- Ecke et al. (2022) Ecke, R. E., Zhang, X., & Shishkina, O., 2022. Connecting wall modes and boundary zonal flows in rotating Rayleigh-Bénard convection, Phys. Rev. Fluids, 7(1), L011501.
- Eckert et al. (2001) Eckert, S., Gerbeth, G., Witke, W., & Langenbrunner, H., 2001. MHD Turbulence Measurements in a Sodium Channel Exposed to a Transverse Magnetic Field, Int. J. Heat Fluid Flow, (22), 358–364.
- Eltayeb (1975) Eltayeb, I., 1975. Overstable hydromagnetic convection in a rotating fluid layer, J. Fluid Mech., 71(01), 161–179.
- Favier & Knobloch (2020) Favier, B. & Knobloch, E., 2020. Robust wall states in rapidly rotating Rayleigh–Bénard convection, J. Fluid Mech., 895, R1.
- Finlay et al. (2023) Finlay, C., Gillet, N., Aubert, J., Livermore, P., & Jault, D., 2023. Gyres, jets and waves in the Earth’s core, Nat. Rev. Earth Environ., 4, 377–392.
- Gillet et al. (2010) Gillet, N., Jault, D., Canet, E., & Fournier, A., 2010. Fast torsional waves and strong magnetic field within the earth’s core, Nature, 465, 74–77.
- Gillet et al. (2015) Gillet, N., Jault, D., & Finlay, C., 2015. Planetary gyre, time-dependent eddies, torsional waves, and equatorial jets at the Earth’s core surface, J. Geophys. Res. Solid Earth, 120(6), 3991–4013.
- Gillet et al. (2019) Gillet, N., Huder, L., & Aubert, J., 2019. A reduced stochastic model of core surface dynamics based on geodynamo simulations, Geophys. J. Int., 219(1), 522–539.
- Gillet et al. (2022) Gillet, N., Gerick, F., Jault, D., Schwaiger, T., Aubert, J., & Istas, M., 2022. Satellite magnetic data reveal interannual waves in Earth’s core, Proc. Natl. Acad. Sci., 119(13), e2115258119.
- Goldstein et al. (1993) Goldstein, H., Knobloch, E., Mercader, I., & Net, M., 1993. Convection in a rotating cylinder, Part 1 Linear theory for moderate Prandtl numbers, J. Fluid Mech., 248, 583–604.
- Gray & Giorgini (1976) Gray, D. D. & Giorgini, A., 1976. The validity of the boussinesq approximation for liquids and gases, Int. J. Heat Mass Transf., 19(5), 545–551.
- Greenspan (1969) Greenspan, H. P., 1969. The theory of rotating fluids, Cambridge University Press.
- Gubbins & Emilio (2007) Gubbins, D. & Emilio, H., 2007. Encyclopedia of geomagnetism and paleomagnetism, Springer Science & Business Media.
- Hanasoge et al. (2012) Hanasoge, S. M., Duvall Jr, T. L., & Sreenivasan, K. R., 2012. Anomalously weak solar convection, Proc. Natl. Acad. Sci., 109(30), 11 928–11932.
- Hart et al. (2002) Hart, J., Kittelman, S., & Ohlsen, D., 2002. Mean flow precession and temperature probability density functions in turbulent rotating convection, Phys. Fluids, 14(3), 955–962.
- Homsy & Hudson (1971) Homsy, G. & Hudson, J., 1971. Centrifugal convection and its effect on the asymptotic stability of a bounded rotating fluid heated from below, J. Fluid Mech., 48.3, 605–624.
- Horn & Aurnou (2018) Horn, S. & Aurnou, J., 2018. Regimes of Coriolis-centrifugal convection, Phys. Rev. Lett., 120(20), 204502.
- Horn & Aurnou (2019) Horn, S. & Aurnou, J., 2019. Rotating convection with centrifugal buoyancy: numerical predictions for laboratory experiments, Phys. Rev. Fluids, 4(7), 073501.
- Horn & Aurnou (2023) Horn, S. & Aurnou, J., 2023. The Elbert range of rotating magnetoconvection II: comparison between linear theory and turbulent DNS, under consideration for publication in Proc. Roy. Soc. A.
- Horn & Aurnou (2022) Horn, S. & Aurnou, J. M., 2022. The Elbert range of magnetostrophic convection. I. linear theory, Proc. R. Soc. A., p. 47820220313.20220313.
- Horn & Schmid (2017) Horn, S. & Schmid, P., 2017. Prograde, retrograde, and oscillatory modes in rotating Rayleigh-Bénard convection, J. Fluid Mech., 831, 182–211.
- Hotta (2018) Hotta, H., 2018. Breaking Taylor-Proudman balance by magnetic fields in stellar convection zones, Astrophys. J. Lett., 860(2), L24.
- Jacobs & Ivey (1998) Jacobs, P. & Ivey, G., 1998. Large-eddy simulation of turbulent rotating convective flow development, J. Fluid Mech., 369, 23–48.
- Julien et al. (1996) Julien, K., Legg, S., McWilliams, J., & Werne, J., 1996. Rapidly rotating turbulent Rayleigh-Bénard convection, J. Fluid Mech., 322, 243–273.
- Julien et al. (2012) Julien, K., Rubio, A. M., Grooms, I., & Knobloch, E., 2012. Statistical and physical balances in low Rossby number Rayleigh–Bénard convection, Geophys. Astrophys. Fluid Dyn., 106(4-5), 392–428.
- King & Aurnou (2012) King, E. & Aurnou, J., 2012. Thermal evidence for Taylor columns in turbulent rotating Rayleigh-Bénard convection, Phys. Rev. E, 85(1), 016313.
- King et al. (2013) King, E., Stellmach, S., & Buffett, B., 2013. Scaling behaviour in Rayleigh–Bénard convection with and without rotation, J. Fluid Mech., 717, 449–471.
- Kolesnikov & Tsinober (1974) Kolesnikov, Y. B. & Tsinober, A. B., 1974. Experimental investigation of two-dimensional turbulence behind a grid, Fluid Dyn., 9(4), 621–624.
- Kono & Roberts (2002) Kono, M. & Roberts, P., 2002. Recent geodynamo simulations and observations of the geomagnetic field, Rev. G eophys., 40(4), 4–1.
- Kunnen et al. (2006) Kunnen, R., Clercx, H., & Geurts, B., 2006. Heat flux intensification by vortical flow localization in rotating convection, Phys. Rev. E, 74(5), 056306.
- Kunnen (2021) Kunnen, R. P., 2021. The geostrophic regime of rapidly rotating turbulent convection, J. Turbul., 22(4-5), 267–296.
- Kunnen et al. (2011) Kunnen, R. P., Stevens, R. J., Overkamp, J., Sun, C., van Heijst, G. F., & Clercx, H. J., 2011. The role of Stewartson and Ekman layers in turbulent rotating Rayleigh–Bénard convection, J. Fluid Mech., 688, 422–442.
- Liao et al. (2006) Liao, X., Zhang, K., & Chang, Y., 2006. On boundary-layer convection in a rotating fluid layer, J. Fluid Mech., 549, 375–384.
- Liu & Ecke (2009) Liu, Y. & Ecke, R., 2009. Heat transport measurements in turbulent rotating Rayleigh-Bénard convection, Phys. Rev. E, 80, 036314.
- Livermore et al. (2017) Livermore, P. W., Hollerbach, R., & Finlay, C. C., 2017. An accelerating high-latitude jet in Earth’s core, Nat. Geosci., 10(1), 62–68.
- Lu et al. (2021) Lu, H.-Y., Ding, G.-Y., Shi, J.-Q., Xia, K.-Q., Zhong, J.-Q., et al., 2021. Heat-transport scaling and transition in geostrophic rotating convection with varying aspect ratio, Phys. Rev. Fluids, 6(7), L071501.
- Ning & Ecke (1993) Ning, L. & Ecke, R. E., 1993. Rotating Rayleigh-Bénard convection: Aspect-ratio dependence of the initial bifurcations, Phys. Rev. E, 47(5), 3326.
- Noto et al. (2019) Noto, D., Tasaka, Y., Yanagisawa, T., & Murai, Y., 2019. Horizontal diffusive motion of columnar vortices in rotating Rayleigh–Bénard convection, J. Fluid Mech., 871, 401–426.
- Olson (2011) Olson, P., 2011. Laboratory experiments on the dynamics of the core, Phys. Earth Planet. Inter., 187(3-4), 139–156.
- Olson (2013) Olson, P., 2013. Experimental dynamos and the dynamics of planetary cores, Annu. Rev. Earth Planet. Sci., 41, 153–181.
- Pais & Jault (2008) Pais, M. & Jault, D., 2008. Quasi-geostrophic flows responsible for the secular variation of the Earth’s magnetic field, Geophys. J. Int., 173(2), 421–443.
- Pais et al. (2014) Pais, M. A., Morozova, A. L., & Schaeffer, N., 2014. Variability modes in core flows inverted from geomagnetic field models, Geophys. J. Int., 200(1), 402–420.
- Pothérat & Horn (2024) Pothérat, A. & Horn, S., 2024. Experimental models of rotating convection in planetary interiors, C. R. Phys., special issue on ”Geophysical and Astophysical Dynamics in the Laboratory”, p. under consideration.
- Pothérat & Klein (2014) Pothérat, A. & Klein, R., 2014. Why, how and when MHD turbulence at low becomes three-dimensional, J. Fluid Mech., 761, 168–205.
- Pothérat & Klein (2017) Pothérat, A. & Klein, R., 2017. Do magnetic fields enhance turbulence at low magnetic Reynolds number?, Phys. Rev. Fluids, 2(6), 063702.
- Pothérat & Kornet (2015) Pothérat, A. & Kornet, K., 2015. The decay of wall-bounded MHD turbulence at low , J. Fluid Mech., 783, 605–636.
- Pothérat et al. (2024) Pothérat, A., Aujogue, K., & Debray, F., 2024. Magnetic Taylor-Proudman constraint explains the flow into Tangent Cylinders, Phys. Rev. Lett, in press, arXiv:2312.08840.
- Proudman (1916) Proudman, J., 1916. On the motion of solids in a liquid possessing vorticity, Proc. R. Soc. Lond. A, 92(642), 408 – 424.
- Rossby (1969) Rossby, H., 1969. A study of Bénard convection with and without rotation, J. Fluid Mech., 36(2), 309–335.
- Sahoo & Sreenivasan (2020a) Sahoo, S. & Sreenivasan, B., 2020a. Convection in a rapidly rotating cylindrical annulus with laterally varying boundary heat flux, J. Fluid Mech., 883, A1.
- Sahoo & Sreenivasan (2020b) Sahoo, S. S. & Sreenivasan, B., 2020b. Response of Earth’s magnetic field to large lower mantle heterogeneity, Earth Planet. Sci. Lett., 549, 116507.
- Sakai (1997) Sakai, S., 1997. The horizontal scale of rotating convection in the geostrophic regime, J. Fluid Mech., 333, 85–95.
- Sakuraba (2002) Sakuraba, A., 2002. Linear magnetoconvection in rotating fluid spheres permeated by a uniform axial magnetic field, Geophys. Astrophys. Fluid Dyn., 96(4), 291–318.
- Schaeffer et al. (2017) Schaeffer, N., Jault, D., Nataf, H.-C., & Fournier, A., 2017. Turbulent geodynamo simulations: a leap towards Earth’s core, Geophys. J. Int., 211(1), 1–29.
- Schubert & Soderlund (2011) Schubert, G. & Soderlund, K., 2011. Planetary magnetic fields: Observations and models, Phys. Earth Planet. Inter., 187(3), 92–108.
- Shew & Lathrop (2005) Shew, W. L. & Lathrop, D. P., 2005. Liquid sodium model of geophysical core convection, Phys. Earth Planet. Inter., 153(1-3), 136–149.
- Sommeria & Moreau (1982) Sommeria, J. & Moreau, R., 1982. Why, How and When MHD Turbulence Becomes Two-Dimensional, J. Fluid Mech., 118, 507–518.
- Spiegel & Veronis (1960) Spiegel, E. A. & Veronis, G., 1960. On the boussinesq approximation for a compressible fluid., Astrophys. J., 131, 442.
- Sprague et al. (2006) Sprague, M., Julien, K., Knobloch, E., & Werne, J., 2006. Numerical simulation of an asymptotically reduced system for rotationally constrained convection, J. Fluid Mech., 551, 141–174.
- Stellmach et al. (2014) Stellmach, S., Lischper, M., Julien, K., Vasil, G., Cheng, J. S., Ribeiro, A., King, E. M., & Aurnou, J. M., 2014. Approaching the asymptotic regime of rapidly rotating convection: boundary layers versus interior dynamics, Phys. Rev. Lett., 113(25), 254501.
- Sumita & Olson (1999) Sumita, I. & Olson, P., 1999. A laboratory model for convection in Earth’s core driven by a thermally heterogeneous mantle, Science, 286(5444), 1547–1549.
- Sumita & Olson (2002) Sumita, I. & Olson, P., 2002. Rotating thermal convection experiments in a hemispherical shell with heterogeneous boundary heat flux: Implications for the Earth’s core, J. Geophys. Res. Solid Earth, 107(B8), ETG–5.
- Taylor (1917) Taylor, G. I., 1917. Motion of solids in fluids when the flow is not irrotational, Proc. Roy. Soc. Lond. A, 93(648), 99–113.
- Terrien et al. (2023) Terrien, L., Favier, B., & Knobloch, E., 2023. Suppression of Wall Modes in Rapidly Rotating Rayleigh-Bénard Convection by Narrow Horizontal Fins, Phys. Rev. Lett., 130, 174002.
- Veronis (1959) Veronis, G., 1959. Cellular convection with finite amplitude in a rotating fluid, J. Fluid Mech., 5.3, 401–435.
- Wedi et al. (2022) Wedi, M., Moturi, V. M., Funfschilling, D., & Weiss, S., 2022. Experimental evidence for the boundary zonal flow in rotating Rayleigh–Bénard convection, J. Fluid Mech., 939.
- Weiss et al. (2010) Weiss, S., Stevens, R., Zhong, J.-Q., Clerx, H., Lohse, D., & Ahlers, G., 2010. Finite-Size Effects Lead to Supercritical Bifurcations in Turbulent Rotating Rayleigh-Bénard Convection, Phys. Rev. Lett., 105, 224501.
- Zhang & Liao (2009) Zhang, K. & Liao, X., 2009. The onset of convection in rotating circular cylinders with experimental boundary conditions, J. Fluid Mech., 622, 63–73.
- Zhong et al. (1991) Zhong, F., Ecke, R., & Steinberg, V., 1991. Asymmetric modes and the transition to vortex structures in rotating Rayleigh-Bénard convection, Phys. Rev. Lett., 67(18), 2473.
- Zhong et al. (1993) Zhong, F., Ecke, R. E., & Steinberg, V., 1993. Rotating Rayleigh–Bénard convection: asymmetric modes and vortex states, J. Fluid Mech., 249, 135–159.
- Zhong et al. (2009) Zhong, J.-Q., Stevens, R. J., Clercx, H. J., Verzicco, R., Lohse, . f. D., & Ahlers, G., 2009. Prandtl-, Rayleigh-, and Rossby-number dependence of heat transport in turbulent rotating Rayleigh-Bénard convection, Phys. Rev. Lett., 102(4), 044502.